Page 1
UNIVERSIDAD POLITÉCNICA DE MADRID
Escuela Técnica Superior de Ingenieros de
Caminos, Canales y Puertos
MECHANICAL PERFORMANCE OF HALF-WARM MIX
RECYCLED ASPHALT MIXTURES CONTAINING TOTAL RATES
OF RECLAIMED ASPHALT PAVEMENT FOR THEIR USE IN
ROAD PAVEMENTS
DOCTORAL THESIS
JOSÉ MANUEL LIZÁRRAGA LÓPEZ
Bachelor’s degree in Civil Engineering
M.Eng.’s degree in Construction Management
Madrid, 2019
Page 3
DEPARTAMENTO DE INGENIERÍA CIVIL: INGENIERIA DEL
TRANSPORTE, URBANISMO Y TERRITORIO
Escuela Técnica Superior de Ingenieros de Caminos, Canales y
Puertos
MECHANICAL PERFORMANCE OF HALF-WARM MIX
RECYCLED ASPHALT MIXTURES CONTAINING TOTAL RATES
OF RECLAIMED ASPHALT PAVEMENT FOR THEIR USE IN
ROAD PAVEMENTS
Author
JOSÉ MANUEL LIZÁRRAGA LÓPEZ
Bachelor’s degree in Civil Engineering
M.Eng.’s degree in Construction Management
Supervisor:
Juan Gallego Medina
Dr. Ingeniero de Caminos, Canales y Puertos
Madrid, 2019
Page 5
Tribunal nombrado por el Magfco. y Excmo. Sr. Rector de la Universidad Politécnica de Madrid
el día _____ de___________de 2019.
Presidente: ______________________________________________________
Vocal: _________________________________________________________
Vocal: _________________________________________________________
Vocal: _________________________________________________________
Secretario: ______________________________________________________
Suplente 1: ______________________________________________________
Suplente 2:______________________________________________________
Realizado el acto de defensa y lectura de la Tesis el día………………de………………de 2019 en la E.T.S
de Ingenieros de Caminos, Canales y Puertos de la U.P.M.
Calificación: …………………………………………
Madrid, a ______ de _____________ de 2019
EL PRESIDENTE LOS VOCALES
EL SECRETARIO
Page 7
i
DEDICATION
I would like to dedicate this thesis dissertation to my beloved parents and sisters for their never-
ceasing help, support, mercy, strength, and encouragement to achieve this long-awaited goal. I’d
like to thank for their love, for their support, patience, and, most of all, for convincing me that I
could and should take this leap forward.
Finally, I would also like to thank God for providing me health, strength, and patience to make
this dream come true.
“Every valley must be filled in, every mountain and hill leveled off; the winding roads must be
straightened, and the rough ways made smooth.”
Luke 3:5-7
Page 8
ii
ACKNOWLEDGMENTS
First of all, I would like to express my full recognition, admiration, and gratitude to my supervising
professor, Dr. Juan Gallego Medina, for his guidance, support, patience, confidence, training,
mentoring, coaching and also for helping me to make this dream come true throughout this great
journey called Life.
I would also like to express my deepest gratitude to Sacyr Construcción for the technical support
received during the development of this Ph.D. thesis at the Technical University of Madrid., since this
doctoral dissertation would not have been possible without the tremendous help, support and know-
how received in my research stage in this company.
Additionally, I simply have no words to express my acknowledgment to all of those organizations and
people who, directly or indirectly, have been able to share their valuable knowledge, information,
economic resources, and priceless time. I would also like to thank all my colleagues of the asphalt
pavement materials' research group, who supported and assisted me every single day in the laboratory
work.
Last but not least, I would like to thank my parents because this dissertation could not have been
completed without their tremendous help, support, love, and encouragement. Thank you, Dad, for your
continuous encouragement, support, and also for helping me to sharpen my life.
Also, I would like to recognize the honorable doctoral committee for their invaluable assistance, effort,
time, comments, and feedback given to me to complete this doctoral dissertation successfully.
Thanks, everyone!
Page 9
iii
ABSTRACT
Over the last few years, the use of half-warm mix asphalt (HWMA) mixtures that are manufactured
below the boiling point of water (≤100 ºC), and total recycled asphalt pavement contents equal to 100%
RAP, represent a promising engineering solution for reducing energy consumption (i.e., fuel and gas-oil),
raw materials (i.e., aggregates and binder) and greenhouse gas (GHG) emissions released into the
atmosphere during the mix production and construction (compaction and laying) process in the field.
Despite the technical, social, environmental, and economic advantages associated with this sustainable
disruptive technical solution, there remain some concerns and questions to be answered regarding durability
and long-term mechanical performance that endorse their durability and benefits as a promising technique
of sustainable development.
Therefore, a lack of suitable mix design and characterization method was identified for this recent
technology. To this end, three laboratory compaction test methods (Static compressive strength load NLT
162/00, Gyratory compactor (EN 12697-31:2013) and specimen preparation by impact compactor) were
selected and put into assessment to define and evaluate the most suitable compaction test method for half-
warm mix recycled asphalt (HWMRA) mixtures with 100% RAP. These mixtures were designed with two
emulsion contents (2.5% and 3.0%,o/RAP) with a rejuvenator with a low pen. bitumen (160/220) and 50/70
pen. grade bitumen. The characterization allowed to select the most suitable compaction test method for
the preparation and characterization of this technology and the target compaction energy to obtain and
reproduce specimens with similar volumetric characteristics (air voids and density) to those obtained in the
field after pavement construction. Posteriorly, the specimens were subjected to an accelerated curing/drying
process for three days (72 h), at 50 ºC, in a forced-draft convection oven before laboratory testing.
This doctoral dissertation aims to present the main results of the half-warm mix recycled asphalt
(HWMRA) mixtures with total recycled asphalt pavement (RAP) contents equal to 100% using a
continuous asphalt mixing plant specially designed for the production of this technology by Sacyr. To
achieve this goal, a set of in-plant samples were collected to determine the reproducibility of up-scaling the
laboratory mix design to an asphalt plant. Moreover, a sampling campaign was conducted to determine if
the wearing course asphalt mixtures meet the minimum percentage of 98% of the benchmark density after
compaction with conventional machinery.
The quality control results showed that both HWMRA mixes with 100% RAP meets the minimum
moisture damage resistance value for binder and wearing course asphalt mixtures of road pavements. Also,
the resistance to permanent deformation values of these mixes were found to be lower than 0.1 (mm/1000
load cycles), between 5000 and 10000 load cycles, and proportional rut depth (PRDAIR) below 5%; indirect
tensile strength (ITS) values above 1.7 MPa; and similar fatigue cracking resistance law of half-warm mixes
with 50/70 pen grade bitumen compared with conventional hot mix asphalt mixtures at 20 ºC.
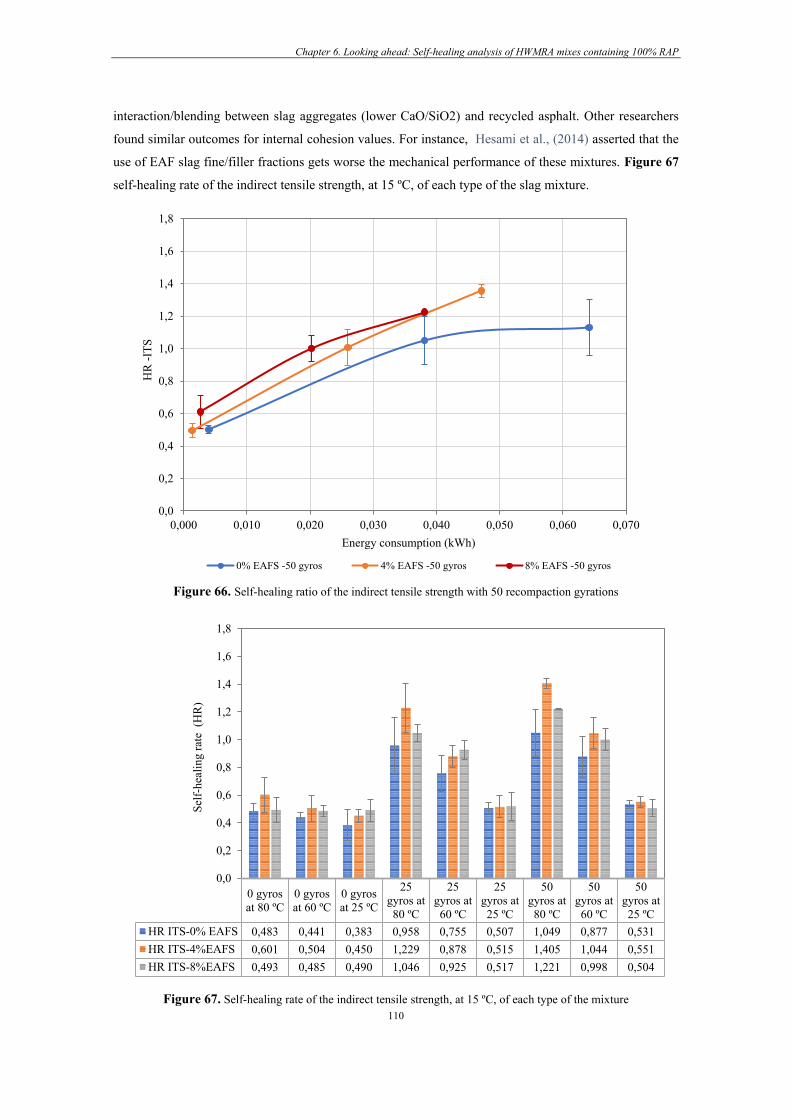
On the other hand, the self-healing ratio of half-warm mixes with three electric arc furnace steel
(EAFS) slag aggregate contents was analyzed using a thermo-mechanical treatment. In other words, a
recompaction-based mechanical method together with a microwave heating energy treatment were
Page 10
iv
conducted at the Technical University of Madrid - Department of Civil Engineering, Transport, and Urban
Planning. The results showed that the self-healing ratio of this technology after the specimens are subjected
to a vertical diametral load of 50.8 mm/min, presented a higher recovery capability of mixtures’ mechanical
performance properties (indirect tensile strength and stiffness modulus) by applying 50 recompaction
gyrations at 80 ºC.
This research has demonstrated the viability of using more competitive and sustainable engineering
solutions compared to conventional hot mix asphalt mixture, such as half-warm mix recycled asphalt
mixtures (HWMRA) mixes with a total recycled asphalt (RAP) content for their use in the binder and
wearing course asphalt mixtures of road pavements. This technology allows the possibility of recycling
mixtures with high and total RAP contents, obtaining results in terms of mechanical properties very similar
to hot mixes, which makes it possible to reduce the GHG emissions, manufacturing and compaction
temperatures and consumption of materials while improving the safety of the workers.
Page 11
v
RESUMEN
En los últimos años, la tecnología de mezclas templadas recicladas fabricadas por debajo del punto
ebullición del agua (≤100 ºC), junto con tasas de reutilización de hasta un 100% de árido reciclado,
representa una solución de gran potencial e interés para la reducción de consumo energético (fuel and gas-
oil), materias primas (áridos y betún) y emisiones contaminantes de efecto invernadero (GEI) durante el
proceso de fabricación, compactación y puesta en obra. No obstante, a pesar de las ventajas técnicas,
sociales, medioambientales y económicas, el reciclado templado con emulsión es una técnica aún en
desarrollo que requiere mayor estudio y experiencias que avalen su durabilidad y prestaciones para situarse
como una técnica de desarrollo sostenible.
En este sentido, en el estudio de las mezclas templadas con tasa total de reutilización, se ha detectado
la carencia de un procedimiento idóneo para su diseño, compactación y caracterización en laboratorio. Por
ello, se han utilizado y comparado tres métodos de compactación de probetas cilíndricas utilizados en
laboratorio, tales como (1) Compresión estática por doble émbolo NLT-162/00, (2) prensa giratoria (EN
12697-31:2013) y (3) probetas preparadas mediante compactador de impactos (12697-30:2012), empleando
para ello, diferentes energías de compactación, dos contenidos de emulsión (2.5% and 3.0%) con un ligante
con penetración relativamente alta (160/220) y otra con un ligante convencional de penetración 50/70.
Esta caracterización ha permitido determinar cuál es el sistema de compactación más idóneo, así
como la energía de compactación más apropiada para obtener probetas con un nivel de huecos en mezcla y
una densidad que sea más representativa de lo que se va a obtener y reproducir en el sitio de trabajo.
Además, las probetas fabricadas y compactadas se someterán a un periodo de curado/secado de tres días
(72 h) a 50 ºC en estufa de convección forzada, antes de proceder a la realización de ensayos, con el objeto
de evaluar el efecto de curado en las prestaciones mecánicas (resistencia a tracción indirecta y módulo) de
mezclas con emulsión.
Esta tesis doctoral tiene como objetivo presentar los resultados de la tecnología de mezclas
templadas recicladas con tasas de revalorización y reutilización del 100% y 70%, colocadas tanto en capa
de rodadura como en capa intermedia, que han sido fabricadas en una planta prototipo de fabricación
continua, especialmente diseñada para la producción de esta tecnología.
Para la consecución de este objetivo, se tomaron un conjunto de muestras tras la fabricación para
determinar la reproducibilidad de esta tecnología en planta. Además, tras la compactación y extendido de
esta tecnología, una campaña de extracción de testigos fue llevada a cabo con el objeto de verificar que se
haya alcanzado un 98% de la densidad de referencia en la capa de rodadura con equipos de compactación
convencionales. Los resultados del control de calidad indicaron que las mezclas templadas recicladas con
altas tasas de reutilización del 100% RAP cumplen con los valores mínimos de sensibilidad al agua por
encima de 85% para capas de rodadura y 80% para capas base e intermedia. Además, resistencia a la
deformación permanente por debajo de 0.1 (mm/1000 ciclos de carga), entre los 5.000 y 10.000 ciclos de
carga, profundidad media del surco (PRDAIR) por debajo del 5%; valores de cohesión en seco por encima
Page 12
vi
de 1.7 MPa; y la vida de fatiga fue algo similar a una mezcla convencional en caliente a una temperatura
de 20 ºC.
Por otro lado, se evalúo la recuperación de daño de mezclas templadas recicladas con tres tasas des
escoria de horno de arco eléctrico (0%,4% y 8% de EAFS en volumen total de la mezcla) mediante la
reutilización de un tratamiento termo-mecánico, es decir, utilizando un sistema de recompactación pionero
junto con un proceso de tratamiento de microondas desde el laboratorio de la Escuela de Caminos, Canales,
y Puertos de la Universidad Politécnica de Madrid (UPM). Los resultados mostraron que la recuperación
de daño de las mezclas templadas, tras someterse a una carga de compresión diametral vertical de 50.8
mm/min, presentaron mayores grados de recuperación en términos de resistencia a tracción indirecta (RTI)
y módulo al aplicar 50 giros de recompactación, a 80 ºC.
Esta investigación ha demostrado la viabilidad de unas mezclas más competitivas y ambientalmente
más sostenibles que las mezclas convencionales en caliente como son las mezclas templadas recicladas a
tasa total para capas de rodadura e intermedia. La tecnología de mezclas templadas nos abre la posibilidad
de poder reciclar mezclas hasta alta tasa, obteniéndose resultados en cuanto a propiedades mecánicas muy
similares a las mezclas en caliente, favoreciendo la disminución de emisiones, de temperaturas de
fabricación, compactación y de consumo de materiales, además de mejorar la seguridad de los trabajo.
Page 14
Table of contents
viii
TABLE OF CONTENT
Chapter 1 ...................................................................................................................................................... 1
INTRODUCTION ........................................................................................................................................ 1
Research backgrounds ................................................................................................................ 1
Problem Statement ...................................................................................................................... 1
Overall objectives ....................................................................................................................... 2
Particular objectives .................................................................................................................... 2
Structure of the dissertation ........................................................................................................ 3
Chapter 2 ...................................................................................................................................................... 7
2 LITERATURE REVIEW .................................................................................................................... 7
Introduction ................................................................................................................................. 7
Classification of HWMRA mixes ............................................................................................... 9
Sustainable development........................................................................................................... 11
Potential benefits and drawbacks .............................................................................................. 12
2.4.1 Economic benefits ................................................................................................................ 12
2.4.2 Environmental benefits ......................................................................................................... 13
2.4.3 Paving/compaction benefits .................................................................................................. 14
2.4.4 Production benefits ............................................................................................................... 15
2.4.5 Drawbacks ............................................................................................................................ 15
Mechanical performance characterization ................................................................................ 16
2.5.1 Water sensitivity test ............................................................................................................ 16
2.5.2 Stiffness modulus ................................................................................................................. 17
2.5.3 Resistance to permanent deformation ................................................................................... 18
2.5.4 Resistance to fatigue cracking .............................................................................................. 19
2.5.5 Resistance to low-temperature fracture ................................................................................ 20
Self-healing analysis of asphalt mixtures .................................................................................. 21
2.6.1 Laboratory and field studies ................................................................................................. 21
2.6.2 Self-healing with EAFS aggregates ...................................................................................... 22
Surface friction characteristics .................................................................................................. 24
2.7.1 Macrotexture ......................................................................................................................... 24
Page 15
Table of contents
ix
Conclusions of the literature review ......................................................................................... 25
Chapter 3 .................................................................................................................................................... 27
3 MATERIALS AND TEST PROCEDURES ..................................................................................... 27
Introduction ............................................................................................................................... 27
Materials ................................................................................................................................... 27
3.2.1 RAP characterization ............................................................................................................ 27
3.2.2 Bituminous emulsion characterization .................................................................................. 28
Residual bitumen content (from water content) ..................................................................................... 29
3.2.3 Asphalt binder characterization ............................................................................................ 29
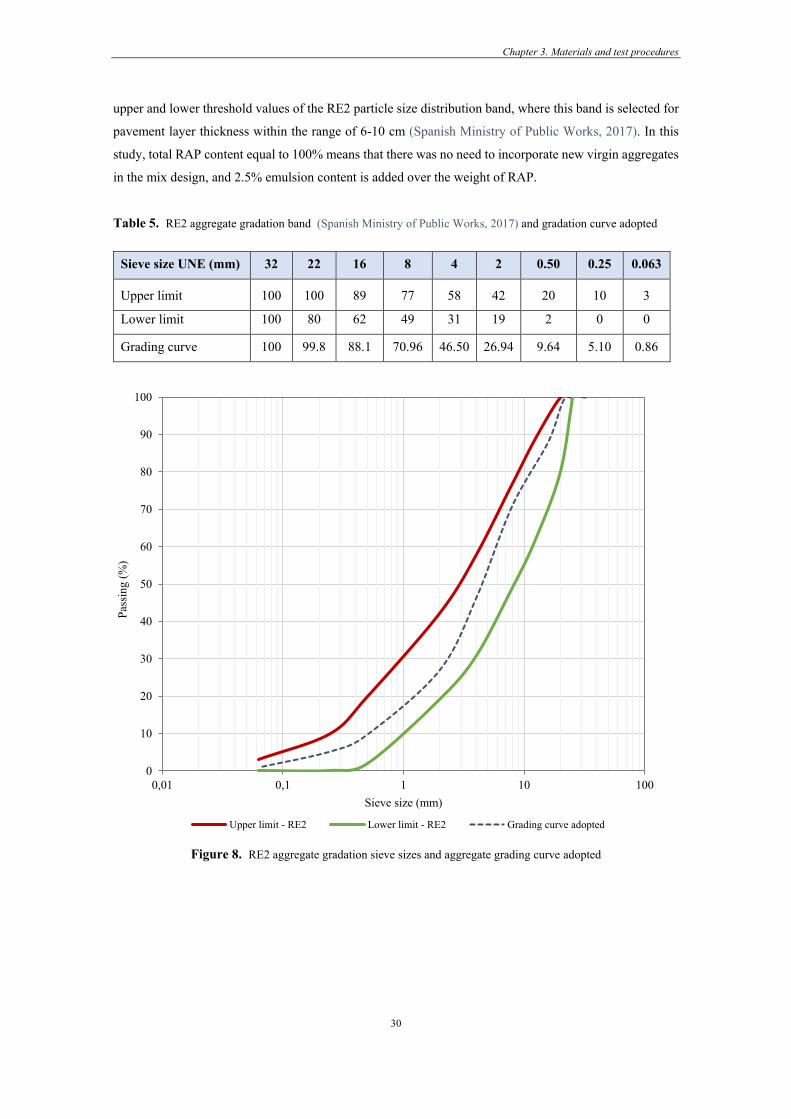
Aggregate grading curve ........................................................................................................... 29
3.3.1 HWMRA 100% RAP mixture .............................................................................................. 29
3.3.2 Conventional HMA mixture ................................................................................................. 31
Testing program ........................................................................................................................ 32
Chapter 4 .................................................................................................................................................... 33
4 METHODOLOGY ............................................................................................................................ 33
Introduction ............................................................................................................................... 33
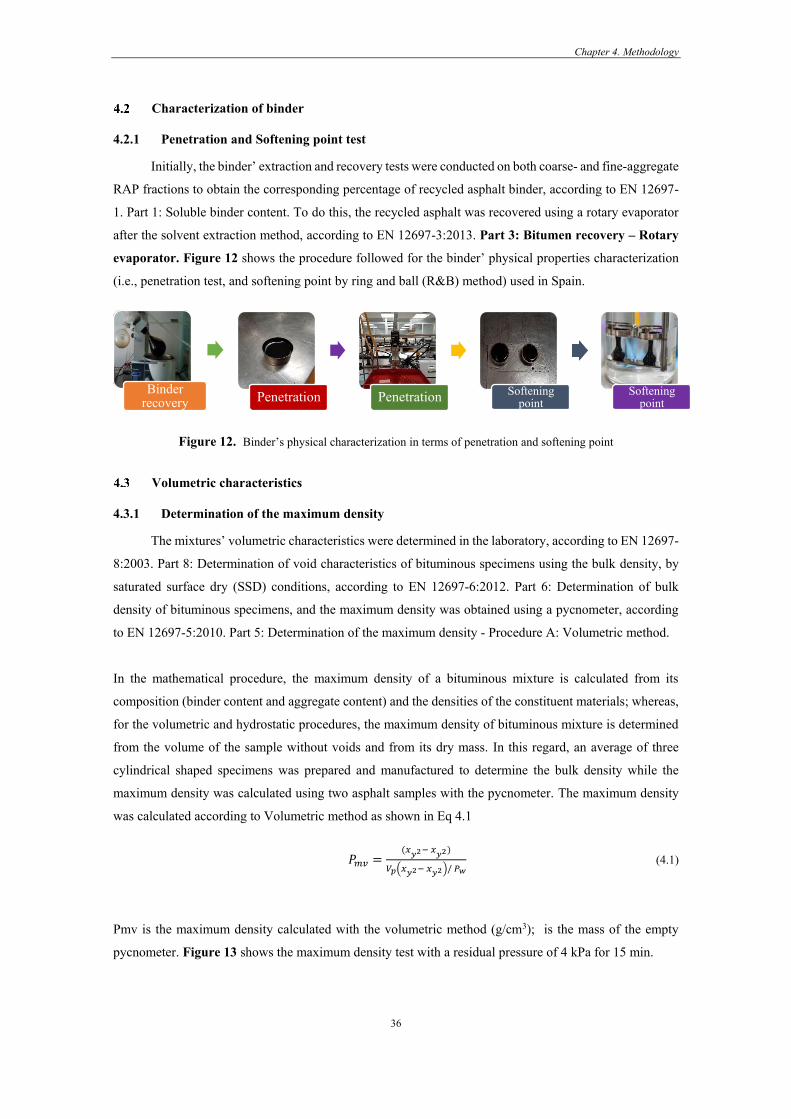
Characterization of binder ......................................................................................................... 36
4.2.1 Penetration and Softening point test ..................................................................................... 36
Volumetric characteristics ......................................................................................................... 36
4.3.1 Determination of the maximum density ............................................................................... 36
4.3.2 Determination of bulk density of bituminous specimens ...................................................... 37
4.3.3 Determination of the geometric density ................................................................................ 38
Resistance to water action ......................................................................................................... 39
4.4.1 Water sensitivity ................................................................................................................... 39
4.4.2 Immersion-Compression test ................................................................................................ 41
Advanced mechanical characterization of the mixture ............................................................. 41
4.5.1 Stiffness modulus ................................................................................................................. 41
4.5.2 Resistance to permanent deformation ................................................................................... 42
4.5.3 Four-point bending (4PB) beam fatigue test ......................................................................... 44
4.5.4 Indirect tensile fatigue test .................................................................................................... 45
Laboratory compaction study .................................................................................................... 46
Page 16
Table of contents
x
4.6.1 Marshall Impactor hammer .................................................................................................. 48
4.6.2 Static compression load by double-plunger action ............................................................... 48
4.6.3 Gyratory compaction ............................................................................................................ 49
Mixture design .......................................................................................................................... 50
4.7.1 HWMRA 100% RAP mixtures ............................................................................................ 50
4.7.2 Effect of the curing process on the mixture’ mechanical performance ................................. 51
HMA mixture (AC16 D) design ............................................................................................... 51
Description of the test road section in Lerma ........................................................................... 52
Macrotexture ............................................................................................................................. 53
International surface roughness index ....................................................................................... 54
Chapter 5 .................................................................................................................................................... 55
5 RESULTS AND DISCUSSION ........................................................................................................ 55
Laboratory compaction study results ........................................................................................ 55
5.1.1 Marshall impactor hammer ................................................................................................... 55
5.1.2 Static load by a double plunger ............................................................................................ 56
5.1.3 Gyratory compactor .............................................................................................................. 58
Mix design results ..................................................................................................................... 61
Advanced mechanical characterization of the mixture ............................................................. 63
5.3.1 Stiffness modulus and indirect tensile strength .................................................................... 63
5.3.2 Rutting test............................................................................................................................ 65
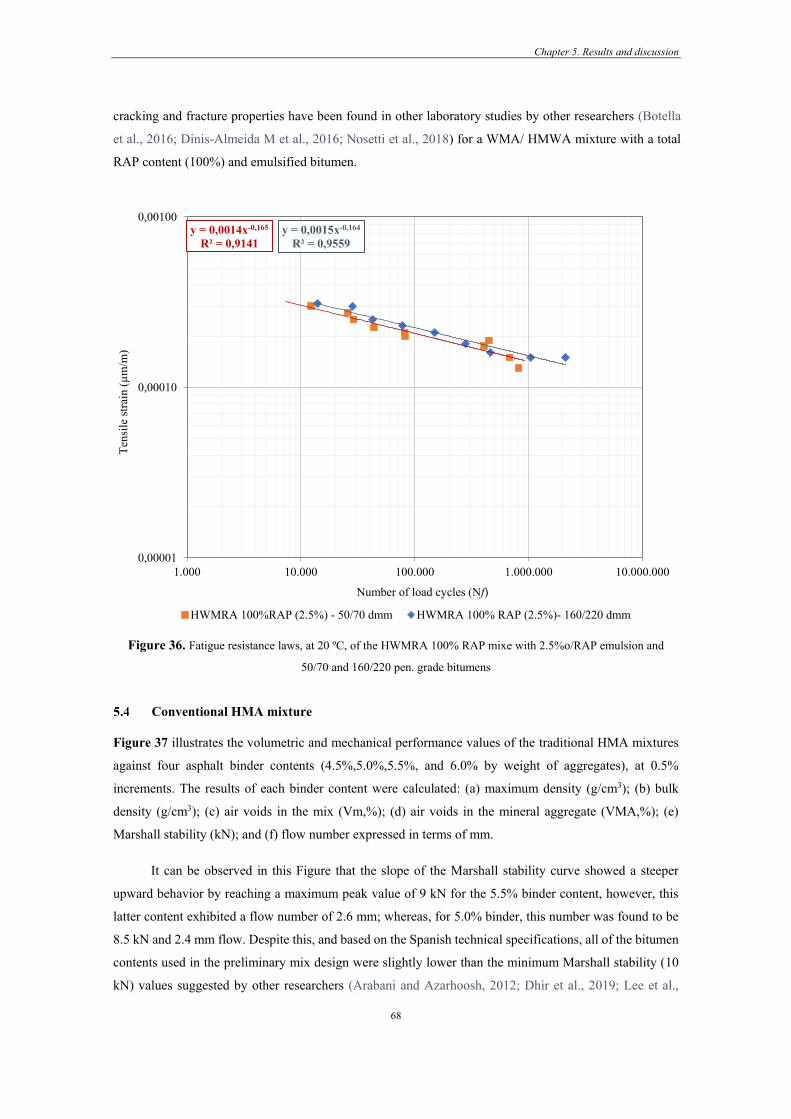
5.3.3 Fatigue resistance ................................................................................................................. 67
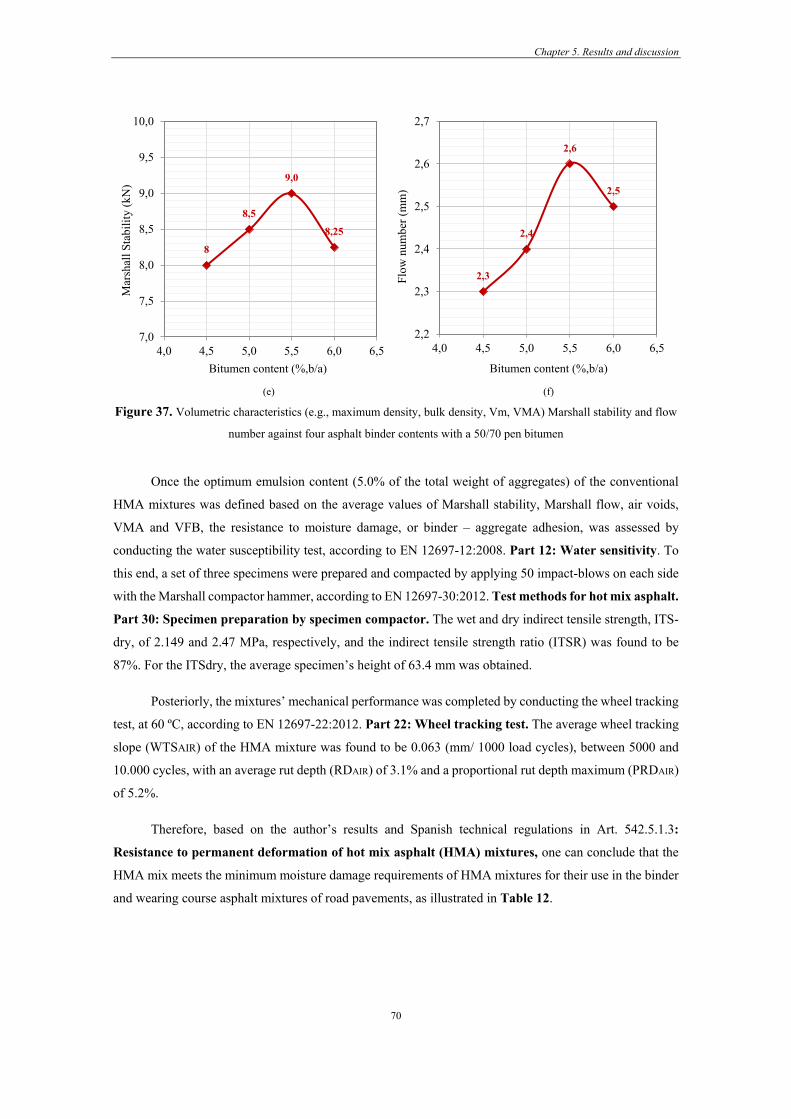
Conventional HMA mixture ..................................................................................................... 68
Quality control after in-plant manufacturing ............................................................................ 71
Benchmark density after pavement construction ...................................................................... 78
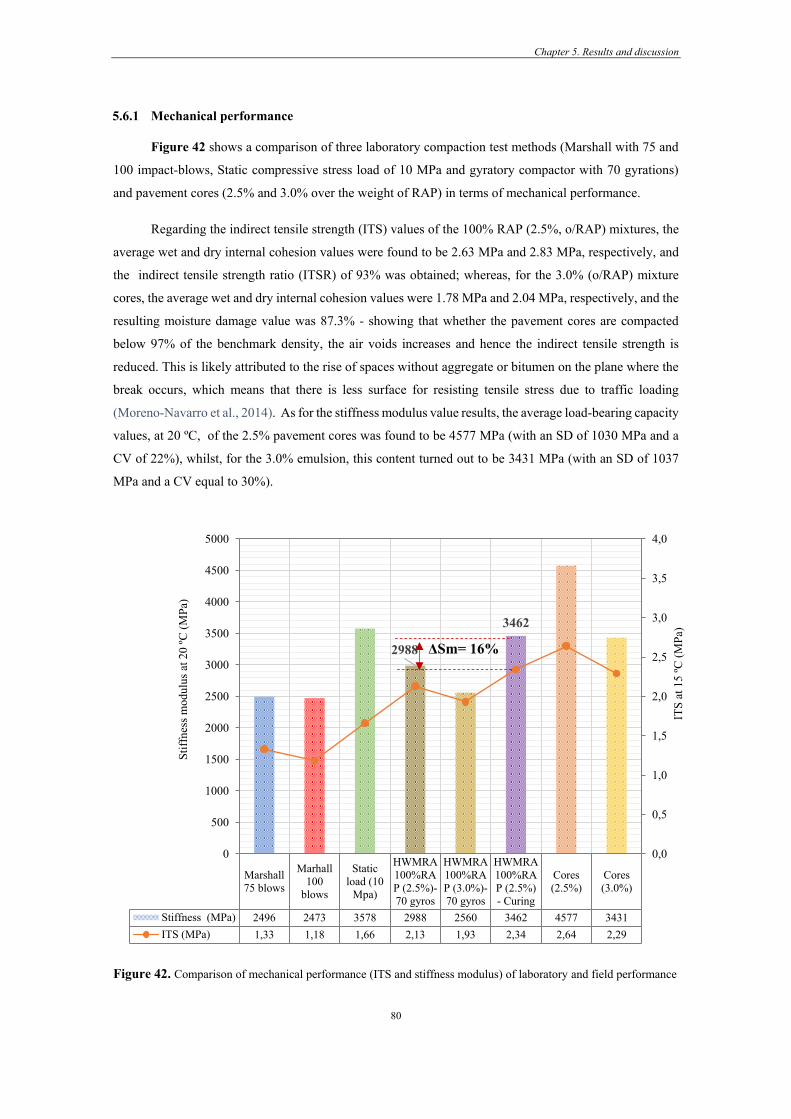
5.6.1 Mechanical performance ...................................................................................................... 80
5.6.2 Fatigue characterization ........................................................................................................ 81
Monitoring plan of the pavement surface characteristics .......................................................... 82
5.7.1 Macrotexture ......................................................................................................................... 82
5.7.2 International surface roughness index .................................................................................. 83
Chapter 6 .................................................................................................................................................... 84
Page 17
Table of contents
xi
6 LOOKING AHEAD: SELF-HEALING ANALYSIS OF HWMRA MIXES CONTAINING 100%
RAP 84
Introduction ............................................................................................................................... 84
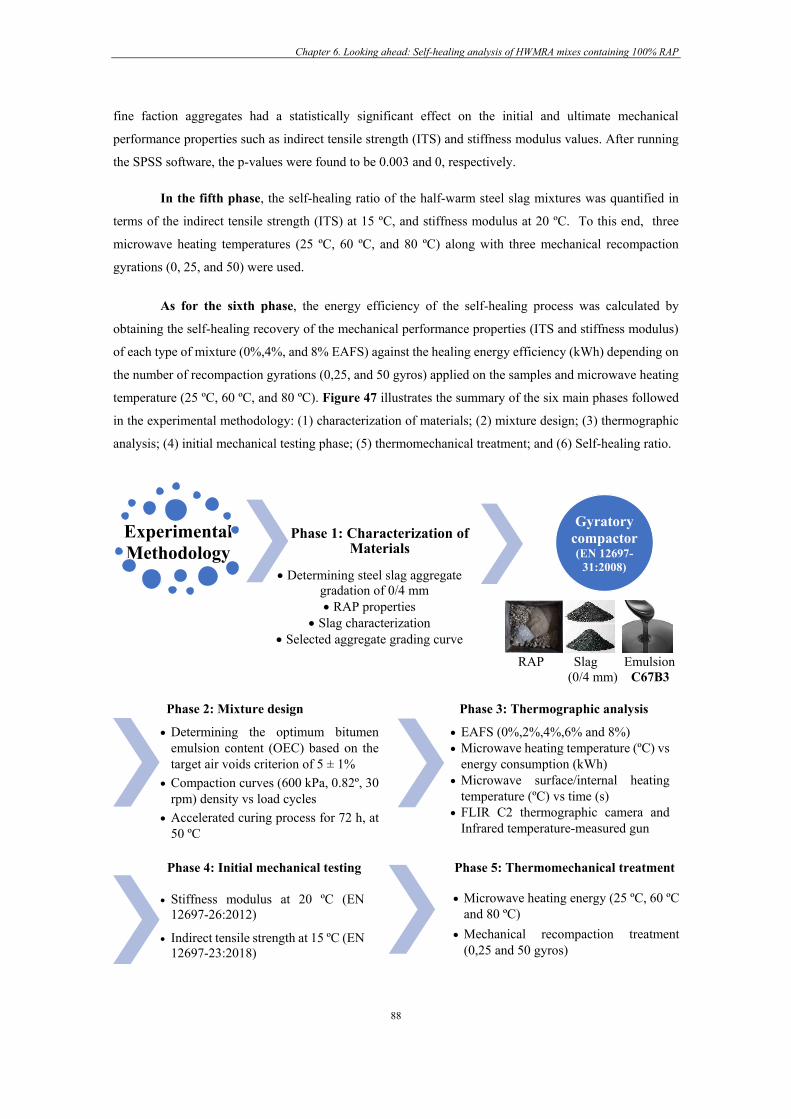
Methodology ............................................................................................................................. 86
Test procedures ......................................................................................................................... 89
Materials ................................................................................................................................... 90
6.4.1 EAFS aggregates .................................................................................................................. 90
6.4.2 RAP characterization ............................................................................................................ 92
6.4.3 Bituminous emulsion characterization .................................................................................. 92
Determining optimum emulsion content ................................................................................... 93
6.5.1 Compaction curves ............................................................................................................... 95
6.5.2 Mixture composition............................................................................................................. 96
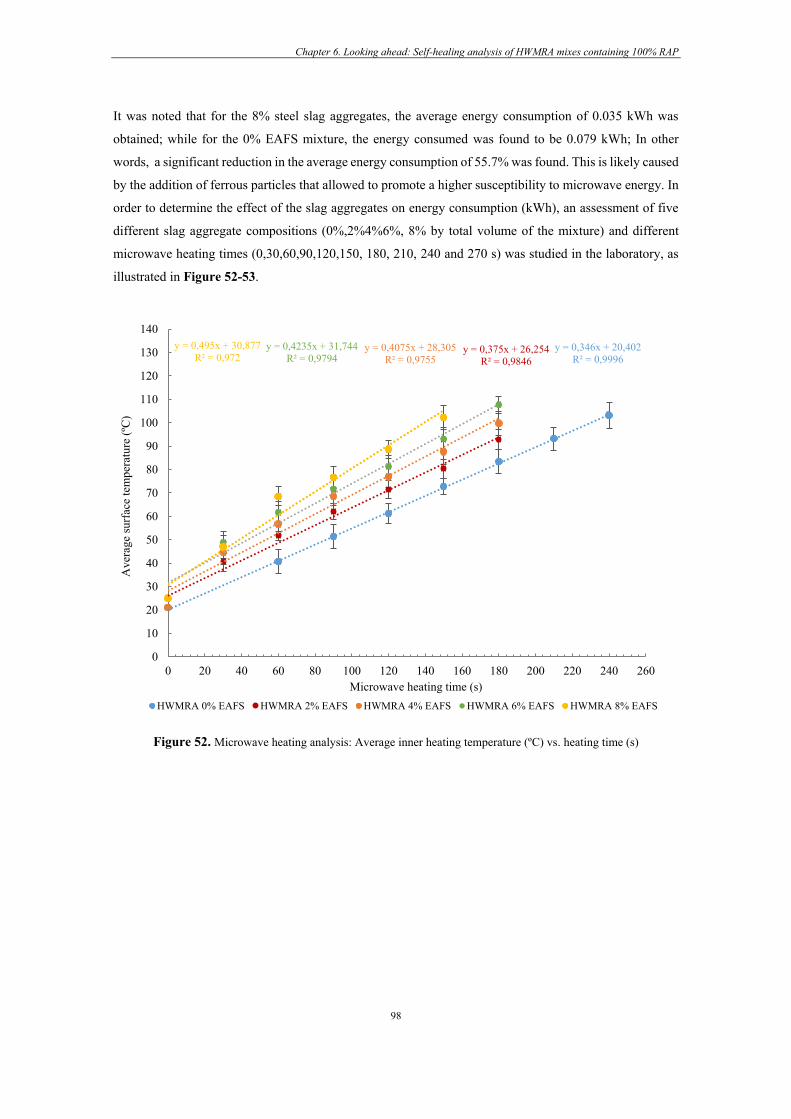
Thermographic study: Microwave heating stage ...................................................................... 97
Self-healing testing program ................................................................................................... 101
6.7.1 Stiffness modulus ............................................................................................................... 102
6.7.2 Indirect tensile strength ...................................................................................................... 106
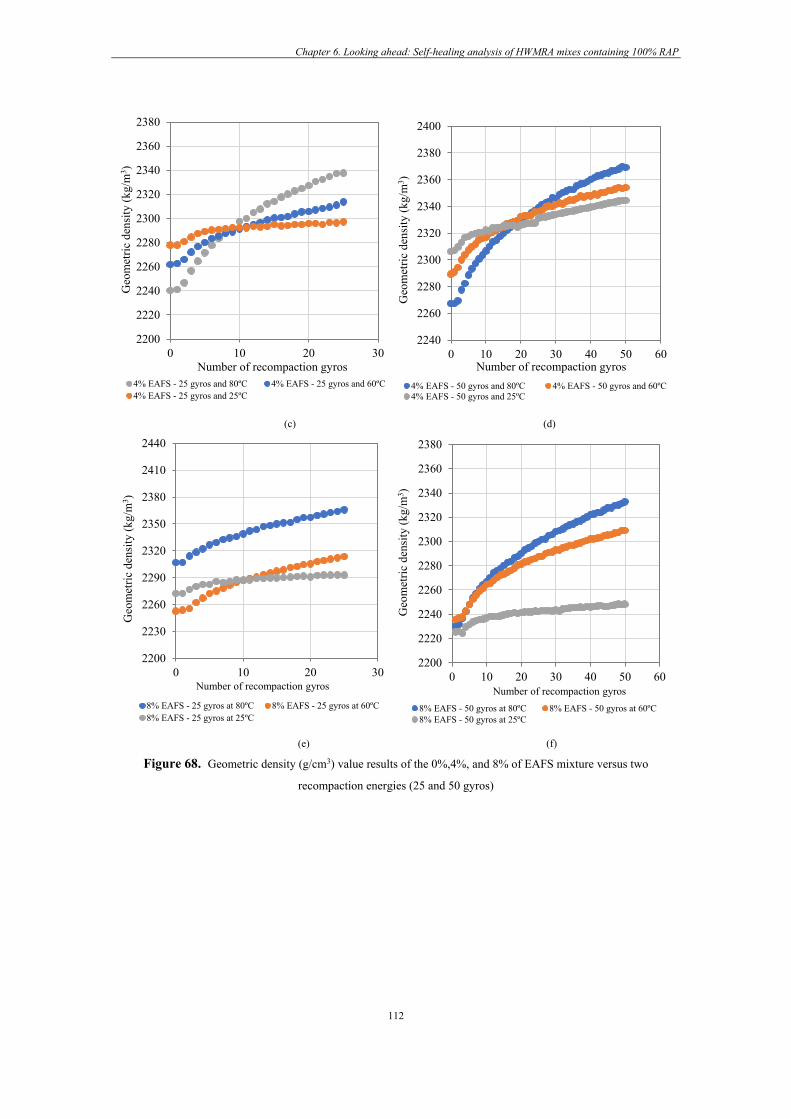
Gyratory compaction curves ................................................................................................... 111
7 CONCLUSIONS AND FUTURE RESEARCH STUDIES ............................................................ 113
Laboratory compaction study .................................................................................................. 113
Conclusions of the manufacturing and quality control ........................................................... 115
Conclusions: Sampling ........................................................................................................... 116
Self-healing conclusions ......................................................................................................... 118
Future research studies and upcoming opportunities .............................................................. 119
Chapter 8 .................................................................................................................................................. 121
8 REFERENCES ................................................................................................................................ 121
Page 19
1
Chapter 1
INTRODUCTION
Research backgrounds
Environmental awareness has been rapidly increasing over the last few decades because of air
pollution and greenhouse gas (GHG) emissions. These facts have led to intensive efforts worldwide to
diminish environmental burdens with the ratification of the Kyoto Protocol by the European Union. It
commits the first industrialized nations worldwide to reducing greenhouse gas emissions released into the
atmosphere and based on the scientific consensus that global warming is occurring (United Nations, 1992).
The Paris agreement on climate change (better known as Accord de Paris in French), which entered into
force on November 4th, 2016, was in line with the United Nations Framework Convention on Climate
Change (UNFCCC) dealing with GHG emissions mitigation, adoption, and finance. This agreement aims
to strengthen the ability of countries to deal with the adverse impacts of climate change, foster climate
resilience and support sustainable development in parallel (Wang et al., 2018a), and limit the temperature
increase by 2.7 ºC, between 2030 and 2050, which means zero emissions over that period (Schleussner et
al., 2016).
Problem Statement
Nowadays, the use of new energy-efficient and cleaner production technologies with high and total
reclaimed asphalt pavement (RAP) contents is gaining boost because of the provision of environmental,
social, technical and economic advantages over other existing asphalt paving technologies in the asphalt
market. Nonetheless, the addition of high and total RAP contents into the new mixture design has been
tagged by Departments of Transportation (DOTs), and research pavement community in general, as a
potential issue linked to surface pavement distresses (e.g., thermal, longitudinal, transverse, and fatigue
cracking). In other words, the recycled RAP mixture tends to show higher stiffness modulus and hence
early fatigue cracking pavement failures because of the physical hardening and oxidative aging (i.e., due to
the evaporation of the lighter fractions of the recycled asphalt) suffered by the recycled binder during its
initial service life.
Therefore, it is well known that neither HWMA nor RAP may be effectively used separately. For
these reasons, there remain a large number of concerns and questions that should be answered regarding
the volumetric and mechanical performance properties of half-warm emulsified bitumen mixtures with high
and total RAP contents. To do so, a more in-depth analysis of the fatigue cracking behaviour is therefore
of paramount importance to guarantee the satisfactory mid- and long-term mechanical performance of half-
Page 20
Chapter 1. Introduction
2
warm mix recycled mixtures and, hence, reach their widespread use in base, binder, and wearing course
asphalt mixtures of road pavements/highways or in urban areas.
Overall objectives
The general objective of this dissertation is to present the main findings and results arising from an
extensive laboratory research study aimed at quantifying the volumetric and mechanical performance
properties, in-laboratory and in-situ, of half-warm recycled asphalt mixtures with total RAP contents
(100%), and emulsified bitumen, and, after that, compared to conventional hot mix asphalt (HMA) mixture.
Particular objectives
The primary objectives that can be drawn from this research study are listed as follows:
• To collect the current the state-of-the-art review and state-of-practice of new cleaner and greener
disruptive production technologies total RAP contents (100%) and emulsified bitumen used in the
binder and wearing course asphalt mixtures of road pavements or urban areas.
• To select the most suitable laboratory compaction test method and mix design compaction energy
that allows reproducing the volumetric characteristics (i.e., density and air voids content) and
mechanical performance properties obtained from the field after pavement construction.
• To analyze the effect of laboratory-accelerated curing process on the development of the ultimate
mechanical performance properties (i.e., indirect tensile strength (ITS) and stiffness modulus) of
half-warm mix recycled asphalt mixtures containing a total RAP content equal to 100% and
emulsified bitumen.
• Short-term mechanical performance assessment of the half-warm mix recycled asphalt mixes with
100% RAP and emulsified bitumen
• To analyze and quantify the self-healing ratio (HR) of half-warm mix recycled asphalt mixtures
with electric arc furnace steel slag (EAFS) and recycled asphalt pavement (RAP) aggregates using
a breakthrough thermomechanical treatment (i.e., microwave (MW) heating energy and
recompaction-based mechanical treatment) for the optimization of maintenance and rehabilitation
(M&R) activities of wearing course asphalt mixtures in road pavements or urban areas.
• To present the main findings, future opportunities, recommendations, and conclusions drawn from
this doctoral dissertation.
Page 21
Chapter 1. Introduction
3
Structure of the dissertation
This thesis dissertation was broken down into eight phases to meet the particular and overall objectives
established in this research document.
Chapter 1. Introduction
This introductory Chapter aims to describe the research methodology and scope of the thesis document
based on the problem statement and specific objectives. This chapter presents a brief justification of the
interest in conducting this research while collecting the technical content of the document.
Chapter 2. Literature review
This research Chapter includes a thoroughly analysis of the scientific papers, hearings, technical
reports, books, conference proceedings, working papers, and thesis dissertations, which makes it possible
to achieve a better understanding of what has been done to date with reference to half-warm mix recycled
asphalt (HWMRA) mixtures with high and total RAP contents equal to 100% and emulsified bitumen.
Furthermore, the technical, environmental, economic, and social advantages and drawbacks linked
to this recent technology will be presented and compared with those obtained from conventional hot mix
asphalt (HMA) mixtures. The issues related to the fatigue cracking, stiffness, and moisture damage will be
addressed to provide higher confidence in using this technology in binder and wearing course asphalt
mixtures of road pavements.
Chapter 3. Materials and test procedures
This Chapter outlines the mixture testing plan along with a preliminary laboratory research study
aimed at determining the physical properties of the materials (i.e., reclaimed asphalt pavement (RAP),
virgin aggregates, asphalt binder, and cationic emulsion) that were selected for producing HWMRA
mixtures. In this recognition, the characterization of the materials, as well as the mixtures, was based on
the European Committee for Standardization’s (EN) standards and, in some cases, the Spanish Technical
Specifications (NLT) developed by the Centre for Public Works Studies and Experimentation (CEDEX)
for highway testing.
Chapter 4. Methodology
This research Chapter aims to shed light regarding some technical gaps and detailed mix design
procedures for the half-warm mix asphalt (HWMA) mixtures’ preparation and characterization in the
laboratory. A summary of the testing procedures used to analyze the volumetric and mechanical
performance properties of the half-warm mixes containing 100% RAP and emulsified bitumen.
The experimental methodology followed in this doctoral dissertation was broken down into six
main phases. In the first phase, preliminary field and laboratory studies were conducted to characterize
respectively the RAP that was used in the production of half-warm mix recycled asphalt mixtures
(HWMRA) as well as the remaining mixture's components (i.e., bituminous emulsion and asphalt binder).
Page 22
Chapter 1. Introduction
4
The second phase consisted in evaluating three different laboratory compaction test methods to define the
most suitable compaction test method and get more consistent volumetric characteristics (e.g., air void and
density) and mechanical performance properties of these mixtures in the field. The compaction test methods
examined in this research study were the (1) static compressive stress load by a double-plunger action
(NLT-161/98: Standard test method for Compressive Strength of Bituminous Specimens); (2)
Marshall impactor, according to EN-12697-30:2007. Part 30: Specimen preparation by impact
compactor; (2) and the gyratory compactor test method, according to EN-12697-31:2007. Part 31:
Gyratory Compactor.
In the third phase, an assessment of the volumetric and mechanical performance of four emulsion
contents (2.0, 2.5%, 3.0%, and 3.5% over the weight of RAP) was conducted, after which the optimum
emulsion content was subjected to an accelerated curing treatment (0, 24, 48 and 72 h) to quantify whether
there was improvement of the mechanical performance properties of the mixtures. Indirect tensile strength
(ITS), stiffness modulus, rutting performance, and four-point bending (4PB) beam fatigue test method were
evaluated in this research stage.
In the fifth phase, the quality control of the mixtures after in-plant manufacturing was evaluated
and tested in the laboratory to verify the reproducibility of manufacturing these mixes in a batch plant, and
also to check their compliance in terms of binder content in the final mix design, air voids, stiffness
modulus, water sensitivity and rutting resistance. A set of pavement cores will be extracted after pavement
construction (EN 12697-27:2017. Part 27: Sampling) and tested for stiffness modulus, indirect tensile
strength (ITS), and indirect tensile fatigue test (ITFT). Finally, a comparison between the laboratory results
arising from the three compaction methods (i.e., Marshall, Static load and gyratory compactor) and field
performance will be conducted.
As for the sixth phase, surface friction characteristics of the binder course mixtures of the test road
sections will be determined and compared with those values obtained from conventional HMA mixtures.
The macrotexture will be evaluated through the spread of a modified sand patch with microspheres,
according to EN 13036-1:2010. Road and airfield surface characteristics. Part 1: Measurement of
pavement surface macrotexture depth using a volumetric patch technique. The International surface
Roughness Index (IRI) will also be calculated using a high-speed profiling laser device, according to EN
13036–6:2008. Road and airfield surface characteristics. Part 6: Measurement of transverse and
longitudinal profiles in the evenness and megatexture wavelength ranges.
Chapter 5: Results and discussions
The primary objective of this Chapter was to present the results of a new technology based on the use of
half-warm mix recycled asphalt mixes containing 100% RAP and two emulsion contents (2.5% and 3,0%
o/RAP): From mix design to full-scale implementation. In this context, the main contributions of this
Chapter (1) were found to be the adoption of the gyratory compactor system as the most suitable method
for this recent technology; (2) the use of an accelerated curing treatment allowed to improve the mixtures’
mechanical performance properties in the range of curing between 48 and 72 h, at 50 ºC. (3) Another bottom
Page 23
Chapter 1. Introduction
5
line was that the HWMRA mixes with 50/70 pen. grade bitumen showed acceptable performance in terms
of fatigue life. A 50/70 pen. bitumen exhibited slightly lower microtensile fatigue-strain (휀6) values than
the results from the 160/220 pen. bitumen, likely attributed to the effect of a softer penetration grade
bitumen in the final mixture design that allowed the provision of higher ductility and flexibility of the
mixture. More results and discussion of this thesis dissertation can be found in Chapter 7.
Chapter 6. Looking ahead: Self-healing analysis of half-warm mix recycled asphalt (HWMRA)
mixtures containing 100% RAP
This Chapter was developed under the framework of a Spanish research project aimed at quantifying
the self-healing ratio (HR) of half-warm mix recycled asphalt (HWMRA) mixtures using three electric arc
furnace steel (EAFS) slag aggregates (0%,4%, and 8% of EAFS) by volume of the mix. The steel slag was
used as a replacement of recycled aggregates pavement (RAP) in the fine fraction of 0/4 mm sieve size. In
this context, four emulsion contents (e.g., 2.0%, 2.5%,3.0%, and 3.5%o/RAP) were selected and used to
achieve the target air voids criterion, aiming at the target air voids content of 4-6%. The gyratory compactor
was chosen for HWMRA mix’ production and characterization in the laboratory by applying a mix design
compaction energy of 80 gyros, at 80 ºC, and following the standard compaction conditions established
(0.82º, 30 rpm, 600 kPa) by the EN 12697-31:2007. Part 31: Gyratory Compactor.
Posteriorly, a thermographic analysis was conducted using a FLIR thermographic camera and an
infrared temperature-measured gun, along with a microwave oven with a maximum theoretical output
capacity of 1200 W and a 230 V, 50 Hz power supply. The initial mechanical performance was calculated
in terms of stiffness modulus, at 20 ºC, and indirect tensile strength (ITS), at 15 ºC. After that, the damaged
specimens were subjected to a thermomechanical treatment to determine the self-healing recovery of the
mixtures using an experimental mechanical recompaction method (0, 25, and 50 gyros), together with three
microwave heating temperatures (25 ºC, 60 ºC, and 80 ºC). A re-mechanical testing phase was conducted
again to quantify the self-healing ratio (HR) of the mixtures. Therefore, this study revealed that the slag
mixes with 8% EAFS showed the highest self-healing ratio (1.6) while reducing the average energy
consumption of 50% compared with those values obtained for the 0% EAFS mixture.
Chapter 8. Conclusions and future research studies
The main contributions and upcoming studies are presented to summarize the findings and lessons learned
in this thesis dissertation.
Chapter 9. References. This chapter aims to include all the research documents reviewed to develop this
thesis dissertation: hearings, conference proceedings, reports, journal articles, and doctoral dissertations.
Page 24
Chapter 1. Introduction
6
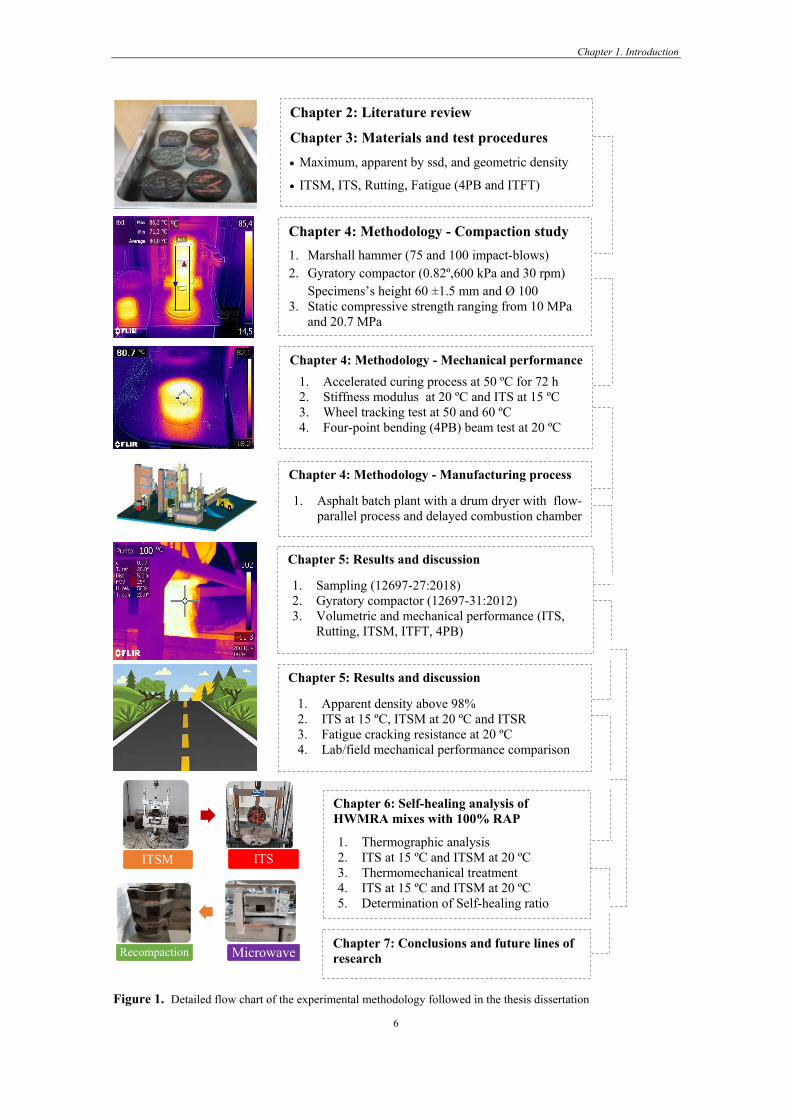
Figure 1. Detailed flow chart of the experimental methodology followed in the thesis dissertation
ITSM ITS
Recompaction Microwave
Chapter 4: Methodology - Compaction study
1. Marshall hammer (75 and 100 impact-blows) 2. Gyratory compactor (0.82º,600 kPa and 30 rpm)
Specimens’s height 60 ±1.5 mm and Ø 100 3. Static compressive strength ranging from 10 MPa
and 20.7 MPa
Chapter 4: Methodology - Mechanical performance
1. Accelerated curing process at 50 ºC for 72 h 2. Stiffness modulus at 20 ºC and ITS at 15 ºC 3. Wheel tracking test at 50 and 60 ºC 4. Four-point bending (4PB) beam test at 20 ºC
Chapter 4: Methodology - Manufacturing process
1. Asphalt batch plant with a drum dryer with flow-parallel process and delayed combustion chamber
Chapter 5: Results and discussion 1. Sampling (12697-27:2018) 2. Gyratory compactor (12697-31:2012) 3. Volumetric and mechanical performance (ITS,
Rutting, ITSM, ITFT, 4PB)
Chapter 5: Results and discussion 1. Apparent density above 98% 2. ITS at 15 ºC, ITSM at 20 ºC and ITSR 3. Fatigue cracking resistance at 20 ºC 4. Lab/field mechanical performance comparison
Chapter 6: Self-healing analysis of HWMRA mixes with 100% RAP
1. Thermographic analysis 2. ITS at 15 ºC and ITSM at 20 ºC 3. Thermomechanical treatment 4. ITS at 15 ºC and ITSM at 20 ºC 5. Determination of Self-healing ratio
Chapter 2: Literature review
Chapter 3: Materials and test procedures • Maximum, apparent by ssd, and geometric density
• ITSM, ITS, Rutting, Fatigue (4PB and ITFT)
Chapter 7: Conclusions and future lines of research
Page 25
7
Chapter 2
2 LITERATURE REVIEW
Introduction
Asphalt mixtures requiring lower mixing, spreading and compacting temperatures have received
considerable attention worldwide in the recent years as a way to improve environmental performance and
reduce energy consumption, the extraction and exploitation of natural resources and greenhouse gas (GHG)
emissions, construction and production costs. Thus, the concept of greener and cleaner paving technologies
has gained momentum in the wake of the increasing global environmental awareness of the environmental
damages arising from the greenhouse gas (GHG) emissions and the consumption of scarce and non-
renewable resources with which the paving industry has been associated with. This fact has motivated
departments of transportations (DOTs), and the pavement community in general, to investigate strategies
that improve the environmental performance and reduce the costs of road pavement construction and
maintenance practices by using sustainable engineering solutions.
Recycled asphalt pavement (RAP) material is also often used to mitigate the problem related to (1)
the disposal of the materials removed from road pavements that have reached unacceptable service
conditions and (2) the exploitation and extraction of raw materials. Additionally, considerable economic
savings can be achieved as a result of the reuse of RAP into new mixtures (Kandhal PS and Mallick RB,
1997). Therefore, asphalt pavement sections requiring reconstruction or in need of a new overlay are
potentially good candidates for recycling. Over the years, several recycling technologies have been
developed to facilitate the use of RAP into new asphalt mixtures. Notwithstanding these efforts, there are
fewer than expected sustainable technical solutions that enable the reuse of high or total RAP contents. For
instance, the most common recycling techniques, such as cold mix asphalt (CMA) mixtures, have been
mainly used in maintenance and rehabilitation (M&R) activities of road pavements subject to low traffic
load categories. However, these asphalt mixtures tend to present some drawbacks and shortcomings
associated with curing period, coating, tenderness, delayed cohesion, low early strength, and the need for a
maturation process that allow them to develop the final properties (e.g., indirect tensile strength (ITS) and
stiffness modulus) at the early hours after being placed in the field (Al-hdabi and Al, 2018; Bocci M et al.,
2011; Graziani A et al., 2016; Swaroopa S et al., 2015).
Page 26
Chapter 2. Literature Review
8
One example of a technology that has the potential to improve pavement sustainability is the half-
warm mix asphalt (HWMA). HWMA mixes are manufactured, spread, and compacted in the range values
of 65-100 ºC. This technology can be conceived as an essential step forward to improve road pavement
sustainability by achieving energy consumption savings in the range of 25-50% compared to both hot-
recycling and warm mix asphalt (WMA) technologies while reducing the exploitation and extraction of
non-renewable resources (i.e., virgin aggregates and binder) and fuel source consumptions (gas-oil); (3) the
amount of pollutant emissions (i.e., smoke and fumes) released into the atmosphere as a result of decreasing
the heating and drying temperature of virgin aggregates; (4) less aging of the recycled RAP binder due to
the adjustment of the burner flame during the mix production; (5) as well as the possibility to stretch the
asphalt paving window throughout cold-weather conditions, due to a slower mix cooling rate over longer
hauling distances before its placement in the field (Manolis et al., 2008; Vaitkus et al., 2009).
In this context, it has been suggested that HWMA technologies are good solutions to further increase
the potential environmental and economic benefits associated with the use of RAP, as they make the
compaction process easier than those with virgin asphalt binder. However, there remain some concerns and
questions to be tackled and answered regarding the mid-long term mechanical performance and durability
of these mixes due to (1) the unknown source and variability of RAP (Silva Hugo M R D et al., 2012), (2)
the lack of a good understanding of the mixing between RAP and other mixtures components (Lo Presti D
et al., 2016), and (3) the fact that the use of RAP can lead to increased stiffness, lower durability, and
workability of the mixtures if proper adjustments to mix design process are not performed (Kusam et
al.,2017). For instance, Zhao et al. (2013) (Zhao et al., 2013) and Lopes et al. (2014) (Lopes M et al., 2014a)
showed that the addition and reuse of high RAP contents increases the resistance to permanent deformation,
but it can likely lead to an increase in stiffness modulus because of the reuse of the aged recycled asphalt
binder (Valdés et al., 2011; West et al., 2013), that in turn, reduces the mixture’s fatigue cracking resistance
(Boriack P et al., 2014; Rebbechi J and Green M, 2005).
In Figure 2, the average energy consumption of the conventional HMA mixture was found to be 7-8 kg of
fuel/t, resulting in an average carbon dioxide emissions during the HMA mix production within the order
of 20-25 kg of CO2/t, whereas, for the HWMA 100% RAP mixes, the average energy consumption fell
within the range of 2-3 kg of fuel/t, and an average amount of pollutant emissions of 5 kg CO2 /t (D’Angelo
et al., 2007). However, some others researchers reported that the average energy consumption of HMA
mixes was found to be 6-7 kg of fuel/t, from which 30-35% are losses, 25-30% corresponding to the heating
process of virgin aggregates, and 15% belong to the evaporation of water due to the emulsion breaking
(Bardesi and Soto, 2010). As a result of this, some researchers claim that the decrease in the manufacturing
temperatures might lead to a significant reduction in pollutant emissions, energy consumption and hence
economic costs (Coppola et al., 2016; Kristjánsdóttir et al., 2007; McDaniel et al., 2001).
1. Hot mix asphalt (HMA) mixes are fabricated and compacted in the range of 150-170 ºC.
2. Warm mix asphalt (WMA) mixes are laid and compacted in the range of 105-140 ⁰C.
Page 27
Chapter 2. Literature Review
9
3. Half-warm mix asphalt (or enrobés semi-tièdes in French) – HWMA are mixtures that are
formulated either with foamed or emulsified bitumen technology, and they are fabricated,
laid and compacted below the boiling point of water (≤100 ºC), or in the workable
temperature range of 100 ºC - 65 °C (212 ºF to 155 ºF).
4. Cold mix asphalt (CMA) is spread and compacted at room temperatures, and it is formulated
with bitumen emulsion content and cement.
Figure 2. Classification of asphalt mixes based on the manufacturing temperature reduction and fuel usage
(D’Angelo et al., 2007)
Classification of HWMRA mixes
Though there is no general agreement nor consensus on how these mixtures should be classified, the
classification accepted is based on (1) the recycled content to be reused into the new mixture design; (2)
bitumen production either foamed or emulsified; (3) aggregate particle size distribution (AC D, S, PA,
BBTM); (4) Mix production temperature (hot/warm/half-warm) and industrial production process using a
continuous drum plant or asphalt batch plant.
• HWMRA with total RAP contents. They are made up of a combination of virgin aggregates
(if necessary) and the respective quantity of RAP material equal to or greater than (≥80%) RAP.
Also, for the correct mix production, it is recommended that the recycled binder not enter into
contact directly with the burner flame in the drum-dryer to prevent binder aging
Page 28
Chapter 2. Literature Review
10
• HWMRA mixes with high RAP contents. This mix is made up of an amount of RAP equal to,
or higher than (≥ 50%) and lower than <80%.
• HWMRA mixes with intermediate RAP contents are made-up of a combination of virgin
aggregates and RAP contents higher than >20%, and lower than <50% RAP.
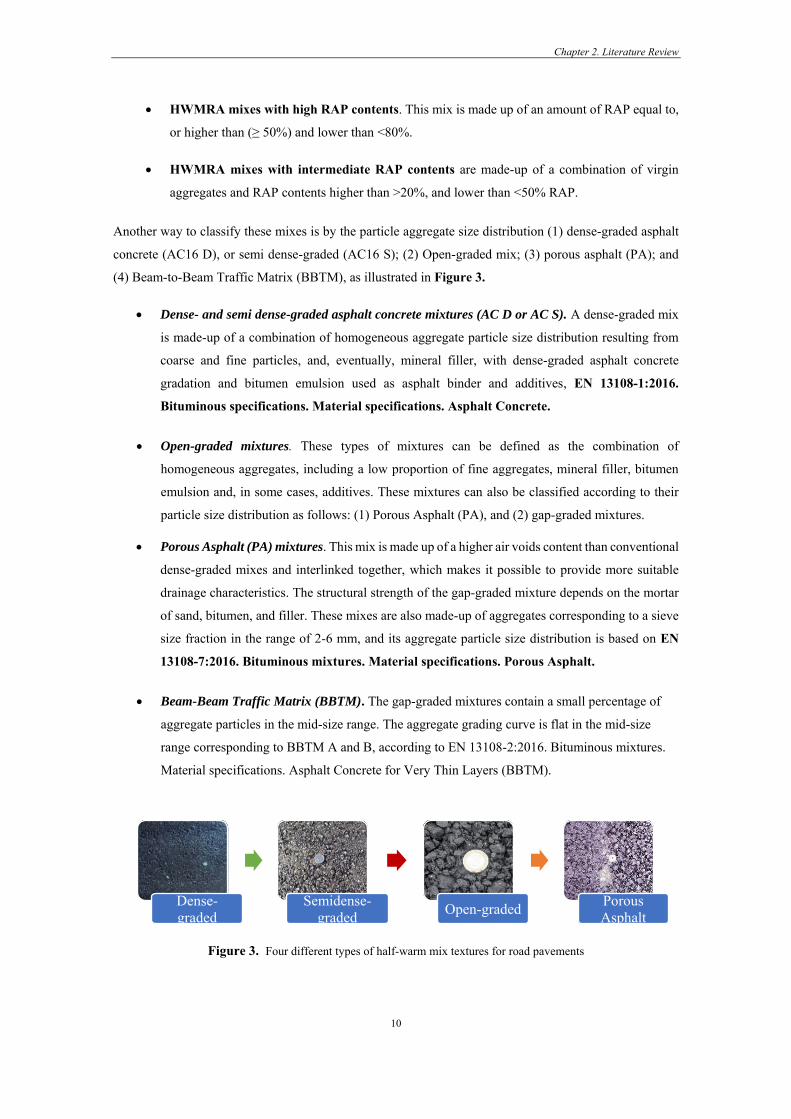
Another way to classify these mixes is by the particle aggregate size distribution (1) dense-graded asphalt
concrete (AC16 D), or semi dense-graded (AC16 S); (2) Open-graded mix; (3) porous asphalt (PA); and
(4) Beam-to-Beam Traffic Matrix (BBTM), as illustrated in Figure 3.
• Dense- and semi dense-graded asphalt concrete mixtures (AC D or AC S). A dense-graded mix
is made-up of a combination of homogeneous aggregate particle size distribution resulting from
coarse and fine particles, and, eventually, mineral filler, with dense-graded asphalt concrete
gradation and bitumen emulsion used as asphalt binder and additives, EN 13108-1:2016.
Bituminous specifications. Material specifications. Asphalt Concrete.
• Open-graded mixtures. These types of mixtures can be defined as the combination of
homogeneous aggregates, including a low proportion of fine aggregates, mineral filler, bitumen
emulsion and, in some cases, additives. These mixtures can also be classified according to their
particle size distribution as follows: (1) Porous Asphalt (PA), and (2) gap-graded mixtures.
• Porous Asphalt (PA) mixtures. This mix is made up of a higher air voids content than conventional
dense-graded mixes and interlinked together, which makes it possible to provide more suitable
drainage characteristics. The structural strength of the gap-graded mixture depends on the mortar
of sand, bitumen, and filler. These mixes are also made-up of aggregates corresponding to a sieve
size fraction in the range of 2-6 mm, and its aggregate particle size distribution is based on EN
13108-7:2016. Bituminous mixtures. Material specifications. Porous Asphalt.
• Beam-Beam Traffic Matrix (BBTM). The gap-graded mixtures contain a small percentage of
aggregate particles in the mid-size range. The aggregate grading curve is flat in the mid-size
range corresponding to BBTM A and B, according to EN 13108-2:2016. Bituminous mixtures.
Material specifications. Asphalt Concrete for Very Thin Layers (BBTM).
Figure 3. Four different types of half-warm mix textures for road pavements
Dense-graded
Semidense-graded Open-graded Porous
Asphalt
Page 29
Chapter 2. Literature Review
11
Sustainable development
Sustainability is one of the most important social concepts used to quantify environmental, social,
and economic advantages offered by today’s sustainable engineering solutions. In this regard, the most
well-known definition of sustainability corresponds to Brundtland definition: “the development that
meets the needs of the present without compromising the ability of the future generations to meet
their own needs” (UN Document, 1987). In this respect, developing environmentally friendly and energy-
efficient asphalt paving technologies appear to be of great importance (Wang et al., 2018a); to reduce
pollutant emissions and energy consumption (Alkins et al., 2012), and, in turn, to fulfill and be consistent
with the social desire to use technologies that reduce, recycle and reuse (3Rs). Figure 4 shows the triple
bottom line (TBL) approach offered by using HWMA mixes.
Figure 4. Schematic representation of the 3BL approach using HWMRA mixes
Social
EconomicEnvironmental
• DOESN’T require a curing period
• BETTER working & paving conditions
• INCREASES the health and safety
conditions of the workers
• CONTRIBUTES to sustainability
• LESS restriction in non-attainment
areas
• LOWER energy consumption
• 100% RAP recyclable
• CONVENTIONAL machinery
• FABRICATED at 95-100ºC
• FINANCIALLY attractive
• AVOIDS landfill usage
• LESS pollutant emissions (clean air)
- NOx, GHG, VOCs, O3
• LOWER consumption of folsil fuels
• SAVES virgin aggregates and binder
• PREVENTS burden for future generations
Bearable Equitable
Sustainable
Page 30
Chapter 2. Literature Review
12
Potential benefits and drawbacks
The use of half-warm mix reclaimed asphalt (HWMRA) mixtures is typically seen and conceived
as a new step towards road pavement sustainability because of the provision of environmental, social,
technical and economic benefits with which these mixes have been associated. In due recognition, the
expected potential benefits of using these sustainable mixtures include; (1) reduced mixing and compaction
temperatures at the worksite (2) the extension of the paving season window or when mixtures should be
hauled long distances before their placement in the field (Brosseaud and Saint Jacques, 2008; Manolis et
al., 2008; Vaitkus et al., 2009); (3) good compactibility to lower mix production temperatures (Croteau and
Tessier, 2008); (4) less RAP binder ageing process due to the reduction of heating and drying temperatures;
(5) lower emissions derived from the incineration of fossil fuel sources, such as carbon dioxide (CO2),
carbon monoxide (CO), oxides of nitrogen (NOx), volatile organic compounds (VOCs) and particles (Rubío
et al., 2013). With this in mind, sustainable development is met by using sustainable pavements (Maher et
al., 2006). Therefore, the primary benefits associated with this technology are classified in four different
categories as follows:
• Economic → Reduced energy consumption, fossil fuels, and funding costs
• Environmental → Lower pollutant emissions (CO2, VOCs, CO, NOx)
• Paving → Improved workability and compaction efficiency, longer hauling distances
• Production → Potential for increasing higher RAP contents
2.4.1 Economic benefits
The HWMRA mix is conceived as a new disruptive energy-efficient technology due to its ability to reduce
mix production/compaction temperatures, energy consumption, and economic costs. Therefore, this
technology enhances road pavement sustainability by achieving energy consumption savings of up to 50%,
thereby reducing fossil-fuel consumption in about 3-4 kg/t (Bardesi and Soto, 2010; Harder et al., 2008;
Miranda, 2008; Olard and Romier, 2009) in comparison with both conventional hot in-place recycling and
warm mix asphalt (WMA). In this context, the decrease in manufacturing and spreading temperatures lead
to a significant reduction in energy consumption and economic costs (Coppola et al., 2016; Kristjánsdóttir
et al., 2007). Nonetheless, the real economic gains from the decreased energy consumption depending on
the type of energy and its current cost in the asphalt paving market (Hossain et al., 2009). In this context,
additional benefits can be quantified due to the decrease in production/compaction temperatures, i.e.,
reduced greenhouse emissions, fumes, and odors generated at the asphalt mixing plant and paving site
(Rashwan, 2012).
Page 31
Chapter 2. Literature Review
13
2.4.2 Environmental benefits
The production of hot mix asphalt (HMA) mixtures raises a large number of environmental concerns
as a result of polluting (CO2, NO2, and NOx) emissions released into the atmosphere and brings up health
risks by the staff responsible for the maneuvers in the asphalt batch plant. In order to overcome these issues,
the adoption of the HWMA mixes, as a greener and cleaner production technology produced below the
boiling point of water (100 ºC), provides several advantages associated with the reduction of harmful
emissions and fuel consumption as a consequence of lowering mix production temperatures.
In other words, this technology allows to save energy consumption of up to 3-4 kg/t, in comparison
with both hot in-place recycling and warm mix asphalt (WMA) mixtures (Bardesi and Soto, 2010; Olard
and Romier, 2009; Ventura et al., 2009), while diminishing the amount of pollutant emissions released into
the atmosphere in the quantitative range of 10-15 kg/CO2, in comparison with hot in-place recycling and
WMA mixes, by decreasing the emission of harmful emissions above 3 million/tons each year in Europe
(Bardesi and Soto, 2010; Olard et al., 2009).
Gaarkeuken et al. (2016) investigated the amount of CO2 emissions released into the atmosphere using the
Low Energy Asphalt Concrete - Porous Asphalt (LEAB-PA) approach. The authors found that the average
harmful emissions accounting for 1 ton of HMA LEAB-PA mix were found to be approximately 11.93
kg/CO2, while, for the production of 1-ton HWMA-PA was found to be 9.26 kg/CO2. Therefore, a
considerable reduction of emissions and energy consumption of the HWMA-PA of 22% and 50% were
obtained, respectively, in comparison with HMA-PA mix.
Rubío et al. (2013) investigated the environmental benefits linked to cleaner and greener production
technology. This study aimed at measuring the amount of polluting emissions during the construction of
test road sections in an asphalt batch plant. They found that the reduction at half-warm temperatures may
lead to a significant decrease in terms of polluting emissions of up to 58% of CO2 and 99.9% of sulfur
dioxide (SO2), harmful gases, volatile organic compounds (VOCs) and polycyclic aromatic hydrocarbons (PAHs).
Miranda (2008) conducted a comparison between HWMA and HMA mixes in a continuous asphalt plant.
They claim that the decrease in production and compaction temperatures below 100°C might lead to a
remarkable energy consumption reduction by achieving energy (fuel and gas-oil) savings of up to 50%, and
hence a significant reduction in harmful emissions in about 30% CO2 compared to traditional HMA mixes.
They also reported that the average harmful emissions calculated during the HWMA mix production were
about 3.81 ton of CO2/h, while, for the conventional HMA mix, this number was 4.81 ton of CO2/h, as
illustrated in Table 1.
Page 32
Chapter 2. Literature Review
14
Table 1. Pollutant emissions released into the atmosphere during the mix manufacturing
Emissions
released in-plant
Miranda (2008) Rubio et al. (2013) Limit values
HWMA HMA AC16 D HWMA
AC16 S
HMA
AC16 S
CO2 (%) - - 1.7 4.1 -
CO (ppm) - - 51 628 1445
NOx (ppm) 3 27 17 51 300
SO2 (mg/m3N) 136 ppm 181 ppm 1.1 1025.9 850 ppm
H2 (ppm) 184 460 - - -
Particles
(mgC/Nm3)
- - 12.9 30.9 150
TOC (mgC/Nm3) - - 26.48 18.47 150
VOCs (µg/L) - - <0.30 <0.67 3.5
PAHs (µg/L) - - <0.059 <0.019 3.5
2.4.3 Paving/compaction benefits
Though the main driving factors for HWMA mix implementation are highly linked to its economic
and environmental benefits, there are many other potential benefits expected from adopting this technology.
In other words, the expected potential benefits are mainly associated with the decreasing in viscosity, longer
hauling distances, quicker turnover to traffic due to a shorter cooling time, fewer restrictions in non-
attainment areas, improved workability, higher compaction efficiency, lower aging and physical hardening
of the recycled asphalt binder because of the lowering of mix production/compaction temperatures.
Moreover, it has been suggested that HWMA mix technologies are good solutions to further increase
the potential paving benefits associated with the RAP usage, as they make the compaction process easier
than those with virgin asphalt binder. This phenomenon is likely attributed to the fact that the compaction
process is easier because of the reduction in binder viscosity during the mix spreading process (Zaumanis,
2010). In this line, some researchers demonstrated that the workability and compactability of the half-warm
mixture remain excellent at relatively low-temperatures (≤ 80 ºC) (Croteau and Tessier, 2008), which
represents a specific benefit to encourage the use of these mixes in the field (Croteau and Tessier, 2008).
Therefore, they can be spread and compacted in cooler thermal weather due to a slower mix cooling rate in
the workable temperature range of 65-100 ºC, since they can have better workability, compactability and
easier handwork. Moreover, recent works have therefore focused on showing that reducing temperatures to
within the warm/half-warm range and introducing RAP should not compromise the performance of the
mixes in the field (Chang-fa et al., 2014; Dinis-Almeida et al., 2016; Swaroopa et al., 2015).
Page 33
Chapter 2. Literature Review
15
2.4.4 Production benefits
The half-warm mix technology enables to reduce production and compaction temperatures
compared with other existing paving solutions offered by the asphalt paving market. In other words, the
HWMA mix facilitates the reduction (1) of the asphalt binders’ viscosity by enabling the bonding and
coating of the recycled aggregates at lower temperatures (Hill, 2011); (2) increased workability that leads
to the inclusion of higher RAP contents into new mixes; lower pavement compaction energy to achieve the
target benchmark density (Bonaquist, 2007); lower thermal susceptibility (Hurley and Prowell, 2006;
Jamshidi et al., 2013), longer pavement service life (Rodríguez-alloza et al., 2015), and less RAP binder
ageing because of the decrease in the production/compaction temperatures, enabling a less brittle and less
stiff mixture, while preventing fatigue cracking issues at low thermal gradients (Chiu et al., 2008; Wagoner
et al., 2005).
In this context, Chiu et al., (2008) reported a remarkably eco-burden impact reduction of 23%
because of the decrease in energy consumption and asphalt binder content, required to heat and dry the
virgin aggregates during mix production. Moreover, the decrease in production/compaction temperatures
entails significant advantages in terms of reduction of harmful emissions, energy consumption and hence
economic costs savings (Coppola et al., 2016; Kristjánsdóttir et al., 2007; McDaniel et al., 2001). The
decrease in manufacturing temperature helps to place asphalt plants closer to metropolitan areas
(Kristjánsdóttir et al., 2007) and prevent the shutdown of asphalt plants if they do not meet air quality
standards (Hill, 2011).
2.4.5 Drawbacks
Despite the economic, environmental, and technical advantages associated with the use of half-warm
mix recycling technology, there still remain some questions to be answered concerning their production,
durability, quality control and long-term mechanical performance properties in the field. In this line, the
typical concerns that can be drawn from the state-of-the-art review are summarized as follows:
1. The lack of a good understanding during the mixing between the RAP and other mix components
(Lo Presti et al., 2016).
2. The main restriction and hindrance in the widespread use of total RAP contents of up to 100% is the
uncertainty of the long-term mechanical performance and lack of a system that allows having a
better selection of the materials and mix design (Zaumanis et al., 2016).
3. The often unknown-nature, stocking, and variability in the physical properties of the recycled
aggregates (Bernier et al., 2012; Boriack et al., 2014).
4. The uncertainty regarding the degree of blending between RAP and virgin binder (Shirodkar et al.,
2011).
5. Lack of long-term field experiences and the state-of-the-practice that allow increasing confidence
in using the half-warm emulsified bitumen mixes in wearing course asphalt mixtures.
Page 34
Chapter 2. Literature Review
16
6. A further concern towards the full-scale implementation of this recent technology pertains to its
manufacturing since there are no asphalt batch plants readily available for dealing with 100% RAP
contents, bitumen emulsion, and at half-warm temperatures.
Mechanical performance characterization
This section aims to present a preliminary outlook of the current technical experiences (in-laboratory
and in-field) of mixes containing high and total rates of recycled asphalt, and compare their mechanical
performance with other existing paving solutions offered in the asphalt paving market, such as (1) durability
via water sensitivity/moisture damage; (2) stiffness modulus; (3) resistance to permanent deformation; (4)
resistance to fatigue cracking behavior; and (5) resistance to low temperatures.
2.5.1 Water sensitivity test
In a report submitted to the National Center for Asphalt Technology (NCAT), Kiggundu and
Roberts., (1988) proposed several definitions of stripping phenomenon in asphalt mixtures from the point
of view of a large number of researchers (Breakah et al., 2009; Caro et al., 2008; Petersen et al., 1982;
Tunnicliff and Root., 1984). The progressive functional deterioration of a pavement mixture by the loss of
the adhesive bond between the asphalt cement and the aggregate surface and the failure of the cohesive
resistance within the asphalt cement principally from the action of water (Kiggundu and Roberts, 1988).
Airey et al., (2008) and Capitão et al., (2012) defined the phenomenon as the loss of resistance to water
action caused by the failure at the interface of binder- aggregate or the loss of cohesion in the binder-filler
mastic.
Some researchers reported that mixes containing total RAP content of up to 100%, and manufactured
at low temperatures, tend to develop equivalent moisture damage resistance values compared to the
conventional HMA mixtures, as shown by RAP mixtures that exhibited a percentage of water sensitivity
greater than 85% (Dinis-Almeida et al., 2016; Dinis-Almeida and Afonso, 2015). Other researchers have
concluded that the durability assessed through the moisture damage of RAP-HWMA is quite similar to the
conventional HMA mixture. Other researchers found similar outcomes for RAP mixes. For instance,
Dunning and Mendenhall, (1978) and Kiggundu and Newman, (1987) claimed that the RAP mixtures tend
to have better resistance to water action than those mixes containing only virgin aggregates.
Karlsson and Isacsson, (2006); Mogawer et al., (2012) reported that mixtures with a high RAP content tend
to develop similar or even higher resistance to moisture damage than that of conventional mixes because
the RAP aggregates are covered with a thin film of asphalt binder that impedes the water penetration in the
mix. However, Li et al., (2004) examined the moisture susceptibility of mixes with up to 40% RAP and
found that there was 38% of moisture damage failure rate when using the tensile strength ratio for AC
mixtures. Tabakovi et al. (2010) claimed that the addition of a RAP content higher than 50% might reduce
the durability of the mix. Therefore, a more in-depth analysis is necessary to evaluate the resistance to
moisture damage since it can lead to surface pavement distresses and hence the reduction of the pavement
service life (Boadu, 2005; Sengoz and Agar, 2007).
Page 35
Chapter 2. Literature Review
17
Additionally, the aggregate-binder adhesion will be conducted by characterizing the resistance to
water action via indirect tensile strength (ITS) test, at 15 ºC, according to EN 12697-12:2009. Part 12:
Determination of the water sensitivity of bituminous specimens. The minimum resistance to moisture
damage value to be met for base and binder course asphalt mixtures should be 80% and 85% for wearing
course asphalt mixtures of road pavements. The specimens have to be preferably compacted with the
Marshall impactor by applying 50 impact blows on each face for mixes made up of a maximum aggregate
size equal to or lower than 22 mm. On the contrary, for mixes with a maximum aggregate size above 22
mm, the specimens will be compacted using a vibratory compactor for a short period of 80 ± 5 s, according
to EN 12697-32:2003+A1. Test methods for hot mix asphalt. Part 32: Laboratory compaction of
bituminous mixtures by the vibratory compactor.
2.5.2 Stiffness modulus
The elastic stiffness modulus is a measure of materials ability to distribute the traffic loading
(Gómez-Meijide et al., 2015; Read., 1996), and this one displays the relationship of stress and strain or
viscoelastic characteristics at a given temperature (Yan et al., 2010). The stiffness modulus of bituminous
mixtures can be defined as the resistance to deformation under applied stress conditions; or the ratio of
uniaxial stress and the corresponding strain, which depends on temperature, loading time, physical
consistency of the bitumen (i.e. Penetration grade and softening point) and mineral skeleton; wherein the
bitumen is responsible for the viscoelastic properties, whilst the skeleton mineral influences on the plastic
and elastic properties of the mixture.
The stiffness modulus is a crucial factor to design flexible pavements, as it is directly linked to the
bearing capacity of the material to distribute the loads and also serves as a structural strength indicator of
the mixture (Pasetto and Baldo., 2011). The mixture’ stiffness can be determined by a variety of laboratory
testing methods such as (1) load indirect tensile test, (2) uniaxial repeated load test, (3) four-point bending
beam test. However, the method used and selected to determine the stiffness modulus was based on the EN
12697-26:2012. Test methods for hot mix asphalt. Part 26: Stiffness modulus.
The stiffness modulus of a recycled mixture depends on the type of aggregate and its gradation, but
the most significant factor is the stiffness of the recycled binder contained in the RAP (Rebbechi and Green.,
2005). In this sense, some researchers claim that RAP mixes are usually stiffer and have a higher complex
modulus than those which contain only virgin materials (Li et al., 2004), likely due to chemical aging and
natural hardening process suffered by the asphalt binder in the RAP during its service life. On account of
the increased stiffness of the binder, RAP mixes usually exhibit better (or at least equivalent) resistance to
rutting than conventional mixes (Hajj et al., 2009).
Button et al., (2007) reported that mixes requiring lower manufacturing temperatures, such as HWMA and
CMA, are primarily characterized by having a lower bearing capacity than that of conventional HMA
mixtures, which could lead to a shorter service life under heavy traffic loads and resistance to permanent
deformation issues. However, and opposite to this, Apeagyei et al., (2013) examined the influence of a high
Page 36
Chapter 2. Literature Review
18
RAP content in terms of mixture stiffness, concluding that the addition of up to 30% RAP to AC mixtures
did not produce a considerable effect on it, i.e., the virgin binder’s stiffness influences the stiffness of the
RAP mixture.
Bardesi and Del Val (2017) published an outstanding research manuscript concerning the influence of mix
design considerations on the structural pavement rehabilitation using recycling pavement techniques in 6.3
I-C contexts. They reported that it seems acceptable to assign a lower coefficient of equivalence of 0.8 for
hot in-place recycling of bituminous mixtures (with a RAP content equal to or higher than 50%). In other
words, the higher the RAP content, the more it further goes away from a new bituminous mixture that has
a coefficient of equivalence of 1.0. Additionally, they reported that it makes sense to establish a modulation
for the coefficient of equivalence based on the asphalt batch plant and its capacity for handling and
processing of RAP; but it does not seem feasible to address such considerations in the mix design stage.
2.5.3 Resistance to permanent deformation
The resistance to permanent deformation is referred to as “Rutting” or “Plastic deformation”; It is
defined as the progressive accumulation of tiny irrecoverable deformation strains of each layer of the
pavement structure caused by repetitive shear deformation under traffic loading and at high service
temperatures (Abdulshafi, 1988; Tayfur et al., 2007). Meanwhile, Whiteoak and Read, (2003) defined as
the permanent deformation in the low stiffness response of the material, when the stiffness of the bitumen
is less than 0.5 MPa, resulting in a crucial characteristic that affects durability and load-bearing capacity
(Bernier et al., 2012).
The rutting performance of asphalt mixtures can be assessed by using different devices or methods
that allow determining this feature. Therefore, the standardized wheel tracking devices include the
followings methods: (1) the asphalt pavement analyzer (APA) (Malladi et al., 2015; Yang et al., 2014), (2)
Hamburg wheel tracking device (HWTD) (Collins and Lai, 1992; Lu and Harvey, 2006; Luo and Yang,
2015; Shao et al., 2017), (3) wheel tracking test (small size device WTT: EN 12697-22), (4) LCPC French
wheel tracking tester (large size device – FWTT: EN 12697-22, (4) Asphalt Mixture Performance Tester
(AMPT) based on the Marshall flow number (Alavi et al., 2016; Azari and Mohseni, 2014), and (5) cyclic
compression test or cyclic triaxial test (Goh et al., 2011; Ulloa et al., 2013).
Several studies have shown that the addition of RAP into new mixes improves the load-bearing
capacity and rutting because of the physical hardening and oxidative aging suffered by the asphalt binder
during its initial service life, likely caused due to the evaporation or loss of the lighter bitumen components
(i.e. maltenes and saturates) (Gaarkeuken et al., 2016). For this reason, the addition of high recycled asphalt
contents into new mixtures has been widely used, likely due to its high resistance to some of the most
common surface pavement distresses such as rutting. Therefore, the effects of RAP mixes on rutting
resistance have been reported in other studies conducted by Doyle and Howard, (2013); Lopes et al., (2014);
Zhao et al., (2013), who investigated the resistance to rutting of mixtures containing high RAP contents
using loaded wheel tracking test, and found that the reuse of a high RAP content increases the resistance to
permanent deformation, but it can likely lead to an increase in stiffness modulus because of the reuse of the
Page 37
Chapter 2. Literature Review
19
aged recycled binder (Valdés et al., 2011). In due recognition, mixes containing RAP usually exhibit better
(or at least equivalent) resistance to rutting than conventional mixes on account of the increased stiffness
of the binder (Hajj et al., 2009; Silva et al.,2012).
However, and contrary to popular beliefs, some results have been rather less conclusive and contrary
to the general results found by other researchers. For instance, Mogawer et al., (2012) reported that mixtures
containing a high rate of RAP, and fabricated at low temperatures, showed low-rutting resistance values
when using the Hamburg Wheel Tracking Device (HWTD), likely caused due to the decreasing in mixing
and compaction temperatures. To further support this hypothesis, Button et al., (2007) reported that mixes
fabricated at lower temperatures and emulsified bitumen are typically characterized by having a lower load-
bearing capacity and rutting performance than that of conventional HMA mixtures. In this sense, a more
in-depth research is, therefore, necessary to determine whether the use of half-warm mixes can be feasible,
or not, for their use in base, binder or surface course asphalt mixtures subject to any heavy traffic load
category and thermal zone in Spain.
2.5.4 Resistance to fatigue cracking
Fatigue cracking is one of the most common failure modes of road pavements that are caused by
repeated traffic loading and the action of thermal gradients (Colombier, 1997). There are different
laboratory testing methods to characterize the short- and long-term mechanical performance properties of
half-warm mix recycled asphalt mixtures, according to EN 12697-24: 2007. Test methods for Hot Mix
Asphalt - Part 24: Resistance to Fatigue – Annex E: Indirect tensile fatigue test and Annex D: four-
point bending beam test.
Over the last few decades, the addition of recycled asphalt into new mixtures has been widely used
(≥30%), likely due to its high resistance to some of the most common surface distresses that occur in road
pavements, such as rutting. However, it appears that the reuse of high RAP contents into new mixtures can
lead to an increase in oxidation levels due to the hardening and the natural aging process suffered by the
recycled binder during its service life. For these reasons, the aged RAP binder increases mixture stiffness
(Li et al., 2004; Li and Gibson, 2016; Shah et al., 2007), which can lead to early fatigue cracking issues
(Al-Qadi et al., 2012; Al-rousan et al., 2008; Daniel et al., 2010; Shah et al., 2007) and low temperature-
brittleness (Terrel et al., 1992). The stiffening and aging of the recycled binder are the main reasons for the
reluctance of local administrations and researchers to allow the addition of high and total RAP contents in
the final mixture design (Mogawer et al., 2012; Willis et al., 2012).
These facts are likely caused by the fact that the recycled asphalt binder becomes stiffer and more brittle.
It is also likely caused by the loss of visco-elastic properties and ductility suffered by the recycled binder
during its service life - making it more susceptible to fatigue cracking than that of the virgin asphalt binder.
These issues are in general agreement with other recent studies conducted by Shah et al., (2007) and
Zaumanis et al., (2014), who claimed that RAP mixes tend to typically become less resistant to fatigue
cracking behavior than conventional HMA mixes. Therefore, an increase in stiffness binder, together with
the loss of ductility can be considered as detrimental to the fatigue cracking or fracture resistance of the
Page 38
Chapter 2. Literature Review
20
asphalt binder (Motamed et al., 2014). In this regard, these facts, along with some drawbacks arising from
the loss of uniformity of the recycled aggregates and type of gradation may considerably affect the
mechanical performance properties such as fatigue, rutting resistance and water susceptibility (Bernier et
al., 2012). West et al. (2013) found that the stiffness modulus of mixes with up to 55% RAP increased by
25–60% when compared to virgin mixtures.
Nonetheless, several experimental results are somewhat less conclusive regarding their performance. For
instance, Dinis-Almeida et al., (2016a) reported that mixes containing up to 100% RAP have demonstrated
to exhibit better (or at least equivalent) fatigue cracking resistance when compared to conventional HMA
mixes, without adversely affecting the water sensitivity. In this line, Huang et al., (2004); McDaniel et al.,
(2012); Tabaković et al., (2010) claimed that the reuse of RAP could lead to significant improvements in
the fatigue life of mixes.
Shu et al. (2008) examined the performance of mixes containing 10, 20, and 30% RAP using various fatigue
criteria. They found that the addition of RAP appeared to either increased or decreased the fatigue life of pavements. In this line, Hajj et al. (2009) reported that the inclusion of RAP could result in either poorer or
better fatigue cracking resistance depending on the source of this material.
Al-Qadi et al., (2012); Huang et al., (2005a, 2004); McDaniel et al., (2012); Shu et al., (2008) and Sargious
and Mushule, (1991) reported an increased fatigue life of mixtures containing up to 40-45% RAP compared
to conventional HMA mixes. These results can be explained as a result of reduced tensile strains in the
mixture due to increased stiffness and improved binder-aggregate adhesivity (Zaumanis et al., 2014). For
instance, Huang et al., (2005) reported that the hardening and chemical aging suffered by the recycled RAP
binder makes a stiff and thin layer at the interface of the RAP to reduce the stress and strain conditions, and
lead to improving the mixtures’ fatigue cracking resistance.
Finally, more in-depth research analysis of the fatigue behavior of foamed and emulsified mixes is
therefore of critical importance to guarantee their satisfactory fatigue performance during their service life
and also strengthen confidence in using these mixes containing high or total rates of RAP material.
2.5.5 Resistance to low-temperature fracture
The low-temperature fracture can be considered as one of the main concerns arising from the long-
term mechanical performance of road pavement. Despite this assumption, several studies are focused on
showing that the resistance to fatigue of half-warm mixes with high and total RAP contents can exhibit
similar, or equivalent, fatigue cracking behavior to conventional HMA mixes, regardless of the fatigue test
method used for their characterization (e.g., four-point bending (4PB) beam fatigue and indirect tensile
fatigue test) and semi-circular bending (SCB) test for crack propagation.
Botella et al., (2016) presented the fatigue cracking performance results of half-warm mix recycled asphalt
mixtures with high (50%) and total RAP contents (100%) using emulsified bitumen with three different
penetration grade bitumen (35/50, 50/70 and 70/100 latex) at three temperatures (20 ºC, 5 ºC, and -5 ºC).
Page 39
Chapter 2. Literature Review
21
To this end, two distinctive test methods were selected to characterize the fatigue mixture behavior in the
laboratory such as (1) the semicircular bending (SCB) test or Fenix Test; and (2) cyclic uniaxial tension-
compression strain sweep (EBADE). They claim that the half-warm mixes with total RAP contents (100%)
appear to have similar fatigue cracking behavior and fracture energy, at different low testing temperatures
(20 ºC and -5 °C), in comparison with conventional HMA mixes. In other words, the HMA mixture showed
a remarkable increased in the complex modulus of 35% compared those mixes produced with 100% RAP.
Nosetti et al. (2018) assessed the effect of the recycling process and binder type on bituminous mixtures
with 100% reclaimed asphalt pavement. The authors claimed that it is possible to manufacture half-warm
mix recycled asphalt mixtures with similar, or equivalent, flexibility, ductility, and stiffness compared to
that of the hot recycled mixture at three temperatures (20 ºC, 5 ºC and – 5 ºC).
Self-healing analysis of asphalt mixtures
2.6.1 Laboratory and field studies
The self-healing phenomenon or the capability of recovery of microdamage in bituminous mixtures
dates back from the 60s (Bazin and Saunier, 1967; Raithby and Sterling, 1990). The self-healing process is
defined as the recovery of material properties and decreasing in cracking of bitumen and asphalt mixes
(Little et al., 1998). The self-healing is capable of counteracting the development of microdamage (Karki
et al., 2014) in-situ pavements (Gallego et al., 2013). The recovery of microdamage can be divided into two
phases: (i) physicochemical and (ii) mechanical way. There are two conventional heating methods used,
either in-laboratory or in-situ, to speed up the self-healing (microcracks) process of bituminous mixtures,
i.e., Microwave (MW) radiation and Induction heating method. Microwave radiation is a healing technique
by which asphalt materials are exposed to alternating electromagnetic fields, in the order of Megahertz
(Flores et al., 2018; Franesqui et al., 2017; Norambuena-contreras and Garcia, 2016), while the induction
heating system consisted of mixing ferrous materials in the asphalt mixture exposed to electromagnetic
fields, with frequency of Kilohertz (García et al., 2012). In other words, it induces an electrical current in
the ferrous particles that increase their temperature by the Joule principle, and the heat energy diffuses into
the asphalt mixture, increasing the temperature of bitumen (Schlangen and Vliet, 2011).
The self-healing process can be understood as the ability of bituminous materials to recover their
initial performance properties (i.e., due to the loss of the lighter fractions of the asphalt binder during its
service life) by wetting and interdiffusion between the two phases of the micro-crack (Butt et al., 2012),
which occurs during rest periods (Mazzoni et al., 2016), and/or when the material is exposed to high
temperatures (García, 2012; Liu et al., 2011). In fact, there are two ways of self-healing methods in
bituminous mixes such as adhesive healing associated with the aggregate-bitumen interface bonding and
the cohesive healing of the mastic (Little et al., 2001); whilst the external factors influencing the self-healing
properties of the mixtures can be classified as follows: (1) bitumen properties such as viscoelastic properties
(Kim et al., 1991), wetting (i.e., due to the bonding adhesion of two crack surfaces by surface free energy
- SFE) (Ayar et al., 2016; Lytton et al., 1993), oxidative aging (Ofori-Abebresse, 2006), and diffusion and
randomization of asphaltene structure (Bhasin et al., 2011; Phillips, 1998); (2) asphalt mix composition
Page 40
Chapter 2. Literature Review
22
(LEE et al., 2000); and (3) environmental conditions (e.g. temperature, loading and rest periods) (Bhasin et
al., 2011; Castro and Sánchez, 2006; Tabakovic and Schlangen, 2015).
In order to address these issues, some examples of innovative self-healing techniques reported in the
literature review that have the potential to speed up the recovery of macrodamage in bituminous mixtures
include (but are not limited to): (i) Nanoparticles (i.e. Nanoclay and Nanorubber) (Fang et al., 2013; Qiu et
al., 2009); (ii) Induction heating by electrically conductive fibers and fillers (e.g. steel wool, scrap tire wire,
silicon carbide, graphite and iron filings) (García et al., 2009; Schlangen and Vliet, 2011); (iii) Microwave
(MW) heating radiation energy combined with industrial by-products such as electric arc furnace steel
(EAFS) slag aggregates (Ameri and Behnood, 2012a; Franesqui et al., 2017; Gallego et al., 2013; Skaf et
al., 2017) and recycled asphalt pavement (RAP) (Benedetto and Calvi, 2013); and (iv) Microcapsules
incorporating some healing agents (i.e. sunflower oil, and prepolymers of melamine-formaldehyde) (Al-
Mansoori et al., 2017; Su and Schlangen, 2012).
2.6.2 Self-healing with EAFS aggregates
Gallego et al. (2013) assessed the technical viability of heating asphalt mixtures with microwaves energy
and electromagnetic induction in the laboratory. They added 0.2% steel wool (10 mm length) by mass of
the mixture to improve energy efficiency, and that this percentage was ten times less than the quantity
recommended when employing electromagnetic induction for heating. Therefore, the use of microwaves,
thus, appears to be a promising technique for in situ asphalt pavement heating. However, some researchers
claim that there remain some in-situ limitations regarding the use of steel wool since they require a lot of
time to be heated (García et al., 2013).
Gallego et al., (2017) studied the use of additives (i.e. steel wool, scrap tire wire, silicon carbide, iron
filings) and electric arc-furnace slag using four different contents (2%,5%,10%,20%) to improve the
capacity and ability of bituminous mixtures to be heated by microwaves (MW) radiations. They claimed
that 5% of steel slag aggregates (by total weight of the mixture) represents the best alternative for self-
healing of the mixtures because of technical and economic reasons. They claimed that EAFS can be
regarded as the optimal component for the production of bituminous mixtures since they are susceptible to
microwave heating. Asi, (2007) conducted a replacement of 30% limestone aggregates with EAFS
aggregates in a bituminous mixture, thereby obtaining the highest skid resistance using the British
Pendulum Tester (BTP) for EAFS mixes.
Kandhal and Hoffman (1997) evaluated the HMA mixtures containing steel slag and control aggregates
(limestone) were subjected to hot-water conditioning and Lottman freeze-and-thaw to define possible
issues. They found that HMA mixtures fabricated with EAFS fine aggregates showed higher Marshall
stability (between 20 and 30%) than the control mixtures fabricated with limestone aggregates; whilst other
researchers claim that surface course mixtures containing thermal power plant wastes exhibited inadequate
performance and faster wear of the aggregates caused by traffic load conditions (Shuler, 1976; Xie et al.,
2012).
Page 41
Chapter 2. Literature Review
23
Bosisio et al. (1974) found that by using a load-frequency of up to 4.5 GHz, the microwave radiations can
reach up to ~ 12 cm depth in wearing course asphalt mixtures. Al-Ohaly and Terrel (1988) studied the
effect of microwave heating on adhesion and moisture damage on asphalt mixtures. They found that
microwave energy improves the binder-aggregate adhesion and, hence, the water sensitivity of the asphalt
mixtures.
Stock et al., (1996) reported that the steel slag aggregate surfaces presented an adequate long-term skid
resistance than that of 14-mm rock chippings, and at the same time exceed the behavior expectations of
these aggregates with similar polished stone values (PSV). With this in mind, Fernández et al. (2013)
assessed the PSV test and its relationship with petrographic parameters and surface micro-roughness in
both natural and industrial by-product aggregates. They found that the PSV value of EAFS aggregates was
way much higher than conventional aggregates such as quartzite gravel and diorite.
Liu et al. (2018) evaluated the heating characteristics and induced healing efficiencies of asphalt mixtures
via induction and microwave heating. In this context, asphalt samples were heated by two heating methods:
(1) an induction heating machine with an output power of 8.3 kW and a load frequency of 123 kHz; and
(2) a microwave machine using a loading frequency of 2.45 GHz, and output power of 5 kW. They found
that the heating speed by heating induction was way much higher than that of the microwave machine
heating, under a similar output power and the same radiation method. However, the sufficient heating depth
of microwave heating is way much higher than that of induction heating. Figure 5 shows the microwave
machine with a microwave magnetron, control panel, and metal cover. The microwave launcher radiates
waves from the top of the device to heat the beam samples.
Figure 5. Microwave heating machine for porous asphalt concrete mixture slabs (Liu et al., 2018)
Page 42
Chapter 2. Literature Review
24
Surface friction characteristics
2.7.1 Macrotexture
Macrotexture is related to the large scale texture defined by the shape and size of stone particles contained
on the surface course mixture (Austroads, 2011). Pavement macrotexture provides the hysteresis
component of the friction and allows for the rapid drainage of water from the pavement. In addition to this
primary task, higher macrotexture can provide better escape paths for water by reducing aquaplaning and
thus improving adhesion friction. The surface macrotexture depth can be calculated, according to EN
13036-1:2010. Road and airfield surface characteristics. Test methods. Measurement of pavement surface
macrotexture depth using a volumetric patch technique.
For this reason, the macrotexture of each sample was measured after compaction using a modified sand
patch test (EN 13036-1), in which 5000 mm3 of sand were spread over the surface of the specimen with the
spreading tool defined by the standard. The voids on the surface of the specimen were filled until the sand
reached the peak level (Ramírez et al., 2015). Table 2 shows how the pavement texture has been classified
into three ranges based on the wavelength of its components: microtexture, macrotexture, and megatexture.
Table 2. Texture classification range
Texture classification Relative Wavelengths
Microtexture λ < 0.5 mm
Macrotexture 0.5 mm < λ < 50 mm
Megatexture 50 mm < λ < 500 mm
Roughness/Smoothness 0.5 m < λ < 50 m
Figure 6 shows the microtexture that refers to the smallscale texture on the surface of a stone particle,
which is more influenced by both characteristics of the aggregates and aggregate source, while the
macrotexture depends on the large-scale texture defined by the shape and size of stone particles presented
on the road surface.
Figure 6. Microtexture and surface macrotexture depth
Page 43
Chapter 2. Literature Review
25
Conclusions of the literature review
The main conclusions and findings that can be drawn from the current-state-of-the-art review and state-of-
the-practice are summarized below:
• The study of the issues related to the fatigue cracking resistance of half-warm mixe recycling
technology with 100% RAP has not yet been thoroughly studied in the current state-of-the-art
review and state-of-the-practice, and, thus, remains shrouded in uncertainty. Therefore, a more in-
depth investigation is necessary to draw more consistent conclusions from the mixtures’ fatigue
behavior at low test temperatures (5 ºC).
• It was found in the literature review that there is no general agreement concerning what the most
appropriate compaction test method is, nor is there a full consensus regarding the required mix
compaction energy should be used for the production and characterization of half-warm mix
recycling technology with 100% RAP and emulsified bitumen.
• There still remain some technical gaps to be filled in and questions to be answered concerning
whether there is a positive effect of an accelerated curing/drying treatment on the development of
the mechanical performance properties (indirect tensile strength (ITS) and stiffness modulus) of
half-warm emulsified mixes containing 100% recycled asphalt pavement.
• The volumetric and mechanical performance of half-warm mixes with 100% RAP and emulsified
bitumen have not yet been compared with a corresponding conventional HMA mixture, after in-
plant manufacturing and in-situ, in terms of fatigue resistance, rutting, indirect tensile strength,
and stiffness modulus.
• No research papers are addressing the self-healing analysis of half-warm mix recycled asphalt
mixtures, with electric arc furnace steel slag (EAFS) and total recycled asphalt pavement (RAP)
contents, using a thermomechanical treatment (i.e., a microwave and mechanical recompaction
treatment) in the laboratory. The sel-healing ratio (HR) of the mechanical performance (stiffness
modulus and indirect tensile strength) and energy consumed (kWh) have not been calculated for
this recent technology, either.
In summary, one can say that the literature review revealed that the use of half-warm mix recycled
asphalt (HWMRA) mixtures with emulsified bitumen represent a tremendous opportunity for the asphalt
paving industry to reduce the costs of construction and maintenance and rehabilitation practices. Moreover,
there is a consensus about the environmental, social, and economic benefits provided by this greener
production technology compared with other existing paving techniques such as hot mix asphalt (HMA),
warm mix asphalt (WMA) and cold mix asphalt (CMA).
Page 45
27
Chapter 3
3 MATERIALS AND TEST PROCEDURES
Introduction
This Chapter outlines the mixture testing plan along with a preliminary laboratory research study
aimed at determining the physical properties of the materials (i.e., reclaimed asphalt pavement (RAP),
virgin aggregates, asphalt binder, and cationic emulsion) that were selected for producing HWMRA
mixtures. In this recognition, the characterization of the materials, as well as the mixtures, was based on
the European Committee for Standardization’s (EN) standards and, in some cases, the Spanish Technical
Specifications (NLT) developed by the Centre for Public Works Studies and Experimentation (CEDEX)
for highway testing.
Materials
3.2.1 RAP characterization
The reclaimed asphalt pavement (RAP) material was recovered from a test road section and
classified in two fractions: coarse (5/25 mm) and fine (0/5 mm). For the coarse fraction 5/25 mm (60%) the
residual binder content was found to be 2.60 (%, o/RAP), whereas, for the fine fraction 0/5 mm (40%), this
content was 6.45 ± 0.1 (%, o/RAP). As a result, the content of the aged binder in the RAP (2.60 * 0.6 +
6.45 * 0.4) was 4.14% over the weight of RAP. Following the dosing procedure, 2.5% o/RAP of emulsion
(with 60% residual asphalt binder) was added to the RAP material (60% * 2.5%), 1.5% of residual asphalt
binder is obtained and added in the aged RAP binder (4.14%o/RAP), resulting in a total residual binder
content of 5.64%o/RAP for 2.5% emulsion; whilst, for 3.0% emulsion, this content was found to be
5.94%o/RAP.
In this regard, both RAP fractions (0/5 and 5/25 mm) were homogenized, quartered, treated and
characterized to determine their residual binder content, through the centrifuge extractor method (EN
12697-1:2012. Part 1: Soluble binder content), and white and black RAP aggregate grading curves. The
binder’ consistency properties were determined in terms of penetration test (EN 1426:2015) and softening
point temperature, by ring and ball (R&B) method, according to EN 1427:2015; where the average
penetration value of the aged RAP binder was found to be 17 dmm and softening point temperature of 67.2
ºC. Moreover, white and black RAP aggregate grading curves were also determined, that is, the white
curves can be defined as the RAP gradation after extracting the residual aged binder while the black curves
represent the RAP gradation containing the recycled asphalt binder. Figure 7 depicts the black and white
Page 46
Chapter 3. Materials and test procedures
28
RAP grading curves of both recycled aggregate fractions (0/5 and 5/25 mm) in which the dashed lines
represent the black grading curves, while the solid continuous lines depict the white grading curves.
Figure 7. White and black grading curves for both RAP fractions
3.2.2 Bituminous emulsion characterization
In this research study, two different cationic slow-setting bitumen emulsions (C60B5) were
formulated and selected, depending on the penetration grade bitumen to be used, i.e., (1) a 50/70 pen. grade
with a residue bitumen content of 61.2% by total weight of the emulsion; and (2) a second bitumen emulsion
made up of a rejuvenator binder, with a softer penetration bitumen of 160/220; where the bituminous
emulsion meets the current specifications of the framework for specifying cationic bituminous emulsions,
according to EN 13808:2013. The characterization of the bituminous emulsion consisted of the analysis of
the viscosity at 25 ºC, water content, the residue on sieving, the residual binder content, and penetration
test of the residual binder. Table 3 shows the general technical characteristics of the cationic bituminous
emulsion used to produce both HWMRA mixtures.
0
10
20
30
40
50
60
70
80
90
100
0,01 0,1 1 10 100
Pass
ing
(%)
Sieve size (mm)Black RAP curves (0/5 mm) White RAP curves (0/5 mm)Black RAP curves (5/25mm) White RAP curves (5/25 mm)
Page 47
Chapter 3. Materials and test procedures
29
Table 3. Technical characteristics of the cationic bituminous emulsions (C60B5)
Characteristics Test Method Unit C60B5 160/220
C60B5 50/70
Penetration, at 25 °C (100 g, 5 s) EN 1426:2015 0.1 dmm 183 66
Residual bitumen content (from water content) EN 1428:2012 % 61 61.2
Water content NLT 137 % 39 38.8
Recovered oil distillate from emulsion by
distillation
EN 1431:2009 % 0 0
Saybolt-Furol Viscosity, at 25ºC EN 12846-1:2011 s 23 26
Storage stability by Sieving
(0.5 mm sieve size)
EN 1429:200 % 0.01 0.01
pH NLT 195 3.0 3.0
3.2.3 Asphalt binder characterization
A conventional dense graded asphalt concrete mixture (AC 16 D) was designed with a conventional asphalt
binder of 35/50 penetration grade. The physical properties of the asphalt binder used to produce the HMA
mixture are shown in Table 4.
Table 4. Physical properties of the virgin asphalt binder
Physical properties Reference unit Test method Value
Penetration test dmm EN 1426 42
Softening point °C EN 1427 55.6
Penetration index - Annex A -0.33
Relative density g/cm3 NLT-122 1.03
Aggregate grading curve
3.3.1 HWMRA 100% RAP mixture
The particle size distribution of the recycled material fell within the threshold sieve size values
stipulated by the Art. 20 of PG-4 “In-situ recycling of asphalt mixtures with bitumen emulsion (Spanish
Ministry of Public Works, 2017). The proportion of RAP aggregates, after the screening, was determined
to be 40% in the fine fraction (0/5 mm) and 60% in the coarse fraction (5/25mm). This proportion was
selected (1) in order to deal with a RAP content equal to 100%; (2) to ensure the mixture’ homogeneity
(i.e., control mixture quality, fines particles and mastic content in the mixture design). Table 5 and Figure
8 show the selected recycled aggregate grading curve of the HWMRA 100% RAP mixture, as well as the
Page 48
Chapter 3. Materials and test procedures
30
upper and lower threshold values of the RE2 particle size distribution band, where this band is selected for
pavement layer thickness within the range of 6-10 cm (Spanish Ministry of Public Works, 2017). In this
study, total RAP content equal to 100% means that there was no need to incorporate new virgin aggregates
in the mix design, and 2.5% emulsion content is added over the weight of RAP.
Table 5. RE2 aggregate gradation band (Spanish Ministry of Public Works, 2017) and gradation curve adopted
Sieve size UNE (mm) 32 22 16 8 4 2 0.50 0.25 0.063
Upper limit 100 100 89 77 58 42 20 10 3
Lower limit 100 80 62 49 31 19 2 0 0
Grading curve 100 99.8 88.1 70.96 46.50 26.94 9.64 5.10 0.86
Figure 8. RE2 aggregate gradation sieve sizes and aggregate grading curve adopted
0
10
20
30
40
50
60
70
80
90
100
0,01 0,1 1 10 100
Pass
ing
(%)
Sieve size (mm)
Upper limit - RE2 Lower limit - RE2 Grading curve adopted
Page 49
Chapter 3. Materials and test procedures
31
3.3.2 Conventional HMA mixture
The composition and aggregate grading curve of the conventional mixture fell within the threshold
values of asphalt concrete (AC 16 D) mixture, as illustrated in Table 6 and Figure 9.
Table 6. AC 16 D threshold limit values and selected grading curve adopted for comparison
Sieve size UNE (mm) 22.4 16 8 4 2 0.5 0.25 0.063
AC 16 D - Upper limit 100 100 74 59 46 27 20 8
AC 16 D - Lower limit 100 90 64 44 31 16 11 4
Grading curve selected 100 96.7 70.5 55 34.5 16.1 12.5 6.9
Figure 9. Aggregate grading curve of the conventional mixture selected
0
10
20
30
40
50
60
70
80
90
100
0,01 0,1 1 10 100
Pass
ing
(%)
Sieve size (mm)
AC 16 D- Upper limit AC 16 D - Lower limit HMA AC 16 D
Page 50
Chapter 3. Materials and test procedures
32
Testing program
The experimental testing program has been broken down into two phases: the volumetric characteristics
and mechanical performance properties of the mixtures as follows:
Volumetric characteristics
• Determination of maximum density of bituminous specimens, according to EN 12697-5
• Determination of bulk density of bituminous specimens, according to EN 12697-6
• Determination of void characteristics of bituminous specimens, according to EN 12697-8
• Marshall impact compactor, according to EN 12697-30 and Marshall Test, according to EN
12697:34
• Gyratory compactor, according to EN 12697-31
• Static compression stress load by double-plunger action, according to NLT-162/00
• Determination of water sensitivity, according to EN 12697-12
Mechanical performance
• Determination of the resistance to permanent deformation, according to EN 12697-22
• Determination of the stiffness modulus, according to EN 12697-26
• Determination of the resistance to fatigue, according to EN 12697-24
• Determination of the indirect tensile fatigue test, according to EN 12697-23
The next Chapter aims to describe the performance tests, specialized equipment, and test procedure
used for this study. These laboratory tests methods give information on the recycled binder’s consistency
properties (i.e., penetration test and softening point by R&B method), resistance to permanent deformation
using the wheel tacker, stiffness modulus, in wet and in-dry indirect tensile strength (ITS), susceptibility
to moisture damage and fatigue resistance using two performance criteria: (1) indirect tensile fatigue test
and (2) four-point bending (4PB) beam test method. Performance results will be compared with each
pavement section’s field conditioning results to determine how laboratory performance tests compare with
field cores.
Page 51
33
Chapter 4
4 METHODOLOGY
Introduction
This research study has been broken down into six phases. In the first phase, preliminary laboratory
studies were conducted to characterize the RAP that was used in the production of half-warm mix recycled
asphalt (HWMRA) mixtures as well as the remaining mixture components such as bituminous emulsion
and asphalt binder. The second phase consisted of comparing three different laboratory compaction test
methods (i.e. Marshall Impactor, Static Compressive Load and Gyratory Compactor) in order to define the
most suitable compaction test method and hence the mix design compactive effort that allows to posteriorly
obtain the benchmark density in the field; where Ndesign represents the number of gyrations required to
match the specimens’ benchmark density with the density expected from the field. Moreover, the mix
design procedure was based on the comparison of the (1) Immersion-Compression (I-C) test (NLT 162/00:
Effect of Water on Compressive Strength of Compacted Bituminous Mixtures) and (2) the indirect tensile
strength ratio (ITSR), according to EN 12697-12:2018: Determination of the water sensitivity of
bituminous specimens.
In the third stage, a preliminary research study was conducted to determine the effect of five
emulsion contents (0%, 2.0%,2.5%, 3.0%, and 3.5%o/RAP) on the volumetric and mechanical performance
properties of the mixtures. This characterization was conducted in terms of bulk density, by SSD conditions,
air voids content, stiffness modulus at 20 ºC, and indirect tensile strength at 15 ºC. To do this, an average
of three cylindrical specimens for each emulsion content were prepared (with a diameter of 100 mm and
63 mm in height) to determine the optimal emulsion content (OEC) that allows better optimization of the
ultimate mixture design. An assessment of the effect of four accelerated curing treatments (0, 24, 48, and
72 h) on mixtures’ mechanical performance (i.e., ITS and stiffness modulus) was conducted.
In the fourth phase, an advanced mechanical characterization was carried out based on four
different behavior criteria such as stiffness modulus at 20 ºC, indirect tensile strength (ITS) at 15 ºC, rutting
performance using the wheel tracker (50 ºC and 60 ºC), and fatigue cracking strength, at 20 ºC, via four-
point (4PB) bending beam test method. For the fifth phase, in-plant produced samples were collected and
tested in the laboratory in order to characterize the recovered RAP binder and also to verify their compliance
in terms of grading curves and binder content in the final mix design, air voids content, stiffness modulus
at 20 ºC, and indirect tensile strength at 15 ºC. Indirect tensile strength (ITS) and stiffness modulus values
were contrasted with those values obtained from the pavement cores (2.5% and 3.0% over the weight of
RAP) after pavement construction. After that, a set of pavement cores were extracted from the field after
pavement construction, according to EN 12697-27:2017. Part 27: Sampling, to verify the compliance of
Page 52
Chapter 4. Methodology
34
the minimum percentage of 98% of the benchmark density of the laboratory specimens compacted at 70
load cycles with gyratory compactor and standard conditions (0.82º, 600 kPa, 30 rpm) by EN 12697-31.
As for the sixth phase, the surface friction characteristics were evaluated and calculated in terms
of macrotexture and international roughness index (IRI). The macrotexture of the mixtures was conducted,
EN 13036-1:2010. Road and airfield surface characteristics. Test methods. Measurement of pavement
surface macrotexture depth using a volumetric patch technique. In turn, the surface roughness index was
evaluated, according to EN 13036-6:2008. Road and airfield surface characteristics. Test methods.
Measurement of transverse and longitudinal profiles in the evenness and megatexture wavelength ranges.
Figure 10-11 summarizes the main six phases followed in the experimental methodology of the Chapter.
Phase 2: Compaction test procedures • Air voids, density • ITS and stiffness modulus
Gyratory compactor (EN 12697-31) (0.82º, 600 kPa, 30 rpm) at 80 ºC • Up to 200 compaction gyrations
Marshall impactor hammer (EN 12697-30) • 75 implact blows • 100 impact blows
Static compressive strength load by double-plunger (NLT-161/98) • 21 MPa static load and; • 10 MPa static load;
Immersion-Compression (I-C) test (NLT 162/00) - Specimen’ dimensions: height = 100
mm and Ø=101.6 mm) based on Art. 20 of PG-4 (OC 8/01)
Phase 3: Mixture design • Determining the optimum emulsion
content (OEC) • Selection of the mixtures studied
Phase 1: Characterization of Materials • RAP material (0/5 and 5/25 mm) • Gradation of black/white RAP curves • Emulsion characterization • Aggregate grading curve adopted
•
Phase 4: Advanced mechanical characterization of the mixture • Stiffness modulus (ITSM) • Rutting characterization • Four-point bending (4PB) fatigue test
Experimental Methodology
Accelerated curing/drying treatments (0, 24, 48, 72 h) at 50 ºC • Stiffness modulus at 20 ºC • Indirect tensile strength at 15 ºC
Page 53
Chapter 4. Methodology
35
Figure 10. Detailed flow chart of the experimental methodology
Figure 11. Graphic representation of the experimental methodology of this Chapter
Weighing and dosing
Gyratory compactor
Mixing 100 rpm
Curing treatment
ITSMat 20 ºC
ITS at 15 ºC
Ruttingtest
Fatiguecracking
(4PB) Up-scaled to a batch plant
HWMRAat 100 ºC
Mixture cmpaction
Sampling and cores
Profilograph IRI FWD
Phase 5: Lab/field comparison results • Quality control after in-plant
manufacturing • Fatigue cracking resistance • Sampling and testing after pavement
construction • Benchmark density (𝜌b= 98%) • ITS at 15 ºC, and ITSM at 20 ºC
Phase 6: Surface friction characteristics
• Macrotexture • International roughness index (IRI)
1st phase: Weighing, mix design and specimen
compaction with the gyratory compactor
2nd -3rd phase: Optimization of the mixture design with an
accelerated curing treatment for 72 h at 50 ºC
4rd phase: Advanced
mechanical characterization of the mixture: Stiffness, rutting and four-point bending (4PB)
beam fatigue cracking
5th -6th phase: Real-scale
production process in a batch plant, in-plant samples
collection, sampling, extraction of pavement cores
7th phase: Surface friction characteristics and structural strength pavement capacity
Page 54
Chapter 4. Methodology
36
Characterization of binder
4.2.1 Penetration and Softening point test
Initially, the binder’ extraction and recovery tests were conducted on both coarse- and fine-aggregate
RAP fractions to obtain the corresponding percentage of recycled asphalt binder, according to EN 12697-
1. Part 1: Soluble binder content. To do this, the recycled asphalt was recovered using a rotary evaporator
after the solvent extraction method, according to EN 12697-3:2013. Part 3: Bitumen recovery – Rotary
evaporator. Figure 12 shows the procedure followed for the binder’ physical properties characterization
(i.e., penetration test, and softening point by ring and ball (R&B) method) used in Spain.
Figure 12. Binder’s physical characterization in terms of penetration and softening point
Volumetric characteristics
4.3.1 Determination of the maximum density
The mixtures’ volumetric characteristics were determined in the laboratory, according to EN 12697-
8:2003. Part 8: Determination of void characteristics of bituminous specimens using the bulk density, by
saturated surface dry (SSD) conditions, according to EN 12697-6:2012. Part 6: Determination of bulk
density of bituminous specimens, and the maximum density was obtained using a pycnometer, according
to EN 12697-5:2010. Part 5: Determination of the maximum density - Procedure A: Volumetric method.
In the mathematical procedure, the maximum density of a bituminous mixture is calculated from its
composition (binder content and aggregate content) and the densities of the constituent materials; whereas,
for the volumetric and hydrostatic procedures, the maximum density of bituminous mixture is determined
from the volume of the sample without voids and from its dry mass. In this regard, an average of three
cylindrical shaped specimens was prepared and manufactured to determine the bulk density while the
maximum density was calculated using two asphalt samples with the pycnometer. The maximum density
was calculated according to Volumetric method as shown in Eq 4.1
𝑃𝑚𝑣 =(𝑥
𝑦2− 𝑥𝑦2)
𝑉𝑝(𝑥𝑦2− 𝑥𝑦2)/ 𝑃𝑤 (4.1)
Pmv is the maximum density calculated with the volumetric method (g/cm3); is the mass of the empty
pycnometer. Figure 13 shows the maximum density test with a residual pressure of 4 kPa for 15 min.
Binder recovery Penetration Penetration
Softening point
Softening point
Page 55
Chapter 4. Methodology
37
Figure 13. Determination of maximum density using pycnometers on non-compacted specimens
4.3.2 Determination of bulk density of bituminous specimens
The bulk density of an intact compacted bituminous specimen is determined from the mass of the
specimen and its volume. The mass of the specimen is obtained by weighing the dry specimen in air. The
volume of the specimen is obtained from its mass in air and its mass in water. In the dry procedure, the
mass in water is determined without pre-treatment. In the SSD-procedure, the specimen is first saturated
with water, after which its surface is blotted dry with a towel, according to EN 12697-6, Bituminous
mixtures — Test methods for hot mix asphalt — Part 6: Determination of bulk density of bituminous
specimen – saturated surface dry (SSD) conditions, as illustrated in Figure 14.
Figure 14. Determination of bulk density by SSD conditions,: (a) Dry (no water in the sample)1; (b) SSD water fills
the HWMRA air voids; and (c) submerged in a water bath at 25 ºC
1 https://www.pavementinteractive.org/
Dry - SSD - Wet Sample weighingImmersion
Page 56
Chapter 4. Methodology
38
The masses are calculated on an average of three specimens, and the final value of the bulk density is
assumed to be the average value of the three measurements. The SSD value is calculated based on Eq. 4.2:
𝑃𝑏,𝑠𝑠𝑑 = 𝑚1
𝑚3−𝑚2 ∙ 𝑃𝑤 (4.2)
Where: Pssd is the bulk density of bituminous specimens in g/cm3; m1 is the mass of the dry specimen in
g; m2 is the mass of specimen in water (g); m3 is the mass of the saturated surface-dried specimen in g; Pw
is the density (0.9971 g/cm3) of the water at the test temperature g/cm3.
Posteriorly, the air void content of the compacted specimens was determined, according to EN 12697-
8:2003. Bituminous mixtures – Test Methods for hot mix asphalts – Part 8: Determination of void
characteristics of bituminous specimens. The procedure is calculated based on Eq. 4.3.
𝑉𝑚,𝑠𝑠𝑑 (%) =𝑃𝑚 − 𝑃𝑏
𝑃𝑚 ∙ 100 (4.3)
Where: Pm is the maximum density in g/cm3 (EN 12697-5:2007) and represents the mass per unit volume
without air in a bituminous material at a known test temperature; Pb is the bulk density of the specimen (EN
12697-6:2007) expressed in g/cm3 and represents the mass per unit volume, including the air voids, of a
specimens at a known test temperature, following the SSD method.
4.3.3 Determination of the geometric density
This method, the simplest, determine the volume of the specimens as a function of the height and diameter
measurements. The specimen’s dimensions and geometry were determined by following EN 12697-29:
2002 standard. Bituminous mixtures. Test methods for hot mix asphalt. Part 29: Determination of the
dimensions of a bituminous specimen.
Though it avoids problems associated with the SSD condition, it is often inaccurate because it considers a
perfectly smooth surface, thereby ignoring surface irregularities, i.e., the rough surface texture of a typical
specimen. In accordance with the EN 12697-6:2012 – Annex C, the bulk density in Mg/m3 of the specimen
was firstly calculated by adopting the dimensional procedure Pb, dim, according to Eq. 4.4.
𝑃𝑏,𝑑𝑖𝑚 =(𝑚1)
(𝜋
4 ∙ℎ ∙𝑑2)
∙ 103 (4.4)
Where m1 is the mass of the dry specimen (g), h is the height of the specimen (mm), and d is the diameter
of the specimen (mm). Figure 15 shows how the specimens’ height is measured using a slide caliper, which
provides an accuracy of up to 0.001. They include full-featured electronic tools, with or without IP67
protection optional output.
Page 57
Chapter 4. Methodology
39
Figure 15. Starrett Precision measuring tools and Saw blades
Resistance to water action
The laboratory tests selected to determine the resistance to moisture damage of the mixtures were (a) EN
12697-12:2009. Part 12: Determination of water sensitivity test of bituminous specimens; and (b) the
immersion-compression (I-C) test, according to NLT-162/00: Standard Test Method for Effect of Water
on Compressive strength of Compacted Bituminous Mixtures.
4.4.1 Water sensitivity
The resistance to water attack of the specimens was determined, according to EN 12697-12:2009.
Part 12: Water sensitivity. This test consisted in manufacturing a set of six cylindrical samples, with a
diameter of 101.6 mm and 63.5 mm in height, and compacted by the gyratory compactor using two-thirds
(2/3) of the benchmark compaction energy previously selected, and following the standard compaction
conditions established (0.82º, 600 kPa, and 30 rpm) by the EN 12697-31:2008 standard. The specimens
were classified into two subsets as follows: (1) a dry subset stored at 20 ºC for 72 h, and the wet subset
immersed in-water bath, at 40 ºC, during the same period after a vacuum was selected using the pressure of
6.7 ± 0.3 MPa. Figure 16 shows the in-wet and in-dry conditioning process of the laboratory samples.
Figure 16. Water sensitivity process: (a) vacuum pressure; (b) conditioning process at 15 ºC; (c) and ITS in dry
conditions
Vacumm Conditioning ITS at 15 ºC Specimens (ITS in-dry)
Page 58
Chapter 4. Methodology
40
Following the laboratory standard, the indirect tensile strength (ITS) test was carried out (EN 12697-
12:2009. Part 12: Water Sensitivity) to calculate the percentage of Indirect Tensile Strength Ratio (%,
ITSR) between the wet and dry subset (EN 12697-23:2018.Part 23: Determination of the indirect tensile
strength of bituminous specimens). The ITS test consisted in subjecting the specimens to diametral
compressive strength loads using two loading strips (with a width of 12.7 mm) at a constant deformation
rate of 50 ± 2 mm/min, at 15 ºC, in which this load produced tensile stress along the vertical diametral
plane. This stress is what progressively fractures the cylinder and ultimately causes the splitting failure of
the diametric plane Figure 17 shows the indirect tensile strength test at 15 ºC.
Figure 17. Indirect tensile strength test set-up at 15 ºC
The minimum indirect tensile strength ratio (ITSR) values to be met in relation to base course asphalt
mixtures and intermediate traffic load categories should be equal to or higher than 75%, whereas, for low-
traffic load categories and shoulders, this percentage should be above 70%, according to the latest Spanish
technical specifications required by Art. 20 of PG-4 (OC 40/2017: Recycling of pavements) (Spanish
Ministry of Public Works, 2017). The indirect tensile strength (ITS) of each specimen is calculated from
the peak load applied at breaking and the specimens' dimensions, following Eq. 4.5.
𝐼𝑇𝑆 = 2 ∙𝑃
𝜋 ∙ 𝐷 ∙𝐻 (4.5)
Where ITS= indirect tensile strength expressed in gigapascals; P = peak load expressed in kilonewtons;
D= diameter of the specimen in millimeters; and H = thickness of the specimen in millimeters.
Therefore, the average of the three values obtained for each of the specimens can be understood as the
indirect tensile strength (ITS) of the mix. The test was run at 15°C, according to standard UNE-EN
Page 59
Chapter 4. Methodology
41
12697-23:2018. Determination of the indirect tensile strength of bituminous specimens. On the other
hand, the indirect tensile strength ratio (%, ITSR) can be defined as the relationship between in-wet and in-
dry specimens to evaluate the mixtures’ water sensitivity test, as shown in Equation 4.6.
𝐼𝑇𝑆𝑅 =𝐼𝑇𝑆𝑤
𝐼𝑇𝑆𝑑 ∙ 100 (4.6)
Where: ITSR is the ratio of the indirect tensile strength (%); ITSw is the average of the indirect tensile
strength value for in-wet specimens (kPa); ITSd represents the indirect tensile strength values for the dry
specimens (kPa).
4.4.2 Immersion-Compression test
The immersion-compression (I-C) test was conducted, according to NLT-162/00: Effect of Water
on Compressive Strength of Compacted Bituminous Mixtures. To conduct this test, an average of eight
cylindrical shaped laboratory specimens was prepared with a diameter of 101.6 mm and a height of 100
mm and compacted with a static contact load pressure produced by double-plunger action. The initial pre-
loading applied was approximately 1 MPa, and, hence, the load starts gradually increasing until reaching
20.7 MPa (3000 psi), maintaining the vertical contact load pressure for 2 min. The first four specimens are
left at room temperatures (25 ºC) for 24 h. The other subset was immersed in a water bath for 24 h, at 60
ºC. Posteriorly, the specimens were placed in a water bath, at 25 ºC, for 2 h. Both subsets were subjected
to a simple compressive load at a constant deformation rate of 5.08 mm/min. Afterward, the percentage of
retained water strength resistance is calculated between the wet and dry subsets, which makes it possible to
obtain the resistance to moisture damage of the specimens. The optimal percentage should meet the
minimum retained water strength requirements, depending on the levels of heavy traffic load to be
supported.
Advanced mechanical characterization of the mixture
Concerning the advanced mechanical characterization of the mixtures studied, the stiffness
modulus, rutting performance, and fatigue cracking resistance by four-point (4PB) flexural bending beam
test method were evaluated and tested in the laboratory.
4.5.1 Stiffness modulus
The load-bearing capacity of the mixtures was assessed through the stiffness modulus (Sm), at 20
ºC, according to EN-12697-26:2012. Bituminous mixtures -Test methods - Part 26: Stiffness. The stiffness
modulus is defined as the relationship between applied stress and maximum measured strain response 𝐸 =
𝜎 ; where E is the elastic stiffness (modulus), in Megapascals (MPa); σ stress (t), and strain 휀 (t). Figure
18 shows the test frame with loading strips and half-warm specimen ready for stiffness modulus test.
Page 60
Chapter 4. Methodology
42
Figure 18. Stiffness modulus test, at 20 ºC, of laboratory specimens
This mechanical property was computed as the average value of five indirect-tensile haversine-
shaped load waveform pulses on a diametrical section with a rise time of 124 ± 3 ms, target peak horizontal
deformation of 5µm, loading frequency of 2.1 Hz, peak loading force of 1000 N, and Poisson’s ratio (ν) of
0.35. Previously, ten load pulses were applied to set up the system in terms of loading level and frequency.
Therefore, the average stiffness modulus value was validated and contrasted by turning the cylindrical
specimen at an angle of 90 ± 10º, according to their longitudinal axis on the plate. Thus, for an applied
dynamic load of P in which the resulting horizontal dynamic deformations are determined, the total stiffness
modulus is calculated, according to Eq. 4.7 (Modarres and Ayar, 2014):
𝑆𝑚 =𝑃(𝛾+0.27)
𝑡𝛿ℎ (4.7)
Where: Sm: stiffness modulus, MPa; P: Maximum dynamic load, N; 𝛾: Poisson’s ratio (0.35); t: specimen
thickness, mm; 𝛿ℎ: total horizontal recoverable deformation expressed in terms of mm.
4.5.2 Resistance to permanent deformation
The resistance to permanent deformation of the mixture was assessed by conducting the wheel-
tracking test (WTT), at 50 ºC and 60 ºC, using the respective optimal emulsion content with 2.5% and 3.0%
o/RAP and 50/70 pen. grade emulsified bitumen, according to EN 12697-22:2008+A1:2008. Part 22:
Wheel Tracking. Although the wheel tracking test temperature of 50 ºC is not considered in the Spanish
technical specifications, this test temperature was conducted to simulate and reproduce the real thermal
gradients suffered by the binder course asphalt mixture in the field.
Page 61
Chapter 4. Methodology
43
In this context, the rutting test consisted in applying a total duration of 10.000 load cycles, at a
frequency of 26.5 ±1 load cycles/minute, procedure B, in air, using a loaded rubber wheel back and forth
on the prismatic specimen with a load contact of 700 N. To this end, an average of two prismatic-shaped
specimens were prepared (with a length of 400 mm, 250 in width and 60 mm in height) and compacted
with a percentage of 98% of the benchmark density using the steel roller device, according to EN 12697-
33:2006+A1. Part 33: Specimen prepared by roller compactor, as illustrated in Figure 19.
(a) (b)
Figure 19. Specimen’ preparation and compaction (a) using a roller compactor; and (b) prismatic specimen after
compaction ready for rutting performance test
Posteriorly, the wheel tracking slope (WTS) has been calculated, according to Eq. 4.8:
𝑊𝑇𝑆𝐴𝐼𝑅 = 𝑅𝐷10000− 𝑅𝐷 5000
5 (4.8)
Where: WTS is the curve of the wheel tracking slope, or creep slope, for 1000 number of load cycles
expressed in terms of mm/1000 load cycles; RD5000 is the rut depth when applying 5000 load cycles (mm);
RD10.000: is the rut depth after 10.000 load cycles (mm). Figure 20 illustrates the resistance to permanent
deformation using the wheel tracker, at 60ºC, of the HWMRA 100% RAP mixtures.
Page 62
Chapter 4. Methodology
44
Figure 20. Wheel tracking test, at 60 ªC, of the HWMRA 100% RAP mixtures
4.5.3 Four-point bending (4PB) beam fatigue test
In order to complete the mechanical characterization of the mixtures studied, the four-point fatigue
bending beam (4PB) test method was conducted, at 20 ºC, using a loading frequency of 30 Hz, according
to EN 12697-24:2012. Part 24: Resistance to Fatigue – Annex D. To do so, more than twelve laboratory
prismatic-shaped specimens for each type of asphalt mixture were compacted with the steel roller compactor
and thereafter sawed (with a length of 380 mm, 50 mm in width and 50 mm in height), for their posterior
testing in the 4PB device.
Following the production/compaction process, the 4PB fatigue strength test was conducted applying
harvesine-shaped load pulses in strain-fatigue control mode and with a selected loading frequency of 30
Hz. In turn, the vertical deflection at the center of the beam was measured using a Linear Variable
Differential Transducer (LVDT) positioned at the bottom of the specimen. The controlled fatigue-strain
amplitude levels selected for the 4PB test varied, as follows: 200-250 µm/m, 150-190 µm/m and 100-140
µm/m; where the fatigue life should fall within the range of 104 and 2 x 10⁶ load cycles. In view of that, the
two parameters selected to depict the mixtures’ fatigue cracking resistance were the number of load cycles
to failure and the corresponding tensile fatigue-strain level (휀𝑡).
Moreover, the fatigue failure approach (Nf) was defined using the classical fatigue method expressed
by a relationship between the tensile strain (휀𝑡) and the number of load cycles to failure, Nf, at which the
initial stiffness modulus of the specimens measured in the load cycle number 100th is reduced to 50% of its
initial beam stiffness (Dondi et al., 2013; Kim et al., 2018; Li et al., 2013). The procedure was based on Eq.
4.9:
Page 63
Chapter 4. Methodology
45
휀𝑡 = 𝐴 ∙ (𝑁𝑓)𝐵
(4.9)
Where 휀𝑡: is the tensile strain, 𝜇휀, applied in the center of the prismatic specimens; Nf: is the number of
load cycles to failure; A, B are material coefficients determined in the laboratory depending on the type of
the material. Figure 21 shows the prismatic shaped specimens conditioned at 20ºC and the four-point
fatigue bending (4PB) beam fatigue test method, at 20 ºC, of the HWMRA 100%RAP mixtures with 2.5%
and 3.0% (over the weight of RAP) emulsion and two penetration grade bitumen (50/70 and 160/220).
Figure 21. Four-point bending beam (4PB) fatigue test device
4.5.4 Indirect tensile fatigue test
Additionally, for the asphalt samples were taken after in-plant manufacturing and prepared in the
laboratory by gyratory compactor method (EN 12697-31:2007. Part 31: Gyratory compactor), the
indirect tensile fatigue test (ITFT) on cylindrical shaped specimens were conducted, at 15 ºC, using a
loading frequency of 10 Hz, according to EN 12697-24:2012. Part 24. Resistance to fatigue - Annex E.
Figure 22 displays the indirect tensile fatigue test device, at 20 ºC. The test consisted in applying a repeated
haversine load with 0,1 s loading time and 0,4 s rest time, through the vertical diametral plane, in which the
test shall start at a loading amplitude of 250 kPa. In order to do this, an average of three cylindrical
specimens was tested in the laboratory at four different strain-fatigue levels, in which the fatigue test was
carried out over a dynamic tensile strain range of approximately 100 μm/m to 400 μm/m. The failure
criterion was defined as the number of load cycles at which the initial stiffness of the sample is reduced up
Page 64
Chapter 4. Methodology
46
to 50% of its initial value or when the specimen breaks, whichever comes first. The resultant fatigue life of
the tested specimens should fall within a range between 103 and 106 load cycles, and the fatigue criterion
for the bituminous material shall be determined from the tested specimens according to Eq. 4.10:
𝑁𝑓 = 𝑘 (1
Ɛ0)
𝑛
(4.10)
Where: 𝑁𝑓 is the number of load applications; k, n are material constants in the laboratory; 휀0 is the
tensile strain in µm/m at the center of the specimen.
Figure 22. Indirect tensile fatigue (ITFT) test set up
Laboratory compaction study
Nowadays, there is no general agreement concerning what the most suitable laboratory compaction
method is, nor is there a full consensus regarding the mix design compaction energy that should be selected
for the production and compaction of half-warm mix recycling technology with emulsified bitumen. For
this reason, the compaction test method chosen should be capable of reproducing the benchmark density,
air voids, and more consistent mechanical performance properties (e.g., indirect tensile strength, rutting,
and stiffness modulus) when compared with those values obtained from the road worksite after pavement
construction.
Page 65
Chapter 4. Methodology
47
In this context, due to a lack of knowledge on what target air voids content should be adopted for this
technology, it was decided to support and base our research study on the real-scale construction project
conducted by Harmelink et al., (2007). They evaluated the in-situ air voids content in 22 real scale sections
for 6 years and found that, by applying a mix design compaction effort of 75 gyrations (Vm= 4.0%), the air
voids criterion matches the in-situ air voids in the pavement after three years of service life. For this reason,
the air voids design criterion sought for the half-warm specimens’ production/ compaction in the laboratory
was targeted to be in the order of 3-4%, given that if the air voids design in the mixture fall below 3%, it
may lead to causing issues associated with rutting because of plastic deformation (Roberts et al., 1991). To
avoid this type of failure, the target apparent density values, by SSD method, for this technology should
fall within the range of between 2,311 and 2,335 g/cm3, considering a maximum specific gravity (𝜌𝑚), by
the volumetric method (EN 12697-5:2010/AC:2012: Determination of the maximum density), of 2.407
g/cm3, for the 2.5% o/RAP emulsion. The above-mentioned threshold density (SSD) values range shall be
considered as part of the benchmark range to defining the most suitable compaction method and thus
ensuring its satisfactory field performance.
Therefore, three different laboratory compaction methods were selected and put into assessment to
determine and compare the corresponding volumetric, and mechanical performance properties of the half-
warm emulsified mixtures. The compaction methods examined in this research study were as follows (1)
the Marshall Impactor hammer, according to EN 12697-30:2012; (2) Static compressive strength load,
according to NLT-161: Simple Compressive Strength of Cylindrical Specimens; and (3) Superpave
Gyratory Compactor (SGC), according to EN 12697-31:2007, as illustrated Figure 23. To do so, the
HWMRA 100% RAP mixture production consisted in initially heating both fractions of RAP (0/5 and 5/25
mm) at 95 ºC, adding 2.5% emulsified bitumen (50/70) at 65 ºC, heating cylindrical molds at 80 ºC, mix
compaction temperature within the range of 70-80 ºC, and a prefixed compaction energy depending on the
compaction method to be used.
(a) (b) (c)
Figure 23. Compaction test methods: (a) Marshall impactor hammer; (b) Static stress load by double-plunger; and
(c) gyratory compactor method
Marshall Impactor Static stress load Gyratory compactor
Page 66
Chapter 4. Methodology
48
4.6.1 Marshall Impactor hammer
In this first phase, the Marshall specimens were prepared (with a diameter of 101.6 mm and a height
of 63.5 ± 1.5 mm) and compacted by both the Marshall impactor (EN 12697-30:2012) and the gyratory
compactor (EN 12697-31:2007) in order to determine if there was a possible correlation between the results
shown by both compaction methods. To this end, the Marshall specimens were compacted by applying two
different compaction energies, i.e., 75 and 100 impact-blows on each side, and 70 gyrations with the
gyratory compactor, respectively. Following the compaction process, the apparent density, by SSD
conditions, stiffness modulus at 20 ºC, and indirect tensile strength at 15 ºC, were determined and compared
with those results obtained from the gyratory compactor. In this context, the average apparent density value
of 75 impact-blows was found to be 2.282 g/cm3, and an average air voids content of 5.2%, while, for 100
impact blows, this number was 2.297 g/cm3 and 4.6% air voids.
On the other hand, by applying 100 impact-blows, the average stiffness modulus value of the
HWMRA 100% RAP mixture was 2,473 MPa, and an average indirect tensile strength value of 1.18 MPa;
whereas, for 75 impact-blows, the stiffness modulus and indirect tensile strength values were somewhat
similar to those values obtained with 100 impact-blows.
Concerning the gyratory compactor test method, it was observed that, by applying a mix design
compaction energy of 70 gyros and following the current laboratory standard test conditions established (0.
82º, 30 rpm, and 600 kPa) by the EN 12697-31:2007 standard, the average stiffness modulus value of 3,134
MPa was obtained, and an average indirect tensile strength value of 2.02 MPa. In other words, the laboratory
specimens compacted by the Marshall impactor hammer displayed a significant decrease of the stiffness
modulus values of 20%, and lower indirect tensile strength, ITS in-dry, values in the range of 34-42%.
Analogous outcomes for recycled mixes compacted with the Marshall impactor were found in other
laboratory studies. Hartmán et al., (2001) claim that the Marshall compactor does not have a kneading effect
to re-orientate the particle size distribution, and, hence, produces lower density, increased stiffness, and
mechanical properties that differ considerably from the values obtained in the field cores (Button et al.,
1994; Khan et al., 1998; Mollenhauer and Wistuba, 2013; Ulmgren, 1996). For this reason, the Marshall
impactor was not considered for further testing, since it delivers lower volumetric characteristics (e.g., air
voids and bulk density) and mechanical performance properties (i.e., indirect tensile strength and stiffness
modulus) than those obtained with the gyratory compactor.
4.6.2 Static compression load by double-plunger action
The static compression load method consists in using a higher load contact pressure to achieve the
benchmark density in the field, resulting in crushing of aggregates and squeezing of the binder film and
also revealing in-situ density differences in the fieldwork (Bonnot, 1997; Hartmán et al., 2001). In this
research study, the static compressive stress load (NLT-161/00: Standard Test Method for Compressive
strength of Bituminous Mixtures) was evaluated as a laboratory compaction test method to prepare half-
Page 67
Chapter 4. Methodology
49
warm emulsified bitumen specimens (with a diameter of 101.6 mm and 100 mm in height) and characterized
in terms of apparent density, indirect tensile strength and stiffness modulus.
The initial pre-loading applied was of approximately 1 MPa, and, after that, the load starts gradually
increasing until reaching 21 MPa, maintaining the vertical contact load pressure during 2 min. The subset
group consisted of preparing specimens, in-dry, and in-wet conditions, from which the former subset, in-
dry conditions, is left at room temperatures (25 ºC) for 24 h. The other subset was immersed in a water bath
for 24 h, at 60 ºC. Posteriorly, the specimens were placed in a water bath, at 25 ºC, for 2 h. Both subsets
were subjected to a simple compressive load at a constant deformation rate of 5.08 mm/min. Afterward, the
percentage of retained water strength resistance is calculated between the wet and dry subsets, which makes
it possible to obtain the resistance to moisture damage of the specimens. The optimal percentage should
meet the minimum retained water strength requirements, depending on the levels of heavy traffic load to be
supported. For instance, for intermediate traffic load categories, the minimum retained water strength
percentage required for their use in base, and binder course asphalt mixtures should be above 75%; whereas,
for low traffic load categories and shoulders, this percentage should be higher than 70% (Spanish Ministry
of Public Works, 2001).
4.6.3 Gyratory compaction
The gyratory compactor was selected and evaluated to determine the volumetric and mechanical
properties of the mixtures, according to EN 12697-31:2007. Test method for hot mix asphalt. Part 31:
Gyratory Compactor. The laboratory standard compaction conditions considered for the HWMRA mix’
production and compaction in the laboratory were as follows:
1. Internal angle velocity of 0. 82º;
2. Constant speed of 30 rpm;
3. Vertical consolidation pressure of 600 kPa;
4. Mix compaction temperature of 80 °C;
5. Number of compaction gyrations: variable.
6. Mold diameter: 100 mm
In this regard, this compaction test method is typically adopted as the most appropriate laboratory
compaction system to successfully achieve the benchmark density, a more even homogeneous air voids
distribution (Gao et al., 2015; Lo Presti D et al., 2014), more consistent engineering properties to those
obtained in the field (Consuegra et al., 1989), as well as for simulating field compaction conditions because
of the effect of kneading motion (Butcher M, 1998; Cross, 2003; Hartmán et al., 2001; Newcomb et al.,
2007). For these reasons, the gyratory compactor system was selected and evaluated as a benchmark test
method for HWMRA mix’ production and characterization in the laboratory (Asphalt Institute, 2007;
Polaczyk et al., 2018).
Page 68
Chapter 4. Methodology
50
Figure 24 shows the thermographic analysis of the half-warm specimens manufactured with total RAP
contents (100%) together with the thermography of the cylindrical mold heated at 80 ± 5 ºC. To do so, a
FLIR C2 thermographic imaging camera (with an average temperature emissivity of 0.95, surface
reflexivity temperature of 20 ºC and infrared (IR) resolution of 80 x 60 pixels) and FLIR tool software were
used to obtain the main parameters during the production/heating and compaction process (i.e., maximum,
minimum and average temperature), wherein the central rectangular-shaped section of the cylindrical mold
was recorded for ensuring the target compaction temperature (~ 80 °C). However, the actual temperature
monitoring of the specimen was conducted using a thermal probe that is inserted into a hole of the mold to
control that the working temperature is approximately 80 ºC during the mix compaction process. The
geometric density is calculated with the change of the geometric volume of the specimens, and it depends
on the specimens' thickness change.
(a) (b)
Figure 24. Gyratory compactor device set-up: (a) cylindrical mold with a diameter of 100 mm; and (b)
Thermographic analysis of the specimen compacted at ~ 80 ºC
Mixture design
4.7.1 HWMRA 100% RAP mixtures
Once the aggregate gradation curve, emulsion-type, and mix design compaction energy were
defined, the next step was to continue the manufacturing of new cylindrical-shaped specimens to calculate
the optimum emulsion content (OEC), by testing a wide range of emulsion contents, depending on the
mixtures’ volumetric and mechanical performance properties. The HWMRA mixtures were manufactured
by heating the RAP at 95 ºC, bituminous emulsion at 65 ºC, mix fabrication at 95 ºC, cylindrical molds at
85ºC, and mix compaction temperature in the range of 70-80 ºC using a prefixed compaction energy of 70
gyrations (see Figure 25); where the optimal mixture design consisted of defining the optimal emulsion
Page 69
Chapter 4. Methodology
51
content to meet the minimum laboratory performance requirements regarding the ITS, at 15 ºC, the stiffness
modulus, at 20 ºC, the water sensitivity, the rutting performance, apparent density, and the air voids content
in the range of 3.0-4.0%. To do so, an average of three cylindrical specimens were prepared (with a diameter
of 100 mm and 60 ± 1.5 mm in height) and tested by considering slight variations of the emulsion content
to be used in the mixture design.
Figure 25. Production (weighing and mixing) and optimization process of the mixes in the laboratory
4.7.2 Effect of the curing process on the mixture’ mechanical performance
Once the optimal emulsion content (2.5% o/RAP) was defined, the next step was to quantify how
the laboratory-accelerated curing treatment process promotes the development of mechanical performance
properties (ITS and stiffness modulus) of the emulsified mixtures. In this sense, the curing/drying treatment
was conducted, as part of the optimization of the mix design, using a forced-draft convection oven, at 50
ºC, at four different curing periods (0, 24, 48, and 72 h), at 24 h increments, until reaching constant weight
before their testing, according to Art. 20 of PG-4: In-situ recycling of bituminous layers with bitumen
emulsion (Spanish Ministry of Public Works, 2017).
HMA mixture (AC16 D) design
The Marshall design method was used to calculate the optimum binder content of the conventional
HMA mixture, according to EN 12697-34:2013. Part 34: Marshall test. To do so, four different asphalt
binder contents were selected and added into the preliminary mix design, ranging from 4.5 to 6.0%, at 0.5%
increments, and, after that, the Marshall specimens were compacted with the Marshall hammer by applying
75 impact-blows on each face, at 160 ºC, according to EN 12697-30:2012. Part 30: Specimen preparation
by impact compactor. Figure 26 shows the production and compaction process of the conventional HMA
mixture as follows: (a) mixing process at 165-170 ºC, pouring the mix into the Marshall mold (with a
diameter of 100 mm and ), mix compaction at 150 ºC, and cylindrical specimens after compaction.
(a) (b) (c) (d) (e)
Figure 26. Production and compaction of the conventional HMA specimens using the Marshall impactor
RAP Emulsion Mixing Mold heating Curing
Mixing Marshall Mold Impactor SpecimensSpecimens after
demolding
Page 70
Chapter 4. Methodology
52
Description of the test road section in Lerma
A test road section with 100% RAP was built in a service road, parallel to A1 motorway, between
203 and 204 km, located in Lerma, province of Burgos, in Spain, as illustrated in Figure 27. The test road
pavement section is now subjected to a T2 heavy traffic load category corresponding to an annual average
daily traffic (AADT0) equal to or higher than 200 and lower than 800 and with a traffic growth rate of 3.0
± 0.5 %/year. The service road is made up of two lanes with one-way traffic on a carriageway of 10 m in
width.
The rehabilitation works consisted in replacing the conventional HMA mixture with half-warm mix
recycled asphalt mixtures in a total length of 400 m and 5cm in depth laid in the entire carriageway width
for their use in binder course asphalt mixtures. Also, the contiguous remaining 300 m were rebuilt with an
asphalt concrete mixture with a nominal maximum aggregates size (NMAS) of 16 mm (AC16 D). The slow
traffic lane was built with 3.0% o/RAP emulsion, while the high-speed lane was 2.5%o/RAP emulsion
content. Finally, the wearing course asphalt mixture (AC16 D) was repaved and compacted in the test road
section with a length of 700 m and with a layer thickness of 40 mm. The construction process was conducted
using conventional machinery typically used in the construction of real pavement sections. The paving
process was performed at 100°C by using an asphalt paver to ensure a high quality of the mix spreading, a
pneumatic tire road roller, along with a steel double-drum road roller. Moreover, a UM-260 INTRAME
asphalt batch plant was set up and run with a maximum theoretical output capacity of 120 t/h. This batch
plant was equipped with some new devices to deal with 100% RAP production, at half-warm temperatures
and emulsified bitumen.
Figure 27. Arlanzón motorway location (x=42.04466 and y= -3.748913306) in Lerma Spain
Page 71
Chapter 4. Methodology
53
Additionally, the surface friction characteristics of the binder course asphalt mixture were
determined and calculated after pavement construction in terms of macrotexture and international surface
roughness index (IRI) to determine the finished construction quality of the mixtures. For the IRI, this
procedure was based EN 13036-6:2008. Road and airfield surface characteristics. Test methods.
Measurement of transverse and longitudinal profiles in the evenness and megatexture wavelength
ranges.
Macrotexture
On the 15th of November 2015, four months after being subjected to traffic loads, the early life skid
resistance and surface macrotexture depth were determined. The macrotexture was measured with the
modified sand patch arena method, in accordance with EN 13036-1:2010. Road and airfield surface
characteristics. Part 1: Measurement of pavement surface macrotexture depth using a volumetric
patch technique. Specifically, 5000 mm3 of graded sand were spread over the wearing course asphalt
mixture using a spreading tool, after which the total area covered by the sand was measured. The surface
macrotexture depth value is commonly accepted in terms of Mean Texture Depth (MTD) expressed in terms
of mm, based on the procedure Eq. 4.8:
𝑀𝑇𝐷 =4𝑉
𝜋 𝐷2 (4.8)
Where; MTD: is the mean texture depth expressed in terms of mm; V is the sample volume in mm3; D is
the average diameter of the area covered by the material in mm. Figure 28 shows the macrotexture
procedure using the patch test method and the repeatability of the circular patch method used in the binder
course asphalt mixtures of the urban test section.
Figure 28. Macrotexture surface depth
Page 72
Chapter 4. Methodology
54
International surface roughness index
The International surface roughness index (IRI) of the HWMRA 100% RAP mixtures (2.5% and
3.0%o/RAP) was measured and calculated from the longitudinal profile with a high-speed profiling device
“Greenwood Digital Profilometer P59”, at 60 km/h, according to EN 13036-6:2008. Road and airfield
surface characteristics. Part 6: Measurement of transverse and longitudinal profiles in the evenness
and megatexture wavelength ranges. In order to do this, a set of surface campaigns was conducted in the
northbound section (with a length of 400 m and with a surface carriageway width of 7.5 m) to calculate the
evolution of the surface roughness values over three years in service, i.e., from 2012 to 2014.
Page 73
55
Chapter 5
5 RESULTS AND DISCUSSION
In previous Chapters, the backgrounds, experimental methodology, and test procedures resulting
from three different compaction test methods, in-plant samples, and pavement cores drilled from in-situ
pavement have been presented. The performance testing results and analysis will be shown in graphical
form with tabulated values also provided in referenced Annexes.
Laboratory compaction study results
5.1.1 Marshall impactor hammer
Following the compaction process, the apparent density, by SSD conditions, stiffness modulus at 20
ºC, and indirect tensile strength at 15 ºC, were determined and compared with those results obtained from
the gyratory compactor. In this context, the average apparent density value of 75 impact-blows was found
to be 2.282 g/cm3, and an average air voids content of 5.2%, while, for 100 impact blows, this number was
2.297 g/cm3 and 4.6% air voids.
On the other hand, by applying 100 impact-blows, the average stiffness modulus value of the
HWMRA 100% RAP mixture was 2,473 MPa, and an average indirect tensile strength value of 1.18 MPa;
whereas, for 75 impact-blows, the stiffness modulus and indirect tensile strength values were somewhat
similar to those values obtained with 100 impact-blows.
Concerning the gyratory compactor test method, it was observed that, by applying a mix design
compaction energy of 70 gyros and following the current laboratory standard test conditions established (0.
82º, 30 rpm, and 600 kPa) by the EN 12697-31:2007 standard, the average stiffness modulus value of 3,134
MPa was obtained, and an average indirect tensile strength value of 2.02 MPa. In other words, the laboratory
specimens compacted by the Marshall impactor hammer displayed a significant decrease of the stiffness
modulus values of 20%, and lower indirect tensile strength, ITS in-dry, values in the range of 34-42%.
Analogous outcomes for recycled mixes compacted with the Marshall impactor were found in other
laboratory studies. Hartman et al. (Hartmán et al., 2001) claim that the Marshall compactor does not have
a kneading effect to re-orientate the particle size distribution, and, hence, produces lower density, increased
stiffness, and mechanical properties that differ considerably from the values obtained in the field cores
(Button et al., 1994; Khan et al., 1998; Mollenhauer and Wistuba, 2013; Ulmgren, 1996). For this reason,
the Marshall impactor was not considered for further testing, since it delivers lower volumetric
characteristics (e.g., air voids and bulk density) and mechanical performance properties (i.e., indirect tensile
strength and stiffness modulus) than those obtained with the gyratory compactor.
Page 74
Chapter 5. Results and discussion
56
5.1.2 Static load by a double plunger
Looking at the mixtures’ compressive strength results, it was observed that, by applying a static
compressive load of 21 MPa, the HWMRA 100% RAP mixture with 2.5% (o/RAP) emulsion showed an
average apparent density, by SSD method, of 2.357 g/cm3, and an average air voids content of 2.08% (see
Figure 29); whilst the average compression strength value was found to be 5.63 MPa. Despite this, it was
found that the static compressive stress results were much higher than the minimum threshold values
required by the Spanish technical standards, according to Art. 20 of PG-4 (Spanish Ministry of Public
Works, 2001). Analogous results for the static compressive test have been found and contrasted in other
laboratory studies conducted by Hartman et al. [47] and Martínez et al. [48]. They claim that the
compressive system is not regarded as the most reliable laboratory compaction method since it always
provides much higher density values than those obtained in the field cores. This increased density is likely
caused by a higher contact load pressure applied on the cylindrical specimens, causing the crushing and
breakage of aggregates as well as the squeezing of the binder, resulting in a much higher density than the
obtained from the field cores (Bonnot, 1997). Moreover, since these specimens are prepared with a height
of 100 mm, they cannot be reused for further mechanical testing, such as ITS, stiffness modulus.
In view of that, and based on the author’s findings and laboratory results, the cylindrical
specimens had to be prepared with new pre-fixed dimensions (i.e., with a height of 60 mm and with a
diameter of 101.6 ± 0.1 mm) and compacted with a lower static compressive pressure of 10 MPa. In other
words, a 53% lower compressive stress energy was selected to obtain specimens with field-like density,
and more consistent mechanical properties compared to those values achieved in the road worksite after
pavement construction. Figure 30 displays the indirect tensile strength (ITS) and retained water strength
results against three emulsion contents (2.5%, 3.0%, and 3.5%o/RAP) of the half-warm mixes compacted
with the static compressive load.
In summary, for 10 MPa static load, the average apparent density, by SSD, was found to be 2.289
g/cm2, and air voids content of 4.9%, resulting in slightly higher air voids content than those values expected
from the target air voids content set in the mixture design. Thus, the average indirect tensile strength (ITS)
value was found to be 1.66 MPa and an average stiffness modulus of 3,578 MPa when applying the selected
static compaction pressure of 10 MPa. However, at the end of the compaction process, it was observed that
this latter compaction energy caused the breakage of aggregates, showing that the static load was not the
most suitable compaction method for this technology.
Therefore, based on the Spanish technical regulations (Art. 20 of PG-4: In-situ recycling of
bituminous layers with emulsion), the minimum indirect tensile strength ratio (ITSR ≥75%) was
successfully achieved, without any compactability issue, by applying the selected static compaction
pressure of 10 MPa. These mixtures can be laid for their use in base course asphalt mixture subject to a T1
heavy traffic load category corresponding to annual average daily traffic (AADT) lower than 2000, and
equal to or higher than 800 and T2 load traffic category (800>AADT ≥200), according to 6.1 IC: Pavement
sections, investigation of road pavements.
Page 75
Chapter 5. Results and discussion
57
Figure 29. Apparent density and air voids content versus emulsion content
Figure 30. Indirect tensile strength, at 15 ºC, and retained water strength versus three emulsion contents
3,0
3,5
4,0
4,5
5,0
5,5
6,0
2,281
2,286
2,291
2,296
2,301
2,306
2,311
2,316
2,0 2,5 3,0 3,5 4,0
Air
void
s (%
)
App
aren
t den
sity
(g/c
m3 )
Emulsion content (%)
Apparent density Air voids
70
75
80
85
90
95
100
1,0
1,1
1,2
1,3
1,4
1,5
1,6
1,7
1,8
1,9
2,0
2,0 2,5 3,0 3,5 4,0
ITSR
(%)
ITS
(MPa
)
Emulsion content (%)
ITSdry ITSwet ITSR
Page 76
Chapter 5. Results and discussion
58
5.1.3 Gyratory compactor
Figure 29 illustrates the specimens’ geometric density change and air voids content curves against the
number of compaction gyrations ranging from 0 to 200 gyrations. In this regard, the compaction curves
showed in this Figure are determined using the geometric density, according to EN 12697-10:2010. Part
10: Compactibility, while the bulk density is calculated at the end of the compaction process, by saturated
surface dry (SSD) conditions (EN 12697-6:2012. Part 6: Determination of bulk density of bituminous
specimens). The geometric density is therefore calculated with the change of the geometric volume of the
specimens, and it relies on the change of the thickness of the specimens.
Concerning the slope of the densification curve of the 100%RAP mixture (2.5%o/RAP emulsion),
it can be observed in Figure 31 that, by following the laboratory standard compaction conditions set out in
EN 12697-10:2003/AC, there is a significant decrease in the air voids curve when increasing the number
of load cycles derived from an initial mix densification of 13.3% (i.e., increased from 2.040 to 2.311 g/cm3)
during the first 70 gyrations. Afterward, an aggregate–aggregate interlocking was noted in the compaction
range of 70-100 gyrations, which led to an increase in density of approximately 0.61% in 30 gyrations (i.e.,
from 2.311 to 2.325 g/cm3); whereas at the end of the compaction test (i.e., 200 gyrations), the slope of
densification curve becomes more stable and asymptotic thereafter, i.e., it reaches a slight increase in the
geometric density of 0.77% in the last 100 gyrations applied on the specimen (𝜌𝑏,𝑑𝑖𝑚=2.347 g/cm3 and Vm
= 2.5% air voids).
To put it in another way, by applying a mix design compaction effort of 70 gyros, the average
geometric density was found to be 98.5% of the specimen’ density compacted with 200 gyrations; whereas,
for 100 gyrations, this percentage was 99.1%, according to EN 13108-20:2007. Type Testing – Annex
C.4: Degree of compaction. In which the 𝝆𝒃,𝒅𝒊𝒎 can be defined as the geometric density obtained for Ni
load cycle, obtained from the gyratory compactor software in terms of g/cm3; while the 𝝆𝒃,𝒃𝒆𝒏 can be
understood as the benchmark density obtained at the end of the compaction process (Ni =200 load cycles).
Page 77
Chapter 5. Results and discussion
59
Figure 31. Compaction curves based on the geometric density and air void content versus
In summary, it was found that, for 70 gyrations, the average geometric density of the HWMRA
100% RAP (2.5% o/RAP) mixture with 50/70 pen. bitumen was found to be 2.311 g/cm3, an average air
voids content of 4.0%; and average indirect tensile strength values of 1.7 MPa. Therefore, the gyratory
compaction curve revealed that it is possible to successfully meet the target air voids criterion within the
range of 3.0-4.0%.
Once the mix design compaction effort was selected as a function of the compaction gyration curves,
an average of three cylindrical-shaped specimens were prepared (with a diameter of 100 mm and 60 ± 1.5
mm in height) and compacted by following the laboratory standard compaction conditions established by
the EN 12697-31:2007 standard. Table 7 provides a comparison between the volumetric and mechanical
performance value results obtained from the gyratory compactor at 70 gyrations, Marshall impactor
hammer at 75 and 100 impact-blows, and vertical static compressive strength load of 10 MPa, respectively.
It can be observed in this Table that, by applying a mix design compactive effort of 70 gyrations and
by setting-up the gyratory compactor with an internal angle of gyration of 0. 82º and vertical consolidation
pressure of 600 kPa, the highest apparent density, indirect tensile strength (ITSin-dry) and retained water
strength values were obtained. This is likely attributed to the kneading effect of the gyratory compactor on
the mixtures’ internal structure that allowed the provision of higher apparent density, better rearrangement,
2020
2060
2100
2140
2180
2220
2260
2300
2340
2380
2420
0
1
2
3
4
5
6
7
8
9
10
11
12
13
14
15
16
0 10 20 30 40 50 60 70 80 90 100 110 120 130 140 150 160 170 180 190 200 210
Geo
met
ric d
ensi
ty (g
/cm
³)
Air
void
s (%
)
Number of load cycles
4.0% → 70 gyros
100 gyros: 2.325 g/cm3 70 gyros:
2.311 g/cm3
Page 78
Chapter 5. Results and discussion
60
and interlocking of the aggregate particles contained in the specimens (Kutay et al., 2010; Masad et al.,
2002; Tarefder and Ahmad, 2016) – implying that the higher the aggregate-aggregate-interlocking effect,
the better the dissipation of the shear stress of the mixture (Coleri et al., 2013).
Table 7. Comparison of volumetric and mechanical properties of HWMRA 100% RAP mixtures with 2.5%
emulsion and 50/70 pen. bitumen
Properties Test method Marshall
Impactor*
Static
stress
load*
Gyratory
compactor
Compaction energy - 75 x 2 100 x 2 10 MPa 70 gyros
Specimens’ height, (mm) - - - 67.3 65.2
Apparent density, SSD, (g/cm3) EN 12697-6:2012 2.282 2.297 2.289 2.331
Air voids, (%) EN 12697-8:2003 5.2 4.6 4.9 3.2
ITS, in-dry, (MPa) EN 12697-23:2018 1.18 1.33 1.66 2.02
ITSR, (%) EN 12697-12:2012 - - 79 95.7
*Key: The Marshall impactor and static stress load methods were not considered for further mechanical testing since
they caused the breaking of aggregates during the mix compaction process
In this context, one can say that the gyratory compactor was the most suitable compaction test
method for the production/compaction and characterization of the half-warm mix recycling technology with
total RAP content (100%) and emulsified bitumen. Therefore, Marshall hammer impactor and static
compressive strength load by double-plunger were not considered for further mechanical testing analysis,
since they tend to induce higher mechanical impact stress load and static compressive load on the cylindrical
specimens, which results in the breakage of aggregates and, hence, the weakening of the mixture’
mechanical performance.
Additionally, an assessment of the volumetric and mechanical performance properties was
conducted to determine the feasibility of using half-warm mix asphalt mixtures with two emulsion contents
(2.5% and 3.0%) and two different penetration grade bitumens (160/220 and 50/70 dmm), as illustrated in
Table 8. In this sense, for the HWMRA mixture with 2.5% emulsion and 50/70 and 160/ 220 pen. grade
bitumen, the highest stiffness modulus values of 2988 and 2901 MPa were obtained, respectively; while,
for the HWMRA mixture with 3.0% emulsion, this number was much lower than the 2.5% emulsion.
Nevertheless, only 2.5% o/RAP emulsion met the required air voids content within the range of 3.0-4.0%.
Therefore, it is worth noting that the 2.5% emulsion with 50/70 pen grade bitumen meets the
minimum indirect tensile strength ratio (ITSR ≥70%) stipulated for their use in low traffic load categories
Page 79
Chapter 5. Results and discussion
61
and shoulders, as well as the ITSR≥75% for their use in base and binder course asphalt mixtures and
intermediate traffic load categories, according to the latest Spanish technical regulations edition in Art. 20
of PG-4 (Spanish Ministry of Public Works, 2017). Moreover, the HWMRA mixtures meet the minimum
indirect tensile strength ratio values required for hot mix asphalt mixtures for their use in base, binder
(ITSR≥80%), and wearing course asphalt mixtures (ITSR≥85%) of road pavements, according to Art. 542
of PG-3 (Spanish Ministry of Public Works, 2015).
Table 8. Volumetric and mechanical performance properties of the mixtures compacted with 70 gyrations
Mixture properties Test Method HWMRA 100% RAP mixture
Rejuvenator binder
(160/220 dmm)
Residual binder
(50/70 dmm)
Emulsion (%, o/RAP) - 2.5% 3.0% 2.5% 3.0%
Specimens’s height, (mm) - 65.0 64.9 65.5 65.4
Apparent density, SSD, (g/cm3) EN 12697-6 2.347 2.350 2.340 2.344
Air voids, Vm, (%) EN 12697-8 2.98 2.47 3.08 2.49
ITSdry, 15 ºC, (MPa) EN 12697-23 2.14 2.06 1.99 1.67
ITSwet, 15 ºC, (MPa) EN 12697-23 2.05 1.91 1.91 1.57
ITSR, (%) EN 12697-12 95.7 92.7 95.8 94
Stiffness modulus, 20 ºC, (MPa) EN 12697-26 2901 2389 2988 2560
Mix design results
Table 9 shows the volumetric and mechanical performance results of the preliminary mix design with five
emulsion contents, ranging from 0 to 3.5%, of the half-warm mixes with 100% RAP. Figure 32 displays
the air voids content and apparent density values of the mixtures designed with 50/70 pen. bitumen against
five different emulsion contents, ranging from 0% to 3.5%, were plotted.
Regarding the stiffness modulus values, the HWMRA 100% RAP mixture with 2.5%o/RAP
showed a decrease in the stiffness of 23%, in comparison with the 0% emulsion. This result implies a
positive aspect to improve the mixtures’ fatigue cracking resistance in the field since it would make the
mixture less stiff and less brittle by enabling higher tensile deformations before its fatigue cracking failure
occurs in the field. In Figure 33, the 100% RAP mixture with 0% emulsion content exhibited lower indirect
tensile strength (ITS) values (1.08<1.5 MPa), increased stiffness modulus, and lower moisture damage
(69%<75%) values than those minimum required by the Spanish technical specifications in Art. 20 of PG-
4 (Spanish Ministry of Public Works, 2017). The decreased water susceptibility values can be partially
Page 80
Chapter 5. Results and discussion
62
attributed to the loss of the adhesive bonding between aggregates and binder, i.e., due to the failure of the
cohesive strength of the binder - although it is expected that such a stripping effect can be counteracted
when adding the respective emulsion content to be used in the preliminary mix design (Karlsson and
Isacsson, 2006; Mogawer et al., 2012).
Table 9. Volumetric and mechanical performance of the HWMRA 100% RAP mixtures
Mixture properties Test method Emulsion content (%, o/ RAP) – 50/70
0% 2.0% 2.5% 3.0% 3.5%
Maximum density (g/cm3) EN 12697-5 2.481 2.428 2.407 2.389 2.377
Apparent density, SSD, (g/cm3) EN 12697-6 2.268 2.327 2.328 2.338 2.339
Air voids, Vm, (%) EN 12697-8 8.6 4.2 3.3 2.1 1.6
ITSdry, (MPa) EN 12697-23 1.55 1.87 2.13 1.93 1.72
ITSwet, (MPa) EN 12697-23 1.08 1.82 2.08 1.89 1.69
ITSR, (%) EN 12697-12 69.5 97.3 97.6 98.1 98.3
Stiffness modulus, (MPa) EN 12697-26 3754 3034 2891 2861 2364
Figure 32. Volumetric characteristics (air voids and density) of the preliminary mix design
2,26
2,27
2,28
2,29
2,30
2,31
2,32
2,33
2,34
2,35
0
1
2
3
4
5
6
7
8
9
10
0,0 0,5 1,0 1,5 2,0 2,5 3,0 3,5
App
aren
t den
sity
(g/c
m³)
Air
void
s (%
)
Emulsion content (%)
Air voids Apparent density
Apparent density
Vm
Page 81
Chapter 5. Results and discussion
63
Figure 33. Stiffness modulus at 20 ºC, and ITS, at 15 ºC, versus emulsion content
Finally, it can be said that though the 100% RAP mixture with 0% o/RAP emulsion exhibited lower
volumetric, durability, and mechanical performance (i.e., due to its low compactability), the HWMRA
100%RAP mixture with 2.5% emulsion fell within the required target air voids criterion (Vm=3.3% air
voids) set out in the mixture design, average internal cohesion values (ITS in-dry) above 2.0 MPa, and
moisture damage resistance values much higher than those minimum stipulated (≥75%) by the Spanish
technical regulations in Art. 20 of PG-4 (Spanish Ministry of Public Works, 2017), as well as the moisture
damage value requirements (ITSR>85%) set out for hot mix asphalt (HMA) mixtures, according to Art.542
of PG-3 (Spanish Ministry of Public Works, 2015).
Advanced mechanical characterization of the mixture
5.3.1 Stiffness modulus and indirect tensile strength
The load-bearing capacity of the mixtures was also evaluated through the stiffness modulus test, at
20 ºC, according to EN 12697-26:2018. Part 26: Stiffness. As it can be observed in Table 10 and Figure
34, the stiffness modulus values exhibited a steeper upward curve as a result of the increase in curing time,
which led to a higher maximum peak stiffness modulus value of about 3462 MPa – showing a significant
improvement in the average load-bearing capacity of 13% (i.e., from 24 to72 h), which is likely attributed
to the higher residual internal friction between the aggregate particles because of moisture loss by
evaporation and breaking of the emulsion (Bocci M et al., 2011).
0,0
0,3
0,6
0,9
1,2
1,5
1,8
2,1
2,4
2000
2200
2400
2600
2800
3000
3200
3400
3600
3800
4000
0,0 0,5 1,0 1,5 2,0 2,5 3,0 3,5
ITS
at 1
5ºC
(MPa
)
Stiff
ness
mod
ulus
at 2
0 ºC
(MPa
)
Emulsion content (%)
Stiffness Modulus (MPa) ITSdry (MPa)
Sm
ITSdry
Page 82
Chapter 5. Results and discussion
64
Therefore, it can be said that the use of a curing/drying treatment is assumed as a positive aspect to
improve the indirect tensile strength, stiffness modulus, and resistance to permanent deformation (Wu and
Li, 2017). Analogous results for mixes in need of curing process were found in other laboratory studies
conducted by (Kim and Lee, 2011)(Kim and Lee, 2011)Kim and Lee, (2011), who claim that the mixtures’
mechanical performance (i.e., flow number, ITS, and dynamic modulus) improves as a consequence of the
increase in curing time (Gao et al., 2014; Kim et al., 2011); whilst some other authors reported that mixtures
containing emulsified bitumen and fabricated at low temperatures tend to require an accelerated curing
treatment to further develop the ultimate mechanical performance properties (e.g., stiffness modulus and
ITS) at the early hours of being placed and compacted in the field (Bocci M et al., 2011; Godenzoni C et
al., 2016; Graziani A et al., 2016). In this recognition, the increase in the stiffness modulus values of the
HWMRA 100% RAP (2.5%o/RAP) mixtures confirms that these types of mixtures require a curing process
to develop a higher strength capacity and internal cohesion values of the ultimate mixture performance.
Figure 34 depicts the indirect tensile strength values of the HWMRA 100% RAP (2.5%o/RAP) mixture
with a 50/70 pen. bitumen against the effect of short- (0-24 h) and long-term curing treatment (48-72 h) on
the mix performance. As it can be observed in this Figure, the indirect tensile strength (ITS) values remained
relatively constant at the early stage of the curing treatment. However, at the end of the accelerated curing
process of three days (72 h), this mixture increased its internal cohesion value by approximately 8%, i.e.,
the ITS values increased from 2.17 to 2.34 MPa (from 48 to 72 h). The likely explanation for this result lies
in the adequate combination of the cohesive strength of the binder and adhesive interface bonding between
RAP aggregates and binder. Therefore, the use of an accelerated curing treatment of three days (72 h), at
50 ºC, in a forced-draft convection oven is highly recommended for half-warm mix’ production and
characterization in the laboratory.
Table 10. Mechanical and volumetric properties results of the mixtures after curing/drying treatment
Mixture properties Test method Curing time (h) – 2.5% emulsion ΔITS/ITSM
0-72h 0 24 48 72
ITS, in-dry, 15 ºC, (MPa) EN 12697-23 2.11 2.13 2.17 2.34 11%
Stiffness modulus, 20 ºC, (MPa) EN 12697-26 2891 2984 3077 3462 20%
Page 83
Chapter 5. Results and discussion
65
Fig. 34. Stiffness modulus at 20 ºC, and ITS, in dry, at 15 ºC vs. curing time
5.3.2 Rutting test
The results obtained from this testing method are displayed in Table 11, and consist of the wheel
tracking slope (WTSAIR) computed between 5000 and 10,000 load cycles, the mean rut depth max (mm,
RDAIR) and the proportional rut depth at 10,000 load cycles (%, PRDAIR). The results presented in this
table show that both HWMRA mixtures display similar, or equivalent, resistance to permanent
deformations to that of the HMA mixture. The wheel tracking test resulted in an average creep slope of
0.08 (mm/103 load cycles) between 5000 and 10,000 load cycles and a mean rut depth lower than 5%. Based
on these values and Spanish technical regulations in Art. 542.5.1.3: Resistance to permanent deformation
of hot mix asphalt mixtures, the HWMRA mixtures were found to meet the minimum requirements for
hot mix asphalt mixtures in binder and wearing course asphalt mixtures of road pavements or urban areas.
In other words, the wheel tracking slope of the 100% RAP mixture (2.5% o/RAP), at 60ºC, was found to
be 0.109 (mm/103 load cycles) and a proportional rut depth of 3.47%. Therefore, this mixture meets the
maximum threshold rutting values stipulated for hot mix asphalt mixtures in the base, binder, and surface
layer asphalt mixtures of road pavements subject to intermediate and low traffic load categories, and
moderate thermal weather zones in Spain (Spanish Ministry of Public Works, 2015).
2,00
2,05
2,10
2,15
2,20
2,25
2,30
2,35
2,40
2500
2750
3000
3250
3500
3750
4000
0 24 48 72
ITSd
ry a
t 15
ºC (M
Pa)
Stiff
ness
mod
ulus
at 2
0 ºC
(MPa
)
Curing time (hours)
Stiffness Modulus ITS dry
ΔITS = 8%(48-72 h)ΔITS = 13%
(48-72 h)
Page 84
Chapter 5. Results and discussion
66
Table 11. Wheel tracking test results, at 50 ºC and 60 °C, of the 100% RAP mixtures
Mix properties Unit HWMRA 100% RAP samples
2.5%
50 °C
2.5%
60 °C
3.0%
60 °C
Apparent density, by SSD, g/cm3 2.302 2.328 2.330
Deformation at 5000 load/cycles, (RDAIR) mm 0.52 2.11 2.48
Deformation at 10.000 load/cycles, (RDAIR) mm 0.86 2.66 3.19
Wheel tracking slope, (WTSAIR) mm/103 0.068 0.109 0.143
Proportional rut depth, (PRDAIR) % 1.42 3.47 5.3
Key: *It is worth noting that though the asphalt mixture does not meet the maximum wheel tracking slope (WTSAIR)
value of 0.07 (mm/1000 load cycles), between 5000 and 10.000 load cycles, the asphalt mixture is allowed to extend
its maximum wheel tracking slope (WTSAIR) value up to 0.15 (mm/1000 load cycles) and proportional rut depth
(PRDAIR) value lower than 5%, according to Art. 542.5.1.3: Resistance to permanent deformation of hot mix asphalt
mixtures (Spanish Ministry of Public Works, 2015)
On the other hand, it was observed that HWMRA 100%RAP mixture with 2.5% (o/RAP) emulsion,
at 50 ºC, exhibited an average wheel tracking slope value of 0.068 (mm/103 load cycles), between 5000 and
10,000 load cycles, and an average proportional rut depth (%, PRD) value of 1.42%, suggesting that the
wheel tracking results, in general, depend more on the test temperature than on the recycled content added,
even for the HWMRA 100%RAP mixture. It is highly recommended to include these types of rutting
performance requirements in the drafting of new technical guidelines for this technology.
Figure 35 shows that the slope of the 100% RAP mixture’ rut depth curve (2.5% o/RAP), at 60 ºC,
was slightly steeper by rising sharply during the first 5,000 loading cycles and becomes more stable when
applying 8,000 loading cycles with the wheel tracker. Despite this, the addition of high RAP contents in
asphalt mixtures typically tends to improve the resistance to permanent deformation as a result of the
physical hardening and chemical aging (i.e., because of the evaporation of the lighter oil fractions in the
bitumen) suffered by the asphalt binder during its service life.
Analogous results for mixes containing high and total rates of RAP and additives have been found
and contrasted by multiple authors (Apeagyei et al., 2011; J. . Doyle and Howard, 2013; Hajj EY et al.,
2009; Kim et al., 2017; Topal et al., 2017; Zhao et al., 2012); whilst the results reported by other authors
are rather less conclusive, in the sense that mixtures manufactured at low temperatures and emulsified
bitumen are typically characterized by having a lower rutting performance than that of the conventional
HMA mixtures (Button et al., 2007). It was observed that for the 3.0% (o/RAP) emulsion content, the
slope of the rut depth curve was much steeper by rising rapidly during the first 3000 loading cycles and
becomes more stable thereafter (i.e., for 8,000 loading cycles with the wheel tracker) – suggesting that this
Page 85
Chapter 5. Results and discussion
67
content might have lower resistance to permanent deformation, regardless of the recycled RAP content
added into the new mix. The likely explanation for this result lies in the effect of higher emulsion content
(3.0%o/RAP) added in the mixture design that promoted the decrease in the mixture’ rutting performance
values.
Figure 35. Wheel tracking results of the HWMRA 100% RAP mixes with 2.5 and 3.0%o/RAP and 50/70 pen. bitumen
5.3.3 Fatigue resistance
In Figure 36, the classical mixtures’ fatigue cracking resistance laws for each type of penetration
grade bitumen (50/70 and 160/220) were evaluated. The determination coefficients, (R2), fell within the
range of 90-95%, indicating a right level of correlation. It was observed that for the strain-fatigue levels
tested; the HWMRA mixes with 50/70 and 160/220 pen. grade bitumen showed comparable fatigue slopes
- suggesting that they have an equivalent sensitivity to stress in terms of fatigue life, although a slight
discrepancy can be noted at lower tensile-strain fatigue levels. In other words, the fatigue life of the
HWMRA 100% RAP with 160/220 pen. grade bitumen was found to be slightly better than that of the 50/70
pen. bitumen, likely attributed to the effect of softer penetration grade bitumen in the final mixture design
that promoted the extension of the mixture’ fatigue resistance law.
In this context, for the HWMRA 100% RAP (2.5%) mixtures with 50/70 pen. grade bitumen, the
average flexural modulus was found to be 6331 MPa (with a standard deviation (SD) of 465 MPa and a low
coefficient of variation (CV) equal to 7.5%), and strain-fatigue level, (휀6), at 106 load cycles, of 143 µm/m;
whereas, for 2.5% emulsion with 160/220 pen. grade bitumen, the average flexural modulus of 5936 MPa
was obtained, and an average microstrain-fatigue level of 155 µm/m. Analogous results for 4PB fatigue
0
1
2
3
4
5
0 1000 2000 3000 4000 5000 6000 7000 8000 9000 10000
Rut
dep
t (m
m)
Number of load cycles
2.5%o/RAP -50 ºC 2.5%o/RAP -60 ºC 3.0%o/RAP -60 ºC
Page 86
Chapter 5. Results and discussion
68
cracking and fracture properties have been found in other laboratory studies by other researchers (Botella
et al., 2016; Dinis-Almeida M et al., 2016; Nosetti et al., 2018) for a WMA/ HMWA mixture with a total
RAP content (100%) and emulsified bitumen.
Figure 36. Fatigue resistance laws, at 20 ºC, of the HWMRA 100% RAP mixe with 2.5%o/RAP emulsion and
50/70 and 160/220 pen. grade bitumens
Conventional HMA mixture
Figure 37 illustrates the volumetric and mechanical performance values of the traditional HMA mixtures
against four asphalt binder contents (4.5%,5.0%,5.5%, and 6.0% by weight of aggregates), at 0.5%
increments. The results of each binder content were calculated: (a) maximum density (g/cm3); (b) bulk
density (g/cm3); (c) air voids in the mix (Vm,%); (d) air voids in the mineral aggregate (VMA,%); (e)
Marshall stability (kN); and (f) flow number expressed in terms of mm.
It can be observed in this Figure that the slope of the Marshall stability curve showed a steeper
upward behavior by reaching a maximum peak value of 9 kN for the 5.5% binder content, however, this
latter content exhibited a flow number of 2.6 mm; whereas, for 5.0% binder, this number was found to be
8.5 kN and 2.4 mm flow. Despite this, and based on the Spanish technical specifications, all of the bitumen
contents used in the preliminary mix design were slightly lower than the minimum Marshall stability (10
kN) values suggested by other researchers (Arabani and Azarhoosh, 2012; Dhir et al., 2019; Lee et al.,
y = 0,0014x-0,165
R² = 0,9141y = 0,0015x-0,164
R² = 0,9559
0,00001
0,00010
0,00100
1.000 10.000 100.000 1.000.000 10.000.000
Tens
ile st
rain
(µm
/m)
Number of load cycles (Nf)
HWMRA 100%RAP (2.5%) - 50/70 dmm HWMRA 100% RAP (2.5%)- 160/220 dmm
Page 87
Chapter 5. Results and discussion
69
2012; Motter et al., 2015; Pasandín and Pérez, 2013; Pérez et al., 2007; Zhu et al., 2012) for T3 traffic load
category (200>AADT≥50). The likely explanation for the decreased result lies in the fact that the overdose
of bitumen content added into the mixture design, which reduces the internal friction/adhesion properties
between aggregates and binder and hence decreases the stability values (Ruíz, 2001).
Nevertheless, for the Marshall flow number, it was observed that 5.0% (of total weight of
aggregates) was slightly lower than the minimum threshold values (2.5-3.5 mm) stipulated by the Spanish
technical specifications (Spanish Ministry of Public Works, 2015) and others researchers (Behnood et al.,
2015; Djakfar et al., 2015; Hou et al., 2017; Marques et al., 2014; Pasandín and Pérez, 2013; Pérez et al.,
2013; Rafi et al., 2011) and that the more the bitumen content added into the preliminary mix design, the
better the mixture behavior (when it is loaded during the Marshall stability test), except for 6.0% binder
content. Therefore, it can be concluded that 5.5% binder content (of the total weight of aggregates) was
discarded for this research study since it delivers/offers much lower mechanical performance properties in
terms of rutting with the wheel tracker (EN 12697-22:2008+A1).
(a) (b)
(c) (d)
2,467
2,45
2,434
2,417
2,40
2,42
2,44
2,46
2,48
4,0 4,5 5,0 5,5 6,0 6,5
Max
imum
den
sity
(gr/c
m3 )
Bitumen content (%,s/a)
2,314
2,331 2,33
2,321
2,30
2,31
2,32
2,33
2,34
2,35
4,0 4,5 5,0 5,5 6,0 6,5
Bul
k de
nsity
(gr/c
m3 )
Bitumen content (%,s/a)
6,2
4,9
4,34
2
3
4
5
6
7
8
4,0 4,5 5,0 5,5 6,0 6,5
Air
void
s (%
)
Bitumen content (%,s/a)
16,3 16,2
16,7
17,5
15,0
15,5
16,0
16,5
17,0
17,5
18,0
4,0 4,5 5,0 5,5 6,0 6,5
VM
A (%
)
Bitumen content (%, s/a)
Page 88
Chapter 5. Results and discussion
70
(e) (f)
Figure 37. Volumetric characteristics (e.g., maximum density, bulk density, Vm, VMA) Marshall stability and flow
number against four asphalt binder contents with a 50/70 pen bitumen
Once the optimum emulsion content (5.0% of the total weight of aggregates) of the conventional
HMA mixtures was defined based on the average values of Marshall stability, Marshall flow, air voids,
VMA and VFB, the resistance to moisture damage, or binder – aggregate adhesion, was assessed by
conducting the water susceptibility test, according to EN 12697-12:2008. Part 12: Water sensitivity. To
this end, a set of three specimens were prepared and compacted by applying 50 impact-blows on each side
with the Marshall compactor hammer, according to EN 12697-30:2012. Test methods for hot mix asphalt.
Part 30: Specimen preparation by specimen compactor. The wet and dry indirect tensile strength, ITS-
dry, of 2.149 and 2.47 MPa, respectively, and the indirect tensile strength ratio (ITSR) was found to be
87%. For the ITSdry, the average specimen’s height of 63.4 mm was obtained.
Posteriorly, the mixtures’ mechanical performance was completed by conducting the wheel tracking
test, at 60 ºC, according to EN 12697-22:2012. Part 22: Wheel tracking test. The average wheel tracking
slope (WTSAIR) of the HMA mixture was found to be 0.063 (mm/ 1000 load cycles), between 5000 and
10.000 cycles, with an average rut depth (RDAIR) of 3.1% and a proportional rut depth maximum (PRDAIR)
of 5.2%.
Therefore, based on the author’s results and Spanish technical regulations in Art. 542.5.1.3:
Resistance to permanent deformation of hot mix asphalt (HMA) mixtures, one can conclude that the
HMA mix meets the minimum moisture damage requirements of HMA mixtures for their use in the binder
and wearing course asphalt mixtures of road pavements, as illustrated in Table 12.
8
8,5
9,0
8,25
7,0
7,5
8,0
8,5
9,0
9,5
10,0
4,0 4,5 5,0 5,5 6,0 6,5
Mar
shal
l Sta
bilit
y (k
N)
Bitumen content (%,b/a)
2,3
2,4
2,6
2,5
2,2
2,3
2,4
2,5
2,6
2,7
4,0 4,5 5,0 5,5 6,0 6,5
Flow
num
ber (
mm
)
Bitumen content (%,b/a)
Page 89
Chapter 5. Results and discussion
71
Table 12. Wheel tracking test results of the conventional HMA mixture
Mixture property Test method Sample 1 Sample 2 Value
Apparent density, SSD, (g/cm3) 12697-6:2012 2.325 2.325 2.325
Wheel tracking slope, WTSAIR, mm/10³ load cycles
12697-22:2012 0.059 0.067 0.063
Proportional rut depth max, PRDAIR, (%) 12697-22:2012 4.8 5.5 5.2
Deformation at 10,000 cycles, Rut depth,
RDAIR, (mm)
12697-22:2012 2.9 3.3 3.1
Quality control after in-plant manufacturing
In order to evaluate the technical viability of manufacturing the HWMRA mixtures in a modified
asphalt batch plant, in-plant produced samples were collected (EN 12697-27: 2017. Bituminous mixtures.
Test Methods. Part 27: Sampling) and tested in the laboratory in order to characterize the recovered RAP
binder and also to verify their compliance in terms of binder content in the final mixture design, air voids
content, stiffness modulus, at 20 °C, water sensitivity and resistance to permanent deformations.
The RAP binder was extracted through the rotatory evaporator (EN 12697-3:2012. Part 3: Bitumen
recovery) to obtain some conclusions regarding bitumen’s physical consistency properties (i.e., penetration
and softening point) and chemical properties through the chromatography technique, according to ASTM
D4124-09: Standard Test Method for Separation of Asphalt into Four Fractions; where SARA fractionation
test consisted of determining the percentage of asphaltenes, aromatic, resins, and saturates contained in the
RAP binder. Table 13 shows the results of the physical characterization of the recovered RAP binder after
in-plant mixtures manufacturing.
Table 13. Characterization of the recovered RAP binder of the in-plant samples
Properties Test method HWMRA 100% RAP
2.5% -50/70 3.0% -
50/70
Binder content, b/a, (%) EN 12697-1:2012 6.09 5.85
Penetration, (0.1 mm) EN 1426:2015 17 18
Softening point, R&B, (°C) EN 1427:2015 69.2 71
ASTM D 4124:2018: Standard Test Method for Separation of Asphalt into Four Fractions
Page 90
Chapter 5. Results and discussion
72
Saturates Hydrocarbons (%) ASTM D4124-09 12.88 10.63
Asphaltenes, (%) ASTM D4124-09 29.90 30.17
Resin, Naphthene-aromatic, (%) ASTM D4124-09 27.92 29.16
Aromatic-polar compounds, (%) ASTM D4124-09 29.15 30.04
Stability Index
Compatibility, C > 0.5 2.68 2.27
Colloidal Instability Index, CII <1 0.79 0.74
Durability, 0.4 < CCR <1.5 1.18 1.41
The final binder content in the HWMRA 100 mixtures was found not to vary on a percentage greater
than ± 0.3%, in relation to the content previously established in the preliminary laboratory mixture design,
according to Art. 542.9.3.1 of PG-3: Manufacturing, as illustrated in Figure 38a-b. The binder contents in
the final mixture design were found to be always above 4.5% (%, b/m) of the total weight of the mixture,
which is the minimum binder content required for dense-graded HMA mixtures (AC16 D), according to
Spanish technical regulations in Art. 542 of PG-3 (Spanish Ministry of Public Works, 2015).
Laboratory specimens were prepared and compacted with the gyratory compactor following the same
laboratory standard conditions, namely an internal angle of 0.82º, a compaction pressure of 600 kPa, and a
rotation speed of 30 gyrations/minute. Posteriorly, the quality of the in-plant manufactured mixtures were
evaluated in the laboratory through the following tests: (1) water sensitivity test; (2) stiffness modulus, at
20ºC; (3) resistance to permanent deformation, at 60°C, and; (4) indirect tensile strength (ITS), at 15 ºC;
and (5) air voids. Figure 38c displays the air void content of the samples. From the results presented in this
figure, it can be concluded that the air voids contents targeted were successfully achieved for both HWMRA
mixtures, as they were found to fall within the range of 3-6%.
The moisture damage resistance was assessed through the water sensitivity test, according to EN
12697-12:2008. Part 12: Water sensitivity. Thus, the samples were prepared and compacted with the
gyratory compactor by applying two-thirds (2/3) of the total compaction energy used for laboratory
specimen production, that is, 44 gyros for the HWMRA 100% RAP mixture. The test was carried out on
six cylindrical samples divided into two subset groups: wet and dry conditions. The wet subset was
submerged under a water bath at 40°C during 72 h, whereas the dry subset group was kept in dry. The
samples were then subjected to a loading-controlled rate of 50 mm/min, after which the indirect tensile
strength ratio (ITSR) was computed as the retained strength ratio, according to EN 12697-23:2007. Part
23: Determination of the indirect tensile strength of bituminous specimens.
Page 91
Chapter 5. Results and discussion
73
The indirect tensile strength ratio (ITSR) of each mixture was found to be above 85% (Figure 38d).
The average moisture damage resistance value of the 100% RAP mixture (2.5%o/RAP) was found to be
89%, while for the 3.0%o/RAP, this percentage was 94%. In particular, the high retained water strength
value results of both mixtures can be attributed to the fact that RAP mixes, or recycled aggregates, are
already coated with a thin film of asphalt binder, that in turn, prevents the water penetration into the particles
(Karlsson and Isacsson, 2006; Mogawer et al., 2012; Zaumanis et al., 2014). Therefore, both HWMRA
mixtures meet the minimum percentage required for hot mix asphalt mixtures in base, binder (80%) and
wearing (85%) courses of road pavements subjected to any load traffic category and thermal weather zone
in Spain.
The resistance to permanent deformation of the HWMRA 100% RAP mixture with 2.5% (o/RAP)
emulsion was determined, according to EN 12697-22:2012. Part 22: Wheel tracking test. To do this, the
in-plant samples were compacted with a benchmark density value above 98% using the steel roller
compactor, according to EN 12697-33:2006+A1. Part 33: Specimen prepared by roller compactor. The
average apparent density of the finished prismatic-shaped specimens was found to be 2.329 g/cm3 and air
voids content of 4.2%. Generally, the inclusion of high RAP contents enables to improve the resistance to
permanent deformations because of the hardening and aging process suffered by the asphalt binder. In this
consonance, similar rutting resistance results have been found and corroborated for various authors
(Apeagyei AK et al., 2011; J. . Doyle and Howard, 2013; Hajj et al., 2009; West R et al., 2012).
As far as the HWMRA 100% RAP mixture samples are concerned, they showed some deformation
slope values slightly above 0.10 (mm/ 1000 load cycles), between 5,000 and 10.000 load cycles, as depicted
in Figure 38e. Despite that, they still meet the mean rut depth value of lower than 5% when applying 10,000
load cycles in the wheel tracker. In other words, the average wheel tracking slope (WTSAIR) of the
HWMRA 100% RAP mixtures with 2.5%o/RAP and 50/70 pen. bitumen was found to be 0.12 (mm/103
load cycles), between 5000 and 10.000 load cycles, and an average rut depth (RDAIR) of 4.28 mm –
implying that this mixture presented a slightly lower wheel tracking slope than the maximum value
(WTS=0.15 mm/103 load cycles) established by the Spanish technical specifications, according to Art.
542.5.1.3 of PG-3: Resistance to permanent deformation of hot mix asphalt mixtures (Spanish Ministry
of Public Works, 2015).
The mixtures’ load-bearing capacity was evaluated through the stiffness modulus test, at 20°C,
according to EN 12697-26:2018. Part 26: Stiffness. This parameter was computed as the average value of
10 indirect tensile haversine load waveform pulses, while five (5) load pulses were posteriorly applied, with
a rise time of 124 ± 3 ms, to determine the stiffness modulus of the asphalt mixtures. To this end, asphalt
samples of each type of asphalt mixture (100% and 70% RAP content) collected after in-plant manufacture,
were prepared and compacted in the laboratory, with a diameter of 101.6 mm and a height of 60 ± 5 mm,
using the same standard conditions set in the preliminary laboratory mix design. Figure 38f shows the
stiffness modulus values obtained for each type of HWMRA mixture.
Page 92
Chapter 5. Results and discussion
74
For the HWMRA 100% RAP mixture with 2.5% emulsion content, the average stiffness modulus
value of 5839 MPa was obtained, whilst for the 3.0% RAP emulsion, this number was 5604 MPa (with a
standard deviation of 293 MPa and a COV equal to 6.6%), where the latter mixture showed a lower bearing
capacity than that of the 100% RAP mixture. Similar stiffness modulus values for cold recycled mixtures
(CRM) with a total RAP content (100%) were reported in other studies conducted by other researchers
(Sangiorgi et al., 2017). However, the decrease in the stiffness of the 100% RAP mixture with 3.0%
emulsion can be assumed as a positive aspect to improve the mixture’ fatigue cracking resistance since it
would make it less stiff and brittle by enabling higher deformations before its cracking failure occurs in the
field.
(a)
(b)
(c)
(d)
3,5
4,0
4,5
5,0
5,5
6,0
6,5
7,0
7,5
8,0
bind
er /a
aggr
egat
e (%
)
JMF- Upper limitHWMRA 100% RAP (3.0%)JMF- Lower limitPG-3 Minimum value
3,5
4,0
4,5
5,0
5,5
6,0
6,5
7,0
7,5
8,0
% b
inde
r /ag
greg
ates
JMF- Upper limitHWMRA 100% RAP (2.5%)JMF- Lower limitPG-3 Minimum value
1
2
3
4
5
6
7
8
9
10
Air
void
con
tent
( %
)
HWMRA 100% RAP (2.5%)HWMRA 100% RAP (3.0%)
70
75
80
85
90
95
100
Ret
aine
d st
reng
th (%
)
HWMRA 100% RAP (2.5%)HWMRA 100% RAP (3.0%)
ITSR ≥ 85%
Page 93
Chapter 5. Results and discussion
75
(e)
(f)
Figure 38. Results of the quality control tests of in-plant manufacture mixes: a) binder contents in the final mixture
design of the HWMRA 100% RAP mixture with 2.5% and 3.0% emulsion content; b) binder contents in the final
mixture design of the HWMRA 100% RAP mixture; c) air voids; d) retained strength ratio; e) deformation slope,
and; f) stiffness modulus at 20ºC.
Table 14 collates the particle size distribution of the 100% RAP mixes with 2.5% and 3.0% (o/RAP)
emulsion after in-plant manufacturing; whilst Figure 39 shows the aggregate grading curves and the upper
and lower threshold values stipulated for an AC16 D mixture; where the orange solid-continuous curve
represent the target grading curve after in-plant manufacturing, whilst the purple dashed lines stands for the
restricted threshold values, according to Art. 542.9.3.1: Manufacturing*.
The aggregate particle grading curves (2.5% and 3.0% o/RAP) fell within limits stipulated for an
AC16 D mixture and meet the minimum threshold values established by the Spanish technical
specifications. The likely explanation is attributed to the right maneuvers of screening, processing, and
classification of the RAP material into two fractions (i.e., 0/5 mm and 5/25 mm) that allowed the provision
of adequate volumetric and mechanical performance properties in the final mix design. However, it can be
observed that for the 0.025- and 0.063-mm sieve size, the aggregate grading curves fell out of the threshold
values stipulated for an AC 16 D mixture.
Table 14. Aggregate gradation composition and binder content
Sieve size –
UNE (mm)
HWMRA 100% RAP HMA AC 16 D
2.5% o/RAP 3.0% o/RAP Lower limit Upper limit
31.5 100 100 100 100
22 100 99.5 100 100
16 96.2 94.8 90 100
0,00
0,02
0,04
0,06
0,08
0,10
0,12
0,14
0,16R
ut d
epth
(mm
/100
0)HWMRA 100% RAP (2.5%)
HWMRA 100% RAP (3.0%)
2.000
3.000
4.000
5.000
6.000
7.000
8.000
Stiff
ness
mod
ulus
(MPa
)
HWMRA 100% RAP (2.5%)HWMRA 100% RAP (3.0%)
Page 94
Chapter 5. Results and discussion
76
8 70.7 69.7 64 79
4 49.7 49.2 44 59
2 37.2 37 31 46
0.5 21.4 21.3 16 27
0.25 16.1 16 11 20
0.063 8.5 9.0 4 8
Binder content (%, b/a) 5.85 ± 0.29 6.19 ± 0.1 - -
*Key: The threshold dispersion limits, and/or tolerance permissible values, that should be met in relation to the particle
size distribution (EN 933-2:1996: Determination of particle size distribution. Test sieves, nominal size of apertures) of
the job mix formula, referred to the total mass of aggregates (including mineral filler), include the followings
requirements: (a) For sieve size above 2 mm: four-percent (±4%); (b) For 2 mm sieve size: three-percent (±3%); (c)
For sieve size between 2 and 0.063 mm should be equal to ±2%, and (d) 0.063 sieve size: one-percent (±1%).
Figure 39. Aggregate grading curves of HWMRA mixes with 100% RAP (2.5% and 3.0% o/RAP)
0
10
20
30
40
50
60
70
80
90
100
0,01 0,1 1 10 100
Pass
ing
(%)
Sieve size (mm)
HWMRA 100% RAP (2.5%) HWMRA 100% RAP (3.0%)AC 16 D-lower limit AC 16 D-upper limitRestricted sieve size Restricted sieve size
Restricted threshold values
Grading curve
Page 95
Chapter 5. Results and discussion
77
Figure 40 shows the mix production, construction process, and monitoring of the HWMRA 100% RAP
mixes with 2.5% and 3.0% (o/RAP) emulsion content in the test road section: (a-b) Manufacturing, at 100
ºC, in a discontinuous asphalt batch plant; (c-d) mixture spreading by a Vögele asphalt paver in the range
of between 80 ºC and 95 ºC; (e-f) mixture compaction using a vibratory steel double-drum and a pneumatic
road roller in the working range of 60 -80 ºC; and (g-h) final surface texture of the binder course asphalt
mixture and pavement cores extraction with a rotary drill. Moreover, an infrared thermographic camera
system (FlirB-360) was used to monitor the manufacturing, paving, and compaction temperatures
throughout the construction process in the urban street section.
(a) (b)
(c) (d)
Page 96
Chapter 5. Results and discussion
78
(e) (f)
(g) (h)
Figure 40. Manufacturing and construction process of the HWMRA100% RAP mixtures with 2.5% and 3.0%
o/RAP emulsion and 50/70 pen. bitumen (Lizarraga et al., 2017)
Benchmark density after pavement construction
Once the HWMRA mixtures with 2.5% and 3.0% (over the weight of RAP) emulsion were laid
and compacted, an average of sixteen (16) pavement cores of each type of mixture were extracted from the
test road section in order to verify if the mixtures meet the minimum percentage of the benchmark density
of the specimens compacted with the gyratory compactor at 70 gyrations (0.82º, 600 kPa and 30 rpm) in
the laboratory. Thus, the bulk density of the pavement cores was calculated, according to EN 12697-6:2012.
Test methods for hot mix asphalt. Part 6: Determination of bulk density of bituminous specimens.
This research study revealed that the pavement cores’ benchmark density was successfully reached,
without any compactibility issue, after the first-round sampling took place in the field. In other words, the
average bulk density of the 2.5%o/RAP cores was found to be 2.262 g/cm3 (with an SD of 57.8 g/cm3 and
Page 97
Chapter 5. Results and discussion
79
a CV equal to 2.6%), with an average air voids content of 6.92% (with a standard deviation (SD) of 2.38%
and coefficient of variation (CV) of 34.46%) and cores’ height of 53.64 mm; whilst, for the 3.0%o/RAP
emulsion, the average apparent density was 2.309 g/cm3 (with an SD of 59.4 g/cm3 and a CV equal to
2.57%), cores’s height of 54.9 mm (with a SD 6.02 mm and a CV of 11%) and air voids content of 5.2%
(with an SD of 34.5% and a CV of 2.38). In short, the benchmark density of the pavement cores with
2.5%o/RAP emulsion was fixed as 2.330 g/cm3, while, for the 3.0% emulsion, this value was 2.340 g/cm3.
Therefore, the average compaction percentage of the 2.5% o/RAP cores was found to be 99.1%, while, for
the 3.0% emulsion, this percentage was 97%.
Although the mixture densification for the 3.0% o/RAP was slightly lower than that of the expected
density, this mixture still meets the minimum benchmark density value (97%) of hot mix asphalt mixtures
for layer thickness below 60 mm, according to Spanish technical specifications in Art. 542.7.1: Density.
Figure 41 shows the apparent density (g/cm3) and percentage of compaction achieved by using
conventional machinery, i.e., a steel double-drum roller and a pneumatic tire road roller.
Figure 41. Volumetric characteristics and mechanical properties of the pavement cores after in-situ construction
101100.2
101.6
98.2
91.9
98.7
96.597
99.1
101.1101.7
99.9
101.2
100100,3
97,297.297.6
97.6
101.2
97
93.3
10099.5
96.1
93.3
96.497
97.6
94.4
96.9
2.100
2.150
2.200
2.250
2.300
2.350
2.400
2.450
1 2 3 4 5 6 7 8 9 10 11 12 13 14 15 16
bulk
d de
nsity
(g/c
m³)
bulk density (g/cm³) -2.5%o/RAP bulk density (g/cm³) -3.0%o/RAP Target density -2.5%
𝝆𝒔𝒔𝒅 =2.33 g/cm3 - for the 2.5%
𝝆𝒔𝒔𝒅 =2.34 g/cm3 – for the 3.0%
Page 98
Chapter 5. Results and discussion
80
5.6.1 Mechanical performance
Figure 42 shows a comparison of three laboratory compaction test methods (Marshall with 75 and
100 impact-blows, Static compressive stress load of 10 MPa and gyratory compactor with 70 gyrations)
and pavement cores (2.5% and 3.0% over the weight of RAP) in terms of mechanical performance.
Regarding the indirect tensile strength (ITS) values of the 100% RAP (2.5%, o/RAP) mixtures, the
average wet and dry internal cohesion values were found to be 2.63 MPa and 2.83 MPa, respectively, and
the indirect tensile strength ratio (ITSR) of 93% was obtained; whereas, for the 3.0% (o/RAP) mixture
cores, the average wet and dry internal cohesion values were 1.78 MPa and 2.04 MPa, respectively, and the
resulting moisture damage value was 87.3% - showing that whether the pavement cores are compacted
below 97% of the benchmark density, the air voids increases and hence the indirect tensile strength is
reduced. This is likely attributed to the rise of spaces without aggregate or bitumen on the plane where the
break occurs, which means that there is less surface for resisting tensile stress due to traffic loading
(Moreno-Navarro et al., 2014). As for the stiffness modulus value results, the average load-bearing capacity
values, at 20 ºC, of the 2.5% pavement cores was found to be 4577 MPa (with an SD of 1030 MPa and a
CV of 22%), whilst, for the 3.0% emulsion, this content turned out to be 3431 MPa (with an SD of 1037
MPa and a CV equal to 30%).
Figure 42. Comparison of mechanical performance (ITS and stiffness modulus) of laboratory and field performance
Marshall75 blows
Marhall100
blows
Staticload (10
Mpa)
HWMRA100%RAP (2.5%)-70 gyros
HWMRA100%RAP (3.0%)-70 gyros
HWMRA100%RAP (2.5%)- Curing
Cores(2.5%)
Cores(3.0%)
Stiffness (MPa) 2496 2473 3578 2988 2560 3462 4577 3431ITS (MPa) 1,33 1,18 1,66 2,13 1,93 2,34 2,64 2,29
2988
3462
0,0
0,5
1,0
1,5
2,0
2,5
3,0
3,5
4,0
0
500
1000
1500
2000
2500
3000
3500
4000
4500
5000
ITS
at 1
5 ºC
(MPa
)
Stiff
ness
mod
ulus
at 2
0 ºC
(MPa
)
ΔSm= 16%
Page 99
Chapter 5. Results and discussion
81
5.6.2 Fatigue characterization
The indirect tensile fatigue test on cylindrical shaped specimens was conducted, at 20ºC, using a
loading frequency of 20 Hz, according to EN 12697-24:2012. Part 24: Resistance to fatigue - Annex E.
The fatigue cracking resistance slopes of the HWMRA 100% RAP (3.0%o/RAP) and HMA mixtures, they
are practically identical ̶ suggesting that they have an equivalent sensitivity to stress in terms of fatigue
life (i.e., the number of load cycles Nf linked to the mixtures’ fatigue failure criterion at a given temperature,
frequency, and loading). Figure 43 collates the fatigue cracking resistance laws of the HWMRA100%RAP
mixtures with two emulsion contents (2.5% and 3.0%o/RAP) and conventional HMA mixture.
On the other hand, the fatigue slope of the HWMRA (2.5%o/RAP) mixture is slightly steeper than
that the rest of the mixtures studied, whereas, for the HWMRA (3.0%o/RAP) mix, it appears to have a good
ability to withstand a higher number of load cycles before its fatigue cracking failure occurs. The likely
explanation for this result lays in the effect of higher emulsion content in the final mixture design that
promoted a higher stable behavior in terms of fatigue life (Maupin Jr et al., 2008). Thus, one can say that
for the stress level tested, the fatigue performance of the HWMRA mixes (2.5% and 3.0% o/RAP) was
satisfactory in comparison with conventional HMA mixes. Table 15 shows the coefficient of determination,
R2, stiffness modulus, and tensile strain at 106 load cycles (a, b, R, and ε6) of each type of mixture studied.
Figure 43. Fatigue cracking laws, at 20 ºC of HWMRA 100% RAP mixes (2.5% and 3.0%o/RAP) and HMA mixture
y = 0,0007x-0,159
R² = 0,7906y = 0,0009x-0,177
R² = 0,8727y = 0,0006x-0,149
R² = 0,9195
0,00001
0,0001
0,001
100 1.000 10.000 100.000 1.000.000
Tens
ile st
rain
(µm
/m)
Number of Load cycles (Nf)
HWMRA 100% RAP - 3.0% HWMRA 100% RAP - 2.5% HMA AC16 Surf S
Page 100
Chapter 5. Results and discussion
82
Table 15. Fatigue law coefficients of HWMRA 100 (2.5 and 3.0%) and HMA cores
Mixture type HWMRA 100 % RAP mixtures HMA AC 16 D
50/70 dmm 2.5% - 50/70 3.0% - 50/70
a (μm/m) 0.0007 0.0009 0.0006
b (-) 0.159 0.177 0.149
R2 0.7906 0.8727 0.9195
Modulus (MPa) 3284 3792 4287
Ɛ6 (με) 63 69 75
Monitoring plan of the pavement surface characteristics
5.7.1 Macrotexture
Figure 44 shows the average surface macrotexture depth value results in the two surface friction campaigns.
As can be seen in this Figure, all mixtures met the minimum values required (0.7 mm) for use in the binder
and wearing courses asphalt mixture, according to the Spanish technical specifications in Art. 542.7.4:
Macrotexture, being the HWMRA 100% RAP mixture (3.0%,o/RAP) the one that presented the highest
average value (0.79 mm). However, a significant progressive reduction in the macrotexture value was found
after one year and a half after the construction of the pavement section. The likely explanation for this result
lay on the occlusion of the air voids as a consequence of the migration of the binder and dust existing in the
mixture, as well as on the post-compaction action promoted by the vehicle traffic loads (Vaiana R et al.,
2012). For the HWMRA 100%RAP mixtures (2.5% and 3.0%) reached a maximum post-peak macrotexture
value and, after that, they fell again to the initial value measured in the first surface campaign.
Figure 44. Surface macrotexture depth value results in the two first surface campaigns
HWMRA 100% RAP (2.5%) HWMRA 100% RAP (3.0%)2012 0,78 0,792013 0,65 0,65
0,0
0,1
0,2
0,3
0,4
0,5
0,6
0,7
0,8
0,9
1,0
Mac
rote
xtur
e (m
m)
Page 101
Chapter 5. Results and discussion
83
5.7.2 International surface roughness index
Looking at the international roughness index values, in 2014, the HWMRA (3.0%,o/RAP) mixture
showed the highest average surface roughness index value of 1.115 m/km (with an SD of 0.29 m/km and a
coefficient of variation (CV) equal to 26.3%), whilst, for the HWMRA (3.0%o/RAP) the average surface
roughness was found to be 1.015 m/km (with an SD of 0.34 m/km and a CV equal to 34.3%). Therefore, a
slight increase in roughness deterioration of the latter emulsion mixture of 10% was calculated, likely due
to the vertical stress and deformation promoted by the heavy traffic loads on the low-speed lane. However,
this surface deterioration is somewhat attributed to the potential construction or paving operations than of
pavement wear or surface distress (i.e., rutting, transverse, reflective and longitudinal cracking) of the
pavement structure (Martínez-echevarría et al., 2016; Zaumanis M and Haritonovs V, 2015). Figure 45
illustrates how the average international surface roughness index values (m/km) of the 100% RAP mixtures
(2.5% and 3.0% o/RAP) evolve by considering the traffic loading category to be supported over three years
in service. This Figure also shows the error bars plotted in terms of standard deviation (SD) along with the
coefficient of regression, wherein, R2, represents a regression model for IRI prediction values over time. This mixture still meets the requirements stipulated by the Spanish technical specifications in Art. 542.10.3:
Surface Roughness.
Figure 45. International roughness index (m/km) of the 100% RAP mixtures (2.5% and 3,0% o/RAP)
2012 2013 20142.5%o/RAP 0,9647 1,0481 1,11473.0%o/RAP 0,9542 0,9853 1,0151
y = 0,075x + 0,8926R² = 0,9958
y = 0,0305x + 0,9239R² = 0,9998
0,2
0,4
0,6
0,8
1,0
1,2
1,4
1,6
1,8
2,0
IRI (
m/k
m)
Page 102
84
Chapter 6
6 LOOKING AHEAD: SELF-HEALING ANALYSIS
OF HWMRA MIXES CONTAINING 100% RAP
In previous Chapters, the viability and characterization of half-warm mix recycled asphalt
(HWMRA) mixes were studied to contribute to the development of the current practices and research
projects associated with this recent technology. Therefore, this Chapter aims to promote a new technology
based on new perspectives that allow achieving a better optimization of maintenance and rehabilitation
(M&R) works of road pavements. This Chapter can be read as a Foreword to the doctoral thesis adapted
for upcoming research projects.
Introduction
Asphalt concrete (AC) mixtures are typically exposed to repeated heavy traffic loading cycles and
thermo-mechanical surface distress that triggers the appearance of cracking. To overcome these issues and
contribute to further extend the service life of road pavements, a novel thermomechanical treatment is
gaining boost as an effort to put into practice more sustainable engineering solutions for in-situ asphalt
mixtures heating and healing. One example of a technology that possesses the potential to enhance road
pavement sustainability is the use of half-warm mix asphalt (HWMA) mixtures combined with industrial
by-products (e.g., electric arc furnace slag (EAFS) and recycled asphalt pavement (RAP) contents) because
of the provision of the decrease of extraction and exploitation of raw materials, lower greenhouse gas
(GHG) emission, and higher sensitivity to microwave (MW) radiation energy.
Nonetheless, the microwave radiation energy is becoming as a promising heating treatment for in-
situ asphalt mixtures heating due to the provision of an alternating electromagnetic field with a frequency
in the order of Megahertz (Franesqui et al., 2017; Norambuena-contreras and Garcia, 2016), which
corresponds to a wavelength of 120 mm (Gallego et al., 2013). In fact, some technical and economic
advantages of using microwave treatments on steel slag mixtures include: (1) a rapid and uniform heating
without overheating the pavement surface (Wang et al., 2018b); (2) a 30-40% lower energy consumption
compared to induction heating method; and (4) increased mixture temperature by changing the orientation
of polar molecules in accordance with the applied electric field (Liu et al., 2018; Metaxas and Meredith,
1983).
Page 103
Chapter 6. Looking ahead: Self-healing analysis of HWMRA mixes containing 100% RAP
85
In order to prove that the microwave heating method has the potential to improve the adhesive
bonding of aggregate-bitumen, durability, and mechanical performance of mixtures with steel slag
aggregates, some investigations have been conducted and contrasted by different researchers. For instance,
(Al-Ohaly and Terrel, 1988) reported that the microwave heating treatment improves the adhesion bonding
properties of asphalt and aggregates system, i.e., due to the work of adhesion that can be described as the
necessary energy to break up the aggregate-binder bond at the interface (Liu et al., 2017).
In this line, Norambuena-contreras and Garcia (2016) evaluated the self-healing ratio of semi-
circular test specimens using both induction and microwave heating methods. They emphasized that the
microwave treatment turned out to be the most efficient solution and that the air voids content represents a
crucial aspect of being considered for the self-healing recovery of the mixtures, due to an increase of
internal pressure and mobility of bitumen during the heating process. For instance, Luo, (2012) reported
that mixtures with lower air voids content in the mix (Vm) and fewer air voids mineral aggregates (VMA)
exhibited better self-healing recovery, regardless of the bitumen-type, aging, and temperature.
Nevertheless, if the optimum microwave heating time is not correctly managed, the bitumen’ melting point
and aging can occur, due to overheating (Norambuena-contreras and Gonzalez-torre, 2017).
Additionally, the previous advantages can be further enhanced by adding some ferrous particle
aggregates into the new bituminous mixture since they have the potential to improve the adhesive bonding
and cohesive strength between aggregates and binder (Al-Ohaly and Terrel, 1988), conduct more thermal
energy, and accelerate the increase in mixture temperature by enabling higher absorption of microwave
radiation energy (Skaf et al., 2017; Wang et al., 2016). In other words, the replacement of virgin/recycled
aggregates with steel slag aggregates has been tagged as a suitable alternative, showing acceptable
mechanical performance (e.g., stability, indirect tensile strength (ITS), resilient stiffness, creep modulus,
cracking and permanent deformations) (Ameri et al., 2013; Ameri and Behnood, 2012b; Asi et al., 2007;
Sorlini et al., 2012), while improving the susceptibility to microwave heating radiation (Gallego et al.,
2013). In this regard, Gallego et al. (2017) examined the potential effect of using steel slag aggregates on
bituminous mixtures using microwave radiation energy. They found that a 5% of steel slag aggregates by
weight of the mixture represented the most technical and energy-efficient solution for in-situ asphalt
pavement heating.
Nonetheless, the results reported by other researchers are somewhat less conclusive, in the sense
that mixtures with EAF slag fine aggregates displayed lower mechanical performance (e.g., Marshall
stability, resilient modulus ratio, tensile strength, and fracture energy ratio) and moisture sensitivity, likely
as a result of the particle size of slag, aggregate-type, and binder selected (Hesami et al., 2014). In this
consonance, some other authors asserted that the use of EAF slag fine fraction aggregates decreased the
resistance to permanent deformation while increasing the binder consumption (Ameri et al., 2013; Kavussi
and Qazi Zadeh, 2014). What’s more, Shuler, (1976) and Xie et al., (2012) claim that mixes manufactured
with thermal power plant residues showed mechanical behavior and deteriorated more rapidly under traffic
loads.
Page 104
Chapter 6. Looking ahead: Self-healing analysis of HWMRA mixes containing 100% RAP
86
Therefore, due to contradictory results concerning the slag mixtures’ mechanical performance, a
more in-depth research study is necessary to quantify the self-healing process of half-warm mixes with
recycled and steel slag fine fraction aggregates in new bituminous mixtures for their use in wearing course
asphalt mixtures. For this reason, an innovative Spanish research project conducted by the road engineering
laboratory of the Technical University of Madrid (UPM) entitled:” Self-healing analysis of half-warm
mix recycled asphalt (HWMRA) mixture with EAFS and RAP aggregates using a thermomechanical
treatment for enhancing road pavement sustainability.”
Methodology
The aim of this research study was to present and quantify the self-healing ratio of half-warm mix
asphalt mixtures containing three different electric arc furnace steel (EAFS) slag aggregate contents (0%,
4% and 8% of EAFS by total volume of the mixture) used as a replacement of recycled RAP aggregates in
the fine fraction 0-4 mm sieve size. In order to do this, the research methodology was broken down into
five main stages/phases. In the first phase, the RAP material was characterized to determine the bitumen
consistency properties (i.e., penetration grade, and softening point temperature) and black and white RAP
grading curves. The steel slag aggregates were classified in five different fractions (4, 2, 0.5, 0.25, and
0.063 µm) and, after that, weighted to determine the aggregate grading curve of this material, according to
EN 12697-2:2015. Part 2: Determination of particle size distribution.
The second stage consisted in determining the optimum emulsion content (OEC) of the half-
warm mix with a total RAP content (100%) in order to achieve the required target air voids content in the
range of 5 ± 1%, aiming at the center of the interval of a dense-graded asphalt concrete mixture (AC16 D),
according to Art. 542.5.1.2: Air voids (Spanish Ministry of Public Works, 2015). The EAF slag aggregate
mixtures were prepared (with a diameter of 100 mm and 60 ± 5 mm in height) and then compacted using
the gyratory compactor by applying a mix design compaction energy of 80 gyrations, at 80 ºC, and
following the standard compaction conditions (α=0.82º, 600 kPa, and 30 rpm) established by EN 12697-
31:2007. Part 31: Gyratory Compactor. Posteriorly, the specimens were put into a forced-draft
convection oven for being subjected to a specific accelerated curing/drying heating treatment for three days
(72 h), at 50 ºC, according to the Spanish technical specifications collected in Art. 20 of PG-4: “In-situ
recycling of bituminous mixtures with emulsion” (Spanish Ministry of Public Works, 2017).
In the third stage, a thermographic imaging analysis was conducted to define the most energy-
efficient mixture solution using an electric meter with the microwave heating time process. To this end, the
average energy consumption and specimens' surface and internal thermal maps of the four slag aggregate
contents (0%,2%,4%,6%, and 8% of EAFS by the total volume of the mixture) were computed and plotted.
This thermal study was conducted using a microwave heating oven with a maximum output capacity of
1200 W and a 230 V, and 50 Hz power supply, which corresponds to an approximate wavelength of 120
mm (Gallego et al., 2013). However, for this research study, the microwave oven was set to produce 800
W, with a frequency of 2.45 GHz, to compare the results found by different researchers (Gallego et al.,
2017).
Page 105
Chapter 6. Looking ahead: Self-healing analysis of HWMRA mixes containing 100% RAP
87
The microwave thermal plots extracted from the thermographic study included: (1) Microwave
surface/internal heating temperatures (ºC) vs. Energy consumed during microwave heating (kWh); (2)
Microwave surface/internal heating temperature (ºC) vs. Microwave heating time (s). To this end, a FLIR
C2 thermographic imaging camera (with an average temperature emissivity of 0.95, surface reflexivity
temperature of 20 ºC and infrared (IR) resolution of 80 x 60 pixels) and an infrared temperature-measured
gun were used to draw some conclusions from the target internal and surface heating temperature [(e.g.
Maximum, Minimum, Mean (µ), standard deviation (SD), and coefficient of variation (CV)] of the
rectangular central section of the half-warm specimens. Figure 46 shows the infrared and microwave
heating temperatures in the range of 80-85 ºC, which seems to be sufficient to activate the effect of self-
healing on asphalt mixtures (Liu et al., 2012).
(a) (b) (c) (d)
Figure 46. Thermographic and infrared temperature: (a) Infrared gun; (b) Microwave oven at 800 W; (c)
specimen cut into two halves for internal temperature measuring; (d) surface temperature at above 75 ºC
The fourth phase consisted of determining the initial mechanical performance of three different
steel slag mixture contents (0%,4%, and 8% EAFS). The mixtures were tested for stiffness modulus at 20
ºC, and followed by the indirect tensile strength test, at 15 ºC. To this end, the stiffness modulus values
were calculated using a set of five stress-controlled load pulses at a loading frequency of 2.1 Hz, with a rise
time of 124 ± 3 ms, and horizontal maximum peak deformation of 5 µm, according to EN 12697-26: 2012.
Part 26: Stiffness. Subsequently, the indirect tensile strength (ITS) was conducted, at 15 ºC, using a
deformation load rate of 50.8 ± 2 mm/min on the vertical diametral plane, according to EN 12697-23:2008.
Part 23: Determination of the indirect tensile strength of bituminous specimens.
Once the mixtures’ mechanical performance characterization was conducted, the next step was
to determine the extent to which four different slag aggregate contents impact on the mixtures’ mechanical
performance properties. The results were validated using the central limit theorem-based normal
distribution to find out whether the mechanical performance data are normally distributed. In other words,
a three-way Analysis of Variance (ANOVA) analysis was selected for the stiffness modulus since they
were found to fit well within the Parametric distribution (Box, 1953; Dien, 2017); whereas, for the indirect
tensile strength (ITS) values, the data suited well within the Non-parametric range by the Kruskal-Wallis
distribution test (Kruskal and Wallis, 1952). Therefore, based on the Kruskal-Wallis and Analysis of
Variance (ANOVA) test, it was found that the replacement of the recycled aggregates with EAF slag
Infrared Microwave Inner Outer
Page 106
Chapter 6. Looking ahead: Self-healing analysis of HWMRA mixes containing 100% RAP
88
fine faction aggregates had a statistically significant effect on the initial and ultimate mechanical
performance properties such as indirect tensile strength (ITS) and stiffness modulus values. After running
the SPSS software, the p-values were found to be 0.003 and 0, respectively.
In the fifth phase, the self-healing ratio of the half-warm steel slag mixtures was quantified in
terms of the indirect tensile strength (ITS) at 15 ºC, and stiffness modulus at 20 ºC. To this end, three
microwave heating temperatures (25 ºC, 60 ºC, and 80 ºC) along with three mechanical recompaction
gyrations (0, 25, and 50) were used.
As for the sixth phase, the energy efficiency of the self-healing process was calculated by
obtaining the self-healing recovery of the mechanical performance properties (ITS and stiffness modulus)
of each type of mixture (0%,4%, and 8% EAFS) against the healing energy efficiency (kWh) depending on
the number of recompaction gyrations (0,25, and 50 gyros) applied on the samples and microwave heating
temperature (25 ºC, 60 ºC, and 80 ºC). Figure 47 illustrates the summary of the six main phases followed
in the experimental methodology: (1) characterization of materials; (2) mixture design; (3) thermographic
analysis; (4) initial mechanical testing phase; (5) thermomechanical treatment; and (6) Self-healing ratio.
Phase 2: Mixture design Phase 3: Thermographic analysis
Phase 4: Initial mechanical testing Phase 5: Thermomechanical treatment
Experimental Methodology
Phase 1: Characterization of Materials
Gyratory compactor (EN 12697-
31:2008)
• Microwave heating energy (25 ºC, 60 ºC and 80 ºC)
• Mechanical recompaction treatment (0,25 and 50 gyros)
• Determining steel slag aggregate gradation of 0/4 mm • RAP properties
• Slag characterization • Selected aggregate grading curve
• Determining the optimum bitumen emulsion content (OEC) based on the target air voids criterion of 5 ± 1%
• Compaction curves (600 kPa, 0.82º, 30 rpm) density vs load cycles
• Accelerated curing process for 72 h, at 50 ºC
• EAFS (0%,2%,4%,6% and 8%) • Microwave heating temperature (ºC) vs
energy consumption (kWh) • Microwave surface/internal heating
temperature (ºC) vs time (s) • FLIR C2 thermographic camera and
Infrared temperature-measured gun
RAP Slag Emulsion (0/4 mm) C67B3
• Stiffness modulus at 20 ºC (EN 12697-26:2012)
• Indirect tensile strength at 15 ºC (EN 12697-23:2018)
Page 107
Chapter 6. Looking ahead: Self-healing analysis of HWMRA mixes containing 100% RAP
89
Phase 6: Re-mechanical testing stage
Figure 47. Detailed flow chart of the methodology followed in this research Chapter
Test procedures
The volumetric characteristics of the mixtures were calculated using the bulk density, by saturated
surface dry (SSD) conditions, according to EN 12697-6:2012. Part 6: Determination of bulk density of
bituminous specimens; while the maximum density is measured using a pycnometer set at 4 kPa
atmospheric pressure, according to EN 12697-5:2012. Part 5: Determination of the maximum density.
Procedure A: Volumetric method. To this end, an average of two samples were taken for each emulsion
content, ranging from 2.0 to 3.5% - at 0.5% increments, whilst an average of three cylindrical specimens
were prepared (Ø=100 mm and h = 60 mm in height) and compacted with the gyratory compactor (EN
12697-31:2007) to determine the bulk density of the specimens.
To further evaluate the recovery capability of the mechanical performance properties of the steel
slag mixtures, (1) the stiffness modulus, at 20 ºC, and (2) the indirect tensile strength test, at 15 ºC, were
determined. The mixtures’ load-bearing capacity was assessed through the stiffness modulus (Sm), at 20
ºC, according to EN-12697-26:2012. Part 26: Stiffness. This property was determined by applying five
indirect-tensile haversine-shaped load waveform pulses on a diametral section using the following
conditions: rise time of 124 ± 3 ms; target peak horizontal deformation of 5µm; loading frequency of 2.1
Hz; (4) peak loading force of 1000 N; (5) and Poisson’s ratio (ν) of 0.35. In turn, ten (10) load pulses were
previously applied to set up the device and system in terms of loading level and frequency. The average
stiffness modulus value of the specimen was then validated and contrasted by turning it at an angle of 90 ±
10º, according to their longitudinal axis on the plate. Thus, for an applied dynamic load of P in which the
resulting horizontal dynamic deformations are determined, the average stiffness modulus is calculated from
Eq. 6.1 (Modarres and Ayar, 2014):
𝑆𝑚 =𝑃(𝛾+0.27)
𝑡𝛿ℎ (6.1)
Where: Sm represents the stiffness modulus, MPa; P: Maximum peak dynamic load, N; 𝛾: Poisson’s ratio;
t: specimen thickness, mm; 𝛿ℎ: total horizontal recoverable deformation expressed in terms of mm.
• Stiffness modulus at 20 ºC • Indirect tensile strength at 15 ºC • Self-healing ratio (HR) of HWMRA
mixes (0%,4%, and 8% of EAFS)
ITSM ITS Microwave Recompaction
Phase 4 : Mechanical testing Phase 5: Healing stage
Phase 6: Self-healing ratio:
ITSM at 20 ºC and ITS at 15 ºC
Page 108
Chapter 6. Looking ahead: Self-healing analysis of HWMRA mixes containing 100% RAP
90
The second test method used to evaluate the capability of the steel slag mixtures was the internal
cohesion strength assessed through the indirect tensile strength (ITSdry), at 15 ºC, according to EN 12697-
23:2017: Determination of the indirect tensile strength. This test consisted of subjecting the specimens to
compressive loads between two loading strips (with a width of 12.7 mm) at a constant deformation speed
of 50 ± 2 mm/min. This load provides tensile stress along the vertical diametral plane, which causes the
splitting failure on the diametral plane. The peak compressive load was measured to calculate the indirect
tensile strength of the specimens, according to Eq. 6.2:
𝐼𝑇𝑆 =2𝑃𝑚𝑎𝑥
𝜋𝑡𝑑 (6.2)
Where: ITS: horizontal tensile strength expressed in gigapascals (GPa); Pmax: represents the ultimate load
required to fail specimens under diametral compression (kN); t: specimens’ thickness (mm); d: specimens’
diameter (mm);
Additionally, an assessment of the effect of three microwave heating treatments (25 ºC,60 ºC, and
80 ºC) and three recompaction gyrations (0, 25 and 50 gyrations) on three steel slag mixture contents
(0%,4% and 8% of EAFS), was conducted. To do so, an average of twenty-seven (27) cylindrical-shaped
specimens were manufactured (with a diameter of 100 mm and height of 60 ± 1 mm) for each type of steel
slag mixture to quantify the extent to which the self-healing phenomenon can recover the stiffness modulus
and the tensile strength of the mixtures. In order to quantify the self-healing ratio of the steel slag mixtures,
the stiffness modulus, and indirect tensile strength was calculated as the relationship between the initial and
the ultimate strength resistance using Eq. 6.3:
𝐻𝑅 = 𝐹𝑝
𝐼𝑝 (6.3)
Where; Ip: is defined as the vertical load applied before subjecting to a healing treatment and recompaction
test; and Fp: after being subjected to healing treatment and mechanical recompaction.
Materials
6.4.1 EAFS aggregates
In this research study, the electric arc furnace slag aggregates (EAFS) were selected, as
replacement of recycled aggregates in the fine fraction of 0-4 mm, for the half-warm mix’ production and
characterization in the laboratory. The steel slag aggregates have a CE marking as a replacement aggregate
for bituminous mixtures and surface treatments for roads, airfields, and other trafficked areas, according to
EN 13043:2002+AC:2004. The specific gravity of the steel slag aggregates was found to be in the range of
3.51-3.64 g/cm3 (Al-Negheimish et al., 1997). Table 16 exhibits the composition of the slag aggregates
grading curve in this research study and aggregate particle grain curve of the mixture produced and
threshold values stipulated for a dense-graded asphalt concrete mixture (AC 16 D) with a nominal
maximum aggregate size (NMAS) of 16 mm, according to Art. 542.3 of PG-3: Type and composition of
Page 109
Chapter 6. Looking ahead: Self-healing analysis of HWMRA mixes containing 100% RAP
91
the mixtures. The particle aggregate grading curve of the EAFS aggregates are presented in Figure 48,
and the chemical composition of the steel slag aggregate is collated in Table 17.
Table 16. Particle grain size distribution and AC 16 D gradation threshold values
Sieve size (mm) 8 4 2 0.5 0.25 0.063
Passing (%) 100 96.29 49.64 15.40 9.97 5.26
Figure 48. Aggregate grading curve of the EAF slag aggregates
Table 17. Chemical composition of slag (before hydration)
Chemical composition Value
(%)
Al2O3 8.81
CaO 24.28
Fe2O3 40.49
MgO 3.02
MnO 4.72
SiO2 12.60
P2O5 0.36
Other substances 5.72
0
10
20
30
40
50
60
70
80
90
100
0,010,1110100
Pass
ing
(%)
Sieve size (mm)
Steel slag (0-4 mm)
Page 110
Chapter 6. Looking ahead: Self-healing analysis of HWMRA mixes containing 100% RAP
92
6.4.2 RAP characterization
The recycled asphalt pavement was homogenized, treated and characterized in order to determine its
residual bitumen content using rotary evaporator by the centrifuge extractor method (EN 12697-3:2013.
Part 3: Bitumen recovery. Rotary evaporator), bitumen’ consistency properties (softening point (ºC) and
penetration test) and white grading curves of the recycled RAP binder obtained from the urban test section;
where these curves can be defined as the RAP gradations after the extraction of the residual aged bitumen.
The physical characteristics of the recycled binder as well as the percentage contained in the recycled
mixture are collated in Table 18. The white RAP grading curves were divided into four different fractions
(12.5/20 mm, 8/12.5 mm, 4/8 mm and passing 4 mm) after extracting the aged RAP binder. The average
binder content found in the RAP material was found to be approximately 4.89 %.
Table 18. Physical characterization of the aged RAP binder obtained from an urban test section
Properties Test method Value
Maximum density (g/cm3) EN 12697-6:2012 2.443
Bitumen content (%) EN 12697-1:2012 4.89
Penetration test (0.1 dmm, 100 g, 5 s at 25 ºC) EN 1426:2015 11
Softening point (ºC) R&B method EN 1427:2015 80.3
6.4.3 Bituminous emulsion characterization
A cationic slow-setting bituminous emulsion (C67B3) with a residual asphalt binder content of 67%
by weight of the emulsion was selected and used in order to guarantee (1) a thick asphalt emulsion film
coating and bonding between RAP and virgin aggregates; (2) much better cohesion; (3) to provide good
workability during the paving and compaction phase. The emulsion was formulated with a 50/70 pen. grade
bitumen. The characterization of the emulsion consisted of analyzing the viscosity, the water content from
the bituminous emulsion, the residue on sieving, residual binder content, penetration, and softening point.
Table 19 shows the general technical specifications of the bitumen emulsion used to produce HWMRA
mixtures.
Table 19. Technical characteristics of a slow-setting cationic bitumen emulsion (C67 B3)
Characteristics Unit Test method Standard
Particle polarity of emulsion - EN 1430 Positive
Determination of breaking value of cationic bituminous
emulsions, mineral filler method
- EN 13075-1 70 to 155
Page 111
Chapter 6. Looking ahead: Self-healing analysis of HWMRA mixes containing 100% RAP
93
Water content (from bituminous emulsions).
Azeotropic distillation method
% by weight EN 1428 65-69
Residual binder and oil distillate from bitumen
emulsions by distillation
% by weight EN 1431 ≥65
Oil distillate content by distillation % by weight EN 1431 ≤2.0
Efflux time by the efflux viscometer. s EN 12846 40-100
Determination of residue on sieving of bituminous
emulsions, and determination of storage stability by
sieving
% by weight EN 1429 ≤0.1
Settling tendency of bituminous emulsions % by weight EN 12847 ≤5
Adhesivity of bituminous emulsions by water
immersion test
% by weight EN 13614 ≥90
Elastic recovery of modified bitumen % EN 13398 DV
Determining optimum emulsion content
In order to determine the optimum emulsion content (OEC) of the HWMRA 100% RAP mixtures,
these mixtures were manufactured in the laboratory by heating the emulsion at 65 ºC, RAP aggregates at
100 ºC, slag aggregates at 100 ºC, basket at 95 ºC, and cylindrical molds at 100 ºC, for 2 h, in a convection
oven. All of these materials were posteriorly mixed in a blending basket, for 3 min, at 80 rpm, for ensuring
a good coating and bonding between recycled RAP aggregates and emulsion. Moreover, an average of three
cylindrical-shaped specimens were prepared (with a diameter of 100 mm and with 60 ± 1.5 mm height) for
each emulsion content (2.0%,2.5%,3.0%, and 3.5% o/RAP) and compacted with a mix design compaction
effort of 80 gyrations, at 80 ºC, following the standard compaction conditions (α= 0.82º, 600 kPa and 30
rpm) established by the EN 12697-31:2007. Part 31: Specimen preparation by the gyratory compactor
The mixtures’ volumetric characteristics were determined in terms of maximum density, bulk density, and
air voids in the mix. Thus, the air void content is calculated using the bulk density of the test specimens, by
saturated surface dry (SSD) conditions, according to EN 12697-6: 2009. Part 6: Determination of bulk
density of bituminous specimens, while the maximum density of the mixture is calculated using a
pycnometer based on the EN 12697-5:2009. Part 5: Determination of the maximum density – Procedure
A: Volumetric method. Table 20 illustrates the volumetric characteristics of the preliminary mix design
in terms of maximum density, bulk density, and air voids.
The emulsion content was defined based on the target air voids content (Vm=5.0%), aiming at the center
of the dense-graded asphalt concrete (AC 16 D) mixture, according to Spanish technical regulations in Art.
542.5.1.2: Air voids (Spanish Ministry of Public Works, 2015). A 2.6% (o/RAP) was calculated by linear
Page 112
Chapter 6. Looking ahead: Self-healing analysis of HWMRA mixes containing 100% RAP
94
interpolation with a regression coefficient (R2) of 0.99, to achieve 5.0% air voids, at the center of the
interval of 4-6% air voids. Therefore, a 2.6%o/RAP emulsion made up of a 67% of residual asphalt content
(2.6*0,67= 1.94% cationic emulsion + 4.19 %RAP binder = 6.13% binder o/a) was calculated by linear
interpolation with a fitted regression coefficient (R2) of 0.99, to achieve 5.0% air voids content, at the
center of the interval of 4-6%, as illustrated in Figure 49.
Table 20. Volumetric characteristics of the preliminary laboratory mix design
Mixture properties Test method Emulsion content (%, o/RAP)
2.0% 2.5% 3.0% 3.5%
Maximum density, (g/cm3) EN 12697-5:2012 2419 2418 2414 2395
Apparent density, by SSD, (g/cm3) EN 12697-6:2012 2269 2292 2313 2339
Air voids, Vm, (%) EN 12697-8:2003 6.1 5.2 4.2 3.3
Key: * bitumen emulsion content over recycled asphalt content (%,o/RAP)
Figure 49. Determination of the optimum emulsion content aiming at the target air voids content of 5.0%
6,1
5,2
4,2
3,3
y = -1,88x + 9,87R² = 0,9995
1
2
3
4
5
6
7
1,5 2,0 2,5 3,0 3,5 4,0
Air
void
s (%
)
Emulsion content (%)
Air voids Linear (Air voids)
2.6 %,s/a 5.0% air voids
Page 113
Chapter 6. Looking ahead: Self-healing analysis of HWMRA mixes containing 100% RAP
95
6.5.1 Compaction curves
Figure 50 shows the evolution of the geometric density (g/cm3) curve of the 100% RAP mixtures with four
emulsion contents (2.0%,2.5%,3%, and 3.5% o/RAP) against the number of compaction gyrations (up to
200 gyros). It can be observed in this Figure the average geometric density value of the 100%RAP mixture
with 2.5% emulsion was found to be 2.298 g/cm3 and average specimens' height of 56.82 mm, whilst, for
the 3.0% emulsion, this number was 2.313 g/cm3 and an average specimens’ height of 56.01 mm.
Therefore, for the 2.5%o/RAP emulsion and at 80 gyrations, 98.22% of the geometric density of the
specimens compacted with up to 200 gyrations (𝜌𝑏, dim = 2339 𝑔/𝑐𝑚3) was obtained; whereas, for the
3.0%o/RAP, this percentage was found to be 97.3% (𝜌𝑏, dim = 2378 𝑔/𝑐𝑚3); where Pb, dim can be
understood as the average geometric density calculated for Ni load cycles expressed in terms of g/cm3.
Additionally, it can be said that the gyratory compaction curves displayed a rising sharply behavior
during the first 50 load cycles due to consolidation and densification process, and, thereupon, they become
more asymptotic afterward, likely attributed to a greater aggregate-aggregate interlocking effect. At the end
of the compaction process, the 3.0% and 3.5%o/RAP emulsion mixes showed similar, or equivalent,
geometric density (g/cm3), implying that they are comparable in terms of density.
Figure 50. Compaction curves of the HWMRA 100% RAP mixtures with four emulsion contents
1600
1700
1800
1900
2000
2100
2200
2300
2400
2500
2600
0 10 20 30 40 50 60 70 80 90 100 110 120 130 140 150 160 170 180 190 200 210
Geo
met
ric d
ensi
ty (g
/cm³)
Number of gyrationsHWMRA 100% RAP (2.0%) HWMRA 100% RAP (2.5%)HWMRA 100% RAP (3.0%) HWMRA 100% RAP (3.5%)
Page 114
Chapter 6. Looking ahead: Self-healing analysis of HWMRA mixes containing 100% RAP
96
6.5.2 Mixture composition
Once the target air voids design-based optimum emulsion content of the 100% RAP mixture was
determined, the next step was to quantify the additional emulsion content on the EAF slag mixture design,
i.e., the RAP aggregates were replaced with the corresponding percentage of steel slag aggregate in the fine
fraction of 4-0 mm sieve. Due to the difference in RAP and EAFSaggregate density, it was necessary to
recalculate the effective emulsion content in the final mixture design to produce a similar effective emulsion
content on each type of mixture. Therefore, the absorption coefficient of RAP aggregates was 0.75, while,
for the recycled aggregates, this number was found to be 3, as illustrated in Eq. 5.5:
% 𝑂𝐵𝐶𝑠𝑙𝑎𝑔 = % 𝑒𝑚𝑢𝑙𝑠𝑖𝑜𝑛 + [%𝑏𝑒𝑓𝑒𝑐 − (%𝑅𝐴𝑃
100) ∙ 0.75 + (
%𝑆𝑙𝑎𝑔
100) ∙ 3] (5.5)
Where; OBC: optimum binder content in terms of percentage; % befec; effective bitumen (%); Table 21
shows the final composition of the mixtures with five different steel slag aggregate contents (0%, 2%, 4%,
6% and 8% EAFS by the total volume of the mixture) in the fine fraction of 0-4 mm sieve, along with the
corresponding emulsion content added into the mixture design. In other words, the steel slag aggregate
fraction absorbs a slightly higher emulsion content in the mixture design than the recycled aggregates, due
to the higher porosity of this material.
Table 21. Composition of the mixtures of the HMWRA mixtures containing EAFS aggregates
Sieve size (mm) 100% RAP
(0% EAFS)
98% RAP +
2% EAFS
96% RAP +
4% EAFS
94% RAP +
6% EAFS
92% RAP +
8% EAFS
(%) Mass
(g)
Mass (g) Mass (g) Mass (g) Mass (g)
RAP EAFS RAP EAFS RAP EAFS RAP EAFS
20 12.5 9.3 93 93 - 93 - 93 - 93 -
12.8 8 9.8 98 98 - 98 - 98 - 98 -
8 4 30.3 303 303 - 303 - 303 - 303 -
4 2 13.8 138 123 22.5 113 37.5 138 60 88 75
2 0.5 16.2 162 159.8 3.3 155 9.9 162 13.2 148.8 19.8
0.5 0 20.6 206 203.2 4.2 198 12.6 206 16.8 189.2 25.2
Weight (g) 100 1000 980 30 960 60 940 90 920 120
*Emulsion (%) 2.6 2.7 2.8 2.9 3.0
Weight (g) 1026 1037 1048 1059 1070
Page 115
Chapter 6. Looking ahead: Self-healing analysis of HWMRA mixes containing 100% RAP
97
Key: *Emulsion content added in the mixture design expressed in terms of percentage (%); Key**: For the 8%
EAFS aggregates, a 5% of slag aggregates was selected in the range of 2-4 mm (passing 4 and retained in 2 µm sieve)
and 3% for the 0/2 mm sieve size; For the 6% EAFS, 4% of slag aggregates for the 2/4 mm sieve, and 2% for the 0/2
mm; For the 4% EAFS aggregates, 2.5% of EAFS aggregates for the 4/2 mm sieve size, and 1.5% EAFS for 0/2 mm
sieve size; and For the 2% EAFS aggregates, 1.5% of EAFS aggregates was chosen for 4-2 mm sieve and 0.5% in the
sieve size fraction of 0-2 mm;
Thermographic study: Microwave heating stage
The HWMRA specimens were prepared (with a diameter of 100 mm and 60 mm in height) and cut
into two semi-cylindrical halves on the vertical diametral plane with an electric saw to facilitate the
specimens' internal temperature measurement. To this end, a microwave heating oven with a theoretical
maximum output capacity of 1200 W and a 230 V, 50 Hz power supply, was selected. However, the oven
was adjusted to produce microwaves of up to 800 W, with a frequency of 2.45 GHz. Also, rectangular
shaped cardboard (with a length of 200 mm, 160 mm in width, and 2.5 mm in thickness) was placed right
below the cylindrical specimen to prevent heat transfer by conduction of the microwave crystal plate.
In this context, both surface and internal microwave heating temperatures were monitored using (1)
a FLIR C2 thermal imaging camera to obtain the most significant data (Maximum, Minimum, Mean (µ),
standard deviation (SD), and coefficient of variation CV) from the rectangular-shaped section of the
cylindrical specimens. (2) A Testo 830-T1 infrared gun (with 10:1 optics, spectral range of 8-14 µm, and
infrared resolution processor of 0.1 ºC for non-contact surface temperature measurements) was selected for
this temperature study. Figure 51 shows the specimen’s surface heating temperature (80 ºC). It was found
that the specimens showed a slightly higher internal temperature than that of the surface temperature, likely
caused by a higher heat-flow diffusion in the periphery of the sample, which allows achieving the required
target internal heating temperature more efficiently (Gallego et al., 2017). In turn, the recycled binder can
be observed that began to burn at the microwave heating temperature above 105 ºC, likely caused by hot
gases trapped inside the specimens that cause the specimen’s swelling.
(a) (b)
Figure 51. Thermographic imaging analysis: (a) Microwave heating oven; and (b) thermography at 80 ºC
Page 116
Chapter 6. Looking ahead: Self-healing analysis of HWMRA mixes containing 100% RAP
98
It was noted that for the 8% steel slag aggregates, the average energy consumption of 0.035 kWh was
obtained; while for the 0% EAFS mixture, the energy consumed was found to be 0.079 kWh; In other
words, a significant reduction in the average energy consumption of 55.7% was found. This is likely caused
by the addition of ferrous particles that allowed to promote a higher susceptibility to microwave energy. In
order to determine the effect of the slag aggregates on energy consumption (kWh), an assessment of five
different slag aggregate compositions (0%,2%4%6%, 8% by total volume of the mixture) and different
microwave heating times (0,30,60,90,120,150, 180, 210, 240 and 270 s) was studied in the laboratory, as
illustrated in Figure 52-53.
Figure 52. Microwave heating analysis: Average inner heating temperature (ºC) vs. heating time (s)
y = 0,346x + 20,402R² = 0,9996
y = 0,375x + 26,254R² = 0,9846
y = 0,4075x + 28,305R² = 0,9755
y = 0,4235x + 31,744R² = 0,9794
y = 0,495x + 30,877R² = 0,972
0
10
20
30
40
50
60
70
80
90
100
110
120
130
140
0 20 40 60 80 100 120 140 160 180 200 220 240 260
Ave
rage
surf
ace
tem
pera
ture
(ºC
)
Microwave heating time (s)HWMRA 0% EAFS HWMRA 2% EAFS HWMRA 4% EAFS HWMRA 6% EAFS HWMRA 8% EAFS
Page 117
Chapter 6. Looking ahead: Self-healing analysis of HWMRA mixes containing 100% RAP
99
Figure 53. Microwave heating analysis: Average inner heating temperature (ºC) vs. heating time (s)
Figure 54 and 55 show the average microwave heating surface and in binder temperature (ºC) vs. energy
consumed (kWh) of each type of mixture studied (0%,2%,4%,6%, and 8% of EAFS). It can be observed in
this Figure that the most susceptible mixture to microwave energy were those mixtures fabricated with 8%
EAFS aggregates by volume of the mixture, followed by the subsequent slag aggregates content.
y = 0,307x + 25,356R² = 0,995
y = 0,4659x + 25,121R² = 0,989
y = 0,5109x + 27,139R² = 0,9765
y = 0,5488x + 29,957R² = 0,9861
y = 0,6096x + 31,627R² = 0,9827
0
10
20
30
40
50
60
70
80
90
100
110
120
130
140
0 20 40 60 80 100 120 140 160 180 200 220 240 260 280
Ave
rage
inne
r tem
pera
ture
(ºC
)
Microwave heating time (s)
HWMRA 0% EAFS HWMRA 2% EAFS HWMRA 4% EAFS HWMRA 6% EAFS HWMRA 8% EAFS
Page 118
Chapter 6. Looking ahead: Self-healing analysis of HWMRA mixes containing 100% RAP
100
Figure 54. Thermographic analysis: Surface microwave heating temperature (ºC) vs. energy consumed (kWh)
Figure 55. Thermographic study: Inner microwave heating temperature (ºC) vs. Energy consumed (kWh)
y = 1206,4x + 19,909R² = 0,998
y = 1245,3x + 27,298R² = 0,9864
y = 1371,1x + 29,136R² = 0,9706
y = 1472,7x + 30,792R² = 0,9629
y = 1734,8x + 29,747R² = 0,9551
0
10
20
30
40
50
60
70
80
90
100
110
120
130
140
0 0,01 0,02 0,03 0,04 0,05 0,06 0,07 0,08 0,09 0,1
Surf
ace
tem
pera
ture
(ºC
)
Energy consumed (kWh)
HWMRA 0%EAFS HWMRA 2%EAFS HWMRA 4%EAFS HWMRA 6%EAFS HWMRA 8%EAFS
y = 1040x + 25,819R² = 0,9938
y = 1463,3x + 27,549R² = 0,98
y = 1725,3x + 28,073R² = 0,9711
y = 1854,7x + 30,935R² = 0,9819
y = 2059,2x + 32,73R² = 0,9778
0
10
20
30
40
50
60
70
80
90
100
110
120
130
140
0,00 0,01 0,02 0,03 0,04 0,05 0,06 0,07 0,08 0,09 0,10
Ave
rage
inne
r tem
pera
ture
(ºC
)
Energy consumed (kWh)
HWMRA 0% EAFS HWMRA 2% EAFS HWMRA 4% EAFS HWMRA 6% EAFS HWMRA 8% EAFS
Page 119
Chapter 6. Looking ahead: Self-healing analysis of HWMRA mixes containing 100% RAP
101
Self-healing testing program
Once the optimum emulsion content and thermographic temperature analysis were defined, the next step
was to quantify the initial mechanical performance properties of the steel slag mixtures in terms of (1)
stiffness modulus, at 20 ºC, according to EN 12697-26:2018. Part 26: Stiffness; and (2) indirect tensile
strength (ITS) test, at 15 ºC, according to EN 12697-23:2018. Part 23: Determination of the indirect
tensile strength of bituminous specimens.
• Healing stage – second stage. Once the specimens were subjected to compressive loads at constant
deformation load of 50±2 mm/min, the damaged specimens were subjected to three thermomechanical
treatments using a microwave oven with an output capacity of 800 W, and four microwave heating
times, depending on the steel slag aggregate content added into the mixture design. Also, a novel
recompaction-based technique was used to quantify the self-healing recovery of the steel slag mixtures
using (1) three thermomechanical treatments (25 ºC, 60 ºC, and 80 ºC and (2) three recompaction
gyrations (0, 25, and 50 gyros).
• Retensile break -specimen after healing. The stiffness modulus and indirect tensile strength tests
were conducted again on the cylindrical specimens, as illustrated in Figure 56.
Figure 56. Schematic self-healing testing program of this research Chapter
Stiffness Modulus
at 20 ºC
ITSat 15 ºC
Microwave treatment (80ºC, 60 ºC and 25 ºC)
Recompaction (0.82º, 600
kPa and 30 rpm)
Stiffness modulus at 20 ºC
ITSat 15ºC
1st stage: Mechanical
characterization of the
HWMRA mixture
performance (ITSM
and ITS)
2nd stage: Healing
stage performance
• Microwave heating
• Recompaction
3rd stage:
Self-healing rate (HR) –
2nd Mechanical testing
(Fr/Ir) - ITS and ITSM
Page 120
Chapter 6. Looking ahead: Self-healing analysis of HWMRA mixes containing 100% RAP
102
6.7.1 Stiffness modulus
In Figure 57, the initial and ultimate stiffness modulus values (ITSMi) of the half-warm mixes
with three different EAF slag aggregate contents (0%,4%, and 8% of EAFS) were plotted. In this context,
the self-healing rate (HR) of the mixtures’ stiffness modulus values was determined by considering the
analysis of three heating treatments (25 ºC, 60 ºC, and 80 ºC) combined with three mechanical recompaction
gyrations (0,25, and 50 gyros), and, hence, compared with those values obtained from initial testing for the
stiffness modulus values.
The average stiffness modulus value of the 100% RAP mixtures of 6465 MPa was obtained (with
a standard deviation (SD) of 502 MPa and a coefficient of variation (CV) of 7.4%), whilst the load-bearing
capacity of the 4%EAFS mixture was found to be 6128 MPa (with an SD of 438 MPa and a CV of 6.87%)
and 5556 MPa (with an SD of 569 MPa and a CV of 9.91%) for the 8%EAFS mixture, respectively.
Therefore, a significant decrease in the stiffness modulus values of the 4% and 8%EAFS mixtures of 5.2%
and 14.1% was noted, compared with the 0% EAFS mixture, whereby the decrease in the stiffness modulus
values was in the order of 337 MPa and 909 MPa, respectively. Other researchers reported similar results
for the steel slag mixture properties. For instance, (Kavussi and Qazizadeh, 2014) agrees with the fact that
the initial stiffness modulus increased by decreasing the EAF slag aggregates content in the ultimate
mixture design, and that the fatigue resistance and resilient modulus were much lower than those values
obtained of conventional mixes (Bagamapadde and Wahhab, 1999).
Figure 57. Initial and ultimate stiffness modulus results, at 15 ºC, of the steel slag mixtures
0 gyrosat 80 ºC
0 gyrosat 60 ºC
0 gyrosat 25 ºC
25 gyrosat 80 ºC
25 gyrosat 60 ºC
25 gyrosat 25 ºC
50 gyrosat 80 ºC
50 gyrosat 60 ºC
50 gyrosat 25 ºC
ITSMi-0%EAFS 6376,4 7335,7 6493,0 5848,0 6887,7 6409,6 6240,3 5774,5 5722,0ITSMf-0%EAFS 1770,4 1104,1 571,5 7849,6 6549,6 900,9 8719,2 5835,5 994,7ITSMi-4%EAFS 5560,2 6231,9 5936,5 5456,1 5997,4 5937,6 5636,2 6433,7 7540,8ITSMf-4%EAFS 1694,7 1115,7 640,0 7674,0 6233,7 1515,4 8417,4 7233,9 1315,9ITSMi-8%EAFS 5219,2 5818,5 5442,1 4891,5 5281,2 7103,3 4821,1 5409,4 6090,7ITSMi-8%EAFS 1122,0 1778,7 1024,4 6262,4 5549,7 963,8 6490,7 5425,1 1054,4
0
1000
2000
3000
4000
5000
6000
7000
8000
9000
10000
11000
12000
Stiff
ness
mod
ulus
at 2
0 ºC
(MPa
)
Page 121
Chapter 6. Looking ahead: Self-healing analysis of HWMRA mixes containing 100% RAP
103
Figure 58 plots the self-healing ratio (HR) of the steel slag mixtures against the energy consumption (kWh).
Regarding the self-healing ratio of the slag mixtures with twenty-five recompaction gyrations, the 4%EAFS
mixture reached the highest self-healing ratio of 1.26 (with an SD of 0.189 and a CV equal to 13.23) with
an average energy consumption of 0.047 kWh; whereas, for the 8% EAFS mixture, this ratio was found to
be 1.21 (with an SD of 0.065 and a CV equal to 5.657) and 0.038 kWh. Therefore, a remarkable increase
in energy consumption of the 4%EAFS mixture of 23.69% (0.009 kWh) was calculated, although a higher
self-healing ratio was obtained, as illustrated in Figure 59. In particular, the slope of the self-healing ratio
curve for the 4% EAFS mixture showed a steeper upward behavior, rising sharply at 60 ºC and become
more stable after that, at 80 ºC.
As concerns the self-healing ratio of the stiffness modulus values, it was found that, by applying a mix
recompaction energy of 50 gyros at half-warm temperatures (~ 80 ºC), the 8% EAFS mixture exhibited the
highest self-healing ratio of 1.392 (with an SD of 0.082 and a CV equal to 6.24) and an average energy
consumption of 0.038 kWh; whereas, for the 0% and 4% EAFS mixtures, these healing ratios were found
to be in the order of 1.11-1.38, and 0.064 and 0.0471 kWh energy, respectively. Therefore, a significant
increase in the self-healing rate of the 8%EAFS mixtures of 25% and 0.7% was obtained; whilst, in terms
of energy consumed, a significant decrease in energy consumption was found to fall in the range of 0.026-
0.009 kWh, i.e., there were energy savings of up to 41% to 19%, for microwave heating times of 220 s and
160 s, respectively. The likely explanation for the density result lies in the increase of the average geometric
density value by approximately 4.6%, ranging from 2.230 g/cm3 to 2.332 g/cm3 when applying 50 gyrations
at 80 ºC, as illustrated in Figure 60.
However, without recompaction energy on the specimens, the self-healing ratio of the steel slag mixtures
was found to fall below 0.2, regardless of the slag aggregate content added into the mixture design and
microwave heating temperature. These outcomes were consistent with the self-healing result of asphalt
concrete (AC) mixtures found by other researchers. They claim that the self-healing recovery of these
mixtures was found to be in the range of 0.12-0.18 and that the bar error limits had followed similar trends,
likely caused because of less uncertainty compared to heat specimens (Wang et al., 2018b). Therefore, it
can be assumed that the optimum heating times to obtain the highest self-healing recovery levels for 4%
and 8% EAFS mixtures were 160 and 130 s, respectively. Figure 61 depicts the self-healing rate and error
bars corresponding to the half-warm steel slag mixtures (0%,4% and 8% of EAFS) with three different mix
recompaction energies (0, 25, and 50 gyros) and three microwave temperatures (25 ºC, 60 ºC, and 80 ºC).
Page 122
Chapter 6. Looking ahead: Self-healing analysis of HWMRA mixes containing 100% RAP
104
Figure 58. Self-healing rate of the stiffness modulus without using recompaction energy
Figure 59. Self-healing rate of the stiffness modulus with 25 recompaction gyrations
0,0
0,2
0,4
0,6
0,8
1,0
1,2
1,4
1,6
1,8
0,0000 0,0100 0,0200 0,0300 0,0400 0,0500 0,0600 0,0700
HR
-ITS
M
Energy consumption (kWh)
0% EAFS -0 gyros 4% EAFS -0 gyros 8% EAFS-0 gyros
0,0
0,2
0,4
0,6
0,8
1,0
1,2
1,4
1,6
1,8
0,0000 0,0100 0,0200 0,0300 0,0400 0,0500 0,0600 0,0700
HR
-ITS
M
Energy consumption (kWh)
0% EAFS -25 gyros 4% EAFS -25 gyros 8% EAFS-25 gyros
Page 123
Chapter 6. Looking ahead: Self-healing analysis of HWMRA mixes containing 100% RAP
105
Figure 60. Self-healing ratio of the stiffness modulus with 50 recompaction gyrations
Figure 61. Self-healing rate of the stiffness modulus of the half-warm steel slag mixtures (0%,4% and 8% of EAFS)
0,0
0,2
0,4
0,6
0,8
1,0
1,2
1,4
1,6
1,8
0,0000 0,0100 0,0200 0,0300 0,0400 0,0500 0,0600 0,0700
HR
-ITS
M
Energy consumption (kWh)
0% EAFS -50 gyros 4% EAFS -50 gyros 8% EAFS -50 gyros
0 gyrosat 80 ºC
0 gyrosat 60 ºC
0 gyrosat 25 ºC
25 gyrosat 80 ºC
25 gyrosat 60 ºC
25 gyrosat 25 ºC
50 gyrosat 80 ºC
50 gyrosat 60 ºC
50 gyrosat 25 ºC
HR ITSM-0% EAFS 0,278 0,151 0,088 1,342 0,951 0,141 1,397 1,011 0,174HR ITSM-4%EAFS 0,305 0,179 0,108 1,407 1,039 0,255 1,493 1,124 0,175HR ITSM-8%EAFS 0,27 0,38 0,24 1,60 1,31 0,17 1,68 1,25 0,22
0,00
0,25
0,50
0,75
1,00
1,25
1,50
1,75
2,00
2,25
2,50
Self-
heal
ing
ratio
(IT
SM)
Page 124
Chapter 6. Looking ahead: Self-healing analysis of HWMRA mixes containing 100% RAP
106
6.7.2 Indirect tensile strength
The self-healing ratio of the half-warm mixes was also determined in terms of the indirect tensile strength
(ITS), at 15 ºC, according to EN 12697-23:2017: Determination of the Indirect Tensile Strength of the
bituminous mixtures. Therefore, three recompaction levels (0,25, and 50 load cycles) and three microwave
heating temperatures (25 ºC, 60 ºC, and 80 ºC) were selected to quantify the indirect tensile strength of the
steel slag mixtures, as illustrated in Figure 62.
Figure 62. Indirect tensile strength test, at 15 ºC, of the steel slag mixtures
Figure 63 exhibits and compares the initial (ITSinitial) and the ultimate indirect tensile strength (ITSfinal)
value results, as well as the self-healing ratio (ITSf/ITSi) of the HWMRA mixtures containing three
different slag aggregate contents (0%,4%,8% of the total volume of the mixture), at 4% EAFS increments,
respectively; where the mixtures were tested from laboratory specimens, at three different recompaction
testing levels (0,25 and 50 gyrations), at 25 gyros increments, for each type of slag aggregate content and
three different microwave heating temperatures (80 ºC, 60 ºC, and 25 ºC), with an oven output capacity of
1200 W and a 230 V, 50 Hz power supply.
For the 100% RAP mixture, the average indirect tensile strength value was found to be 2.28 MPa (with a
low standard deviation (SD,µ) of 0.209 MPa, and a coefficient of variation (CV,ɣ) of 8.35%); whilst the
ultimate internal cohesion value of 2.826 MPa was obtained (with SD of 0.307 MPa and CV equal to
10.87%). In view of that, an increase of the internal cohesion value by approximately 23.7% was observed,
likely to be due to the effect of higher recompaction energy (50 gyrations) and microwave heating process.
Indirect Tensile
Strength at 15 ºC
Page 125
Chapter 6. Looking ahead: Self-healing analysis of HWMRA mixes containing 100% RAP
107
Figure 63. Initial and ultimate indirect tensile strength value results, at 15 ºC, of the steel slag mixtures
In terms of thermomechanical treatment, the cracked specimens were heated depending on the EAF slag
aggregate content added into the mixture design and the target heating temperature to be achieved. For
instance, for the 0%EAFS mixture, the specimens were heated for 15,130, and 220 s; whereas, for the 4%
EAFS, the microwave heating times were 160,90, and 12 s, and, for the 8% EAFS, these times were
130,70 and 10 s, respectively.
Looking at the initial internal cohesion values of the 0% EAFS mixtures with 0 recompaction
gyros, the average indirect tensile strength value of the 100% RAP mixture was found to be 2.14 MPa (with
a low standard deviation (SD) of 0.12 MPa, and a coefficient of variation (CV) of 5.2%); whilst, for the
4% and 8% EAFS mixture, these values were found to fall within the range of 2.067 (with an SD of 0.148
MPa and a CV of 7.25%) and 1.947 MPa (with an SD of 0.2 MPa and a CV of 9.87%), respectively.
Therefore, a slight decrease in the average internal cohesion values of the 4% EAFS mixture of 3.3% (-
0.071 MPa) was obtained; whereas, for the 8% EAFS mixture, this cohesion value decreased in terms of
absolute value by approximately 0.191 MPa (-8.9%) when compared to the 0% EAFS mixture. Figure 64
depicts the self-healing ratio of the internal cohesion (Ft/It) with 25 recompaction gyrations against the
energy consumed (kWh) for each type of slag mixture.
0 gyrosat 80 ºC
0 gyrosat 60 ºC
0 gyrosat 25 ºC
25 gyrosat 80 ºC
25 gyrosat 60 ºC
25 gyrosat 25 ºC
50 gyrosat 80 ºC
50 gyrosat 60 ºC
50 gyrosat 25 ºC
ITSi-0%EAFS 2,169 2,375 2,331 2,107 2,618 1,778 2,693 1,917 1,686ITSf-0%EAFS 1,048 1,047 0,893 2,018 1,977 0,901 2,826 1,681 0,896ITSi-4%EAFS 1,816 2,051 1,992 1,939 2,191 2,088 1,964 2,129 2,334ITSf-4%EAFS 1,092 1,033 0,897 2,382 1,923 1,074 2,759 2,223 1,286ITSi-8%EAFS 1,912 1,951 1,966 1,983 1,804 2,250 1,698 1,866 2,095ITSf-8%EAFS 0,943 0,947 0,963 2,075 1,669 1,163 2,072 1,863 1,056
0,0
0,5
1,0
1,5
2,0
2,5
3,0
3,5
4,0
Inte
rnal
coh
esio
n at
15
ºC (M
Pa)
Page 126
Chapter 6. Looking ahead: Self-healing analysis of HWMRA mixes containing 100% RAP
108
Additionally, it was found that, by applying a mix recompaction energy of 50 gyrations at 80 ºC, the
average geometric density of the 0% EAFS mixture of 2.415 g/cm3 (with an SD of 22.85 g/cm3 and a CV
equal to 0.95%) was obtained, and mean specimen’s height of 54.05 mm; whilst, for the 4%EAFS mixture,
the average densification value was found to be 2.369 g/cm3 (with an SD of 43.84 g/cm3 and a CV of 1.85%
and h= 56,44 mm) and 2.332 g/cm3 (with a SD of 15.1 g/cm3 and a CV of 0.65% and h= 57.82 mm) for
the 8% EAFS, respectively, as illustrated in Figure 65.
Figure 64. Self-healing rate of the indirect tensile strength of the slag mixtures
0,0
0,2
0,4
0,6
0,8
1,0
1,2
1,4
1,6
1,8
0,000 0,010 0,020 0,030 0,040 0,050 0,060 0,070
HR
-ITS
Energy consumption (kWh)
0% EAFS -0 gyros 4% EAFS -0 gyros 8% EAFS-0 gyros
Page 127
Chapter 6. Looking ahead: Self-healing analysis of HWMRA mixes containing 100% RAP
109
Figure 65. Self-healing rate of the indirect tensile strength of the slag mixtures using 25 recompaction gyrations
In Figure 66 the self-healing ratio (ITSf/ITSi) of the mixtures with three different slag aggregate
contents (0%,4%, and 8% of EAFS by volume of the mixture) against the amount of energy consumed
(kWh), were depicted. In terms of energy consumption (kWh), an average linear energy consumption value
of 0.008 kWh was calculated, for every 30 s, using an electric monitoring device. Thus, the specimens were
heated for different microwave heating times as follows: (1) the 0% EAFS specimens were heated for 220
(85 ºC), 130 (65ºC) and 15 s (25 ºC); (b) for the 4% EAFS mixture, the optimal microwave heating times
were 160,90 and 12 s; (3) whilst, for the 8% EAFS mixture, these times turned out to be 130,70, and 10 s,
respectively.
Therefore, it can be said that the indirect tensile strength (ITS) value was found to be highly linked
to the density and air voids of the steel slag mixtures - suggesting that the lower the density (or, the higher
the air voids contents), the less the indirect tensile strength and stiffness modulus. These results were
consistent with those found by other researchers. For instance, Luo, (2012) claimed that mixes with lower
air voids content in mix have a higher self-healing level, regardless of the type of bitumen, aging, and
temperature although an asphalt mixture with higher bitumen content, a coarse gradation, and fewer air
voids content has better healing capability (Ayar et al., 2016). However, and contrary to popular beliefs,
the cohesion results were somewhat less conclusive in terms of resisting tensile stress loads on the
specimens’ vertical diametral plane. In other words, the higher the EAF slag aggregate content added into
the mixture design, the less the mixtures’ internal cohesion values, likely caused as a result of a weak
0,0
0,2
0,4
0,6
0,8
1,0
1,2
1,4
1,6
1,8
0,000 0,010 0,020 0,030 0,040 0,050 0,060 0,070
HR
-ITS
Energy consumption (kWh)
0% EAFS -25 gyros 4% EAFS -25 gyros 8% EAFS-25 gyros
Page 128
Chapter 6. Looking ahead: Self-healing analysis of HWMRA mixes containing 100% RAP
110
interaction/blending between slag aggregates (lower CaO/SiO2) and recycled asphalt. Other researchers
found similar outcomes for internal cohesion values. For instance, Hesami et al., (2014) asserted that the
use of EAF slag fine/filler fractions gets worse the mechanical performance of these mixtures. Figure 67
self-healing rate of the indirect tensile strength, at 15 ºC, of each type of the slag mixture.
Figure 66. Self-healing ratio of the indirect tensile strength with 50 recompaction gyrations
Figure 67. Self-healing rate of the indirect tensile strength, at 15 ºC, of each type of the mixture
0,0
0,2
0,4
0,6
0,8
1,0
1,2
1,4
1,6
1,8
0,000 0,010 0,020 0,030 0,040 0,050 0,060 0,070
HR
-ITS
Energy consumption (kWh)
0% EAFS -50 gyros 4% EAFS -50 gyros 8% EAFS -50 gyros
0 gyrosat 80 ºC
0 gyrosat 60 ºC
0 gyrosat 25 ºC
25gyros at80 ºC
25gyros at60 ºC
25gyros at25 ºC
50gyros at80 ºC
50gyros at60 ºC
50gyros at25 ºC
HR ITS-0% EAFS 0,483 0,441 0,383 0,958 0,755 0,507 1,049 0,877 0,531HR ITS-4%EAFS 0,601 0,504 0,450 1,229 0,878 0,515 1,405 1,044 0,551HR ITS-8%EAFS 0,493 0,485 0,490 1,046 0,925 0,517 1,221 0,998 0,504
0,0
0,2
0,4
0,6
0,8
1,0
1,2
1,4
1,6
1,8
Self-
heal
ing
rate
(H
R)
Page 129
Chapter 6. Looking ahead: Self-healing analysis of HWMRA mixes containing 100% RAP
111
Gyratory compaction curves
In Figure 68a, the evolution of the geometric density (g/cm3) of the steel slag mixtures (0%,4%, and 8%
EAFS by the total volume of the mixture) against two different recompaction gyrations (25 and 50 load
cycles) was plotted, respectively. The specimens were recompacted by considering the standard compaction
conditions established (0.82º, 600 kPa, and 30 rpm) by the EN 12697-31:2008 standard, along with a
microwave conditioning treatment at three microwave heating temperatures (80 ºC, 60 ºC, and 25 ºC);
where the effect of the recompaction and temperature had a significant impact on the mixture densification
as well as in the recovery of the mixtures’ mechanical performance.
In Figure 68b, a significant improvement in the average geometric density value of 100% RAP mixture of
3.1% was obtained, i.e., this number increased by approximately 0.7 g/cm3 (i.e., from 2224 to 2314 g/cm3)
due to the application of a mix recompaction effort of 50 gyros at half-warm temperatures (~ 80 ºC);
whereas, Figure 68c-d showed the slope of the recompaction curve with 4% EAFS presented a steeper
upward curve behavior in terms of densification, rising sharply during the first 20 load cycles and becomes
more stable after that. In other words, an increase in the geometric density value by approximately 4.4%
was obtained, likely caused by the kneading effect provided by the gyratory compactor that allowed the
rearrangement of the particles in the specimen and, subsequently, the aggregate-aggregate interlocking
effect that promoted the densification of the mixture and, thus, the reduction of air voids content in mix
(Pérez-jiménez et al., 2014).
In particular, for the 8%EAFS mixture recompacted with 50 gyros, at 80 ºC, showed the highest average
densification value of 2.332 g/cm3, i.e., a considerable increase in the geometric density value of about
4.58% was obtained, whereas, for the mixture compacted at room temperature (25 ºC), this percentage was
practically negligible, as illustrated in Figure 68e-f.
(a) (b)
2100
2150
2200
2250
2300
2350
2400
2450
2500
0 10 20 30
Geo
met
ric d
ensi
ty (k
g/m
3 )
Number of recompaction gyros
0% EAFS - 25 gyros at 80ºC 0% EAFS - 25 gyros at 60ºC0% EAFS - 25 gyros at 25ºC
2100
2150
2200
2250
2300
2350
2400
0 10 20 30 40 50 60
Geo
met
ric d
ensi
ty (k
g/m
3 )
Number of recompaction gyros0% EAFS - 50gyros at 80ºC 4% EAFS - 50 gyros at 60ºC4% EAFS - 50 gyros at 25ºC
Page 130
Chapter 6. Looking ahead: Self-healing analysis of HWMRA mixes containing 100% RAP
112
(c) (d)
(e) (f)
Figure 68. Geometric density (g/cm3) value results of the 0%,4%, and 8% of EAFS mixture versus two
recompaction energies (25 and 50 gyros)
2200
2220
2240
2260
2280
2300
2320
2340
2360
2380
0 10 20 30
Geo
met
ric d
ensi
ty (k
g/m
3 )
Number of recompaction gyros4% EAFS - 25 gyros and 80ºC 4% EAFS - 25 gyros and 60ºC4% EAFS - 25 gyros and 25ºC
2240
2260
2280
2300
2320
2340
2360
2380
2400
0 10 20 30 40 50 60
Geo
met
ric d
ensi
ty (k
g/m
3 )
Number of recompaction gyros4% EAFS - 50 gyros and 80ºC 4% EAFS - 50 gyros and 60ºC4% EAFS - 50 gyros and 25ºC
2200
2230
2260
2290
2320
2350
2380
2410
2440
0 10 20 30
Geo
met
ric d
ensi
ty (k
g/m
3 )
Number of recompaction gyros
8% EAFS - 25 gyros at 80ºC 8% EAFS - 25 gyros at 60ºC8% EAFS - 25 gyros at 25ºC
2200
2220
2240
2260
2280
2300
2320
2340
2360
2380
0 10 20 30 40 50 60
Geo
met
ric d
ensi
ty (k
g/m
3 )
Number of recompaction gyros8% EAFS - 50 gyros at 80ºC 8% EAFS - 50 gyros at 60ºC8% EAFS - 50 gyros at 25ºC
Page 131
113
Chapter 7
7 CONCLUSIONS AND FUTURE
RESEARCH STUDIES
Laboratory compaction study
The primary objective of this study was to define the most appropriate compaction test method for
the production and characterization of half-warm mix recycling technology with 100% RAP and emulsified
bitumen and define the number of compaction gyrations (Ndesign) needed to match the benchmark density
of the samples compacted with 70 gyrations with the field density after pavement construction. In turn, the
second goal was to quantify how an accelerated curing treatment promotes the ultimate mechanical
performance properties (i.e., ITS and stiffness modulus) of the half-warm mix recycled asphalt mixtures
containing a RAP content equal to 100% and emulsified bitumen (2.5% o/RAP). The mixture mechanical
performance was also considered for this research Chapter in terms of rutting performance, stiffness, four-
point bending (4PB) beam fatigue test method. As for the HWMRA specimens’ production/compaction
and characterization in the preliminary mix design stage, the main findings and results that can be drawn
from this phase are collated below:
• The gyratory compactor system turned out to be the most suitable compaction method for half-
warm mix recycled asphalt (HWMRA) specimens’ production and characterization in the
laboratory. This compaction method allowed the provision of the benchmark density within the
range of between 2.311 and 2.335 g/cm3, and target air voids content in the order of 3.0-4.0%.
These results were obtained by applying a mix design compaction energy of 70 gyros, at 80 ºC,
and setting up the gyratory compactor at an internal angle of gyration of 0.82º, vertical
consolidation pressure of 600 kPa, and speed of gyration of 30 rpm.
Moreover, the compaction study revealed that, for 70 gyrations, a 98.8% (𝜌b,dim= 2.311 g/cm3)
of the ultimate geometric density of the gyratory compaction curve (𝜌b,dim=2.340 g/cm3 - at
200 gyros) was obtained – thus ensuring the benchmark density and target air voids content
sought for this technology;
• It is worth noting that the use of static compressive stress load by double-plunger of 21 MPa load
was discarded since this method led to a much higher bulk density, indirect tensile strength, and
stiffness modulus values than those expected from the road worksite after pavement construction.
Moreover, it was observed that the static method caused the breakage of aggregates and binders’
squeezing throughout the specimen’ compaction process;
Page 132
Chapter 7. Conclusions and future research studies
114
• Concerning the Marshall impactor results with 75 and 100 blows on each side, a significant
decrease in the volumetric (e.g., air voids and bulk density) and mechanical performance
properties (e.g., indirect tensile strength and stiffness modulus) of the recycled mixtures was
obtained, compared to the results from the gyratory compactor at 70 gyrations (0.82º, 600 kPa
and 30 rpm), likely as a result of the breakage of aggregates during the specimen’ compaction
process.
• The effect of a long-term accelerated curing treatment of three days (72 h), at 50 ºC, was found
to be rather positive on the development of the ultimate mixtures’ mechanical performance
properties. In other words, the stiffness modulus value increased by approximately 20%, i.e.,
ranging from 2891 (0 h) to 3462 MPa (72 h); whereas the indirect tensile strength values grew
by 11% (i.e., from 2.11 to 2.34 MPa), respectively. This improvement is likely caused by the
breaking and setting of emulsion, as well as for the maturation process suffered by the half-warm
emulsified specimens that promoted the ultimate mixtures’ mechanical performance properties
in terms of load-bearing capacity and indirect tensile strength values.No longer curing treatments
were required for this technology since they were found to reach a constant weight at 72 h and
50 ºC.
Looking at the advanced mechanical performance characterization of the mixtures studied, the principal
results and conclusions that can be drawn from this section are summarized below:
• The HWMRA 100% RAP (2.5%o/RAP) mixtures meet the minimum moisture damage resistance
values for their use in intermediate and low traffic load categories of road pavements. What’s
more, they meet the current stringent moisture sensitivity requirements stipulated for hot mix
asphalt mixtures in base, binder, and wearing course asphalt mixtures of road pavements;
• The HWMRA 100%RAP mixture with 2.5% emulsion (o/RAP) showed suitable resistance to
permanent deformation at 50 ºC and 60 ºC. In fact, for the 2.5% emulsion and 50/70 pen. grade
emulsified bitumen, the wheel tracking slope (WTSAIR) value, at 60 ºC, was much lower than
the maximum wheel tracking slope value (0.15 mm/103 load cycles) required by the Spanish
technical regulations for hot mix asphalt mixtures subject to intermediate and low traffic load
categories of road pavements;
• For the same stress levels selected, one can say that the HWMRA mixes with 50/70 pen. grade
bitumen showed similar fatigue cracking performance. However, 50/70 pen. bitumen exhibited
slightly lower micro-tensile fatigue-strain (휀6) values compared with the results from the 160/220
pen. grade bitumen. This is likely attributed to the effect of a softer penetration grade bitumen in
the final mixture design that allowed the provision of higher mixtures’ ductility and flexibility by
enabling greater tensile-strain fatigue loads.
Page 133
Chapter 7. Conclusions and future research studies
115
As for upcoming research lines, it is vital to keep working on the monitoring and characterization of the
half-warm mix recycled asphalt mixtures, either in the laboratory or field, to encourage higher confidence
in promoting the use of for maintenance and rehabilitation (M&R) activities of road pavements. To this
end, a set of scheduled sampling and testing campaigns on the test road section will be scheduled to draw
some conclusions regarding volumetric, mechanical performance (e.g., indirect tensile strength, stiffness
modulus, and fatigue resistance), and surface friction characteristics of these mixtures in the field. In
summary, these sampling campaigns allow getting more accurate data on the possible correlation between
the laboratory mix design phase and field performance.
Conclusions of the manufacturing and quality control
Once the compaction test method and mixture design were defined, the next step was to evaluate the
reproducibility of manufacturing half-warm mixes with 100% RAP and emulsified bitumen (2.5% and 3.0%
o/RAP) in a portable modified asphalt batch plant. In order to do this, an average of sixteen (16) in-plant
samples were prepared (with a diameter of 100 mm and 60 mm in height) and compacted using the gyratory
compactor, at 80 ºC, by applying a mix design compaction energy of 70 gyros using the laboratory standard
compaction conditions (0.82º, 600 kPa and 30 rpm) established in EN 12697-31:2008 standard. After that,
in-plant samples were tested for stiffness modulus at 20 ºC, indirect tensile strength at 15 ºC, moisture
sensibility, rutting performance, and resistance to fatigue cracking to indirect tensile at 20 ºC. The principal
results and conclusions that can be drawn from the quality control are collated in detail as follows:
• The results obtained from the quality control campaigns showed good homogeneity and
reproducibility of the HWMRA mixtures concerning grading curves and binder content and air
void content, suggesting that they can be successfully reproduced in real-scale asphalt
manufacturing plants.
• The HWMRA mixes (2.5% and 3.0% o/RAP) fell within the threshold values stipulated for an
AC16 D mixture, and at the same time met the restricted threshold values established by the
Spanish technical specifications in Art. 542.9.3.1: Fabrication of hot mix asphalt mixtures.
• The RAP material is properly pretreated, screened, and divided into, at least, two RAP fractions,
i.e., fine (0/5 mm) and coarse fraction (5/25 mm). In other words, the RAP’s fractionation and
processing allowed to ensure (1) the required bitumen contents targeted; (2) reduce the RAP
variability (± 0.3% o/RAP) in terms of binder content; and (2) it also allowed to guarantee the
physical bitumen’ consistency properties, increased mix homogeneity, and get more consistency
properties in terms of aggregate grading curves and binder contents;
Page 134
Chapter 7. Conclusions and future research studies
116
• Additionally, the theoretical RAP binder content of the 100% RAP mixture (2.5% o/RAP) was
found to be 4.15% o/RAP and adding 60% of residual emulsion content (from the 2.5% o/RAP),
the ultimate binder content, after in-plant manufacturing, of 5.7% o/RAP was obtained; whereas,
for the 3.0%o/RAP emulsion, this content was found to be 6.0 %o/RAP. The likely explanation
for these results lies in the good maneuvers of processing, treatment, screening, and
classification of RAP materials into two RAP fractions, which allowed to ensure and achieve the
required targeted binder contents in the final mixture design.
• Concerning the physical bitumen’ consistency properties of the recovered RAP binder, it was
found that the recycled binder exhibited a slight increase in the penetration values (dmm), though
a statistical variability in terms of softening point temperature (ºC) was noted, likely as a result of
the aging and heterogeneity of aged RAP binder obtained from different RAP millings;
• Both HWMRA 100% RAP mixtures meet the minimum moisture damage resistance value
required for in-situ recycling of bituminous layers with emulsion above 75%, likely attributed to
the fact that RAP aggregates are already coated and covered with a thin film of asphalt that
prevents the water penetration into the recycled particles;
• The average stiffness modulus, at 20 °C, of the HWMRA 100% RAP mixtures with 2.5% emulsion
was found to be in the range of a conventional HMA mixture corresponding to 6000 MPa;
• The HWMRA 100% RAP mixture with 2.5%o/RAP showed a wheel tracking slope slightly lower
than the maximum value (0.15 mm/103 load cycles) required for hot mix asphalt mixtures in the
binder and wearing course asphalt mixtures of road pavements;
Conclusions: Sampling
An average of sixteen (16) cylindrical pavement cores (with a diameter of 100 mm and a height of 55 mm)
for each emulsion content (2.5% and 3.0% o/RAP) were drilled from the test road sections, and tested in
the laboratory to determine apparent density, by SSD conditions, air voids content, stiffness modulus,
indirect tensile strength, and moisture susceptibility. Therefore, the main results and conclusions that can
be drawn from the test road section are summarized and compared in detail as follows:
• The apparent density and air voids content obtained from the field cores (2.5% and 3.0% o/RAP)
exhibited slightly lower density and higher air voids content than those values obtained from the
in-plant samples and; therefore, they may not exactly match the density obtained in the laboratory.
The likely explanation for these results is that the contractor could have applied lower compaction
energy since this mixture was going to be placed as binder course asphalt mixture;
Page 135
Chapter 7. Conclusions and future research studies
117
• The average stiffness modulus value of the HWMRA 100% RAP mixtures with 2.5% and
3.0%o/RAP emulsion was found to be within the range between 4800 MPa and 3500 MPa,
respectively.;
• The mixtures’ fatigue cracking resistance was evaluated through the indirect tensile strength at 15
ºC and loading frequency of 10 Hz. This test revealed that, for the same stress level applied, the
HWMRA 100% RAP (2.5% and 3.0%o/RAP) specimens exhibited equivalent fatigue cracking
slopes and similar strain-fatigue levels compared to conventional HMA mixtures. However, it was
noted that the effect of higher bitumen emulsion content in the final mixture design of 3.0%, likely
promoted the extension of the mixtures’ fatigue life;
• Looking at the mechanical performance properties of the pavement cores, the 100% RAP mixtures
(3.0% o/RAP) showed a slight decrease in terms of indirect tensile strength and stiffness modulus
values, i.e., the mechanical performance reduction was found to be 13.3% for the former and
27.9% for the latter. Nonetheless, it was noted that the 3.0% mixture showed a slight increase in
the mixture’ fatigue cracking resistance, whereby the effect of higher emulsion content in the final
mixture design likely promoted the extension of the mixtures’ fatigue life.
• It was found that the HWMRA 100% RAP mixtures have not displayed significant surface
distresses issues (i.e., wheel-path longitudinal cracking, transverse cracking, reflective cracking) -
showing that the HWMRA mixtures should be considered as a potential solution compared with
that of conventional mixes, due to the reduction of environmental and economic costs associated
with maintenance and rehabilitation practices;
• Regarding the international roughness index (IRI) values, it was observed that the HWMRA
100%RAP mixes with 2.5% and 3.0%o/RAP showed satisfactory functional characteristics, i.e.,
the average IRI was found to be 1.011 and 1.115 m/km, respectively. Also, no significant change
in surface roughness occurred during the first three years of service–suggesting that the
imperfections are derived more from paving operations than a function of surface pavement wear.
Moreover, no surface distresses (e.g., transverse cracking and wheel-tracking longitudinal
cracking, and rutting) were observed for this technology.
In summary, HWMRA showed equivalent mechanical performance to conventional HMA mixes, as
demonstrated by both the laboratory and field-stage tests, i.e., after in-plant manufacturing and field cores.
In this sense, HWMRA produced with emulsion can be considered as a true environmental alternative
compared to traditional mixes. Thus, a more in-depth research is being carried out to further evaluate and
achieve a better understanding of the long-term mechanical performance properties of this technology.
Page 136
Chapter 7. Conclusions and future research studies
118
Self-healing conclusions
The objective of this study was to present and quantify the self-healing ratio (HR) of the half-warm mix
recycled asphalt (HWMRA) mixtures with three different steel slag aggregate contents (0%,4%, and 8% of
EAFS) used as a replacement of recycled asphalt pavement (RAP) in the fine fraction of 0-4 mm. For this
reason, the mixtures’ self-healing ratio was determined using a thermomechanical treatment, i.e., three
different microwave heating temperatures (25 ºC,60 ºC, and 80 ºC) and three mechanical recompaction
gyrations (0,25, and 50 gyros) for HWMRA mix’ production and characterization in the laboratory. In turn,
the main findings and conclusions that can be drawn from the experimental methodology of this research
Chapter are summarized below:
Concerning the mixtures’ mechanical performance properties, it was found that the addition of steel slag
fine fraction into the new mixture design leads to a remarkable decrease in the mixtures’ mechanical
performance properties. In other words, the stiffness modulus values of the 8%EAFS mixture decreased by
14% (Sm =5569 MPa); whereas, for the stiffness modulus value with 4% EAFS, this property dropped by
9% (Sm =6128 MPa) compared to the HWMRA 100% RAP mixture (6465 MPa); likely caused by the
reduced interaction between slag aggregates and bitumen emulsion.
Nevertheless, one can say that the replacement of recycled aggregates with steel slag fine fraction
aggregates (0-4 mm sieve) represents a promising energy-efficient and environmental solution since it
allows to speed up the heating temperature of the internal specimen while increasing the self-healing rate
of the steel slag mixtures by applying a thermomechanical treatment at half-warm temperatures (80 ºC) and
50 recompaction gyrations.
For the indirect strength tensile (ITS) value, the 4% EAFS mixtures showed the highest recovery capability
of the healing ratio (40%), whereas, for the stiffness modulus, the average healing ratio of 68% was
obtained, by applying a recompaction effort of 50 gyrations at a microwave heating temperature of 80 ºC.
Therefore, for the stiffness modulus values, the higher the microwave heating temperature and
recompaction gyrations, the higher the recovery capability of the mixtures;
Finally, it is worth noting that there is not much difference between the self-healing ratio of the mixtures
using half- (25) or total recompaction energy. In general, the mechanical performance results encourage
greater confidence in promoting the revalorization of industrial by-products in new sustainable asphalt
mixes, by promoting the novelty of a cutting-edge mechanical recompaction treatment, along with
microwave heating energy.
Page 137
Chapter 7. Conclusions and future research studies
119
Future research studies and upcoming opportunities
Since half-warm mix recycling technology with 100%RAP and emulsified bitumen is a new paving
product released to the asphalt market, some specific issues should be investigated to keep improving the
current state-of-the-art review and state-of-the-practice while helping in the decision-making process for
the adoption of new disruptive production technologies such as half-warm mix asphalt.
1. Concerning long- term mechanical performance
• It is recommended to keep investigating the evolution of the volumetric and long-term
mechanical performance properties of half-warm mixes containing high (50-70%), and
total RAP contents (100%) laid either in the urban test section or in the test road section.
To this end, it is intended to conduct a set of coring and testing campaigns to draw more
consistent conclusions from the stiffness modulus, internal cohesion, rutting performance,
and fatigue cracking behavior. In particular, the mixtures’ stiffness modulus is
recommended to be tested at four different testing temperatures (5 ºC, 20 ºC, 30 ºC, and
40 ºC) to look into the evolution of the mixtures’ mechanical performance as a function
of the thermal season studied.
2. With regard to surface pavement friction characteristics as part of the pavement management
system:
• To analyze the evolution of the pavement surface friction characteristics of the wearing
course asphalt mixtures in terms of (1) Macrotexture, according to EN 13036-1:2010:
Measurement of pavement surface macrotexture depth using a volumetric patch
technique; (2) Skid resistance of a pavement surface using the Dynamic Friction Tester,
according to ASTM E1911-09ae1; and international surface roughness index, according
to EN 13036-6:2008. Part 6: Measurement of transverse and longitudinal profiles in the
evenness and megatexture wavelength ranges
3. Concerning fatigue cracking characterization of mixes with total RAP contents and at half-warm
temperatures:
• It is important to evaluate the crack propagation behavior of half-warm mixes with 100%
RAP and emulsified bitumen using the semi-circular bending (SCB) test by applying a 1
mm/min constant displacement load, according to EN 12697-44:2010.
Page 138
Chapter 7. Conclusions and future research studies
120
4. As for the self-healing analysis of half-warm mixes with steel slag used for replacement of recycled
aggregates in the fine fraction of 0-4 mm by the total volume of the mixture.
• It is highly recommended to prepare a new set of cylindrical specimens, with a C67B3
cationic emulsion, for being subjected to a controlled-stress fatigue load using the indirect
tensile fatigue test (ITFT), at 20 ºC, and loading frequency of 10 Hz (EN 12697-24:2012:
Resistance to Fatigue). In order to achieve this goal, it is suggested to keep evaluating the
same heating treatment temperatures (25 ºC, 60 ºC, and 80 ºC) and mechanical
recompaction-based technique (0,25, and 50 gyros) with the gyratory compactor (0.82º,
600 kPa, and 30 rpm) and, after that, quantify and compare the self-healing ratio (HR) of
the steel slag mixtures with a conventional hot mix asphalt (HMA) mixture.
• To analyze the effect of half-warm steel slag mixtures (0/4 mm) on the resistance to
permanent deformation, moisture susceptibility, stiffness modulus at 5ºC, 20 ºC, and 30 ºC,
and tensile strength at 15 ºC, and indirect tensile fatigue test at 20 ºC. To this end, it is
suggested that four number of recompaction gyrations (0,25,50, and 75 gyros) and four
microwave heating treatment temperatures (25 ºC, 60 ºC, 80 ºC, and 95 ºC) can be used and
evaluated for quantifying the self-healing ratio of such mixtures. In order to reliably
compare the self-healing results, it is crucial to maintain the microwave output capacity of
800 W, with a frequency of 2.45 GHz.
• Determining if the replacement of recycled aggregates with 4% and 8% of steel slag coarse
fraction (4-8 mm by the total volume of the mixture) improve the mechanical performance
and the self-healing ratio of the steel slag mixtures compared with the fine fraction (0/4
mm).
• Development of a self-healing prediction model that enables to simulate the long-term field
performance of HWMA mixes containing high and total RAP contents. This prediction
models can help local road administrations, agencies, and decision lawmakers to choose
which type of solutions may have a better field performance than conventional mixes based
on the cost-effective ratio throughout their life cycle assessment.
5. Regarding the Life cycle assessment (LCA) of half-warm mix recycled asphalt (HWMRA)
mixtures with 100% RAP and emulsified bitumen by conducting the life cycle assessment (LCA)
based on the ISO 14040:2006: Life cycle assessment. Principle and framework and ISO
14044:2006, and life-cycle costing analysis ISO 15686-5:2017. Buildings and Constructing Assets
-Life Planning. Part 5: Life-cycle costing.
Page 139
121
Chapter 8
8 REFERENCES
Abdulshafi, A., 1988. Rutting-review of existing models and some application to Saudi Arabia., in:
Proceedings of 3rd IRF Middle East Regional Meeting. pp. 244–256.
Airey, G., Collop, A.., Zoorob, S.., Elliott, R.., 2008. The influence of Aggregate, Filler and Bitumen on
Asphalt Mixture Moisture Damage. Constr. Build. Mater. 22, 2015–2024.
https://doi.org/https://doi.org/10.1016/j.conbuildmat.2007.07.009
Al-hdabi, A., Al, H., 2018. Performance of Half Warm Rolled Asphalt mixtures. Constr. Build. Mater.
162, 48–56. https://doi.org/10.1016/j.conbuildmat.2017.11.173
Al-Mansoori, T., Micaelo, R., Artamendi, I., Norambuena-Contreras, J., Garcia, A., 2017. Microcapsules
for self-healing of asphalt mixture without compromising mechanical performance. Constr. Build.
Mater. 155, 1091–1100. https://doi.org/10.1016/j.conbuildmat.2017.08.137
Al-Negheimish, A., Al-Sugair, F., Al-Zaid, R., 1997. Utilization of local steel making slag in concrete. J.
King Saud Univ. - Sci. 9, 39–55.
Al-Ohaly, A., Terrel, R., 1988. Effect of microwave heating on adhesion and moisture damage of aphalt
mixtures. Transp. Res. Board 27–36.
Al-Qadi, I.L., Carpenter, S.H., Pine, W.J., Trepanier, J., 2012. Impact of high RAP content of structural
and performance properties of asphalt mixtures. Spring-field, IL: Illinois Center for Transportation.
Al-rousan, T., Asi, I., Al-hattamleh, O., Al-qablan, H., 2008. Performance of Asphalt Mixes Containing
RAP. Jordan J. Civ. Eng. 2, 218–227.
Alavi, A.H., Hasni, H., Zaabar, I., Lajnef, N., 2016. A new approach for modeling of flow number of
asphalt mixtures. Arch. Civ. Mech. Eng. 17, 326–335. https://doi.org/10.1016/j.acme.2016.06.004
Alkins, A.E., Lane, B., Kazmierowski, T., 2012. Sustainable Pavements Environmental , Economic , and
Social Benefits of In Situ Pavement Recycling. Transp. Res. Rec. J. Transp. Res. Board 2012, 100–
103. https://doi.org/10.3141/2084-11
Ameri, M., Behnood, A., 2012a. Laboratory studies to investigate the properties of CIR mixes containing
steel slag as a substitute for virgin aggregates. Constr. Build. Mater. 26, 475–480.
https://doi.org/10.1016/j.conbuildmat.2011.06.047
Ameri, M., Behnood, A., 2012b. Laboratory studies to investigate the properties of CIR mixes containing
steel slag as a substitute for virgin aggregates. Constr. Build. Mater. 26, 475–480.
https://doi.org/10.1016/j.conbuildmat.2011.06.047
Ameri, M., Hesami, S., Goli, H., 2013. Laboratory evaluation of warm mix asphalt mixtures containing
electric arc furnace (EAF) steel slag. Constr. Build. Mater. 49, 611–617.
https://doi.org/10.1016/j.conbuildmat.2013.08.034
Page 140
Chapter 8. References
122
Apeagyei, A.K., Diefenderfer, B.K., Diefenderfer, S.D., 2011. Rutting Resistance of Asphalt Concrete
Mixtures That Contain Recycled Asphalt Pavement. J. Transp. Res. Board 2208, 9–16.
https://doi.org/10.3141/2208-02
Apeagyei, A.K., Ph, D., Asce, M., Clark, T.M., Asce, M., Rorrer, T.M., 2013. Stiffness of High-RAP
Asphalt Mixtures : Virginia ’ s Experience. J. Mater. Civ. Eng. 25, 747–754.
https://doi.org/10.1061/(ASCE)MT.1943-5533.0000543.
Apeagyei AK, Diefenderfer BK, Diefenderfer SD, 2011. Rutting Resistance of Asphalt Concrete
Mixtures that contain Recycled Asphalt Pavement. Transp. Res. Rec. J. Transp. Res. Board 2208,
9–16. https://doi.org/10.3141/2208-02
Arabani, M., Azarhoosh, A.R., 2012. The effect of recycled concrete aggregate and steel slag on the
dynamic properties of asphalt mixtures. Constr. Build. Mater. 35, 1–7.
https://doi.org/10.1016/j.conbuildmat.2012.02.036
Asi, I.M., 2007. Evaluating skid resistance of different asphalt concrete mixes. Build. Environ. 42, 325–
329. https://doi.org/10.1016/j.buildenv.2005.08.020
Asi, I.M., Qasrawi, H.Y., Shalabi, F.I., 2007. Use of steel slag aggregate in asphalt concrete mixes. Can.
J. Civ. Eng. 34, 902–911. https://doi.org/10.1139/l07-025
Asphalt Institute, 2007. The Asphalt Handbook MS-4. 7th Edition. Lexington, Ky.
Austroads, 2011. Review of Skid Resistance and Measurement Methods. Austroad technical report No.
AP–T177/11.
Ayar, P., Moreno-navarro, F., Rubio-g, M.C., 2016. The healing capability of asphalt pavements: a state
of the art review. J. Clean. Prod. 113, 28–40. https://doi.org/10.1016/j.jclepro.2015.12.034
Azari, H., Mohseni, A., 2014. Permanent Deformation Characterization of Asphalt Mixtures by Using
Incremental Repeated Load Testing. Transp. Res. Rec. J. Transp. Res. Board 2373, 1–9.
https://doi.org/10.3141/2373-14
Bagamapadde, U., Wahhab, S., 1999. Optimization of Steel Slag Aggregates for Bituminous Mixes in
Saudi Arabia. J. Mater. Civ. Eng. 11, 30–35.
Bardesi, A., Del Val, M., 2017. Considerations on the structural mix design rehabilitations using
recycling techniques in the context of 6.3 IC standard. (In spanish). Asf. y Paviment. VII, 29–37.
Bardesi, A., Soto, J., 2010. Bituminous mixtures fabricated at low temperatures: cold, half-warm and
warm asphalt mixes. Study of the current state-of-the-art and future of the mixtures (In spanish).
Bazin, P., Saunier, J., 1967. Deformability, fatigue, and healing properties of asphalt mixes. Ann Arbor,
Michigan, USA., in: Proceedings of the 2nd International Conference on the Structural Design of
Asphalt Pavements.
Behnood, A., Modiri Gharehveran, M., Gozali Asl, F., Ameri, M., 2015. Effects of copper slag and
recycled concrete aggregate on the properties of CIR mixes with bitumen emulsion, rice husk ash,
Portland cement and fly ash. Constr. Build. Mater. 96, 172–180.
https://doi.org/10.1016/j.conbuildmat.2015.08.021
Page 141
Chapter 8. References
123
Benedetto, A., Calvi, A., 2013. A pilot study on microwave heating for production and recycling of road
pavement materials. Constr. Build. Mater. 44, 351–359.
https://doi.org/10.1016/j.conbuildmat.2013.02.082
Bernier, A., Zofka, A., Yut, I., 2012. Laboratory evaluation of rutting susceptibility of polymer-modified
asphalt mixtures containing recycled pavements. Constr. Build. Mater. 31, 58–66.
https://doi.org/10.1016/j.conbuildmat.2011.12.094
Bhasin, A., Bommavaram, R., Greenfield, M.L., Little, D.N., 2011. Use of molecular dynamics to
investigate self-healing mechanisms in asphalt binders. J. Mater. Civ. Eng. 23, 485–492.
https://doi.org/https://doi.org/10.1061/(ASCE)MT.1943-5533.0000200
Boadu, C., 2005. Evaluation of rut resistance of Superpave fine-graded and coarse-graded mixtures. PhD
Dissertation, University of Florida.
Bocci M, Grilli A, Cardone F, Graziani A, 2011. A study on the mechanical behaviour of cement–
bitumen treated materials. Constr. Build. Mater. 25, 773–778.
https://doi.org/10.1016/j.conbuildmat.2010.07.007
Bonaquist, R., 2007. Can I run more RAP? Hot Mix Asph. Technol. 12, 11–13.
Bonnot, J., 1997. Selection and use of the procedure for laboratory compaction of bituminous mixtures.
Dublin, in: Performance Related Test Procedures for Bituminous Mixtures. Proceedings of the
Workshop. pp. 52–73.
Boriack, P.C., Katicha, S.W., Flintsch, G.W., Tomlinson, C.R., 2014. Laboratory evaluation of Asphalt
Concrete Mixtures Containing High Contents of Reclaimed Asphalt Pavement (RAP) and Binder.
Boriack P, Katicha S, Flintsch G, 2014. Laboratory Study on Effects of High Reclaimed Asphalt
Pavement and Binder Content. Transp. Res. Rec. J. Transp. Res. Board 2445, 64–74.
https://doi.org/10.3141/2445-08
Bosisio, R., Spooner, J., Granger, J., 1974. Asphalt road maintenance with a mobile microwave power
unit. J. Microw. Power 9, 381–386. https://doi.org/http://dx.doi.org/10.
1080/00222739.1974.11688936
Botella, R., Pérez-Jiménez, F., Miró, R., Guisado-Mateo, F., Ramírez Rodríguez, A., 2016.
Characterization of Half-Warm–Mix Asphalt with High Rates of Reclaimed Asphalt Pavement.
Transp. Res. Rec. J. Transp. Res. Board 2575, 168–174. https://doi.org/10.3141/2575-18
Box, G.E.P., 1953. Non-Normality and Tests on Variances. Biometrika 40, 318–335.
https://doi.org/10.2307/2333350
Breakah, T.M., Bausano, J.P., Williams, R.C., 2009. Integration of Moisture Sensitivity Testing with
Gyratory Mix Design and Mechanistic-Empirical Pavement Design. J. Transp. Eng. 135, 852–857.
https://doi.org/http://dx.doi.org/10.1061/(ASCE)0733-947X(2009)135:11(852)
Brosseaud, Y., Saint Jacques, M., 2008. Warm asphalt mixes: overview of this new technology in France.
Žnidarič, A , ed., 21 – 24 April , Ljubljana, Slovenia, Ljubljana : ZAG, DDC, DRC., in:
Proceedings of the Transport Research Arena ,. pp. 21–24.
Page 142
Chapter 8. References
124
Butcher M, 1998. Determining gyratory compaction characteristic using servopac gyratory
compactor.Washington, DC., in: Transportation Research Record: Journal of the Transportation
Research Board, No. 1630. Transportation Research Board Academies. pp. 89–97.
Butt, A., Birgisson, B., Kringos, N., 2012. Optimizing the Highway Lifetime by Improving the Self-
Healing Capacity of Asphalt. Procedia - Soc. Behav. Sci. 48, 2190–2200.
https://doi.org/10.1016/j.sbspro.2012.06.1192
Button, J., Estakhri, C., Wimsatt, A., 2007. A synthesis of Warm-Mix Asphalt. FHWA/TX-07/0-5597-1,
Report 0-5597-1, SWUTC/07/0-5597. Texas Transportation Institute, Texas.
Button, J.W., Little, D.N., Jagadam, V., Pendleton, O.J., 1994. Correlation of selected laboratory
compaction methods with field compaction. Transp. Res. Rec. 193–201.
Capitão, S.D., Picado-Santos, L.G., Martinho, F., 2012. Pavement engineering materials: Review on the
use of warm-mix asphalt. Constr. Build. Mater. 36, 1016–1024.
https://doi.org/10.1016/j.conbuildmat.2012.06.038
Caro, S., Masad, E., Bhasin, a., Little, D.N., 2008. Moisture susceptibility of asphalt mixtures, Part 1:
mechanisms. Int. J. Pavement Eng. 9, 81–98. https://doi.org/10.1080/10298430701792128
Castro, M., Sánchez, J.A., 2006. Fatigue and Healing of Asphalt Mixtures: Discriminate Analysis of
Fatigue Curves. J. Transp. Eng. 132, 168–174. https://doi.org/https://doi.org/10.1061/(ASCE)0733-
947X(2006)132:2(168)
Chang-fa, A., Bao-xian, L., Hao, P., Yan-jun, Q., 2014. Study of Strength Forming Mechanism and
Influencing Factors of Half-warm Mix Asphalt. J. Highw. Transp. Res. Dev. 8, 1–6.
Chiu CT, Hsu TH, Yang WF, 2008. Life cycle assessment on using recycled materials for rehabilitating
asphalt pavements. Resour. Conserv. Recycl. 52, 545–556.
https://doi.org/10.1016/j.resconrec.2007.07.001
Coleri, E., Harvey, J.T., Yang, K., Boone, J.M., 2013. Investigation of asphalt concrete rutting
mechanisms by X-ray computed tomography imaging and micromechanical finite element
modeling. Mater. Struct. Constr. 46, 1027–1043. https://doi.org/10.1617/s11527-012-9951-x
Collins, R., Lai, J.S., 1992. Use of Georgia Loaded Wheel Tester to Evaluate Rutting of Asphalt Samples
Prepared by Superpave Gyratory Compactor. Transp. Res. Rec. 1545, 161–168.
https://doi.org/https://doi.org/10.3141/1545-21
Colombier, G., 1997. Cracking in pavements: nature and origin of cracks. In: Vanelstraete A, Franckien
L, editors. Prevention of reflective cracking in pavements – RILEM report 18.
Consuegra, A., Little, D., Burati, J., Quintus, H. Von, Burati Jr, J., 1989. Comparative Evaluation of
Laboratory Compaction Devices Based on Their Ability to Produce Mixtures with Engineering
Properties Similar to Those Produced in the Field. Transp. Res. Rec. 80–87.
Coppola, L., Kara, P., Lorenzi, S., 2016. Concrete manufactured with crushed asphalt as partial
replacement of natural aggregates. Mater. Construcción 66, 1–7.
Cross, S.A., 2003. Determination of Superpave ® Gyratory Compactor Design Compactive Effort for
Page 143
Chapter 8. References
125
Cold In-Place Recycled Mixtures. Transp. Res. Rec. J. Transp. Res. Board 1819, 152–160.
https://doi.org/https://doi.org/10.3141/1819b-19
Croteau, J., Tessier, B., 2008. Warm mix asphalt paving technologies: a road builder’s perspective.
Polyscience Publications Inc., Laval, Quebec, Canada., in: Annual Conference of the
Transportation Association of Canada. p. 12.
D’Angelo, J., Harm, E., Bartoszek, J., Baumgardner, G., Corrigan, M., Cowsert, J., Harman, T., Jamshidi,
M., Jones, W., Newcomb, D., Prowell, B., Sines, R., Yeaton, B., 2007. Warm‐Mix Asphalt:
European Practice. European Tour FHWA. American Trade Initiatives.
Daniel, J., Pochily, J., Boisvert, D., 2010. Can More Reclaimed Asphalt Pavement Be Added? Transp.
Res. Rec. J. Transp. Res. Board 2180, 19–29. https://doi.org/10.3141/2180-03
Dhir, R.K., de Brito, J., Silva, R. V., Lye, C.Q., 2019. Use of Recycled Aggregates in Road Pavement
Applications. Sustain. Constr. Mater. https://doi.org/10.1016/b978-0-08-100985-7.00012-1
Dien, J., 2017. Best practices for repeated measures ANOVAs of ERP data: Reference, regional channels,
and robust ANOVAs. Int. J. Psychophysiol. 111, 42–56.
https://doi.org/10.1016/j.ijpsycho.2016.09.006
Dinis-Almeida, M., Afonso, M.L., 2015. Warm Mix Recycled Asphalt – A Sustainable Solution. J. Clean.
Prod. https://doi.org/10.1016/j.jclepro.2015.04.065
Dinis-Almeida, M., Castro-Gomes, J., Sangiorgi, C., Zoorob, S.E., Afonso, M.L., 2016. Performance of
Warm Mix Recycled Asphalt containing up to 100% RAP. Constr. Build. Mater. 112, 1–6.
https://doi.org/10.1016/j.conbuildmat.2016.02.108
Dinis-Almeida M, Castro-gomes J, Sangiorgi C, Zoorob SE, Lopes M, 2016. Performance of Warm Mix
Recycled Asphalt containing up to 100 % RAP. Constr. Build. Mater. 112, 1–6.
https://doi.org/10.1016/j.conbuildmat.2016.02.108
Djakfar, L., Bowoputro, H., Prawiro, B., Tarigan, N., 2015. Performance of Recycled Porous Hot Mix
Asphalt with Gilsonite Additive. Adv. Civ. Eng. 2015, 7.
https://doi.org/http://dx.doi.org/10.1155/2015/316719
Dondi, G., Pettinari, M., Sangiorgi, C., Zoorob, S.E., 2013. Traditional and Dissipated Energy approaches
to compare the 2PB and 4PB flexural methodologies on a Warm Mix Asphalt. Constr. Build. Mater.
47, 833–839. https://doi.org/10.1016/j.conbuildmat.2013.05.091
Doyle, J.., Howard, I.., 2013. Rutting and moisture damage resistance of high RAP warm mixed asphalt:
loaded wheel tracking vs. conventional methods. J. Assoc. Asph. Paving Technol. 82, 289–317.
Doyle, J.D., Howard, I.L., 2013. Rutting and moisture damage resistance of high reclaimed asphalt
pavement warm mixed asphalt: loaded wheel tracking vs. conventional methods. Denver Colorado,
United States., in: Association of Asphalt Paving Technologists Annual Meeting. pp. 148–172.
Dunning, R., Mendenhall, R., 1978. Design of Recyclced Asphalt Pavements and Selection of Modifiers.
Recycling of Bitumenous Pavements. ASTM STP662.
Fang, C., Yu, R., Liu, S., Li, Y., 2013. Nanomaterials Applied in Asphalt Modification : A Review. J.
Page 144
Chapter 8. References
126
Mater. Sci. Technol. 29, 589–594. https://doi.org/10.1016/j.jmst.2013.04.008
Fernández, A., Alonso, M., López-Moro, F., Moro, M., 2013. Polished Stone Value Test and its
relationship with petrographic parameters (hardness contrast and modal composition) and surface
micro-roughness in natural and artificial aggregates. Mater. Constr. 63, 377–391.
https://doi.org/doi: 10.3989/mc.2013.00912
Flores, G., Gallego, J., Giuliani, F., Autelitano, F., 2018. Aging of asphalt binder in hot pavement
rehabilitation. Constr. Build. Mater. 187, 214–219.
https://doi.org/10.1016/j.conbuildmat.2018.07.216
Franesqui, M.A., Yepes, J., García-gonzález, C., 2017. Top-down cracking self-healing of asphalt
pavements with steel filler from industrial waste applying microwaves. Constr. Build. Mater. 149,
612–620. https://doi.org/10.1016/j.conbuildmat.2017.05.161
Gaarkeuken, G., Oosterveld, M., Sprenger, M.L.M., Voskuilen, J.L.M., 2016. LEAB-PA , A Half Warm
Porous Asphalt Can Increase the Lifetime.RILEM Bookseries, vol 11. Springer, Dordrecht ., in: 8th
RILEM International Symposium on Testing and Characterization of Sustainable and Innovative
Bituminous Materials. pp. 215–227. https://doi.org/10.1007/978-94-017-7342-3
Gallego, J., Del Val, M. a., Contreras, V., Páez, A., 2013. Heating asphalt mixtures with microwaves to
promote self-healing. Constr. Build. Mater. 42, 1–4.
https://doi.org/10.1016/j.conbuildmat.2012.12.007
Gallego, J., Del Val, M.A., Contreras, V., Páez, A., 2017. Use of additives to improve the capacity of
bituminous mixtures to be heated by means of microwaves. Mater. Construcción 67, 110.
https://doi.org/10.3989/mc.2017.00416
Gao, L., Ni, F., Charmot, S., Luo, H., 2014. Influence on Compaction of Cold Recycled Mixes with
Emulsions Using the Superpave Gyratory Compaction. J. Mater. Civ. Eng. 26, 1–8.
https://doi.org/10.1061/(ASCE)MT.1943-5533.0000987.
Gao, L., Ni, F., Luo, H., Charmot, S., 2015. Characterization of air voids in cold in-place recycling
mixtures using X-ray computed tomography. Constr. Build. Mater. 84, 429–436.
https://doi.org/10.1016/j.conbuildmat.2015.03.081
García, Á., 2012. Self-healing of open cracks in asphalt mastic. Fuel 93, 264–272.
https://doi.org/10.1016/j.fuel.2011.09.009
García, A., Bueno, M., Norambuena-contreras, J., Partl, M.N., 2013. Induction healing of dense asphalt
concrete. Constr. Build. Mater. 49, 1–7. https://doi.org/10.1016/j.conbuildmat.2013.07.105
García, Á., Schlangen, E., van de Ven, M., Liu, Q., 2009. Electrical conductivity of asphalt mortar
containing conductive fibers and fillers. Constr. Build. Mater. 23, 3175–3181.
https://doi.org/10.1016/j.conbuildmat.2009.06.014
García, Á., Schlangen, E., Ven, M. Van De, Liu, Q., 2012. A simple model to define induction heating in
asphalt mastic. Constr. Build. Mater. Mater. 31, 38–46.
https://doi.org/10.1016/j.conbuildmat.2011.12.046
Page 145
Chapter 8. References
127
Godenzoni C, Cardone F, Graziani A, Bocci M, 2016. The Effect of Curing on the Mechanical Behavior
of Cement-Bitumen Treated Materials, in: 8th RILEM International Symposium on Testing and
Characterization of Sustainable and Innovative Materials. pp. 879–890. https://doi.org/10.1007/978-
94-017-7342-3
Goh, S.W., You, Z., Wang, H., Mills-beale, J., Ji, J., 2011. Determination of Flow Number in Asphalt
Mixtures from Deformation Rate During Secondary State. Transp. Res. Rec. J. Transp. Res. Board
2210, 106–112. https://doi.org/10.3141/2210-12
Gómez-Meijide, B., Pérez, I., Pasandín, a. R., 2015. Recycled construction and demolition waste in Cold
Asphalt Mixtures: evolutionary properties. J. Clean. Prod. 1–11.
https://doi.org/10.1016/j.jclepro.2015.08.038
Graziani A, Godenzoni C, Cardone F, Bocci M, 2016. Effect of curing on the physical and mechanical
properties of cold-recycled bituminous mixtures. Mater. Des. 95, 358–369.
https://doi.org/10.1016/j.matdes.2016.01.094
Hajj, E.Y., Sebaaly, P.E., Shrestha, R., 2009. Laboratory Evaluation of Mixes Containing Recycled
Asphalt Pavement (RAP). Road Mater. Pavement Des. 10, 495–517.
https://doi.org/10.1080/14680629.2009.9690211
Hajj EY, Sebaaly PE, Shrestha R, 2009. Laboratory Evaluation of Mixes Containing Recycled Asphalt
Pavement (RAP). Road Mater. Pavement Des. 10, 495–517.
https://doi.org/10.1080/14680629.2009.9690211
Harder, G., Legoff, P.E.Y., Loustau, A., Martineau, Y., Heritier, B., Romier, A., 2008. Energy and
Environmental Gains of Warm and Half-Warm Asphalt Mix: Quantitative Approach. Washington
DC, United States., in: Transportation Research Board 87th Annual Meeting. pp. 1–20.
Harmelink, D., Aschenbrener, T., Shuler, S., 2007. Achieving 4% Air Voids in Real Pavements with
Superpave. Transp. Res. Rec. J. Transp. Res. Board 2040, 115–122. https://doi.org/10.3141/2040-
13
Hartmán, A., Gilchrist, M., Walsh, G., 2001. Effect of Mixture Compaction on Indirect Tensile Stiffness
and Fatigue. J. Transp. Eng. 127, 370–378. https://doi.org/doi:10.1061/(ASCE)0733-
947X(2001)127:5(370)
Hartman, B.A.M., Gilchrist, M.D., Walsh, G., 2001. Effect of mixture compaction on indirect tensile
stiffness and fatigue. J. Transp. Eng. 127, 370–378.
https://doi.org/https://doi.org/10.1061/(ASCE)0733-947X(2001)127:5(370)
Hesami, S., Ameri, M., Goli, H., Akbari, A., 2014. Laboratory investigation of moisture susceptibility of
warm-mix asphalt mixtures containing steel slag aggregates. Int. J. Pavement Eng. 745–759.
https://doi.org/10.1080/10298436.2014.953502
Hill, B., 2011. Performance evaluation of warm mix asphalt mixtures incorporating reclaimed asphalt
pavement. University of Illinois at Urbana-Champaign.
Hossain, Z., Bhudhala, A., Zaman, M., O’Rear, E., Cross, S., Lewis, S., 2009. Evaluation of the Use of
Page 146
Chapter 8. References
128
Warm Mix Asphalt as a Viable Paving Material in the United States. Report 06-H-0044, Federal
Highway Administration, McLean.
Hou, Y., Ji, X., Su, X., 2017. Mechanical properties and strength criteria of cement-stabilised recycled
concrete aggregate. Int. J. Pavement Eng. 8436, 0. https://doi.org/10.1080/10298436.2017.1293266
Huang, B., Li, G., Vukosavljevic, D., Shu, X., Egan, B.K., 2005. Laboratory Investigation of Mixing Hot-
Mix Asphalt with Reclaimed Asphalt Pavement. Transp. Res. Board 37–45.
Huang, B., Zhang, Z., Kingery, W., Zuo, G., 2004. Fatigue crack characteristics of HMA mixtures
containing RAP, in: Fifth International RILEM Conference on Reflective Cracking in Pavements.
pp. 631–638.
Hurley, G.C., Prowell, B.D., 2006. Evaluation of Evotherm® for use in warm-mix asphalt. National
Center for sphalt Technology (NCAT) Report 06-02. Auburn.
Jamshidi, A., Othman, M., You, Z., 2013. Performance of Warm Mix Asphalt containing Sasobit: State-
of-the-art. Constr. Build. Mater. 38, 530–553. https://doi.org/10.1016/j.conbuildmat.2012.08.015
Kandhal, P., Hoffman, G., 1997. Evaluation of Steel Slag Fine Aggregate in Hot-Mix Asphalt Mixtures.
Transp. Res. Rec. 1583, 28–36. https://doi.org/10.3141/1583-04
Kandhal PS, Mallick RB, 1997. Pavement Recycling Guidelines for State and Local Governments
Participant ’ s Reference Book.
Karki, P., Li, R., Bhasin, A., 2014. Quantifying overall damage and healing behaviour of asphalt
materials using continuum damage approach. J. Pavement Eng. 16, 350–362.
https://doi.org/http://dx.doi.org/10.1080/10298436.2014.942993.
Karlsson, R., Isacsson, U., 2006. Material-Related Aspects of Asphalt Recycling — State-of-the-Art. J.
Mater. Civ. Eng. 18, 81–92. https://doi.org/https://doi.org/10.1061/(ASCE)0899-
1561(2006)18:1(81)
Kavussi, A., Qazizadeh, M.J., 2014. Fatigue characterization of asphalt mixes containing electric arc
furnace ( EAF ) steel slag subjected to long-term aging. Constr. Build. Mater. 72, 158–166.
https://doi.org/10.1016/j.conbuildmat.2014.08.052
Khan, Z., Wahab, H.I.A., Asi, I., Ramadhan, R., 1998. Comparative study of asphalt concrete laboratory
compaction methods to simulate field compaction. Constr. Build. Mater. 12, 373–384.
https://doi.org/https://doi.org/10.1016/S0950-0618(98)00015-4
Kiggundu, B., Newman, J., 1987. Asphalt-aggregate Interactions in Hot Recycling. Final Repot # ESL-
TR-87-07. New Mexico Engineering Research Institute.
Kiggundu, B., Roberts, F., 1988. Stripping in HMA Mixtures: State-of-the-art and Critical Review of Test
Methods. National Center for Asphalt Technology (NCAT).
Kim, D., Norouzi, A., Kass, S., Liske, T., Kim, Y.R., 2017. Mechanistic performance evaluation of
pavement sections containing RAP and WMA additives in Manitoba. Constr. Build. Mater. 133,
39–50. https://doi.org/10.1016/j.conbuildmat.2016.12.035
Kim, M., Mohammad, L.N., Jordan, T., Cooper, S.B., 2018. Fatigue performance of asphalt mixture
Page 147
Chapter 8. References
129
containing recycled materials and warm-mix technologies under accelerated loading and four point
bending beam test. J. Clean. Prod. 192, 656–664. https://doi.org/10.1016/j.jclepro.2018.04.070
Kim, R.Y., Little, D.N., Burghardt, R.C., 1991. SEM analysis on fracture and healing sand-asphalt
mixtures. J. Mater. Civ. Eng. 3, 140–153. https://doi.org/https://doi.org/10.1061/(ASCE)0899-
1561(1991)3:2(140)
Kim, Y., IM, S., Lee, H.D., 2011. Impacts of Curing Time and Moisture Content on Engineering
Properties of Cold In-Place Recycling Mixtures Using Foamed or Emulsified Asphalt. J. Mater.
Civ. Eng. 23, 542–553. https://doi.org/10.1061/(ASCE)MT.1943-5533.0000209.
Kim, Y.J., Lee, H.D., 2011. Influence of Reclaimed Asphalt Pavement Temperature on Mix Design
Process of Cold In-Place Recycling Using Foamed Asphalt. J. Mater. Civ. Eng. 23, 961–968.
Kristjánsdóttir, Ó., Muench, S., Michael, L., Burke, G., 2007. Assessing Potential for Warm-Mix Asphalt
Technology Adoption. Transp. Res. Rec. J. Transp. Res. Board 2040, 91–99.
https://doi.org/http://dx.doi.org/10.3141/2040-10
Kristjánsdóttir Ó, Muench ST, Michael L, Burke G, 2007. Assessing the Potential for Warm Mix Asphalt
Technology Adoption. J. Transp. Res. Board No. 2040, 91–99.
https://doi.org/http://dx.doi.org/10.3141/2040-10
Kruskal, W.H., Wallis, W.A., 1952. Use of Ranks in One-Criterion Variance Analysis. J. Am. Stat.
Assoc. 47, 583–621. https://doi.org/10.1080/01621459.1952.10483441
Kusam, A., Malladi, H., Tayebali, A.A., Khosla, N.P., 2017. Laboratory Evaluation of Workability and
Moisture Susceptibility of Warm-Mix Asphalt Mixtures Containing Recycled Asphalt Pavements.
J. Mater. Civ. Eng. ASCE 29, 1–8. https://doi.org/10.1061/(ASCE)MT.1943-5533.0001825.
Kutay, M.E., Arambula, E., Gibson, N., Youtcheff, J., 2010. Three-dimensional image processing
methods to identify and characterise aggregates in compacted asphalt mixtures. Int. J. Pavement
Eng. 511–528. https://doi.org/10.1080/10298431003749725
Lee, C.H., Du, J.C., Shen, D.H., 2012. Evaluation of pre-coated recycled concrete aggregate for hot mix
asphalt. Constr. Build. Mater. 28, 66–71. https://doi.org/10.1016/j.conbuildmat.2011.08.025
LEE, H.-J., Daniel, J.S., Kim, Y.R., 2000. Laboratory performance evaluation of modified asphalt
mixtures for Inchon airport pavements. Int. J. Pavement Eng. 1, 151–169.
Li, N., Pronk, A., Molenaar, A., van de Ven, M., Wu, S., 2013. Comparison of Uniaxial and Four-Point
Bending Fatigue Tests for Asphalt Mixtures. Transp. Res. Rec. J. Transp. Res. Board 2373, 44–53.
https://doi.org/10.3141/2373-05
Li, X., Clyne, T., Marasteanu, M., 2004. Recycled Asphalt Pavement (RAP) Effects on Binder and
Mixture Quality. Department of Civil Engineering, University of Minnesota.
Li, X., Gibson, N., 2016. Comparison of Laboratory Fatigue Characteristics with Full-Scale Pavement
Cracking for Recycled and Warm-Mix Asphalts. Transp. Res. Rec. J. Transp. Res. Board 2576,
100–108. https://doi.org/10.3141/2576-11
Little, D., Lytton, R., Williams, A., Chen, C., 2001. Microdamage healing in asphalt and asphalt concrete.
Page 148
Chapter 8. References
130
Volume 1: microdamage and microdamage healing, project summary report.
Little, D., Lytton, R., Williams, D., Chen, C., Kim, Y., Lee, H., 1998. FHWA Final Report.
Liu, Q., Chen, C., Li, B., Sun, Y., Li, H., 2018. Heating characteristics and induced healing efficiencies of
asphalt mixture via induction and microwave heating. Materials (Basel). 11.
https://doi.org/10.3390/ma11060913
Liu, Q., García, Á., Schlangen, E., Ven, M. Van De, 2011. Induction healing of asphalt mastic and porous
asphalt concrete. Constr. Build. Mater. 25, 3746–3752.
https://doi.org/10.1016/j.conbuildmat.2011.04.016
Liu, Q., Schlangen, E., Ven, M. Van De, Bochove, G. Van, Montfort, J. Van, 2012. Evaluation of the
induction healing effect of porous asphalt concrete through four point bending fatigue test. Constr.
Build. Mater. 29, 403–409. https://doi.org/10.1016/j.conbuildmat.2011.10.058
Liu, S., Yu, X., Dong, F., 2017. Evaluation of moisture susceptibility of foamed warm asphalt produced
by water injection using surface free energy method. Constr. Build. Mater. 131, 138–145.
https://doi.org/10.1016/j.conbuildmat.2016.11.072
Lizarraga JM, Ramírez A, Díaz P, Martín M, Guisado F, 2017. Long-term monitoring of half warm mix
recycled asphalt containing up to 100% RAP, in: The Netherlands CRC Press/Balkema 2017 (Ed.),
Aiit International Congress on Transport Infrastructure and Systems (Tis 2017), Rome, Italy. Taylor
& Francis Group, pp. 253–260. https://doi.org/10.1201/9781315281896-35
Lo Presti D, Jiménez del Barco Carrión A, Airey G, Hajj E, 2016. Towards 100 % recycling of reclaimed
asphalt in road surface courses : binder design methodology and case studies. J. Clean. Prod. 131, 9.
https://doi.org/10.1016/j.jclepro.2016.05.093
Lo Presti D, Khan R, Abdul Hassan N, Airey G, Collop A, 2014. Laboratory Mix Design of Asphalt
Mixture Containing Reclaimed Material. Adv. Mater. Sci. Eng. 2014, 1–11.
https://doi.org/10.1155/2014/507082
Lopes M, Gabet T, Bernucci L, Mouillet V, 2014a. Durability of hot and warm asphalt mixtures
containing high rates of reclaimed asphalt at laboratory scale. Mater. Struct.
https://doi.org/10.1617/s11527-014-0454-9
Lopes M, Gabet T, Bernucci L, Mouillet V, 2014b. Durability of hot and warm asphalt mixtures
containing high rates of reclaimed asphalt at laboratory scale. Mater. Struct.
https://doi.org/10.1617/s11527-014-0454-9
Lu, Q., Harvey, J.T., 2006. Evaluation of Hamburg Wheel-Tracking Device Test with Laboratory and
Field Performance Data. Transp. Res. Rec. J. Transp. Res. Board 1970, 25–44.
https://doi.org/https://doi.org/10.3141/1970-05
Luo, S., Yang, X., 2015. Performance evaluation of high-elastic asphalt mixture containing deicing agent
Mafilon. Constr. Build. Mater. 94, 494–501. https://doi.org/10.1016/j.conbuildmat.2015.07.064
Luo, X., 2012. Characterization of fatigue cracking and healing of asphalt mixes. Texas A&M University.
Lytton, R.L., Uzan, J., Fernando, E.G., Roque, R., Hiltunen, D., Stoffels, S.M., 1993. Development and
Page 149
Chapter 8. References
131
validation of performance prediction models and specifications for asphalt binders and paving
mixes. Strategic Highway Research Program (SHRP), National Research Council.
Maher, M., Uzarowski, L., Moore, G., Aurilio, V., 2006. Sustainable Pavements—Making the Case for
Longer Design Lives for Flexible Pavements., in: Proceedings of the Fifty-First Annual Conference
on the Canadian Technical Asphalt Association (CTAA): Charlottetown, Prince Edward Island. pp.
43–56.
Malladi, H., Asce, S.M., Ayyala, D., Tayebali, A.A., Khosla, N.P., 2015. Laboratory Evaluation of
Warm-Mix Asphalt Mixtures for Moisture and Rutting Susceptibility. J. Mater. Civ. Eng. 27, 1–6.
https://doi.org/10.1061/(ASCE)MT.1943-5533
Manolis, S., Decoo, T., Lum, P., Greco, M., 2008. Cold Weather Paving Using Warm Mix Asphalt
Technology, in: Proceedings of the Fifty-Third Annual Conference of the Canadian Technical
Asphalt Association (CTAA). pp. 171–190.
Marques, V. da C., de Queiroz, B.O., de Lacerda, D.M., Gouveia, A.M. de A., de Melo, R.A., 2014.
Mechanical Performance of Asphalt Mixtures with Natural Aggregates and Recycled Aggregates
for Surface Course. Key Eng. Mater. 600, 657–666.
https://doi.org/10.4028/www.scientific.net/kem.600.657
Martínez-Echevarría, M.J., Recasens, R.M., del Carmen Rubio Gámez, M., Ondina, A.M., 2012. In-
laboratory compaction procedure for cold recycled mixes with bituminous emulsions. Constr.
Build. Mater. 36, 918–924. https://doi.org/10.1016/j.conbuildmat.2012.06.040
Martínez-echevarría, M.J., Tafur Garro, M., Gallardo Zeballos, G., 2016. Implementation of the
mechanistic – empirical pavement design in northern Peru using a calibration coefficient for the
International Roughness Index. Constr. Build. Mater. 102, 270–280.
https://doi.org/10.1016/j.conbuildmat.2015.10.167
Masad, E., Somadevan, N., Shashidhar, N., Dasgupta, N., Jandhyala, V.K., 2002. Characterization of Air
Void Distribution in Asphalt Mixes using X-ray Computed Tomography. J. Mater. Civ. Eng. 14,
122–129. https://doi.org/10.1061/(asce)0899-1561(2002)14:2(122)
Maupin Jr, G.W., Diefenderfer, S.D., Gillespie, J.S., 2008. Evaluation of Using Higher Percentages of
Recycled Asphalt Pavement in Asphalt Mixes in Virginia. publication VTRC 08-R22, Project No.
85364. Virginia Transportation Research Council, Charlottesville.
Mazzoni, G., Stimilli, A., Canestrari, F., 2016. Self-healing capability and thixotropy of bituminous
mastics. Int. J. Fatigue 92, 8–17. https://doi.org/10.1016/j.ijfatigue.2016.06.028
McDaniel, R., Shah, A., Huber, G., 2012. Investigation of Low and High-Temperature Properties of
Plant-Produced RAP Mixtures. McLean, VA: Federal HighwayAdministration-.
McDaniel, R., Soleymani, H., Anderson, R.M., Turner, P., Peterson, R., Harrigan, E.T., 2001.
Recommended Use of Reclaimed Asphalt Pavement in the Superpave Mix Design Method :
Guidelines. Natl. Coop. Highw. Res. Progr. Res. Results Dig.
McDaniel, R.S., Shah, A., Huber, G. a., Copeland, A., 2012. Effects of reclaimed asphalt pavement
Page 150
Chapter 8. References
132
content and virgin binder grade on properties of plant produced mixtures. Road Mater. Pavement
Des. 13, 161–182. https://doi.org/10.1080/14680629.2012.657066
Metaxas, A., Meredith, R., 1983. Industrial Microwave Heating. The Institution of Electrical Engineers,
London.
Miranda, L., 2008. Performance of “half-warm mix asphalt” (HWMA) mixtures compared to
conventional hot mix asphalt mixtures". Valladolid, Spain. (In spanish). VIII - Natl. Congr. Road
Pavements 2, 863–876.
Modarres, A., Ayar, P., 2014. Coal waste application in recycled asphalt mixtures with bitumen emulsion.
J. Clean. Prod. 83, 263–272. https://doi.org/10.1016/j.jclepro.2014.07.082
Mogawer, W., Bennert, T., Daniel, J.S., Ramon Bonaquist, Austerman, A., Booshehrian, A., 2012.
Performance characteristics of plant produced high RAP mixtures., in: 87th Association of Asphalt
Paving Technologists’ Annual Meeting, April 1-4. pp. 183–208.
https://doi.org/http://dx.doi.org/10.1080/14680629.2012.657070
Mollenhauer, K., Wistuba, M.P., 2013. Influence of asphalt compaction procedure on 3D deformation
properties. Int. J. Pavement Eng. 17, 5–12. https://doi.org/10.1080/10298436.2013.812213
Moreno-Navarro, F., García-travé, G., Rubio, M., Martinez-echevarria, M.J., 2014. Analysis of the
moisture susceptibility of hot bituminous mixtures based on the comparison of two laboratory test
methods. Rev. Dyna 49–59.
Motamed, A., Nyanhongo, S., Karki, P., Bhasin, A., Report, F., 2014. Fatigue and fracture properties of
aged binders in the context of reclaimed asphalt mixes. Final report: DTRT12-G-UTC06.
Motter, J.S., Miranda, L.F.R., Bernucci, L.L.B., 2015. Performance of Hot Mix Asphalt Concrete
Produced with Coarse Recycled Concrete Aggregate. J. Mater. Civ. Eng. 27, 04015030.
https://doi.org/10.1061/(asce)mt.1943-5533.0001284
Newcomb, D., Ray brown, E., Epps, J.A., 2007. Designing HMA mixtures with High RAP content: A
practical guide.
Norambuena-contreras, J., Garcia, A., 2016. Self-healing of asphalt mixture by microwave and induction
heating. Jorunal Mater. Des. 106, 404–414. https://doi.org/10.1016/j.matdes.2016.05.095
Norambuena-contreras, J., Gonzalez-torre, I., 2017. Influence of the Microwave Heating Time on the
Self-Healing Properties of Asphalt Mixtures. Appl. Sci. 7, 15. https://doi.org/10.3390/app7101076
Nosetti, A., Pérez-madrigal, D., Pérez-jiménez, F., Martínez, A.H., 2018. Effect of the recycling process
and binder type on bituminous mixtures with 100 % reclaimed asphalt pavement. Constr. Build.
Mater. 167, 440–448. https://doi.org/10.1016/j.conbuildmat.2018.02.042
Ofori-Abebresse, E., 2006. Fatigue resistance of hot-mix asphalt concrete (HMAC) mixtures using the
calibrated mechanistic with surface energy (CMSE) measurements approach. Master’s thesis. Texas
A&M University, Texas.
Olard, F., Beduneau, E., Bonneau, D., Dupriet, S., Seignez, N., 2009. Laboratory performance-based
assessment of half-warm mix asphalts with high recycling rate by means of the factorial experiment
Page 151
Chapter 8. References
133
design approach in Advanced Testing and Characterization of Bituminous Materials – Loizos, Partl,
Scarpas & Al-quadi (eds), Tay, in: Proceedings of the 8th International Conference (BCR2A’09). p.
479-. https://doi.org/https://doi.org/10.1201/9780203092989.ch63
Olard, F., Romier, A., 2009. Low emission and low energy asphalt for sustainable road construction: The
European experience of LEA process. EIFFAGE Travaux Publics. Research and Development
(R&D) department, France,.
Pasandín, A.R., Pérez, I., 2013. Laboratory evaluation of hot-mix asphalt containing construction and
demolition waste. Constr. Build. Mater. 43, 497–505.
https://doi.org/10.1016/j.conbuildmat.2013.02.052
Pasetto, M., Baldo, N., 2011. Mix design and performance analysis of asphalt concretes with electric arc
furnace slag. Constr. Build. Mater. 25, 3458–3468.
https://doi.org/10.1016/j.conbuildmat.2011.03.037
Pérez-jiménez, F., Martínez, A.H., Miró, R., Hernández-barrera, D., Araya-zamorano, L., 2014. Effect of
compaction temperature and procedure on the design of asphalt mixtures using Marshall and
gyratory compactors. Constr. Build. Mater. 65, 264–269.
https://doi.org/10.1016/j.conbuildmat.2014.04.135
Pérez, I., Medina, L., Val, M. Del, 2013. Mechanical properties and behaviour of in situ materials which
are stabilised with bitumen emulsion. … Mater. Pavement Des. 37–41.
https://doi.org/10.1080/14680629.2013.779301
Pérez, I., Toledano, M., Gallego, J., Taibo, J., 2007. Mechanical properties of hot mix asphalt made with
recycled aggregates from reclaimed construction and demolition debris. Mater. Construcción 57,
17–29. https://doi.org/10.3989/mc.2007.v57.i285.36
Petersen, J.C., Plancher, H., Ensley, E.K., Venable, R.L., Miyake, G., 1982. Chemistry of asphalt-
aggregate interaction: relationship with pavement moisture-damage prediction test. Transp. Res.
Rec. 95–104.
Phillips, M.C., 1998. Multi-step models for fatigue and healing, and binder properties involved in healing.
Luxembourg. Paper Number 115., in: Proceedings of Eurobitume Workshop on Performance
Related Properties for Bituminous Binders.
Polaczyk, P., Han, B., Huang, B., Jia, X., Shu, X., 2018. Evaluation of the hot mix asphalt compactability
utilizing the impact compaction method. Constr. Build. Mater. 187, 131–137.
https://doi.org/10.1016/j.conbuildmat.2018.07.117
Qiu, J., van de Ven, M., Wu, S., Yu, J., Molenaar, A., 2009. Investigation of self healing capability of
bituminous binders. Special Issue on Asphalt Materials. Road Mater Pavement Des. 10, 81–94.
Rafi, M.M., Qadir, A., Siddiqui, H., 2011. Experimental testing of hot mix asphalt mixture made of
recycled aggregates. Waste Manag. Res. 29, 1316–1326.
https://doi.org/10.1177/0734242X10370379
Raithby, K.D., Sterling, A.B., 1990. The effect of rest periods on the fatigue performance of a hot-rolled
Page 152
Chapter 8. References
134
asphalt under reversed axial loading. J. Assoc. Asph. Paving Technol. 39, 134–152.
Ramírez, A., Gallego, J., Marcobal, J.R., Blázquez, C., 2015. Development of new laboratory equipment
for measuring the accelerated polishing of asphalt mixes. Wear 322–323, 164–170.
https://doi.org/10.1016/j.wear.2014.11.006
Rashwan, M.H., 2012. Characterization of Warm Mix Asphalt ( WMA ) performance in different asphalt
applications.
Read, J.M., 1996. Fatigue Cracking Bituminous Paving Mixtures. University of Nottigham.
Rebbechi J, Green M, 2005. Going green: innovations in recycling asphalt. In: AAPA editor. AAPA
pavements industry conference. Queensland, Australia: Australian Asphalt Pavement Association.
Roberts, F., Khandal, P., Brown, E., Lee, D., Kennedy, T., 1991. Hot Mix Asphalt Materials, Mixture
Design and Construction. 2nd Ed., NAPA Research and Education Foundation, Lanham, MD.
United States 20706-4413.
Rodríguez-alloza, A.M., Malik, A., Lenzen, M., Gallego, J., 2015. Hybrid input - output life cycle
assessment of warm mix asphalt mixtures. J. Clean. Prod. 90, 171–182.
https://doi.org/10.1016/j.jclepro.2014.11.035
Rubío, M. del C., Moreno, F., Martínez-Echevarría, J., Martínez, G., Vázquez, J.M., 2013. Comparative
analysis of emissions from the manufacture and use of hot and half-warm mix asphalt. J. Clean.
Prod. 41, 1–6. https://doi.org/10.1016/j.jclepro.2012.09.036
Ruíz, A., 2001. Dosificación de mezclas bituminosas. Jornada sobre caracterización y control de calidad
de mezclas bituminosas.
Sangiorgi, C., Tataranni, P., Simone, A., Vignali, V., Lantieri, C., Dondi, G., 2017. A laboratory and filed
evaluation of Cold Recycled Mixture for base layer entirely made with Reclaimed Asphalt
Pavement. Constr. Build. Mater. 138, 232–239. https://doi.org/10.1016/j.conbuildmat.2017.02.004
Sargious, M., Mushule, N., 1991. Behaviour of recycled asphalt pavements at low temperatures. Can. J.
Civ. Eng. 18, 428–435. https://doi.org/https://doi.org/10.1139/l91-053
Schlangen, E., Vliet, D. Van, 2011. Induction heating of mastic containing conductive fibers and fillers.
Mater. Struct. 44, 499–508. https://doi.org/10.1617/s11527-010-9644-2
Schleussner, C.-F., Rogelj, J., Schaeffer, M., Lissner, T., Licker, R., Fischer, E.M., Knutti, R.,
Levermann, A., Frieler, K., Hare, W., 2016. Science and policy characteristics of the Paris
Agreement temperature goal. Sci. policy Charact. Paris Agreem. Temp. goal 6, 827–835.
Sengoz, B., Agar, E., 2007. Effect of asphalt film thickness on the moisture sensitivity characteristics of
hot-mix asphalt. Build. Environ. 42, 3621–3628. https://doi.org/10.1016/j.buildenv.2006.10.006
Shah, A., McDaniel, R., Huber, G., Gallivan, V., 2007. Investigation of Properties of Plant-Produced
Reclaimed Asphalt Pavement Mixtures. Transp. Res. Rec. J. Transp. Res. Board 1998, 103–111.
https://doi.org/10.3141/1998-13
Shao, H., Sun, L., Liu, L., You, Z., Yang, X., 2017. A novel double-drum mixing technique for plant hot
mix asphalt recycling with high reclaimed asphalt pavement content and rejuvenator. Constr. Build.
Page 153
Chapter 8. References
135
Mater. 134, 236–244. https://doi.org/10.1016/j.conbuildmat.2016.12.077
Shirodkar, P., Mehta, Y., Nolan, A., Sonpal, K., Norton, A., Tomlinson, C., Dubois, E., Sullivan, P.,
Sauber, R., 2011. A study to determine the degree of partial blending of reclaimed asphalt
pavement (RAP) binder for high RAP hot mix asphalt. Constr. Build. Mater. 25, 150–155.
https://doi.org/10.1016/j.conbuildmat.2010.06.045
Shu, Xiang, Huang, B., Vukosavljevic, D., 2008. Laboratory evaluation of fatigue characteristics of
recycled asphalt mixture. Constr. Build. Mater. 22, 1323–1330.
https://doi.org/10.1016/j.conbuildmat.2007.04.019
Shuler, T., 1976. The effects of bottom ash upon bituminous sand mixtures. Joint Highway Research
Project. Purdue University and Indiana State Highway Commission.
Silva Hugo M R D, Oliveira JRM, Jesus CMG, 2012. Are totally recycled hot mix asphalts a sustainable
alternative for road paving? Resour. Conserv. Recycl. 60, 38–48.
https://doi.org/10.1016/j.resconrec.2011.11.013
Skaf, M., Manso, J.M., Aragón, Á., Fuente-alonso, J.A., 2017. EAF slag in asphalt mixes : A brief review
of its possible re-use. "Resources, Conserv. Recycl. 120, 176–185.
https://doi.org/10.1016/j.resconrec.2016.12.009
Sorlini, S., Sanzeni, A., Rondi, L., 2012. Reuse of steel slag in bituminous paving mixtures. J. Hazard.
Mater. 209–210, 84–91. https://doi.org/10.1016/j.jhazmat.2011.12.066
Spanish Ministry of Public Works, 2017. "General Technical Specifications for Maintenance and
Rehabilitation Works in Road Pavements. Circular Order - OC 40/2017 on Pavements Recycling
and Bituminous Pavements.
Spanish Ministry of Public Works, 2015. General Technical Specifications for Roads and Bridges in
Spain. Art. 542 of PG-3. Liteam edition. Madrid.
Spanish Ministry of Public Works, 2001. General Technical Specifications for Maintenance and
Rehabilitation Works in Road Pavements. Art. 20 of PG-4 (OC 8/01): In-situ recycling of asphalt
mixtures with bitumen emulsion.
Stock, a., Ibberson, C., Taylor, I., 1996. Skidding Characteristics of Pavement Surfaces Incorporating
Steel Slag Aggregates. Transp. Res. Rec. 1545, 35–40. https://doi.org/10.3141/1545-05
Su, J.F., Schlangen, E., 2012. Synthesis and physicochemical properties of high compact microcapsules
containing rejuvenator applied in asphalt. Chem. Eng. J. 198–199, 289–300.
https://doi.org/10.1016/j.cej.2012.05.094
Swaroopa, S., Sravani, A., Jain, P.K., 2015. Comparison of mechanistic characteristics of cold, mild
warm and half warm mixes for bituminous road construction. Indian J. Eng. Mater. Sci. 22, 85–92.
Swaroopa S, Sravani A, Jain PK, 2015. Comparison of mechanistic characteristics of cold , mild warm
and half warm mixes for bituminous road construction. Indian J. Eng. Mater. Sci. 22, 85–92.
Tabakovic, A., Gibney, A., Mcnally, C., Gilchrist, M.D., 2010. Influence of Recycled Asphalt Pavement
on Fatigue Performance of Asphalt Concrete Base Courses. J. Mater. Civ. Eng. 22, 643–650.
Page 154
Chapter 8. References
136
Tabakovic, A., Schlangen, E., 2015. Self-Healing Technology for Asphalt Pavements. Springer Int. 34,
253–261. https://doi.org/10.1007/12
Tarefder, R.A., Ahmad, M., 2016. Effect of compaction procedure on air void structure of asphalt
concrete. Measurement 90, 151–157. https://doi.org/10.1016/j.measurement.2016.04.054
Tayfur, S., Ozen, H., Aksoy, A., 2007. Investigation of rutting performance of asphalt mixtures
containing polymer modifiers. Constr. Build. Mater. 21, 328–337.
https://doi.org/10.1016/j.conbuildmat.2005.08.014
Terrel, R., Joseph, P., Fritchen, D., 1992. Five year experience on low temperature performanceof
recycled hot mix. Transp. Res. Board 2, 56–65.
Topal, A., Oner, J., Sengoz, B., Dokandari, P.A., Kaya, D., 2017. Evaluation of Rutting Performance of
Warm Mix Asphalt. Int. J. Civ. Eng. 15, 705–714. https://doi.org/10.1007/s40999-017-0188-5
Tunnicliff, D.G., Root, R.E., 1984. Use of antistripping additives in asphaltic concrete mixtures: field
evaluation. NCHRP 274. Washington, DC. Transp. Res. Rec. 58.
Ulloa, A., Hajj, E.Y., Sebaaly, P.E., 2013. Mechanistic-Based Approach to Evaluate Rutting
Susceptibility of Hot-Mix Asphalt Mixtures by Use of Dynamic Triaxial Testing. Transp. Res. Rec.
J. Transp. Res. Board 2373, 121–133. https://doi.org/10.3141/2373-13
Ulmgren, M., 1996. Functional testing of asphalt mixes for permanent deformation by dynamic creep test;
modification of method and round robin test. Euroasphalt and Eurobitume Congress CD-ROM.
European Asphalt Pavement Association (EAPA). Transp. Res. Board 11.
UN Document, 1987. Our Common Future. Report of the World Commission on Environment and
Development. Chapter 2: Towards Sustainable Development.
United Nations, 1992. Kyoto Protocol to the United Nations Framework Convention on Climate Change.
Vaiana R, Capiluppi GF, Gallelli V, Iuele T, Minani V, 2012. Pavement Surface Performances Evolution:
an Experimental Application. Procedia - Soc. Behav. Sci. 53, 1149–1160.
https://doi.org/10.1016/j.sbspro.2012.09.964
Vaitkus, A., Cygas, D., Laurinavicius, A., Perveneckas, Z., 2009. Analysis and Evaluation of Possibilities
for The Use of Warm Mix Asphalt in Lithuania. Balt. J. Road Bridg. Eng. 4, 80–86.
Valdés, G., Pérez-Jiménez, F., Miró, R., Martínez, A., Botella, R., 2011. Experimental study of recycled
asphalt mixtures with high percentages of reclaimed asphalt pavement (RAP). Constr. Build. Mater.
25, 1289–1297. https://doi.org/10.1016/j.conbuildmat.2010.09.016
Ventura A, Moneron P, Jullien A, Tamagny P, Olard F, Zavan D, 2009. Environmental Comparison at
industrial scale of Hot and Half-Warm mix asphalt manufacturing process., in: Transportation
Research Board 88th Annual Meeting. Washington, D.C., p. 12.
Wagoner, M.P., Buttlar, W.G., Paulino, G.., Blankenship, P., 2005. Investigation of the Fracture
Resistance of Hot-Mix Asphalt Concrete using a Disk-Shaped Compact Tension Test. Transp. Res.
Rec. 1929, 183–192.
Wang, H., Liu, X., Apostolidis, P., Scarpas, T., 2018a. Review of warm mix rubberized asphalt concrete :
Page 155
Chapter 8. References
137
Towards a sustainable paving technology. J. Clean. Prod. 177, 302–314.
https://doi.org/10.1016/j.jclepro.2017.12.245
Wang, H., Yang, J., Lu, G., Liu, X., 2018b. Accelerated Healing in Asphalt Concrete via Laboratory
Microwave Heating. J. Test. Eval. 19. https://doi.org/10.1520/JTE20170621
Wang, Z., Wang, H., An, D., Ai, T., Zhao, P., 2016. Laboratory investigation on deicing characteristics of
asphalt mixtures using magnetite aggregate as microwave-absorbing materials. Constr. Build.
Mater. 124, 589–597. https://doi.org/10.1016/j.conbuildmat.2016.07.137
West, R., Willis, J., Marasteanu, M., 2013. Improved Mix Design, Evaluation, and Materials Management
Practices for Hot Mix Asphalt with High Reclaimed Asphalt Pavement Content. NCHRP Report
752. https://doi.org/https://doi.org/10.17226/22554.
West R, Timm D, Willis J, Powell R, Tran N, D, W., Sakhaeifar M, Robbins M, Brown R, Vargas-
Nordcbeck A, Villacorta F, 2012. Phase IV NCAT pavement test track findings: Draft report.
Auburn, AL: National Center for Asphalt Technology. Report number NCAT 12-10.
Whiteoak, D., Read, J., 2003. The Shell Bitumen Handbook. Fifth edition. London : Thomas Telford
Publishing.
Willis, J.R., Turner, P., Julian, G., Taylor, A.J., Tran, N., Padula, F. de G., 2012. Effects of Changing
Virgin Binder Grade and Content on RAP Mixture Properties. National Center for Asphalt
Technology.
Wu, S., Li, X., 2017. Evaluation of effect of curing time on mixture performance of Advera warm mix
asphalt. Constr. Build. Mater. 145, 62–67. https://doi.org/10.1016/j.conbuildmat.2017.03.240
Xie, J., Wu, S., Pang, L., Lin, J., Zhu, Z., 2012. Influence of surface treated fly ash with coupling agent
on asphalt mixture moisture damage. Constr. Build. Mater. 30, 340–346.
https://doi.org/10.1016/j.conbuildmat.2011.11.022
Xinjun Li, Clyne, T.R., Marasteanu, M.O., 2004. Recycyled asphalt pavement (RAP) effects on binder
and mixture quality.
Yan, J., Ni, F., Yang, M., Li, J., 2010. An experimental study on fatigue properties of emulsion and foam
cold recycled mixes. Constr. Build. Mater. 24, 2151–2156.
https://doi.org/10.1016/j.conbuildmat.2010.04.044
Yang, X., You, Z., Dai, Q., Mills-beale, J., 2014. Mechanical performance of asphalt mixtures modified
by bio-oils derived from waste wood resources. Constr. Build. Mater. 51, 424–431.
https://doi.org/10.1016/j.conbuildmat.2013.11.017
Zaumanis, M., 2010. Warm mix asphalt investigation. Master of Science Thesis. Riga Technical
University.
Zaumanis, M., Mallick, R.B., Frank, R., 2016. 100 % hot mix asphalt recycling: challenges and benefits,
in: Transportation Research Procedia. Elsevier B.V., pp. 3493–3502.
https://doi.org/10.1016/j.trpro.2016.05.315
Zaumanis, M., Mallick, R.B., Frank, R., 2014. 100% recycled hot mix asphalt: A review and analysis.
Page 156
Chapter 8. References
138
Resour. Conserv. Recycl. 92, 230–245. https://doi.org/10.1016/j.resconrec.2014.07.007
Zaumanis M, Haritonovs V, 2015. Long term monitoring of full scale pavement test section with eight
different asphalt wearing courses. Mater. Struct. https://doi.org/10.1617/s11527-015-0614-6
Zhao, S., Huang, B., Shu, X., Woods, M., 2013. Comparative evaluation of warm mix asphalt containing
high percentages of reclaimed asphalt pavement. Constr. Build. Mater. 44, 92–100.
https://doi.org/10.1016/j.conbuildmat.2013.03.010
Zhao, W., Xiao, F., Amirkhanian, S.N., Putman, B.J., 2012. Characterization of rutting performance of
warm additive modified asphalt mixtures. Constr. Build. Mater. 31, 265–272.
https://doi.org/10.1016/j.conbuildmat.2011.12.101
Zhu, J.Q., Wu, S.P., Zhong, J.J., Wang, D.M., 2012. Effect of Substitution of Recycled Aggregate by
Natural Aggregate on Related Properties of Blended Aggregate and Asphalt Mixture. Key Eng.
Mater. 509, 128–135. https://doi.org/10.4028/www.scientific.net/kem.509.128