Upward Mobility and Discrimination: The Case of Asian Americans Nathaniel G. Hilger ⇤ Brown University and NBER March 2017 Asian Americans are the only non-white US racial group to experience long-term, institutional discrimination and subsequently exhibit high income. I re-examine this puzzle in California, where most Asians settled historically. Asians achieved extraordinary upward mobility relative to blacks and whites for every cohort born in California since 1920. This mobility stemmed pri- marily from gains in earnings conditional on education, rather than unusual educational mobility. Historical test score and prejudice data suggest low ini- tial earnings for Asians, unlike blacks, reflected prejudice rather than skills. Post-war declines in discrimination interacting with previously uncompen- sated skills can account for Asians’ extraordinary upward mobility. JEL: J62, J15, J7, J31 ⇤ I thank Anna Aizer, Sam Asher, Nathaniel Baum-Snow, Patrick Bayer, Leah Boustan, Kenneth Chay, Pedro Dal Bo, Eleanore Dillon, Price Fishback, Andrew Foster, Oded Galor, Claudia Goldin, Price Fishback, Rachel Friedberg, Matthew Gentzkow, Justine Hastings, Brian Knight, Bao Lam, John Lo- gan, Glenn Loury, Robert Margo, Bhashkar Mazumder, Joana Naritomi, Emily Oster, Jesse Shapiro, Isaac Sorkin, Matthew Turner, John Wallis, David Weil and Danny Yagan, as well as seminar par- ticipants at Brown, Duke, Connecticut, Wesleyan, Harvard, Stanford, University of Maryland, the “Exposure, Heritability and Opportunity” workshop at Universidad Carlos III de Madrid, and Devel- opment of the American Economy session at the NBER Summer Institute in 2016. Jenna Anders, Kian Ivey, and Jorge Perez provided excellent research assistance. Weiwei Zhang provided helpful assistance with the 100% 1940 data. Financial support from the Russell Sage Foundation (Grant No. 83-16-07) is gratefully acknowledged. All errors are my own. 1
Transcript
Upward Mobility and Discrimination:
The Case of Asian Americans
Nathaniel G. Hilger⇤
Brown University and NBER
March 2017
Asian Americans are the only non-white US racial group to experiencelong-term, institutional discrimination and subsequently exhibit high income.I re-examine this puzzle in California, where most Asians settled historically.Asians achieved extraordinary upward mobility relative to blacks and whitesfor every cohort born in California since 1920. This mobility stemmed pri-marily from gains in earnings conditional on education, rather than unusualeducational mobility. Historical test score and prejudice data suggest low ini-tial earnings for Asians, unlike blacks, reflected prejudice rather than skills.Post-war declines in discrimination interacting with previously uncompen-sated skills can account for Asians’ extraordinary upward mobility.
JEL: J62, J15, J7, J31
⇤I thank Anna Aizer, Sam Asher, Nathaniel Baum-Snow, Patrick Bayer, Leah Boustan, Kenneth Chay,Pedro Dal Bo, Eleanore Dillon, Price Fishback, Andrew Foster, Oded Galor, Claudia Goldin, PriceFishback, Rachel Friedberg, Matthew Gentzkow, Justine Hastings, Brian Knight, Bao Lam, John Lo-gan, Glenn Loury, Robert Margo, Bhashkar Mazumder, Joana Naritomi, Emily Oster, Jesse Shapiro,Isaac Sorkin, Matthew Turner, John Wallis, David Weil and Danny Yagan, as well as seminar par-ticipants at Brown, Duke, Connecticut, Wesleyan, Harvard, Stanford, University of Maryland, the“Exposure, Heritability and Opportunity” workshop at Universidad Carlos III de Madrid, and Devel-opment of the American Economy session at the NBER Summer Institute in 2016. Jenna Anders,Kian Ivey, and Jorge Perez provided excellent research assistance. Weiwei Zhang provided helpfulassistance with the 100% 1940 data. Financial support from the Russell Sage Foundation (Grant No.83-16-07) is gratefully acknowledged. All errors are my own.
1
Few white Americans today realize just how pervasive legal anti-Asian dis-crimination was before 1945.. . . In light of this history, the current problemsof the Asian-American community seem relatively minor, and its success ap-pears even more remarkable. Social scientists wonder just how this successwas possible, and how Asian-Americans have managed to avoid the ’second-class citizenship’ that has trapped so many blacks and Hispanics.
David Bell, The New Republic, July 15, 1985
1. Introduction
Asian American (“Asian”) history represents a puzzling case study because Asians are a“non-white” American racial group that experienced long-term, institutional discrimina-tion, yet still achieved mean income levels similar to whites by the late 1960s.1 In thispaper I re-examine and provide a new explanation for this puzzle. Conventional wisdomoften ascribes Asian success to extraordinary investments in children’s educational at-tainment.2 However, I show that Asian earnings growth stemmed primarily from gainsconditional on education. I then document evidence that extraordinary post-war growth
1Asians are plausibly unique in this respect. Many other “white” immigrant groups such as IrishAmericans, Italian Americans and Jewish Americans encountered prejudice historically and exhibithigh incomes in the modern period. However, historians overwhelmingly agree that these groups didnot experience the qualitative degree of institutional discrimination reserved for “non-white” groupsincluding blacks, Native Americans, Asians and Hispanics, and described below in Section 3 andTable (II) in more detail (Jensen, 2002; Kenny, 2006; Diner, 2006; Mangione, 1993; Chang, 2004;Page, 2004; Gonzalez, 2011). For example, Kenny (2006) states “The Irish experience of race in theUnited States does not belong in the same category as black slavery or Asian exclusion,” while Diner(2006) states “As women and men considered among the privileged by virtue of their whiteness,[Jews] enjoyed relative tolerance,” and that they experienced “relatively full political and civil rights”from the end of the 18th century. While Hispanic Americans have faced substantial institutionaldiscrimination (e.g. Gonzalez, 2011), I do not focus on them in this paper for several reasons. First,I do not observe Hispanic Americans directly in my test score data described below. Second, IPUMSidentifies Hispanic Americans in relatively complex ways related to nationality, language, and namesthat may be endogenous to some of the outcomes I study.
2The belief that minorities get ahead by investing in more education, rather than obtaining greater payconditional on education, is widespread. Kristof (2015) focuses on high educational attainment ofAsian children, which he partially attributes to “East Asia’s long Confucian emphasis on education.”President John F. Kennedy implicitly adopted this theory of group progress in 1963 when he told anassembly of black civil rights leaders, “it seems to me...that we could emphasize. . . which I think theJewish community has done, on educating their children, on making them study, making them stayin school and all the rest” (Branch, 1989).
1
in Asian conditional earnings plausibly reflected high Asian skills that remained uncom-pensated in pre-war labor markets characterized by greater institutional discrimination.I argue that Asian history therefore sheds new light on the longstanding question ofwhether large earnings gaps driven primarily by prejudice can persist in sufficiently openand competitive labor markets (Becker, 1957; Arrow, 1972; Goldberg, 1982).
I build this argument in multiple steps that make use of several recently-available ornew data sources. These sources include 100% 1940 census data (Minnesota PopulationCenter and Ancestry.com, 2013), Army General Classification Test (AGCT) score data forover 500,000 WWII enlistees in 1943 (Ferrie et al., 2012; Aaronson and Mazumder, 2011;Carruthers and Wanamaker, 2016), and a matched sample of test score and earnings datafor over 200,000 individuals.3 Other new and novel data sources include 20th Centurysurvey data recording white prejudice against various racial and ethnic groups, archivaldata on racial composition and inputs of schools in Los Angeles and San Francisco before1945, and new data on racial composition of firms in the Bay Area. These data, alongwith new methods to estimate intergenerational mobility of small groups in census data(Hilger, 2016), allow me to focus the analysis on California (CA). CA contained a largemajority of all mainland Asians in 1940, and also fortuitously contained a small blackminority that had migrated from the South in pursuit of economic opportunity andfurnishes a valuable comparison group.
As background, I establish that Asians faced similar or plausibly worse prejudice anddiscrimination than local blacks in CA through the 1940s. I then show how vastlydifferent historical legacies imported to CA by these two groups—skill-biased immigrationrestrictions for Asians vs. multigenerational educational exclusion for Southern blacks—would tend to predict relatively higher skill levels for Asians, especially among thoseselecting into parenthood. Finally, I show that legal discrimination against all non-whites in CA dramatically declined from 1943-59 due to a combination of court casesand legislation, culminating in CA’s Fair Employment Practices Act. After establishingthis context, I address three main questions about the economic rise of Asians in CA.
Question 1: Does high Asian income reflect high dynastic income growth,
or compositional effects of new immigration? To my knowledge even this basicquestion about Asian American history has not been addressed in prior literature. Using apseudo-panel approach that I validate empirically, I develop measures of intergenerationalincome growth rates within racial groups that abstract from composition changes due toimmigration flows. I find that Asian dynasties exhibit upward “divergence” from blacks
3I thank Bhashkar Mazumder for generously sharing his cleaned version of the WWII enlistee test scoredata.
2
and upward “reversals of fortune” toward whites in every cohort born in CA since 1920.4
These extraordinary growth rates are inconsistent with neoclassical absolute convergence(Ramsey, 1928; Solow, 1956), suggesting that Asians embody different structural growthparameters, or a growth process that departs from neoclassical assumptions.
Question 2: Why did Asians achieve more rapid dynastic income growth
than other groups? To shed light on this question I estimate a simple descriptivedecomposition of group earnings in each year into three terms: (1) parental income dis-tributions, (2) children’s educational attainment conditional on parental income, and(3) children’s earnings conditional on education. I find that all three components favorAsians over blacks historically, although these differences shrink dramatically when re-stricting to the CA-born in earlier years. I quantify the relative importance of these threecomponents by imputing counterfactual, steady-state black-white earnings gaps for allchildren born in CA 1920-1980, assigning blacks each of the three components of Asianand white earnings separately. Contrary to popular perception, large gains in earningsconditional on education have played the primary role in Asian earnings growth, along-side a secondary role for greater educational attainment conditional on parental income,and virtually no role for higher parental income. In CA, the only white advantage overblacks has been greater white earnings conditional on education; educational mobilityand parental income have played virtually no role.
Question 3: Why were Asians but not blacks able to close their conditional
earnings gap? To shed light on this question, I examine determinants of conditionalearnings gaps in 1940 by comparing AGCT test scores in 1943 for whites, blacks andAsians in CA. Consistent with their different historical legacies, I find that Asians in1943 already exhibit near-parity with whites in mean test scores both overall and withinall education groups, while analogous black mean test scores lag behind both Asians andwhites by nearly a full standard deviation, as has been found in more recent decades(Neal and Johnson, 1996; Johnson and Neal, 1998; Dickens and Flynn, 2006; Neal, 2006;Fryer, 2010).5 Asians’ large earnings gaps in the absence of any observed human capitalgap is, to my knowledge, unique among non-white racial groups in US history (e.g.Trejo, 1997; Hurst, 1997). I quantify the contribution of these test score gaps to blackconditional earnings gaps by matching white and black test score records to the 100%
4This upward mobility holds even when restricting to native-born parents of CA-born children, andtherefore is unlikely to reflect weaker English fluency in the parent generation. I place no restrictionson where CA-born children live later in life.
5WWII examination data only contain Chinese Americans in CA due to internment of Japanese Ameri-cans by 1943, but I discuss other historical research below that documents high test scores of JapaneseAmerican children before WWII (Bell, 1935).
3
1940 census data containing earnings and education, both at the individual level and atthe “labor market” level defined by states and educational attainment. At the individuallevel, skills as captured by test scores account for 40% of black-white earnings gapsnationally, or slightly less than the share of black-white earnings gaps explained by AFQTscores in the 1990s by Johnson and Neal (1998). At the market level, however, black-white mean skill gaps account for nearly 80% of black-white mean earning gaps. Thesemarket-level effects of mean group skills are large enough to explain relative conditionalearnings gains experienced by Asians 1940-70 in CA—and hence Asian upward mobility—under the assumption that the Asian test score advantage over other non-whites wasuncompensated in 1940 and fully compensated by 1970.
As of the 1940, these findings suggest a relatively larger role for taste-based discrim-ination or misperception of skills in the Asian conditional earnings gap (Becker, 1957),and a relatively larger role for discrimination based on skills via pay for productivityor statistical discrimination in the black earnings gap (Aigner and Cain, 1977). Oneexplanation for rapid Asian upward mobility is, therefore, that earnings gaps driven byprejudice rather than productivity could not persist in a post-war labor market thateliminated most forms of legal discrimination against non-white workers. Another expla-nation is that de facto discrimination declined more rapidly for Asians than blacks in CAfor reasons unrelated to Asians’ initial skill advantage, though I argue this explanationis hard to reconcile with the large magnitude of Asians’ post-war relative earnings gains.And of course, without quasi-experimental variation in group characteristics such as hu-man capital, or precise measures of changing contemporary environments across groups,I cannot rule out other plausible explanations. Whatever the underlying cause, Asianhistory represents a case study in which a large pre-war racial earnings gap almost surelydriven by prejudice failed to survive in the absence of harsh legal discrimination.
2. Prior Literature
This study fits into large prior literatures on human capital, discrimination, and groupearnings gaps in a clear way. Broadly, Asians are consistent with prior work documentingintergenerationally persistent group human capital gaps, but sharply at odds with priorwork documenting intergenerationally persistent group earnings gaps. One possible rea-son for this discrepancy is that Asians are the only non-white group with historically highlevels of human capital. This large and persistent human capital stock may have gen-erated anomalous upward earnings mobility once pervasive labor market discriminationagainst Asians declined in the decades following WWII.
4
Borjas (1992, 1993, 1994, 1995); Leon (2005); Abramitzky et al. (2014) explore inter-generational convergence in education and earnings among ethnic groups, but due to dataconstraints these studies place most empirical emphasis on “white” European immigrantswho were spared most forms of institutional discrimination; do not incorporate testscores; and do not assure geographic overlap across groups within the US. These studiesfind strong persistence of initial group earnings gaps across generations.6 In contrastwith the intergenerational earnings persistence displayed by these predominantly whiteethnic groups, I find that Asians’ large initial earnings disadvantage does not persist, butrather disappears or reverses in one generation in every cohort of Asians born in CA since1920. I argue that the severe discrimination faced by Asians before WWII, combinedwith their high initial human capital, can account for this contrast with slower earningsconvergence for white ethnic groups.
Another literature documents a major role for human capital in explaining racial wageand earnings gaps. Higgs (1977) presents evidence that skills play a significant role inblack-white wage gaps in Virginia in 1900 and 1909. Carruthers and Wanamaker (2016)also find that skills explain a large share of black-white wage and earnings gaps in theSouth in 1940. Cutright (1973), in contrast with these other studies finds that test scoresaccount for only 25% of black-white wage gaps in 1964 using a national sample of KoreanWar enlistees.7 Research on labor markets since 1990 typically finds that individualtest scores can account for 50-75% of black-white wage and earnings gaps (Neal andJohnson, 1996; Johnson and Neal, 1998; Neal, 2006; Fryer, 2010). Other work on datasince the 1980s finds that observable measures of human capital can largely account forlow earnings of Mexican Americans (Trejo, 1997) and Native Americans (Hurst, 1997).Asians large, unexplained earnings gap in 1940 therefore represents a historical anomalyand suggests that Asians were in a more advantageous position than other non-whiteminorities to increase earnings as labor market barriers in CA declined after WWII.
Prior research on Asian Americans specifically has suggested many qualitative expla-nations for high Asian incomes in the modern period including selective migration, intra-group spillovers, positive stereotypes, demographic imbalance, portability of human cap-ital, and culture, among others (e.g., see arguments and literature reviews in Hirschmanand Wong, 1986; Sue and Okazaki, 2009; Lee and Zhou, 2015). Suzuki (1995, 2002)documents a significant role for selection into migration and return-migration among
6E.g., Borjas (1994, Table 5) estimates group-level intergenerational persistence in mean log occu-pational earnings around .6 - .7, and Abramitzky et al. (2014, Figure 6) also suggest very strongpersistence for white ethnic groups.
7Korean War enlistees, like WWII enlistees, may represent a disproportionately positively selectedgroup of blacks for reasons discussed in Section 4.
5
Japanese Americans in accounting for high and rising Japanese American earnings. Mu-rayama (1984) documents rapid occupational progress by Japanese Americans withinPacific Northwest railroad corporations in the early 20th century, despite significant prej-udice of white employers and coworkers. Consistent with many of these prior strands ofresearch on Asian history, I document high Asian skills in prewar CA labor markets andshow that the onset of compensation for these high skills after WWII can fully accountfor Asians’ high upward intergenerational mobility.
Chiswick (1983) documents advantageous labor market outcomes among Asian Amer-ican men in the 1970 census, but does not provide the longer-term context of pre-wardiscrimination, institutional reform, and high upward mobility described here. Chiswick(1988) finds that Mincerian returns to schooling are positively correlated with averageschooling across various racial and ethnic groups in the 1970 census and attributes this tounobserved differences in the relative prices of child quality and quantity facing differentgroups. In contrast, when focusing on CA I find a much larger role for conditional paylevels in explaining group income mobility, and less evidence for important differences ingroup fertility rates or Mincerian returns to schooling.
Duleep and Sanders (2012) document that Asians exhibit a substantial unexplainedearnings gap in 1960 that largely vanishes by 1980, and suggest that this change likelyrelates to Civil Rights legislation. Darity Jr. et al. (1997) study impacts of observableethnic group characteristics on occupational indices in national samples, and Cooper(2003) analyzes weekly wage residuals for Chinese, Japanese, Mexican and white malesin CA from 1950-1990.8 These and other authors (Daniels, 1990, pg 314-15) partly antic-ipate my findings that Asian conditional earnings increased over time. I show the Asianearnings gap was also not explained by cognitive test scores, and that this earnings conver-gence conditional on skills played the primary role in overall upward Asian mobility. Mylonger timeframe is consistent with a gradual trend in Asian earnings convergence from1940-80, rather than a sharp increase following major employment anti-discriminationlaws passed by California in 1959 and the US in 1964. However, I lack statistical powerto detect trend breaks within the 1940-80 window.
3. On Comparing Asian and Black Outcomes
To clarify the purpose of group comparisons undertaken below it is useful to write downa stylized statistical model. Suppose outcome vector Yrt for generation t of group r is
8Cooper (2003) is forced to drop 1940 from her analysis due to small sample size for Asians in CA inthe 1940 1% sample, and her 1950 census sample for CA contains 109 Asians.
6
determined by “contemporary environment” denoted CErt, “ancestral legacy” denotedALrt, the interaction of these two terms, and other factors urt:
Yrt = B0·CErt
+B1 ·ALrt (CEr,t�1, ...,CEr,0)
+B2 ·CErt ⇥ALrt (CEr,t�1, ...,CEr,0) + urt.
“Contemporary environment” includes factors such as types and degrees of contemporarysocial prejudice and discrimination in schooling, housing and labor markets. “Ancestrallegacy” includes intergenerationally transmitted factors such as financial and human cap-ital, location, social networks, preferences, and norms. Crucially, ancestral legacy alsoincorporates factors such as migration restrictions that generate non-random selectioninto a group’s membership. The parameter B2 reflects the idea that changes in contem-porary environments can have differential impacts on outcomes of groups with differentancestral legacies. I now characterize key aspects of ancestral legacy and contempo-rary environment for Asians and blacks in the early-mid 20th century, focusing on CAfor reasons described below. While I am unable to credibly estimate the parametersof this model, it provides a framework for thinking about comparisons of intergenera-tional mobility across groups with different ancestral legacies during periods of changein contemporary environments.9
Migration, Abduction, and SlaveryAsians and blacks in the US embody very different ancestral legacies. Asians in the US
have always represented voluntary migrants and their descendents. These migrants havearrived from China, Japan and other Asian countries in pursuit of economic opportunityas prospectors, laborers, merchants, farmers, skilled professionals and students since themid-19th Century.10 In contrast, the vast majority of blacks in the US during the 20thcentury represent descendents of slaves imported to the US before the Civil War. Theseslaves were kidnapped in many parts of Africa, shipped to the US involuntarily, and oftensubjected to catastrophic trauma including starvation, torture, rape, and psychologicalabuse (e.g., Rediker, 2008).11 Under slavery, the great majority of blacks were legally
9All tables and figures in this section reflect census data described in Section 4 unless stated otherwise.10Cloud and Galenson (1987, 1991) argue that much of the late 19th century migration from China took
place through extra-legal indentured servitude contracts, but was nonetheless voluntary in the vastmajority of cases.
11Native Americans, as well as many Hispanics living on land annexed by the US, also “entered” the USinvoluntarily under circumstances of violence and material expropriation.
7
unable to accumulate education or financial assets, yielding extremely low black literacyand wealth as of 1870 (e.g., Margo, 2016). Under Jim Crow laws, blacks throughout theUS but especially in the South continued to face segregation and limited access to humancapital and financial markets throughout much of the 20th century.
GeographyAsians and blacks also inherited different geographic legacies. Most Asians arrived on
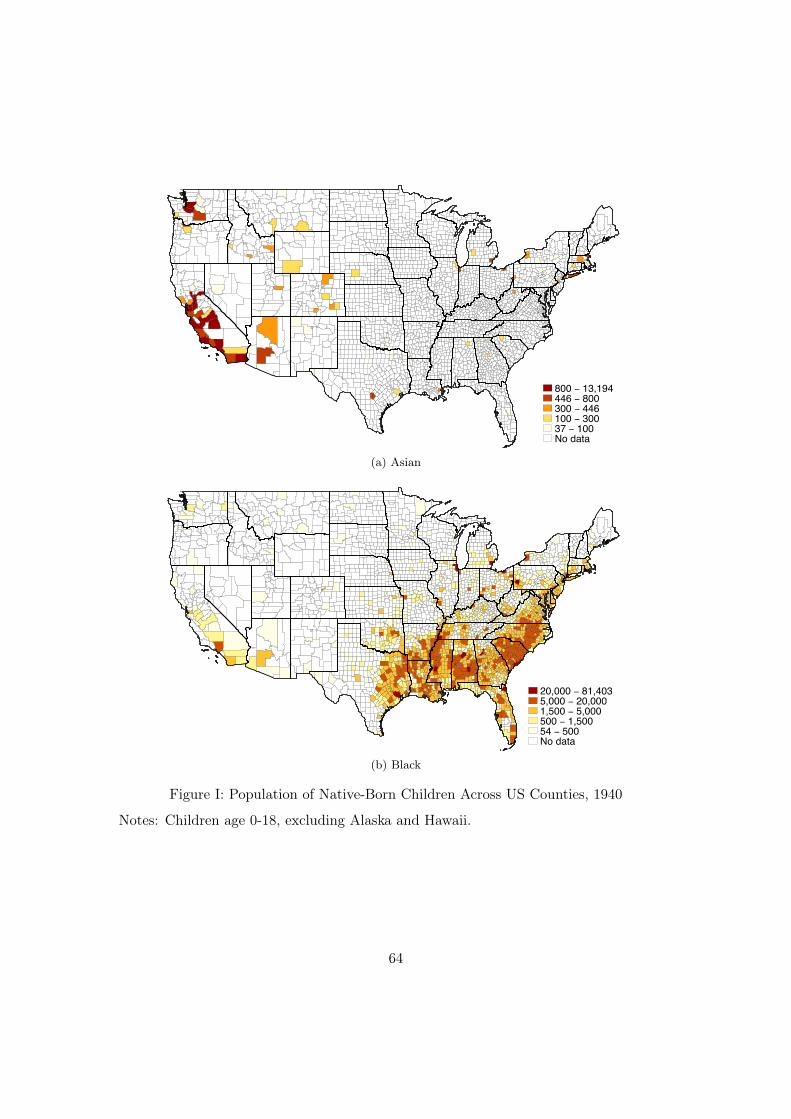
the West Coast while most blacks arrived in the South, and these geographic origins havepersisted over time. Figure I maps the number of native-born Asian and black children(age 0-18) living in every county in the mainland US in 1940. Panel (a) shows thatAsians in 1940 were heavily concentrated along the West Coast and especially in CA. In1940, CA had over seven times more native-born Asians than any other mainland state,and still had six times more native-born Asians than any other state as of 1980.12 Panel(b) shows that blacks in 1940 were still concentrated in the South and New England.However, the map highlights that a significant minority of blacks had migrated to CA by1940. CA therefore represents the only state in which it is possible to conduct detailedhistorical comparisons of Asians and blacks in a contemporary environment that waspotentially somewhat similar across groups, and I focus on children born in CA in muchof the analysis below. CA was viewed as a place of racial tolerance and opportunityrelative to the South by many early black migrants (Graaf et al., 2001), and below Ifind that restricting to the CA-born greatly increases the similarity of Asian and blackfamilies along several dimensions.13
Racial PrejudicePrejudice affects the contemporary environment faced by different demographic groups.
Despite radically different origins and settlement patterns, blacks and Asians both facedintense prejudice from the white US population in the early 20th century. This can beinferred using rich historical survey data gathered by social psychologists in the 1920sand 30s, who asked their subjects—typically white students at universities—to expresspreferences over various nationalities and races. These surveys are less likely to sufferfrom the self-censorship than similar modern surveys because they predate social norms
12Substantial pre-war Asian populations also lived in New York and Washington. I do not focus onthese states because the test score data is unreliable for Asians in New York and too small to beuseful in Washington. Asians were also concentrated in Hawaii. I do not focus on Hawaii in in thispaper because very few blacks have ever lived in Hawaii, and because Asians in Hawaii probably didnot experience the same kinds of social prejudice or institutional discrimination as mainland Asians(Takaki, 1998; Daniels, 1990).
13Black families in 1940 had migrated to CA primarily from Texas and Louisiana, and to a lesser extentArkansas, Mississippi and Alabama. A majority of blacks in CA had been born in other states until2000.
8
proscribing racial prejudice. The two primary methodologies for measuring prejudiceat this time were “social distance” scaling based on how much intimacy with particulargroups a person deemed acceptable (Bogardus, 1926), and pairwise group comparisonscaling based on distributional assumptions about preferences (Thurstone, 1927a,b).
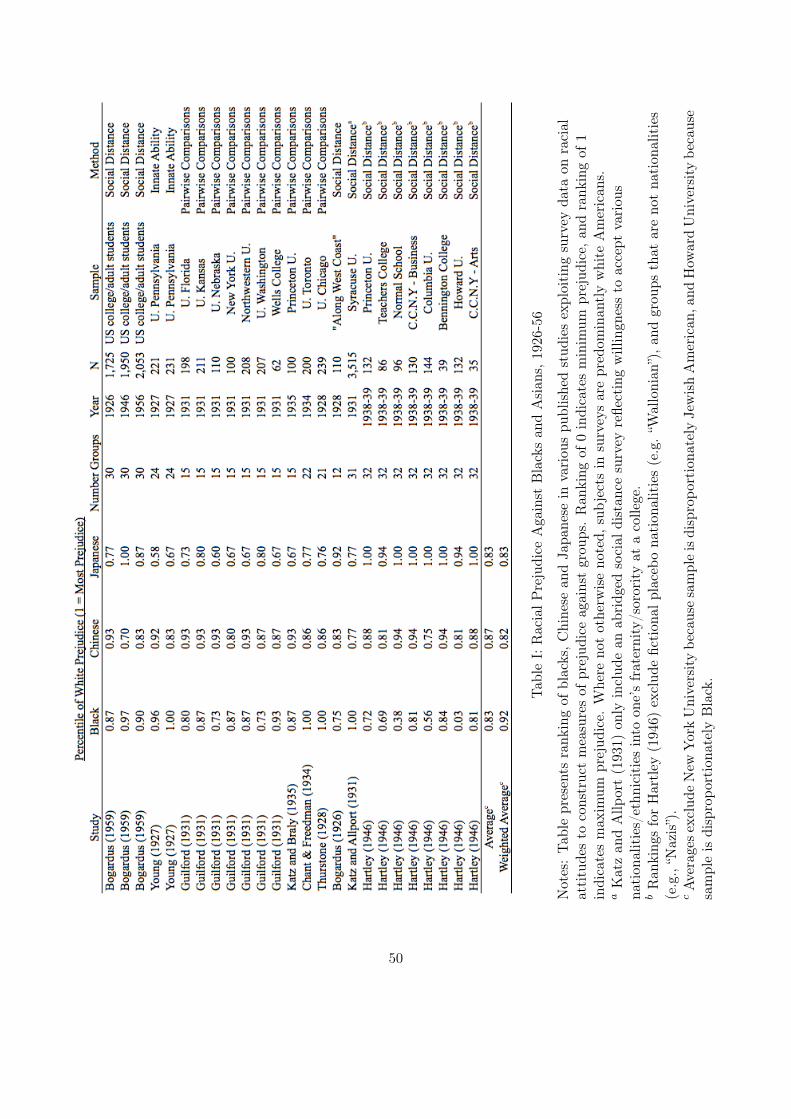
Table I presents the rank of blacks, Chinese and Japanese out of 12-32 total ethnicgroups in 23 different samples from 10 published studies spanning 1926-1956. In theUS generally, whites express profound prejudice against Chinese, Japanese and blacks,with stronger prejudice against blacks and Chinese at the national level. Prejudice inthe two West Coast samples, however, is stronger against both Chinese and Japanesethan blacks, consistent with the central role of CA in historical anti-Asian activism.Moreover, these racial preferences appear stable over the entire 1926-56 period, withtemporary deviations in 1946 associated with WWII national allegiances. These datamake it difficult to dismiss comparisons of Asians and blacks in CA by claiming thatAsians never experienced comparable degrees of white racial prejudice in the early-mid20th century.14
Other facts are also consistent with pervasive white prejudice against both Asians andblacks in pre-war CA. Asians experienced mob violence including lynchings and over 200“roundups” from 1849-1906 (Pfaelzer, 2008), and hostility from anti-Asian clubs muchlike the Ku Klux Klan (e.g., Workingmen’s Party of CA 1877-1880, Asiatic ExclusionLeague 1905 - 1940s), to an extent that does not appear to have any counterpart forblacks in pre-war CA history. Well under 5% of adult Asians or blacks of either genderliving in CA married whites in every census before 1970. In 1920, 75% of CA voters, bothmajor political parties, and the state Governor all supported a direct ballot initiative toincrease legal discrimination against Japanese farmers by closing loopholes in prior AlienLand Laws (Daniels, 1990). New archival data on employment of whites and non-whites
14By presenting ranks, I ignore the cardinal scales employed in the original studies, although thesecardinal scales plausibly contain some information about strength of preferences and reinforce theordinal scale patterns. “Social distance” studies include Bogardus (1926), Katz and Allport (1931),Katz and Braly (1935), Bogardus (1928), Hartley (1946), and Bogardus (1959). These studies askindividuals to place racial groups on a “social distance scale” containing 7 allegedly ordered categories:“would marry into group”, “would have as close friends,” “would have as next door neighbors,” “wouldwork in same office,” “have as speaking acquaintances only,” “have as visitors only to my nation,”and finally “debar from my nation.” Respones were shown to be robust to various perturbations ofthe survey instrument Bogardus (1959, pg. 92-94). Pairwise comparison studies include Thurstone(1928), Chant and Freedman (1934), and Guilford (1931). These studies ask individuals “which ofthe following two nationalities/ethnicities would you prefer to associate with?” in many pairwisecomparisons, and then construct a scale based on distributional assumptions about individuals’ un-derlying racial preferences. Young (1927) asks subjects to rank nationalities/ethnicities by “innateability”; this study also finds that prejudice does not respond to a semester-long course advancingmore modern, opportunity-based theories of racial outcome differences.
9
in a sample of 234 firms employing 350,000 workers throughout the Bay Area in 1943 and1944 indicate that over 50% of firms—including many large firms—employed zero or 1-2non-whites (including blacks, Asians, Hispanics, and Native Americans), with extremeconcentration of non-whites in a few firms.15
Institutional DiscriminationWhite voters in CA expressed their prejudice by supporting many forms of legal dis-
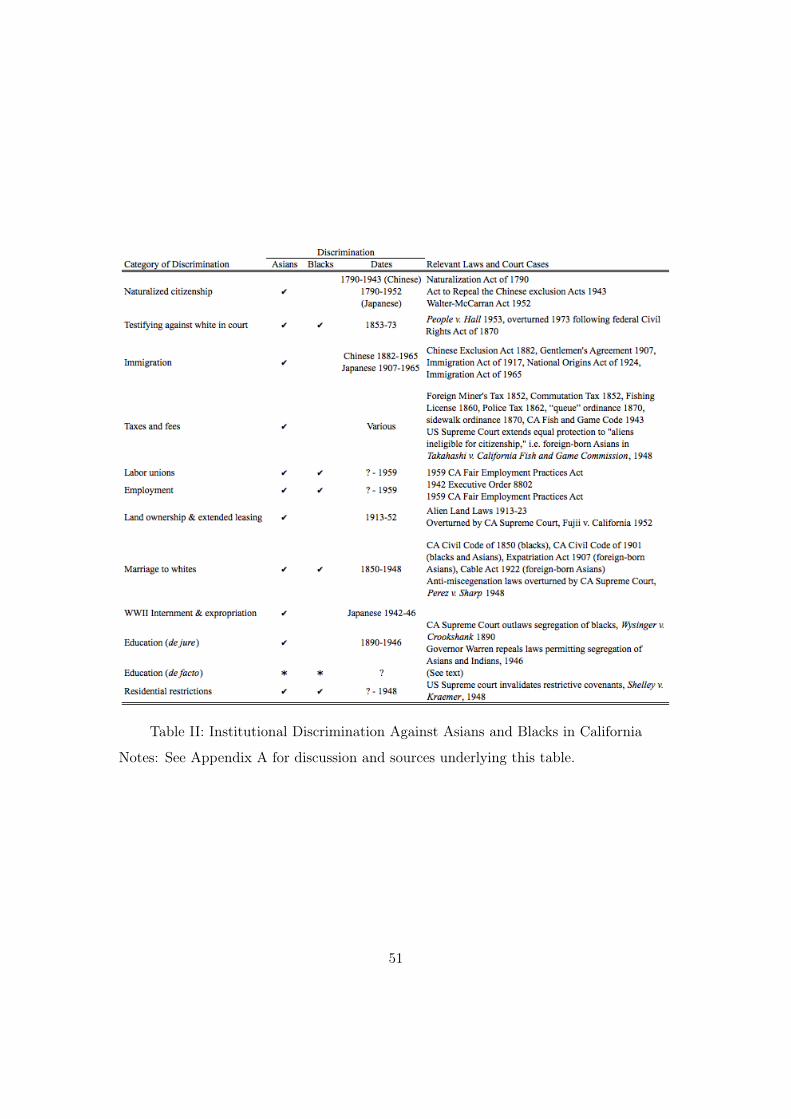
crimination against both Asians and blacks. Table II, based on a discussion in AppendixA, summarizes the broad contours of this discrimination. At various times Asians facedinstitutional discrimination in citizenship, ability to testify in court, immigration, taxesand fees, labor unions, employment, land ownership and leasing, marriage to whites,WWII internship and expropriation, education, and residential restrictions. Many butnot all of these restrictions also applied to blacks in CA. Here I discuss three key findings.First, discriminatory US immigration policy generated positive selection of Asians bothinto migration and family formation. Second, Asians likely experienced similar or worseinstitutional discrimination than blacks living in CA before the 1960s. Third, all of theharshest forms of legal (though not necessarily de facto) discrimination against racialminorities in CA disappeared during the period 1943-59.
1. Exclusionary policies selected higher-skilled Asians for migration and
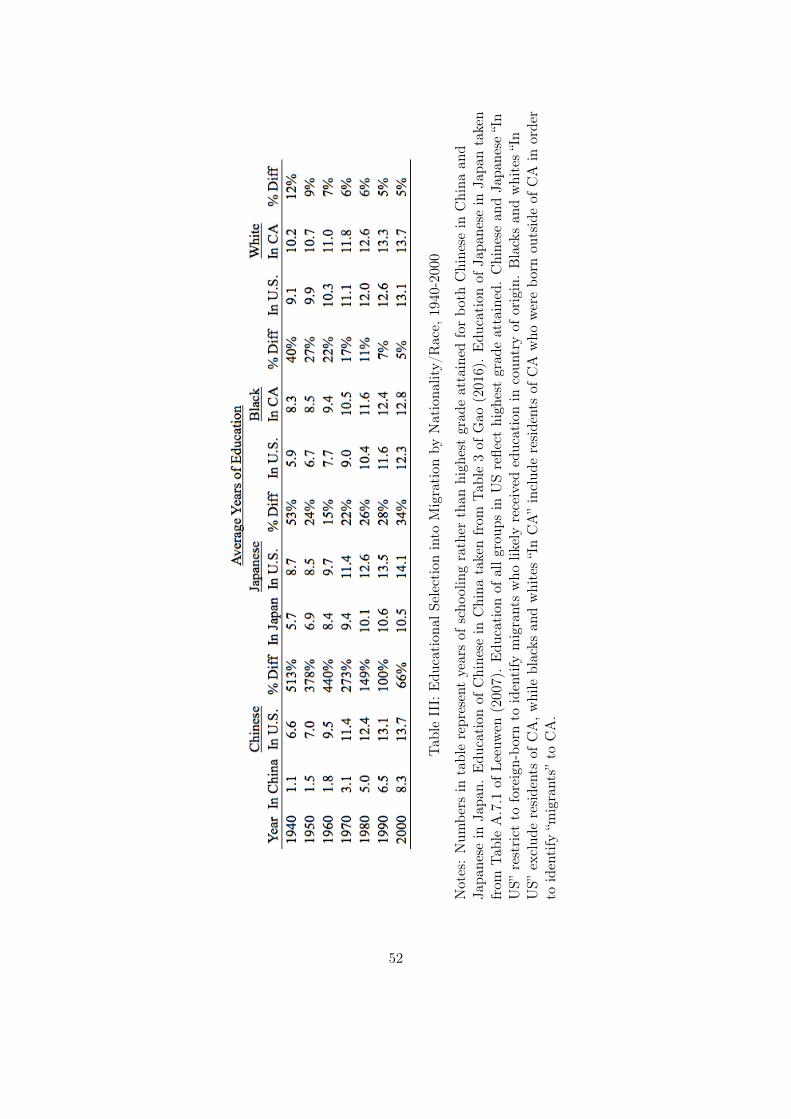
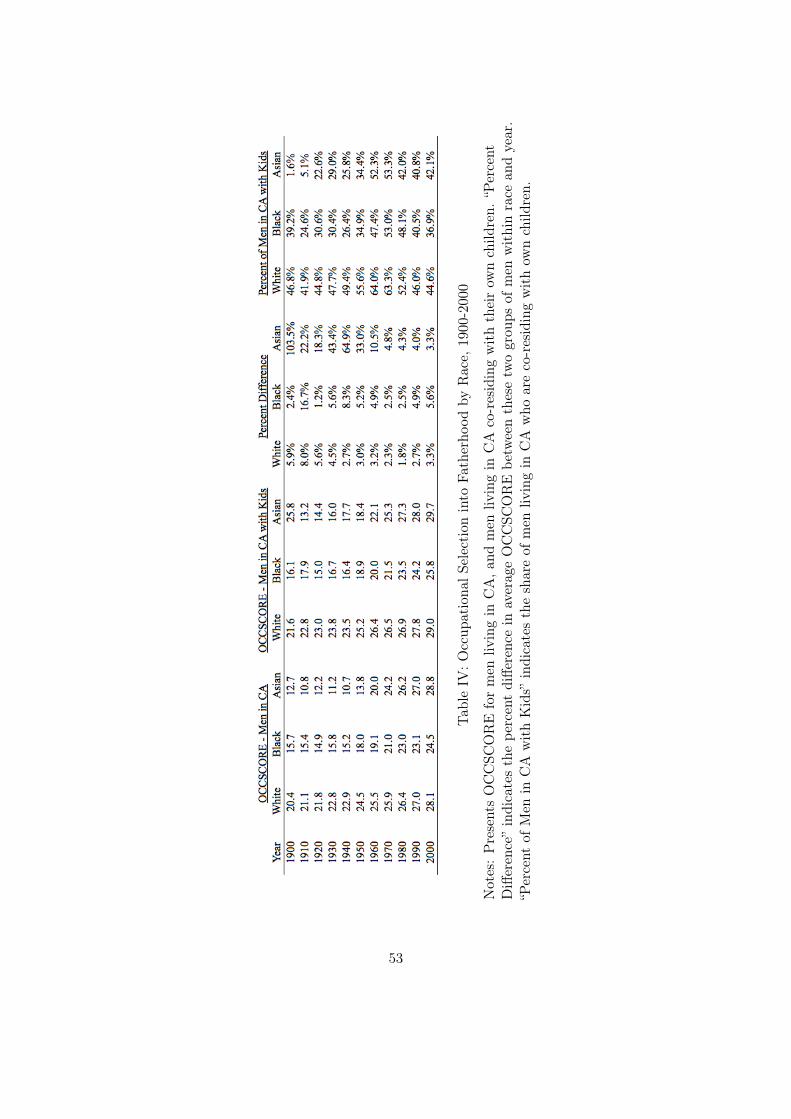
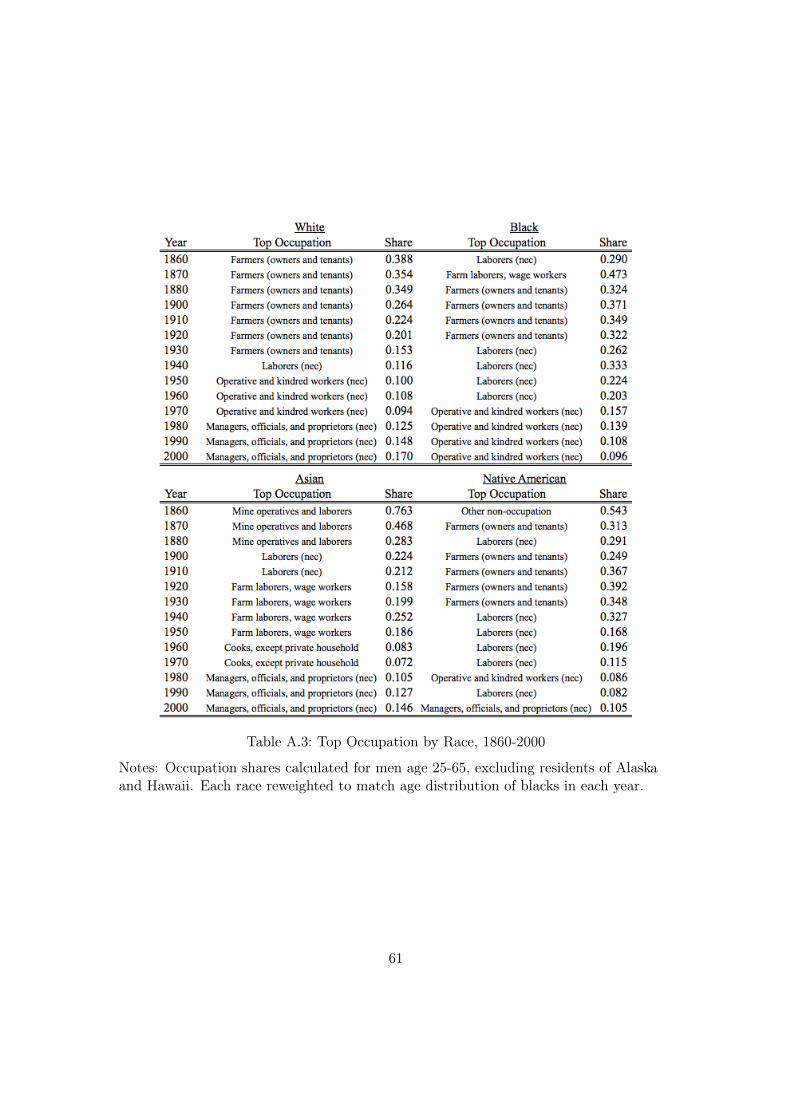
parenthood. Since the Chinese Exclusion Act of 1882 and the Gentlemen’s Agreementof 1907, US immigration law has screened Asian immigrants on factors highly correlatedwith skill such as business ownership and occupational status. Subsequent laws andpractices served to encourage return-migration and deportation of lower-skilled Asians,while allowing certain higher-skilled and higher-wealth Asians to stay in the US and bringin wives from Asia to start families (McKenzie et al., 1927; Hutchinson, 1947; Lee, 2005;Daniels, 1990; Chan, 1991). These policies yielded selection into family formation inthe US as well as migration. Table III confirms selection into migration by showing thatJapanese and especially Chinese American migrants were more highly educated than non-migrants in their home countries at least as far back as 1940. The table also documentssignificant positive educational selection of blacks migrating to CA from other parts ofthe US. Table IV presents evidence on occupational selection into fatherhood by race
15Records on firm employment accessed in Administrative Files of collection RG 228 Committee on FairEmployment Practice Region XII - San Francisco, HMS Record ID SB-877, held at the San Bruno,CA branch of the National Archives and Records Administration. Data on white and non-whiteemployment by firm based on ES 270 forms used by the War Manpower Commission to assess laborrequirements of specific firms and catalogue workforce characteristics, and provided in some casesto Fair Employment Practices Committee administrators. This sample of ES 270 forms appears tohave been gathered for reasons unrelated to enforcing discrimination law, and is therefore plausiblyrepresentative of the Bay Area labor market. Data available from author upon request.
10
and year, defining fatherhood as co-residence with own children.16 The table shows thatAsians exhibit much stronger positive selection on occupational status into fatherhoodof US-born children than both whites and blacks living in CA, especially before 1960.While many Asians arriving in the 19th century may well have been lower-skilled, onlya small, positively selected fraction of these early arrivals contribute dynastically to therapid economic ascent of Asians after 1940 that I document below. In contrast, CA hasnever placed legal restrictions on black migration.
2. Asians experienced similar or worse institutional discrimination than
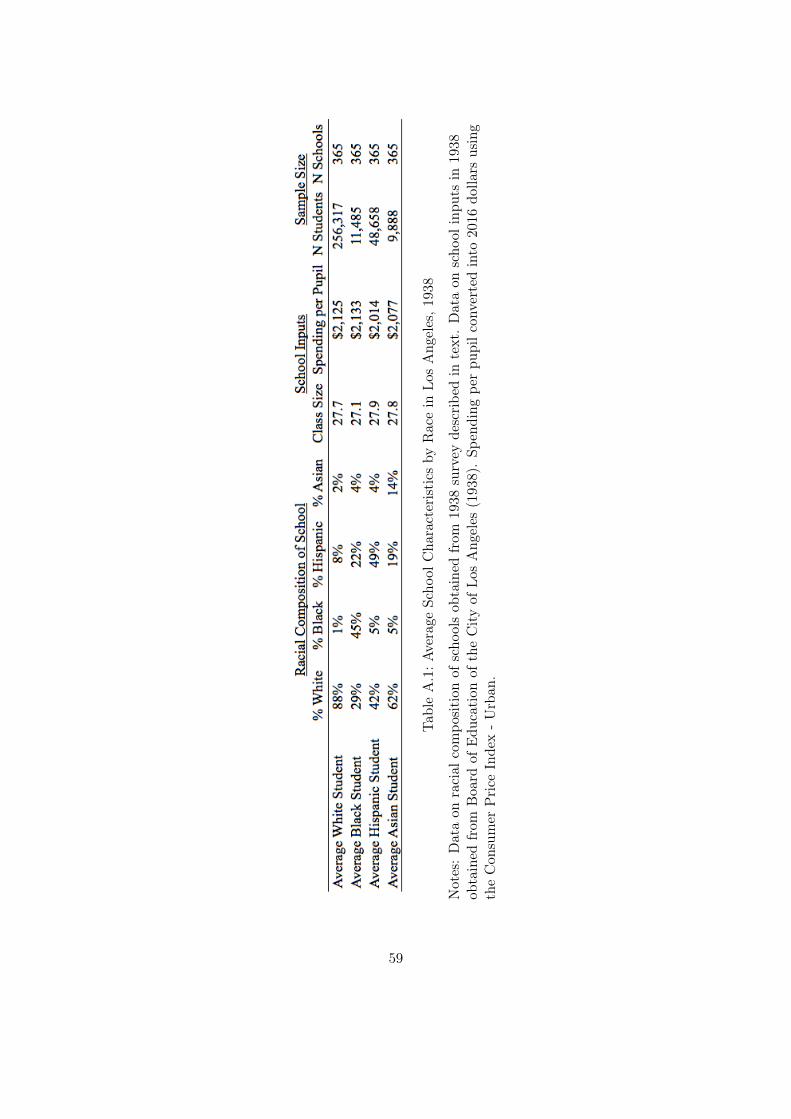
blacks in pre-war CA. Table II shows that Asians faced similar or greater historicaldiscrimination than blacks in pre-war CA in citizenship and suffrage, due process, em-ployment, labor unions, land ownership and leasing, housing markets, public education,and of course internment and expropriation during WWII. In Appendix A, I furtherdiscuss how CA permitted de jure educational segregation of Asians and Native Amer-icans but not blacks from 1890 to 1946, and that this did result in a small minority ofAsian children attending segregated “oriental schools” which in some cases were under-funded and in other cases were shown to slightly reduce Asian academic achievement.Consistent with state law, I have been unable to find evidence of any de jure segregatedblack schools in CA after 1890, and Graaf et al. (2001, e.g., pages 14, 137) suggeststhat access to relatively high-quality, integrated public schools attracted many Southernblacks to CA. I also explore de facto segregation using a new archival data set on schoolracial composition in Los Angeles in 1938 linked to school financial reports, and find thatblacks, Asians and Hispanics all attended racially diverse schools with significant whiteshares and similar per-pupil funding and class sizes. While blacks did attend schoolswith fewer whites than Asians, evidence below suggests this could easily have reflectedgreater willingness to accept racial groups of similar skill profiles to whites in majority-white schools, rather than reflecting greater white prejudice toward blacks than Asiansin the CA school system. Prior research, for example, documents large “school readinessgaps” between races in the modern period (e.g., Fryer and Levitt, 2013).17 In Appendix
16The census only asks women, not men, about number of children ever born, and many Asian menhistorically were in fact married but did not bring their wives with them to the US. Therefore co-residence is the only available measure of fatherhood. The quality of this proxy for fatherhood likelydeteriorates somewhat in more recent decades as the rate of single motherhood has risen.
17Hendrick (1975) documents much evidence of early- and mid-20th century CA educators arguing thatracial segregation in schools could be justified by group academic ability differences, but not byprejudice. Taylor (1928, p. 84-86), for example, documents that some high-ability Mexican childrenin CA were allowed to attend white schools rather than segregated Mexican schools, and that highschools were typically integrated based on the idea that any children reaching these upper grades nolonger required separate instruction. Both of these sources suggest these arguments often combinedgenuine educational principles with covert prejudice.
11
A I also argue that “ethnic organizations” would have been unlikely to provide a moreeffective shield against white discrimination for Asians than local CA blacks.
3. Institutional discrimination against all non-whites in CA declined dra-
matically 1943-59. Finally, Table II and Appendix A show that institutional discrim-ination against all non-whites in CA declined dramatically between 1943-59. During thisperiod, legislation and court decisions prohibited racial discrimination in naturalization,housing, employment and labor unions, education, land ownership, commercial licenses,marriage, employment, labor unions, and employment agencies. These changes before1960 all would have tended to increase competition for minority workers in the labormarket by removing legal barriers to employment, induce pre-emptive voluntary inte-gration by firms and unions, and erode social norms of racial exclusion (e.g., Heckmanand Payner, 1989; Donohue and Heckman, 1991). I am not able to pin down causaleffects of any specific change in discrimination on racial outcomes, and I am not ableto measure differential changes in discrimination across racial groups during this period.Overall, these changes suggest a significant relaxation of previously severe labor marketrestrictions on non-white workers in post-war CA.
4. Data
Here I briefly describe key data sources and empirical decisions, leaving details for Ap-pendix B. I rely on census data 1940-2000 for most key results in the paper, includingrecently-available 100% count 1940 census data that permits a detailed examination ofAsians in pre-war CA for the first time (Ruggles et al., 2015). I define “Asians” as Chi-nese, Japanese and “Other Asian or Pacific Islander,” though most Asians before 1970were Chinese or Japanese. I combine all Asians for reasons of both simplicity and sta-tistical power, just like most researchers combine all white and black ethnic groups intobroader categories. I focus on log of annual labor earnings (head + spouse) as my keyoutcome measure, excluding zeros, and confirm robustness of key results to other choicesin Section 10. I rely on the method in Hilger (2016) to estimate the relationship betweenparental earnings and children’s education based on young adult children who co-residewith parents in census data.18
18The key assumption of this approach is that dependent and independent children in their late 20sexhibit similar relationships between final schooling and parental income. This assumption cannotbe verified for Asians due to small samples in panel datasets, but Hilger (2016) shows it is a reasonableapproximation in many other contexts over the 1940-2000 period, yielding mobility estimates thatline up with time trends for both whites and blacks in other data sources over the 1940-80 period, aswell as state income mobility variation for the 2000s from Chetty et al. (2014).
12
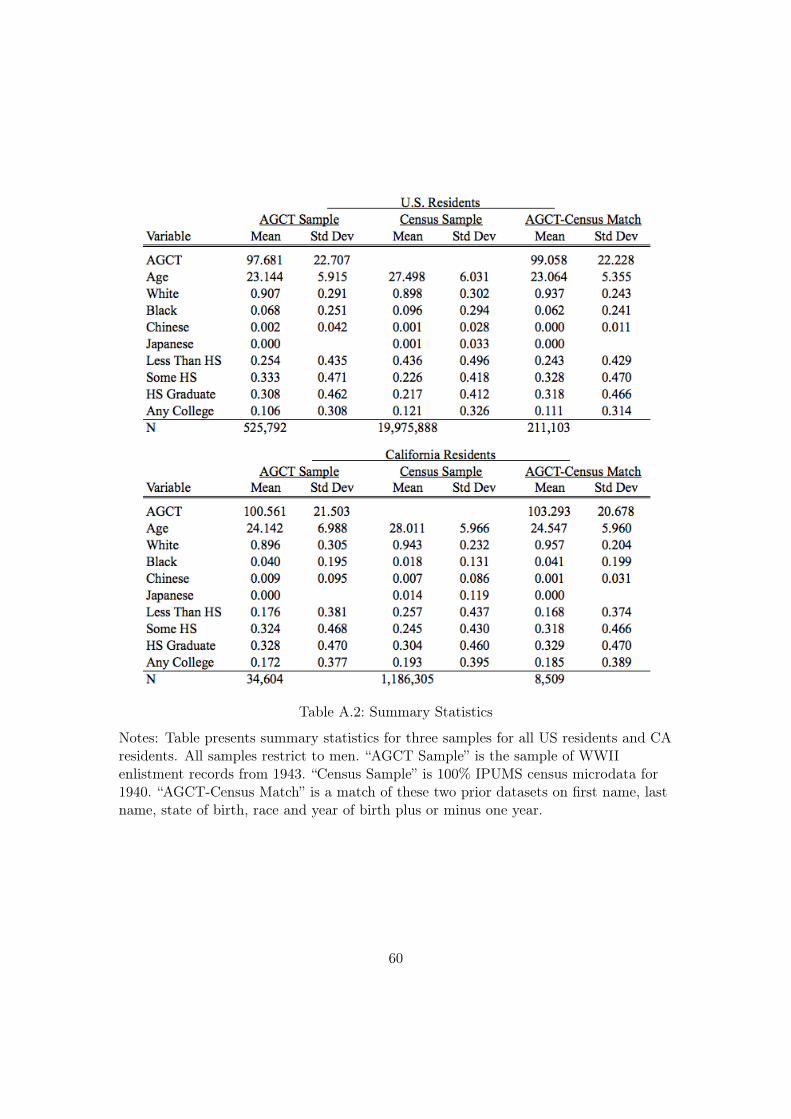
I also make use of recently-discovered World War II enlistment data containing ArmyGeneral Classification Test (AGCT) scores for a large sample of enlistees in 1943 (Ferrieet al. 2012; also see Aaronson and Mazumder 2011; Carruthers and Wanamaker 2016).An important and apparently unrecognized fact is that AGCT data contain a posi-tively selected sample of enlistees due to restrictions on test-taking to individuals whopassed preliminary examinations of physical, educational, and emotional fitness (Bing-ham, 1946; Ginzberg, 1959, and other references in data appendix). I conclude AGCTscores likely understate population black-white gaps in education and cognitive skills,and may likewise understate black-Asian skill gaps documented below. Despite theseselection problems, this extraordinarily large sample of cognitive test scores allows me toexamine skill differences for small subgroups born in the 1920s, and to assess correlationsof both individual and group-level skills with earnings. For some analysis I make useof a matched sample of 1940 census data and 1943 AGCT test scores. As described inAppendix B, the match rate is high relative to similar prior work and yields a broadlyrepresentative sample of 211,000 white and black young men.
Finally, in Section 3 and Appendix A I make use of novel historical data on schoolinputs at a Chinese segregated school in San Francisco in the 1920s, school inputs andracial composition of public schools in Los Angeles in 1938, and racial composition ofindividual firms in the Bay Area in 1943 and 1944.
5. Intergenerational Group Mobility
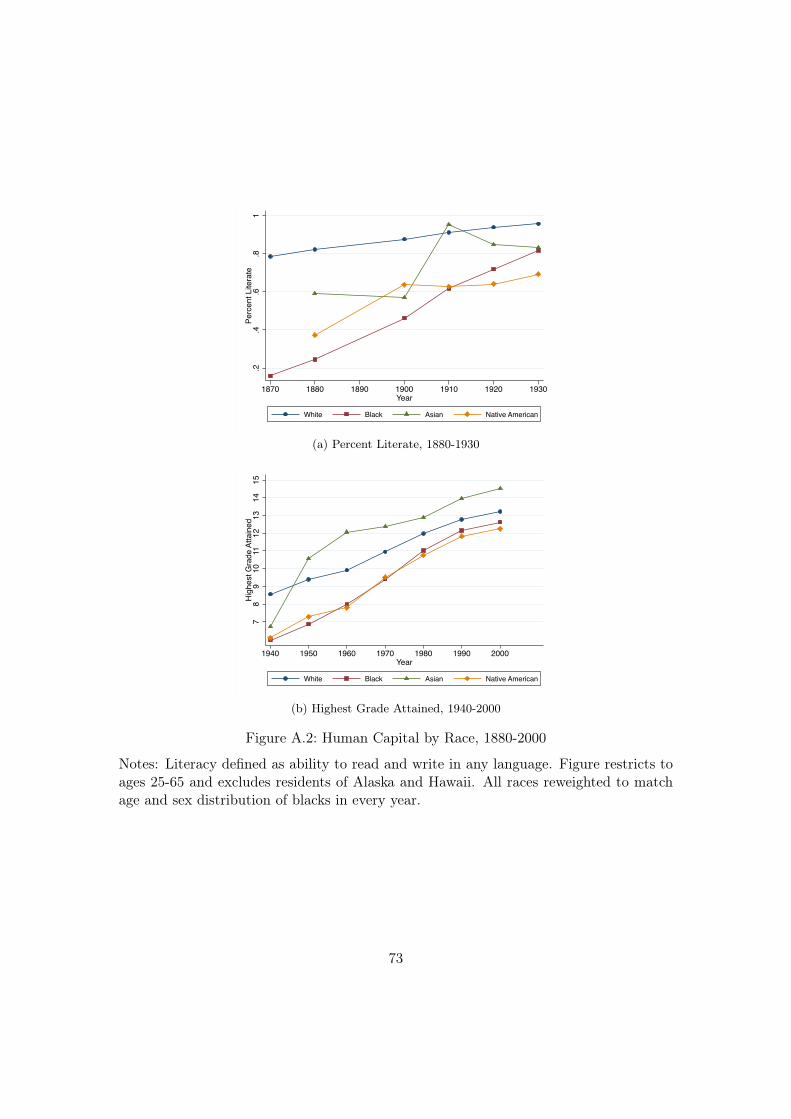
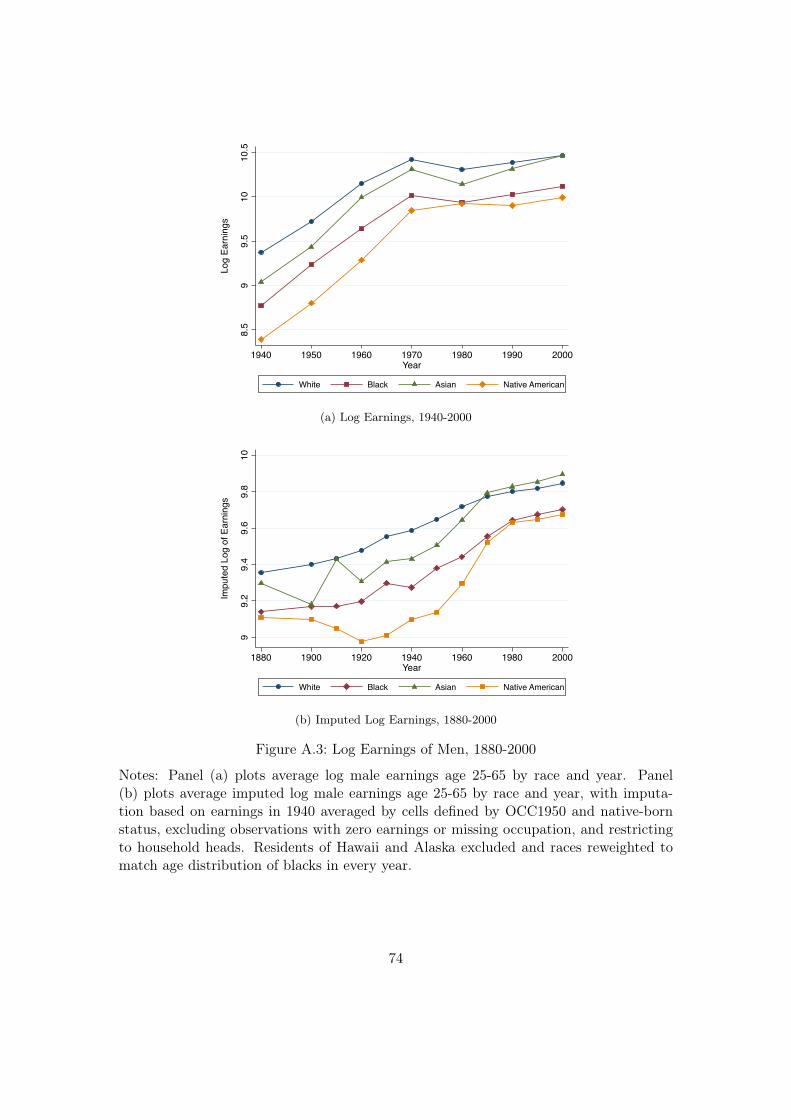
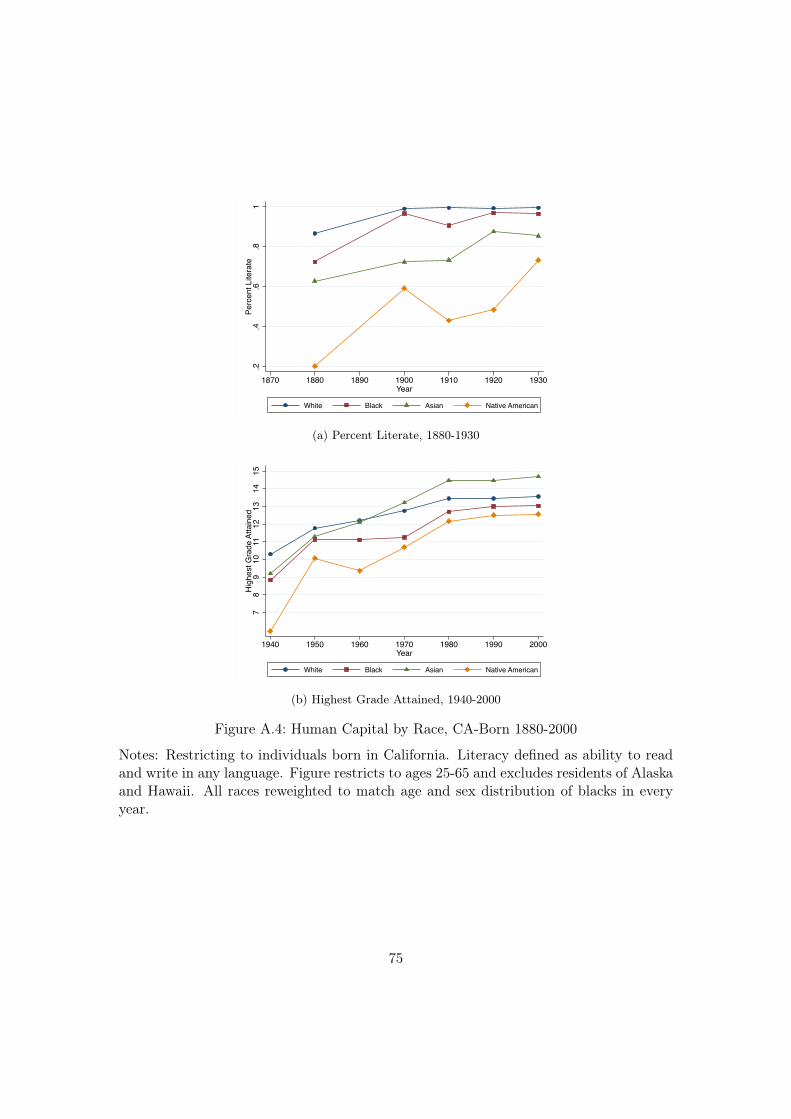
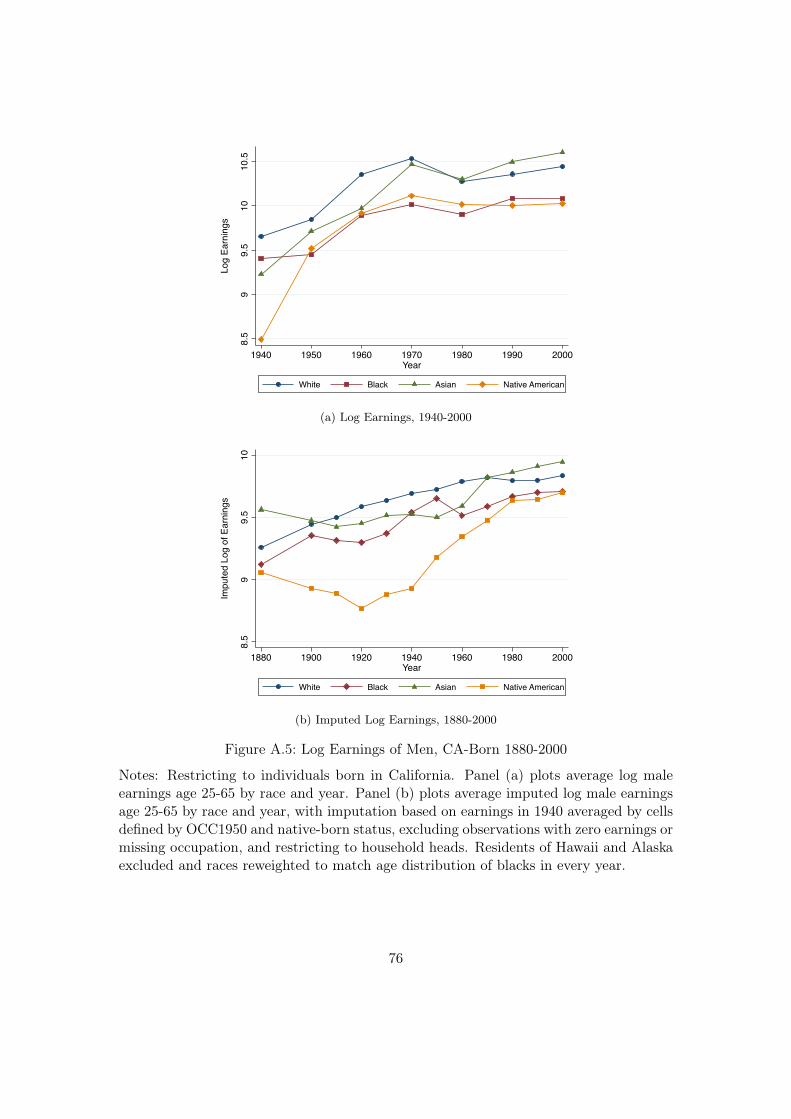
In Appendix C, I plot national aggregate outcomes by race over all available years of data,reweighted to harmonize age and gender distributions across races.19 These aggregatenational trends characterize Asians as higher-skilled than other non-white US minoritiesat every point over the past 150 years. The perception that Asians began their historyin the US disadvantaged by lower skills and earnings could potentially be true relative towhites, but is not plausible when comparing Asians to blacks or Native Americans at thenational level. In contrast, trends in human capital and earnings among the CA-born aremore consistent with this perception, as shown in Appendix Figures A.4-A.5. Among theCA-born, Asians and blacks appear similarly disadvantaged in 1940, but Asians rapidlyovertake both blacks and whites in education and earnings over subsequent decades.However, these aggregate time series trends are not a focus of this paper because theyconfound intergenerational group mobility with composition changes from migration flows
19When reweighting group means on age and sex, I use blacks as the base group because CA-born blacksare the smallest group in many years.
13
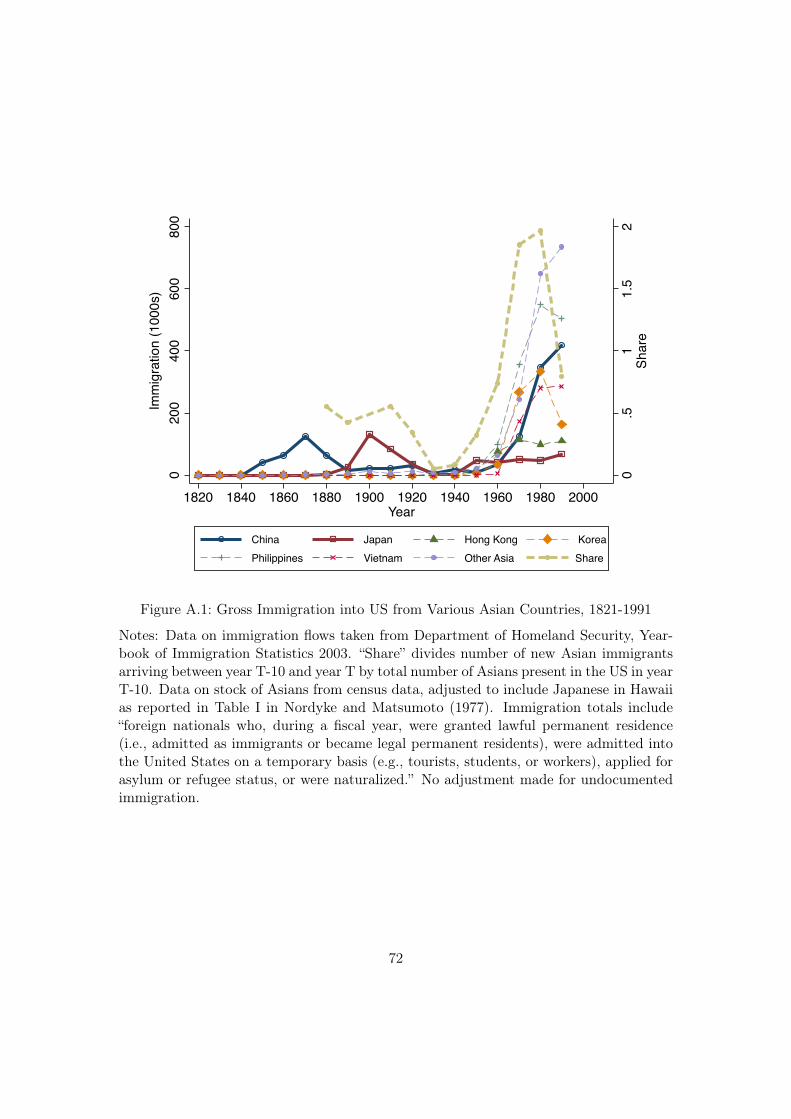
between censuses. These composition changes are potentially very large, as illustratedin Appendix Figure A.1. For example, in 1960 new Asian immigrants amount to 75% ofall Asians present in the US in 1950, with even greater inflows in subsequent decades.
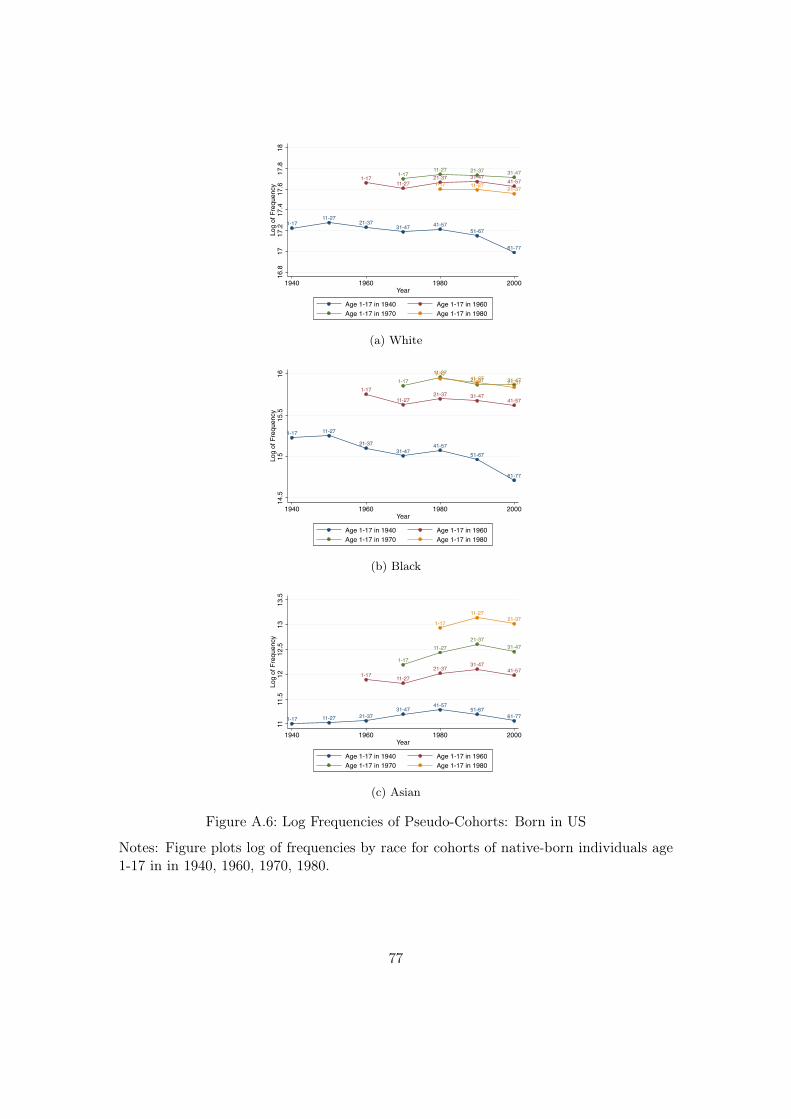
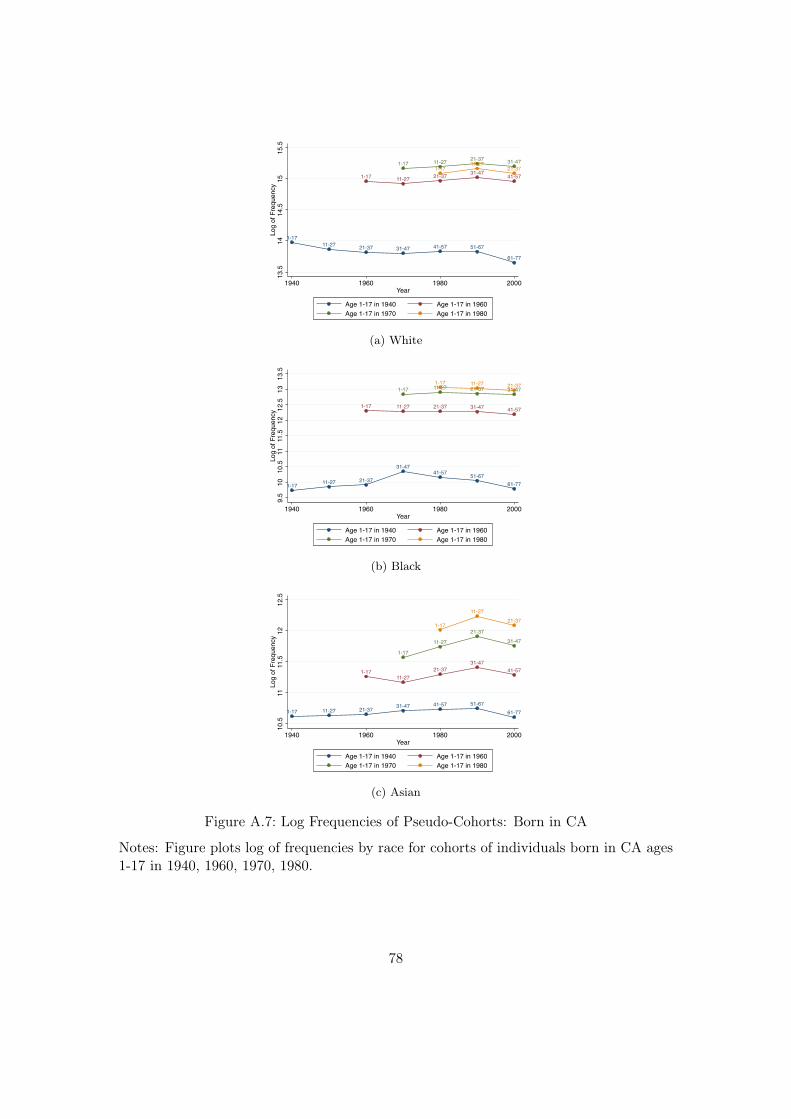
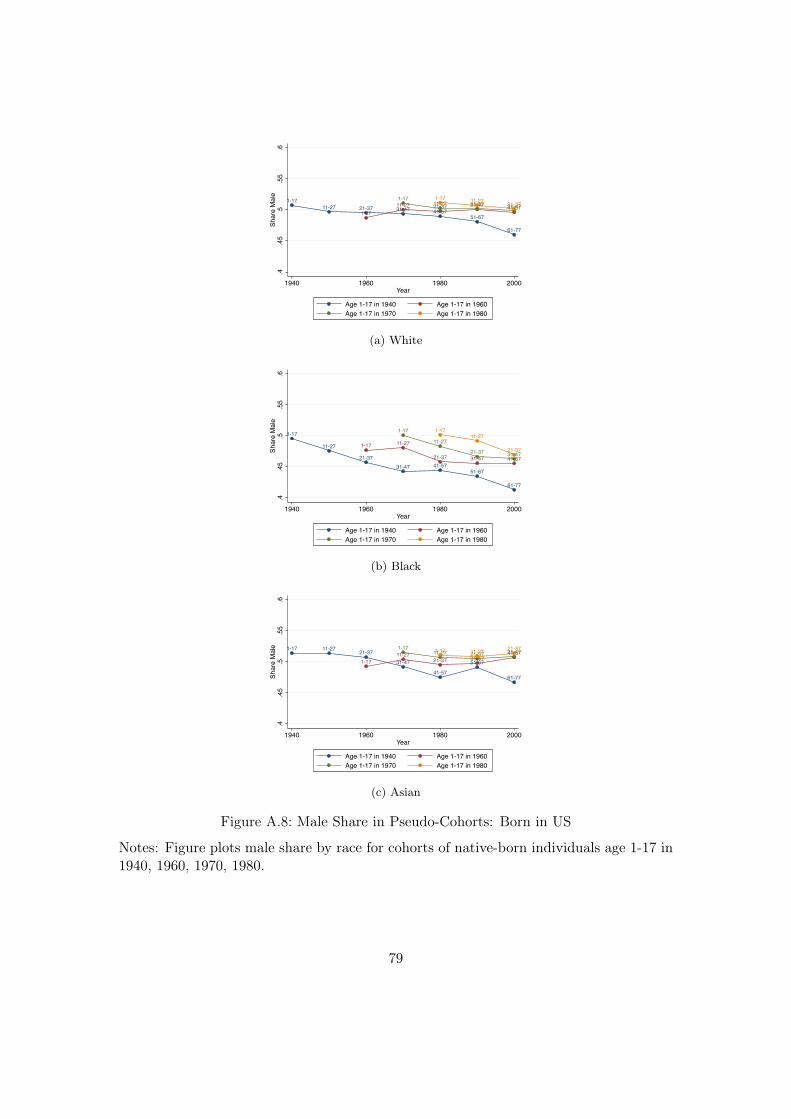
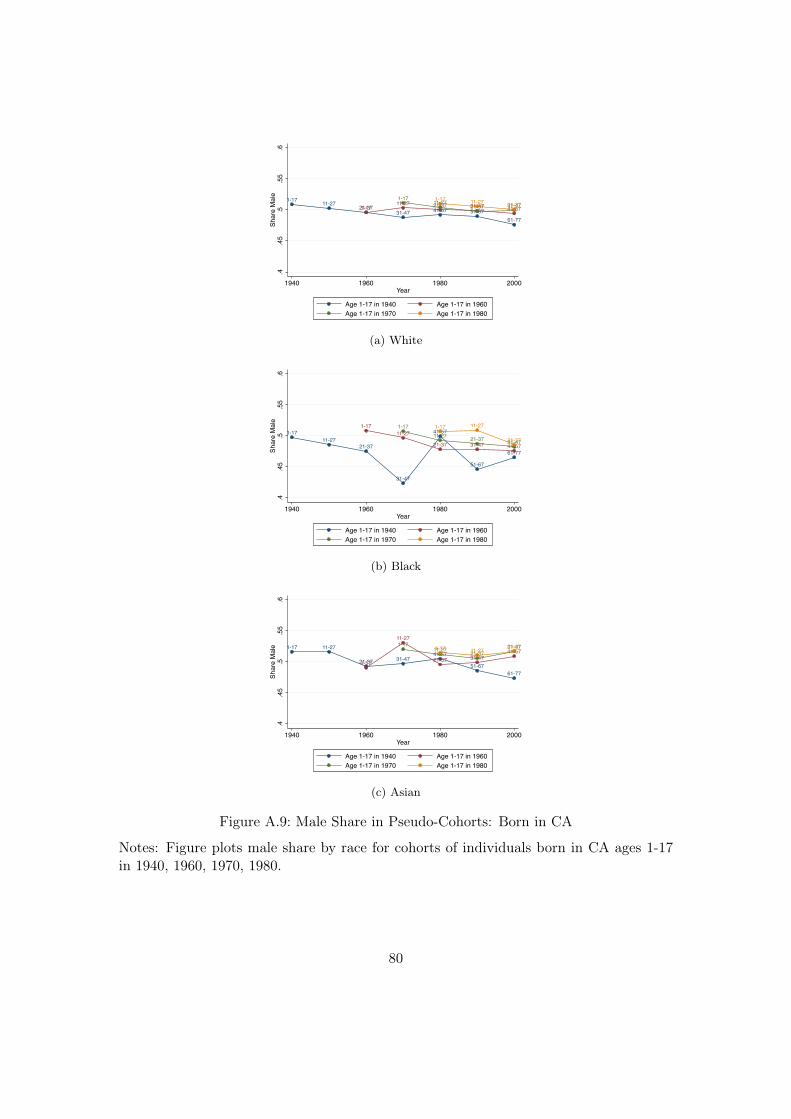
I therefore use a pseudo-panel approach to compare intergenerational income growthacross races in a way that plausibly eliminates bias from migration flows between cen-sues. I construct pseudo-panels that link adult outcomes to parental characteristicsduring childhood, exploiting the fact that most children live with their parents untilage 17. Specifically, consider children age 1-17 in 1940 with known state of birth inthe US. For this 17-year cohort block of children we can observe parental income. Wecan then observe outcomes of these children at ten-year intervals in later censuses us-ing self-reported state of birth. This strategy delivers balanced pseudo-panels underthe assumption that individuals report race, age, and place of birth consistently acrossdecades, and that families with US-born children rarely emigrate. Pseudo-panels permitcalculation of “group mobility” based on comparisons of E [yi,r,t] and E [yi,r,t�1], whereyi,r,t denotes household earnings of person i in group r in generation t. I construct thesepseudo-panels for 17-year cohort blocks still living with parents in years 1940, 1960, 1970,and 1980.20In Appendix D, I test the assumptions required to obtain valid pseudo-panelsby testing for anomalous changes in the size and gender composition of cohorts definedby place of birth.21 Results show relatively stable size and gender composition of cohorts,supporting the pseudo-panel approach.
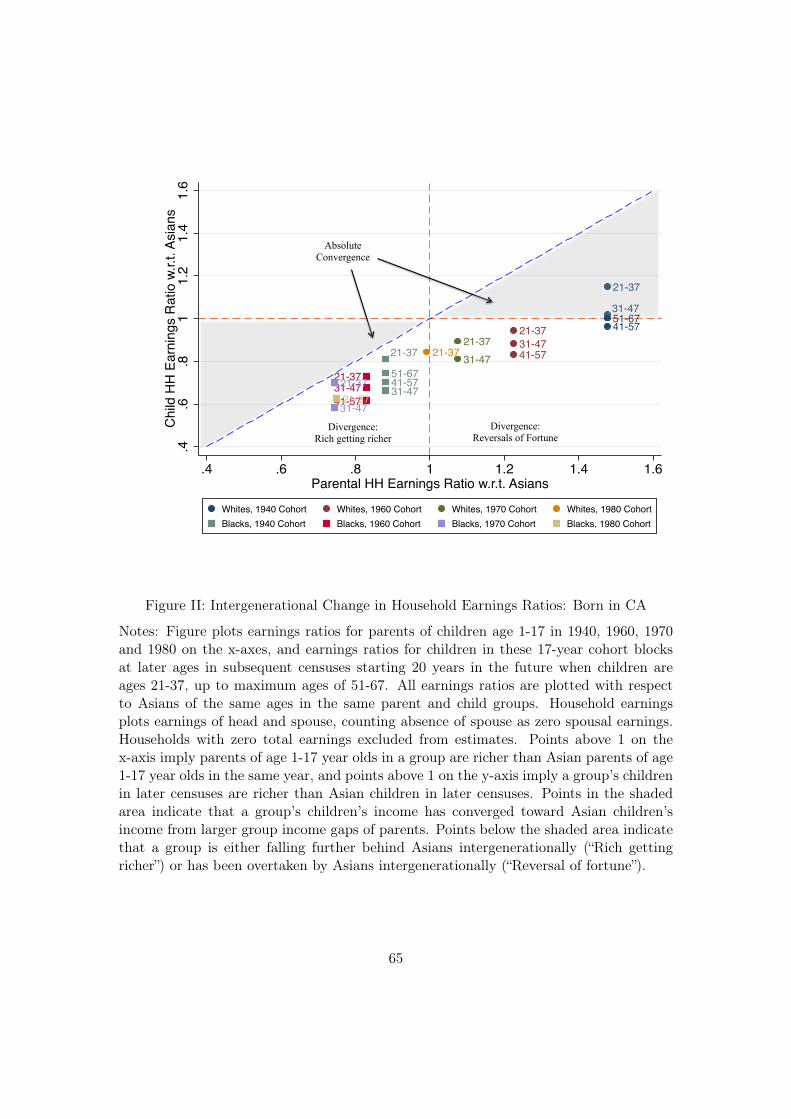
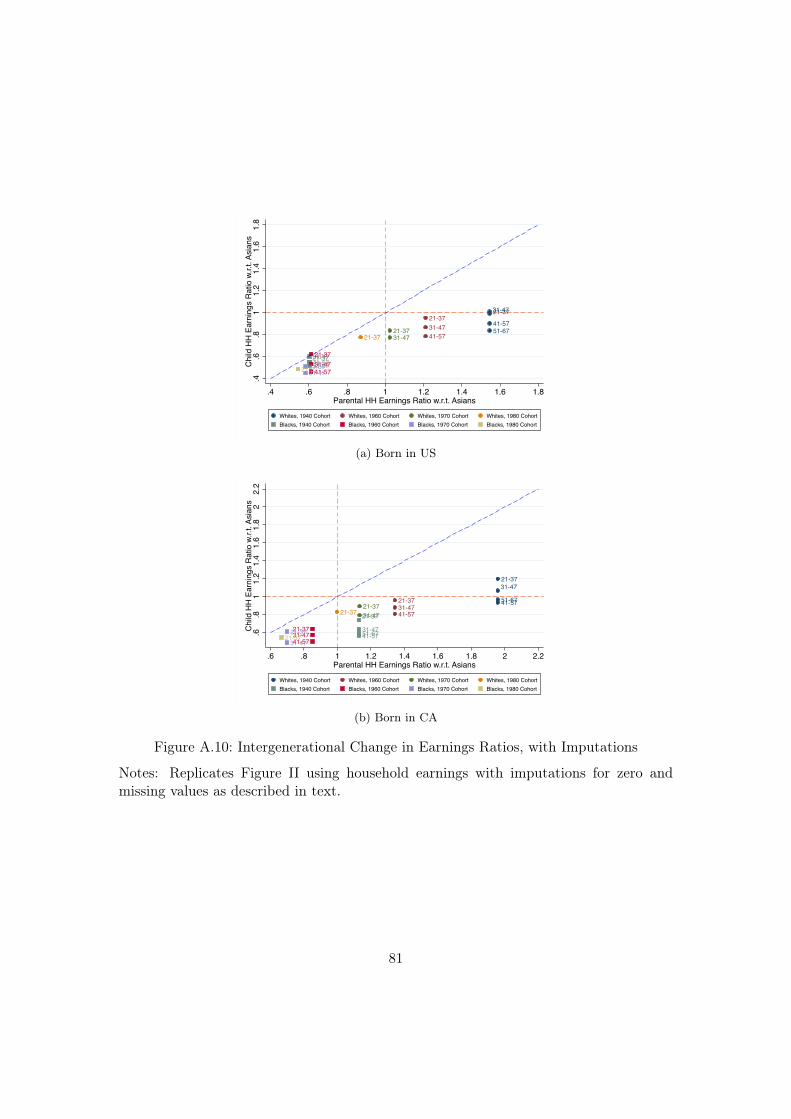
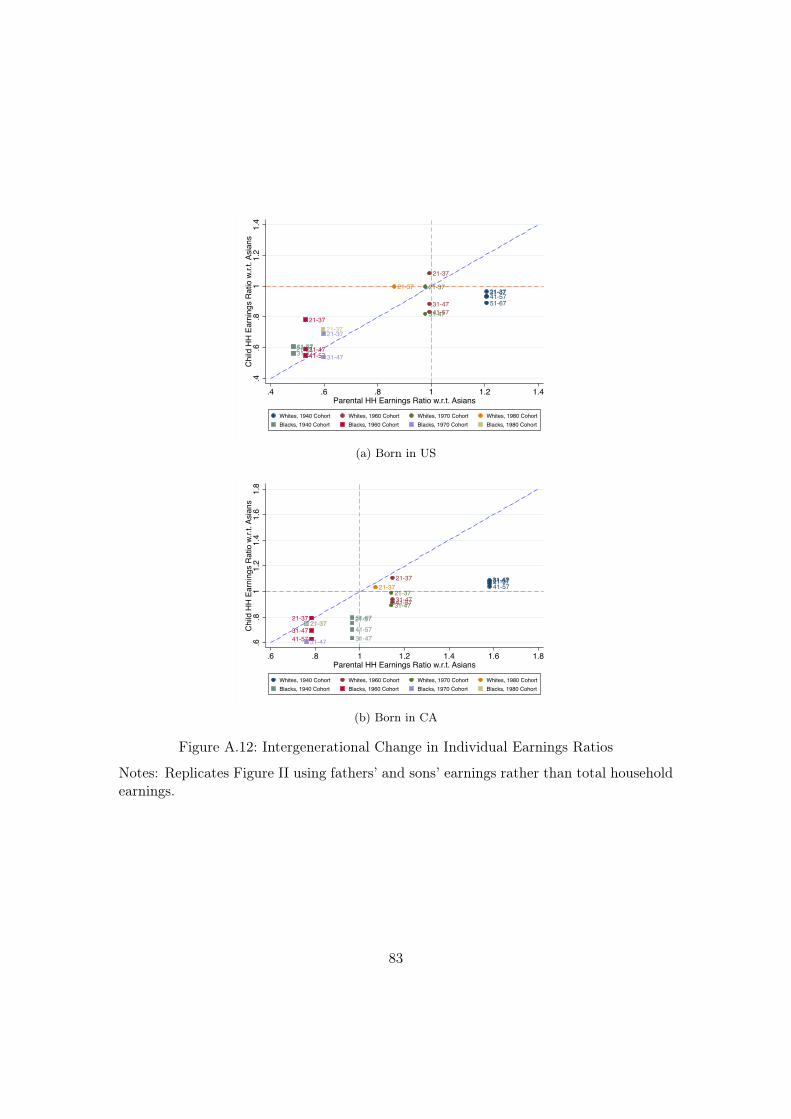
These pseudo-panels yield one mean parental income observation for each 17-year co-hort block of children, and one mean earnings observation for these children in eachcensus starting 20 years after observing parental income when children have entered thelabor market at ages 21-37. This combination of multiple observations on every cohortserves as a further test of internal consistency. Figure II presents these data for CA-bornblack, white, and Asian cohorts reaching ages 1-17 in each decade, configured to assessspeed of Asian intergenerational mobility relative to local whites and blacks. The fig-ure plots parental household earnings ratios with respect to Asians on the X-axis, andchildren’s household earnings ratios with respect to Asians on the Y-axis. The 45-degreeline represents the benchmark of identical earnings ratios across generations, and dis-tinguishes two broad families of models. In the “absolute convergence” region, Asianmobility is consistent with inter-group mean-reversion of groups with identical prefer-
20I pool all children ages 1-17 to maximize statistical power, weighting families by number of children inhousehold. I omit cohorts age 1-17 in 1950 because earnings and education in 1950 are only observedfor one member of each household.
21These tests are not perfect because consistent cohort size may conceal changes in the composition ofthe cohort from migration flows that cancel out on net.
14
ences and technologies from different initial conditions (Ramsey, 1928; Solow, 1956).22
In the “Divergence” region, relatively rich Asian parents have children who are relativelyeven richer, or poor Asian parents have children who surpass previously richer groups.Points in this region suggest that Asians are converging to higher steady-state incomelevels than comparison groups. Differential steady states across groups are consistentwith (1) “conditional convergence” models with group variation in preferences and tech-nologies (Barro and Sala-i Martin, 1992), and (2) “new growth” models with identicalgroups affected by various externalities or non-convexities. Examples of non-neoclassicalfeatures include human capital externalities (Azariadis and Drazen, 1990; Borjas, 1992),knowledge spillovers (Romer, 1986), and credit constraints (Galor and Zeira, 1993).
Results in Figure II reject neo-classical absolute convergence with respect to bothblacks and whites in every cohort born in CA since 1920, with the possible exception ofAsian convergence to whites in the 1940 cohort which exhibits “only” full convergencefrom a 50% parental earnings disadvantage in one generation. These findings suggestthat Asian dynasties raising children in CA historically benefit from different preferencesor technologies, or from some violation of assumptions underlying neo-classical growth.Importantly, this pattern is not driven by English fluency differences between parentsand native-born children; 50-80% of Asian parents are native-born in all years 1940-80, and restricting to native-born parents yields nearly identical results. I now turnto understanding what factors might account for this unusually rapid dynastic earningsgrowth among Asians.
6. Intergenerational Earnings Decomposition
Why have Asian dynasties in CA been converging toward higher group earnings thanblacks and whites? To shed light on this question I estimate a simple, intergenerationaldecomposition of group earnings in the spirit of Conlisk (1974). Let yr,t indicate averageadult log earnings in group r in generation t, and hr,t indicate average adult education.Let fr (yt�1) indicate the probability density function of parental income in group r.Mean earnings of group r in generation t can then be written non-parametrically as:
E [yr,t] =
ˆyt�1
yr,t (hr,t (yt�1)) fr,t (yt�1) dyt�1. (1)
This decomposition breaks mean group earnings into three terms. The term fr,t (yt�1)
22Ethnic groups can be thought of approximately as small open economies with mobile labor. Rappaport(2005) shows that mobile labor has a surprisingly small effect on the rate of convergence predictedin a standard neoclassical growth model.
15
captures a group’s parental income distribution. The term hr,t (yt�1) captures educa-tional attainment conditional on parental income, or “educational mobility.” Educationalmobility can vary across races due to many factors including parental skills or prefer-ences, discrimination in human capital markets, and beliefs about the returns to skill.This relation could also be nonlinear if families with low incomes face liquidity constraintson educational investments. The term yr,t (hr,t) captures children’s earnings conditionalon education. These Mincerian earnings functions can differ across races due to skilldifferences stemming from school quality and home environment, or due to labor marketdiscrimination based on prejudice or misperceptions.23
After examining these terms non-parametrically, I also make use of a linearized versionof this decomposition. This version is easier to work with empirically, and also shedslight on multigenerational implications of group differences at any point in time. Writeeducational mobility as hf,t (yr,t�1) = ✓r,t + �r,tyr,t�1 and adult earnings functions asyr,t (hr,t) = ↵r,t + �r,thr,t, implying
If I further assume time-invariant parameters for each group, I obtain the steady staterelation
yr,SS =↵r + �r✓r
1� �r�r. (3)
These decompositions allow me to state how group outcome gaps would mechanicallybe affected by replacing each of these three components for one group with the corre-sponding component of another group, either in the subsequent generation or in steadystate. For example, I can estimate the share of the black-white earnings gap that wouldbe closed if blacks adopted Asian educational mobility hasian,t�1 (yt�1) or white parentalincome fwhite,t�1 (yt�1). These counterfactuals provide a simple way to quantify the“importance” of group differences in three broad components of group mean earnings.24
I estimate these three components in each year for whites, blacks and Asians born in
23I omit a direct effect of parental income on children’s income because the method in Hilger (2016)only permits estimation of children’s education by parental income, not children’s income by parentalincome. Fortunately, prior research in sociology based on data back to the 1960s suggests that theremaining descriptive impact of parental income on children’s income, after conditioning on children’seducation, is small (Torche, 2015).
24It is also straightforward to solve for the transition path of the linear decomposition for any generationT as
E [yT ] = (↵+ �✓)TX
j=1
(��)j�1 + (��)T E [y0] . (4)
16
CA.25 Estimation of parental income distributions and adult earnings functions in censusdata is straightforward. I rely on the method developed in Hilger (2016) to estimatechildren’s final education conditional on parental income, addressing the longstandingproblem that many children can no longer be linked to their parents at ages followingschool completion (e.g., Cameron and Heckman, 1993).26
Even as a purely descriptive, reduced-form exercise, this decomposition has many limi-tations. For example, two-generation mobility statistics likely overstate multi-generationalmobility (e.g., Solon, 2015), and annual group earnings variation likely understates life-time group earnings variation (Rothstein and Wozny, 2014). Nonetheless, the exerciseprovides a useful tool for exploring potential causes of variation in group earnings mo-bility.
6.1. Estimates
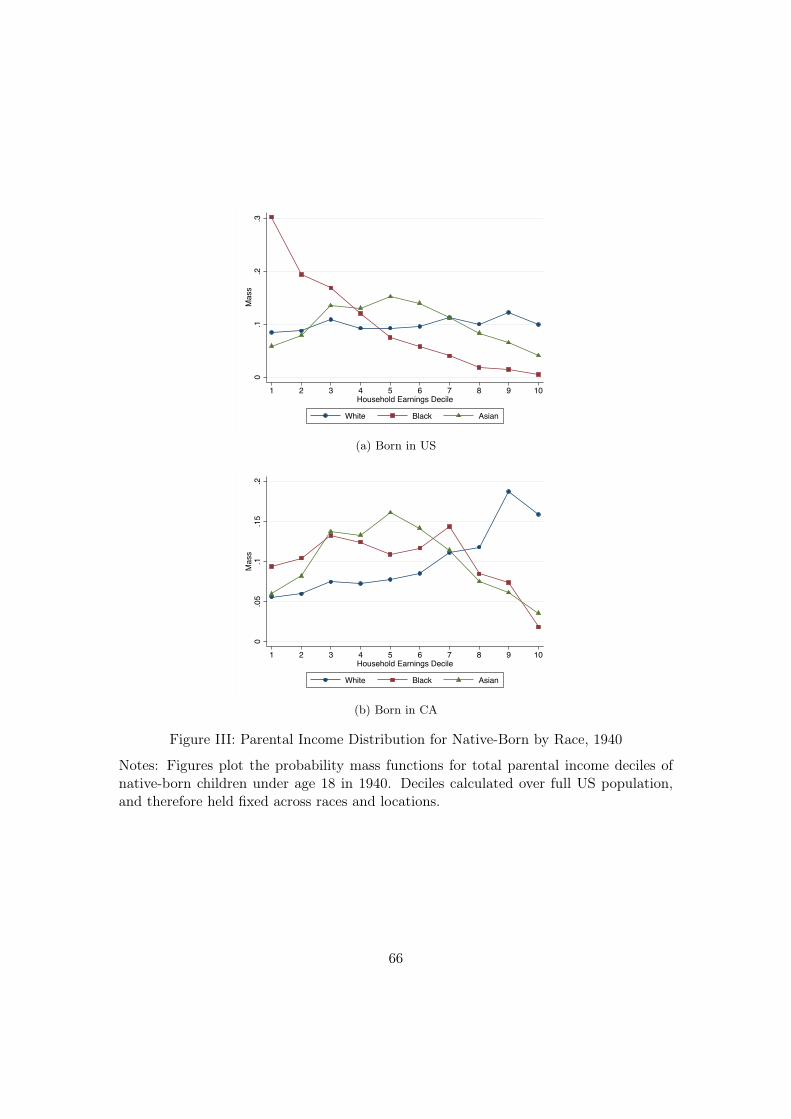
Figure III plots parental income distributions by race in 1940 for children born in theUS and CA. Parental incomes are grouped into population deciles. Panel (a) shows thatAsian and black children in 1940 grew up with extremely different parental income dis-tributions at the national level, with black children concentrated in the bottom deciles.Panel (b) shows this contrast is much milder when restricting to black and Asian childrenborn in CA, either due to positive selection into migration or better earnings opportuni-ties for black parents in CA.
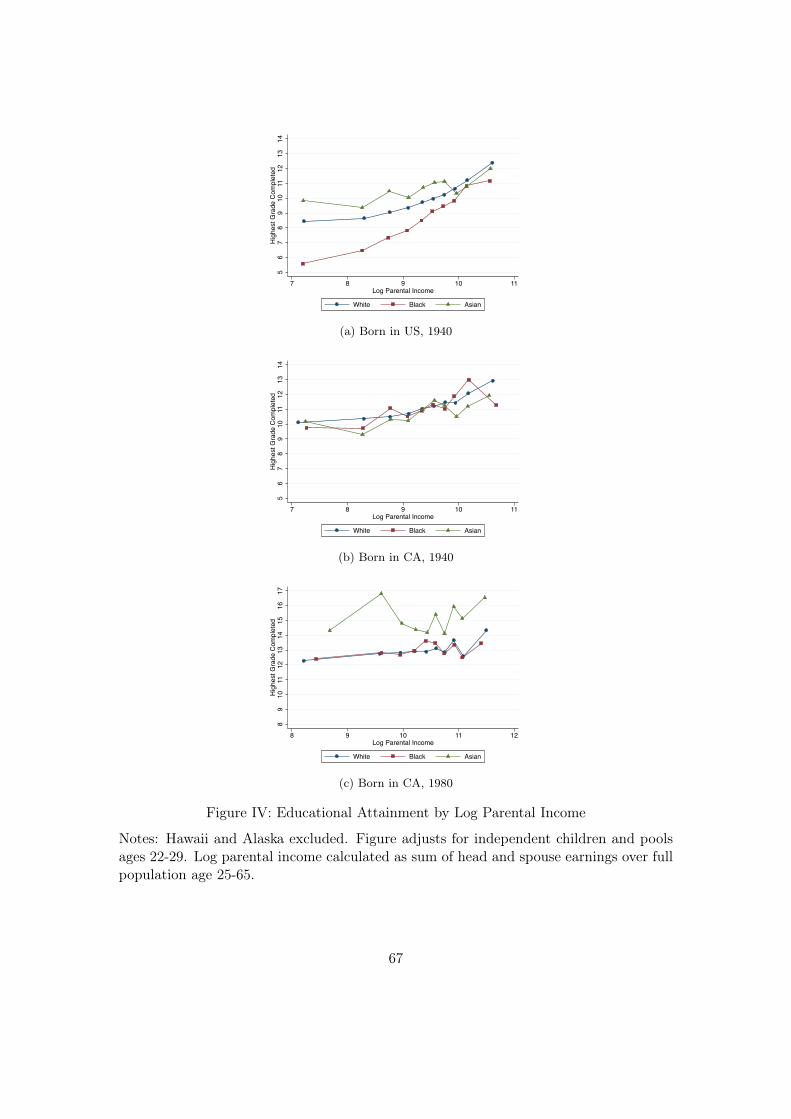
Figure IV plots educational attainment conditional on parental income, and againillustrates the key role of geography in Asian American history. Panel (a) shows thatamong all native-born in 1940 Asians exhibit greater educational mobility than whites,who in turn exhibit greater educational mobility than blacks, both in terms of interceptsand slopes. However, panel (b) shows that as of 1940 these differences disappear whenrestricting to the CA-born. Among the CA-born, all races display very high educationalmobility in terms of both intercepts and slopes, relative to the national pattern. Panel(c) shows that CA-born Asians once again exhibit a higher greater educational mobilitythan other CA-born groups in later years, while white and black educational mobilityremain virtually identical.
25In practice it is important to estimate these relationships over bounded regions of income and educationvariables, because the linearity assumptions break down outside the main support. I therefore dropchildren with education below the bottom 2% of the population education distribution in each yearas in Card and Krueger (1992a), and I use mean log of parental income within population parentalincome deciles in each year, bounding income at the mean of the top and bottom deciles. Thereforein practice I estimate E [yr,t] = ↵r,t + �r,t✓r,t + �r,t�r,tE [yr,t�1] � �r�rymin � �rhmin and yr,SS =↵r+�r✓r��r�rymin��rhmin
1��r�r, where ymin and hmin are as described.
26See footnote 18 or Hilger (2016) for more detailed discussion of this method.
17
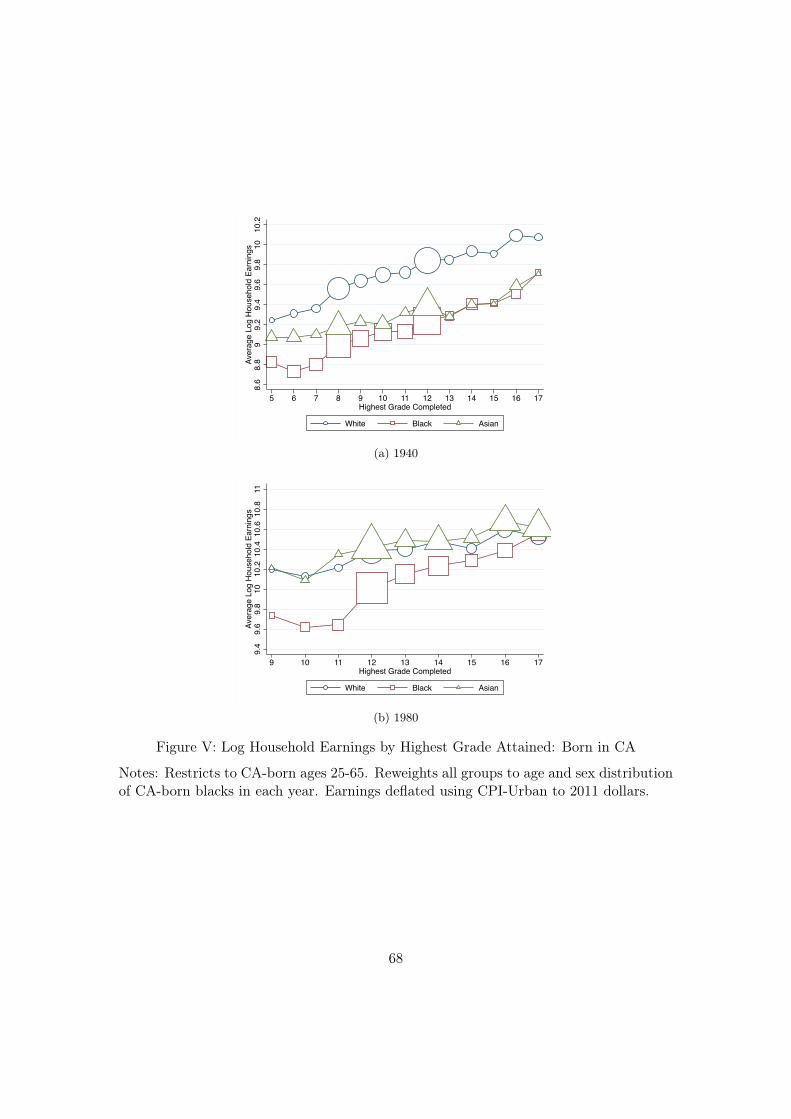
Finally, I estimate group earnings as a function of educational attainment. Figure Vdisplays mean log earnings of men by educational attainment in 1940 and 1980, restrictingto the CA-born. In 1940, Asians and blacks both received about 0.4�0.6 log points lowerpay than whites at every level of education. By 1980, Asians have closed or slightlyreversed this large gap, pulling ahead of blacks by about 0.4 log points in the meat ofthe education distribution. Note this relative gain in Asians’ conditional earnings overblacks is extremely large, equivalent to something like 4 years of additional educationalattainment. 27
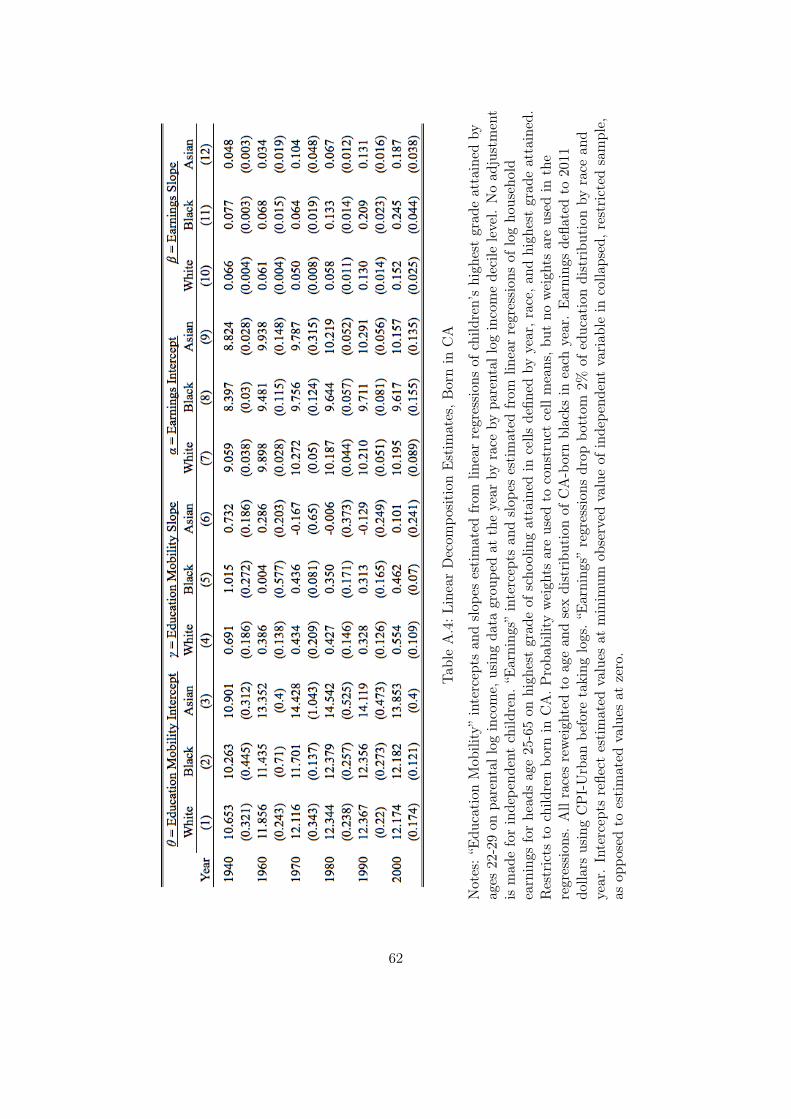
In Appendix Table A.4, I present estimated intercepts and slopes for linearized versionsof educational mobility gradients and earnings functions, restricting to the CA-born.28
Estimates are consistent with lessons from the above discussion. Asians begin to dis-play an advantage in educational mobility after 1940, while white and black educationalmobility gradients remain nearly identical in all years. Earnings function parameter es-timates lack sufficient precision to pin down exact timing of Asian earnings convergencebefore 1980. Earnings function slopes, i.e. Mincerian returns to schooling, rise rapidlyafter 1980 for all groups, especially for blacks.
6.2. Counterfactual Black-White Earnings Gaps
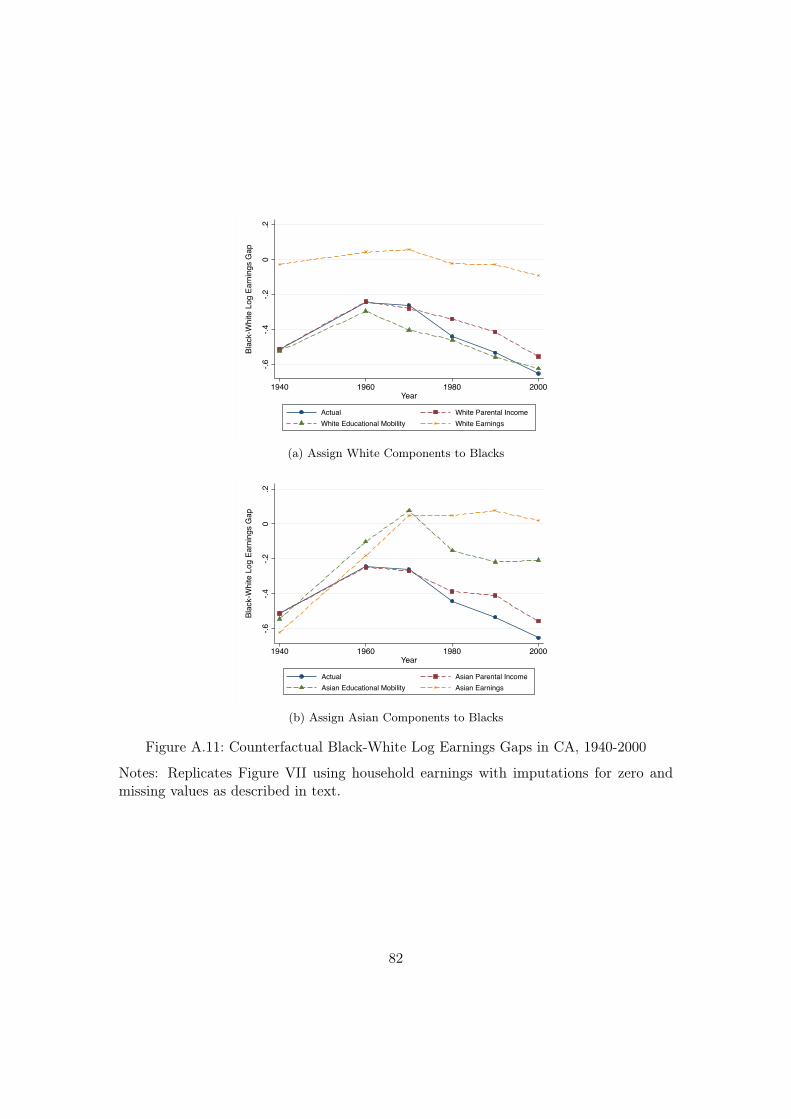
After 1940, all three elements of the decomposition—parental income, educational mo-bility, and earnings functions—favor Asians relative to blacks historically in CA. In orderto assess the relative contribution of these three components I construct counterfactualestimates of the black-white earnings gap over time. I consider counterfactuals in whichI assign to black dynasties each of these three components from whites and Asians, onecomponent at a time, based on estimates for the CA-born in Appendix Table A.4.
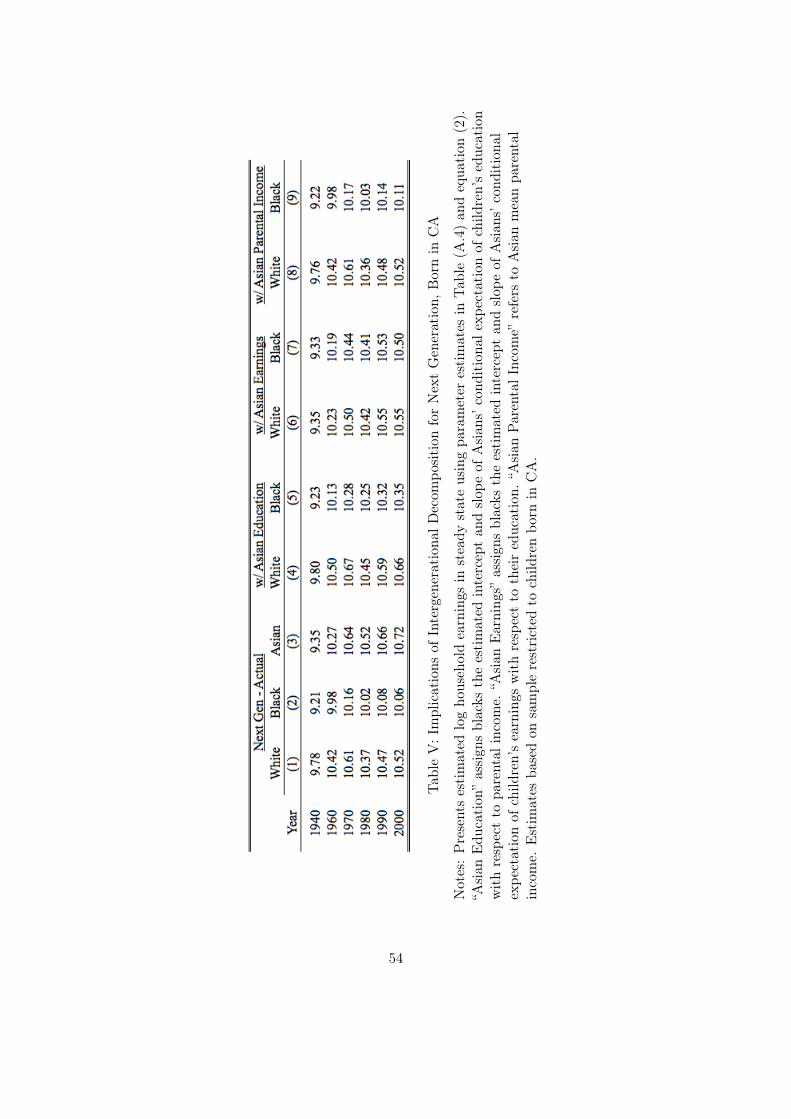
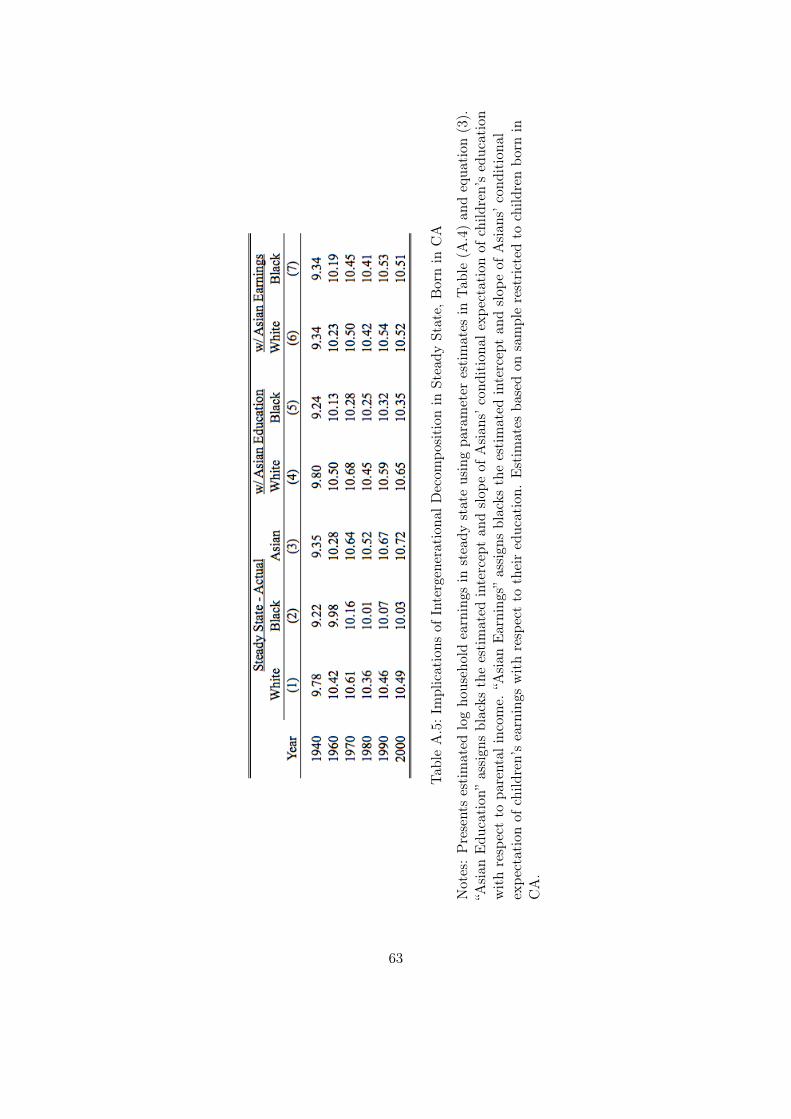
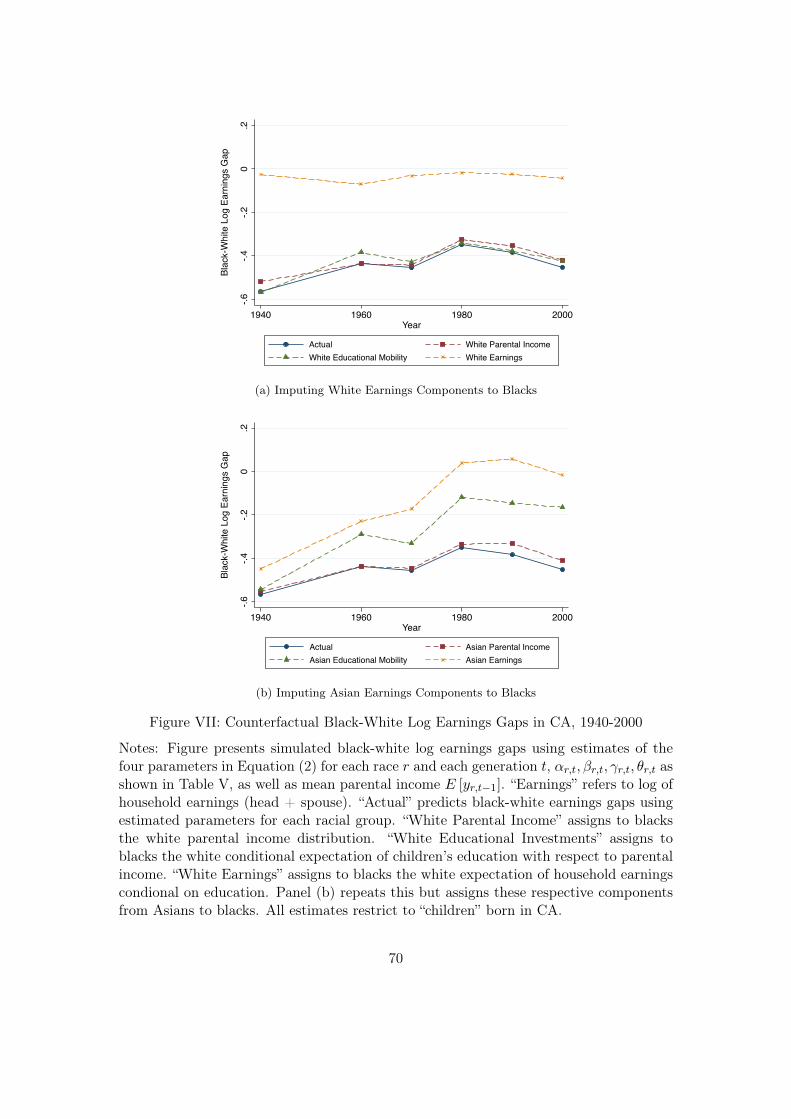
Table V reports actual and counterfactual log earnings by race based on Equation(2), which takes only one generation of transmission into account. Appendix TableA.5 reports similar estimates extrapolating to steady state based on Equation (3). Asthese estimates are very similar, I focus on next-generation predictions which have theadvantage of permitting effects of counterfactual parental income. Figure VII displays
27The same pattern of similarly low Asian and black conditional earnings in 1940, followed by rapidconvergence of Asian but not black conditional earnings to that of whites, also emerges in the othertwo mainland states with significant pre-war Asian populations, New York and Washington. Oc-cupational differences can account for about half of the Asian-white earnings gap in CA. However,these occupational differences themselves, like many other labor market outcomes such as hours andemployment rates, could reflect either labor market discrimination or skill differences and thereforeshed little additional light on the underlying sources of Asian-white earnings gaps.
28These functions cannot be estimated in 1950 due to collection of census data from only one memberof each household.
18
resulting counterfactual black-white earnings gaps constructed from estimates in TableV.. Panel (a) shows that the overwhelmingly most important black disadvantage relativeto whites among in CA is lower earnings conditional on education; lower parental incomeand differential educational mobility play almost no role. Panel (b) repeats this exercisebut imputes Asian components to black dynasties. Once again, conditional earnings gapsare the most important factor, with high educational mobility playing a large secondaryrole. However, even this secondary role for high Asian educational mobility is largelydriven by conditional earnings gains of blacks with some college education after 1940,as shown in Figure V.b. Without these conditional earnings gains of blacks, imputinghigher educational mobility of Asians to blacks yield much smaller effects on black-white earnings gaps.29 Therefore convergence of group earnings conditional on education,rather than educational mobility, has been the primary driver of differential upwardmobility across Asians, blacks, and whites in California’s post-war history.
High educational mobility of CA-born Asian children reaching adulthood after 1940could be driven by a number of mechanisms, including higher unobserved parental skills,group-level human capital externalities (Borjas, 1992; Lee and Zhou, 2015), or Asiancultural preferences for education Brandt et al. (2014). However, in the next section Idiscuss potential explanations for the more important driver of Asian upward mobility:earnings growth conditional on education.
7. Why Did the Asian Conditional Earnings Gap Disappear?
Why did Asians, but not blacks, close their conditional earnings gaps with whites? Un-derstanding causes of the initial earnings gaps for each group may shed light on thisquestion. A large literature distinguishes two broad explanations for group earningsgaps: (1) productivity differences observed by firms but not researchers and (2) preju-dice. Group productivity differences not observed by researchers can account for groupearnings gaps if firms reward individual productivity, or if firms accurately observe meangroup productivity and use group membership to proxy for individual productivity, i.e.“statistically discriminate” (Aigner and Cain, 1977). Because these types of discrimina-tion are profit-maximizing, they can yield stable group earnings gaps as long as groupskill gaps persist.
Explanations for group earnings gaps based on prejudice, rather than productivity, cantake the form of “taste-based” discrimination stemming from racial preferences of employ-ers, workers, or customers (Becker, 1957; Arrow, 1971), or employer misperceptions of
29Results available from other upon request.
19
group skill differences (e.g. exaggerated stereotypes as in Bordalo et al. 2016). They canalso take the form of “institutional” discrimination based on laws and customs that re-strict employment of certain groups. Models of individual or “neoclassical” discriminationpredict that markets will attenuate prejudice-based earnings gaps by segregating minor-ity workers into firms with unprejudiced employers, workers, and customers. Earningsgaps driven by taste-based discrimination are more likely to emerge when prejudice ismore widespread and minorities represent a larger share of the labor force. These modelsimply lower profits for discriminating firms and hence, in some cases, long-run eliminationof group earnings gaps as nondiscriminating firms increase market share (Becker, 1957;Arrow, 1971, though see Goldberg, 1982). However, discrimination can persist in thesemodels if there are sufficient barriers to segregation of minority workers or expansion ofnondiscriminating firms. In contrast, earnings gaps driven by institutional discriminationcan persist with few limitations. For example, if minorities are legally excluded from allhigh-income occupations, sorting and arbitrage mechanisms no longer reduce earningsgaps.
As discussed in Section 2, empirical work using data from more recent decades hasindicated that cognitive test scores—interpreted as measures of productivity not cap-tured by educational attainment—can account for a large share of black-white wage andearnings gaps (Neal and Johnson, 1996; Johnson and Neal, 1998; Fryer, 2010; Carruthersand Wanamaker, 2016). These black-white test score gaps are zero at infancy but emergebefore school entry (Fryer and Levitt, 2013), widen in school Fryer and Levitt (2006), anddo appear to reflect productive skills rather than racial bias in the test (Neal and John-son, 1996).30 However, some evidence suggests that taste-based discrimination againstblacks may account for the remaining share of black-white earnings gaps not accountedfor by observed skills (Charles and Guryan, 2008; Lang and Lehmann, 2012).
One reasonable conjecture, therefore, is that Asian earnings gaps in 1940 reflect a differ-ent type of problem than black earnings gaps in CA, namely prejudice or misperceptionsrather than skill deficits. If this were true, we might expect skill gaps even conditionalon educational attainment to account for a large share of black but not Asian condi-tional earnings gaps as of 1940. Prior research documenting high academic achievementof Japanese American children attending school in CA in the 1930s appears promisingfor this theory (Ichihashi, 1932; Bell, 1935).31 Flynn (1991) finds that both Chinese and
30Observed aspects of the home environment can account for a substantial share of these modern scoregaps in children (Neal, 2006; Fryer and Levitt, 2006; Fryer, 2010), which likely relate to multigener-ational suppression of black skills under slavery and Jim Crow regimes (e.g., Margo, 2016).
31Interestingly, Bell (1935) also claims that white anti-Japanese attitudes in the early 20th centuryacknowledge high Japanese skill levels, citing as “typical” the following quote of V.S. McClatchy,
20
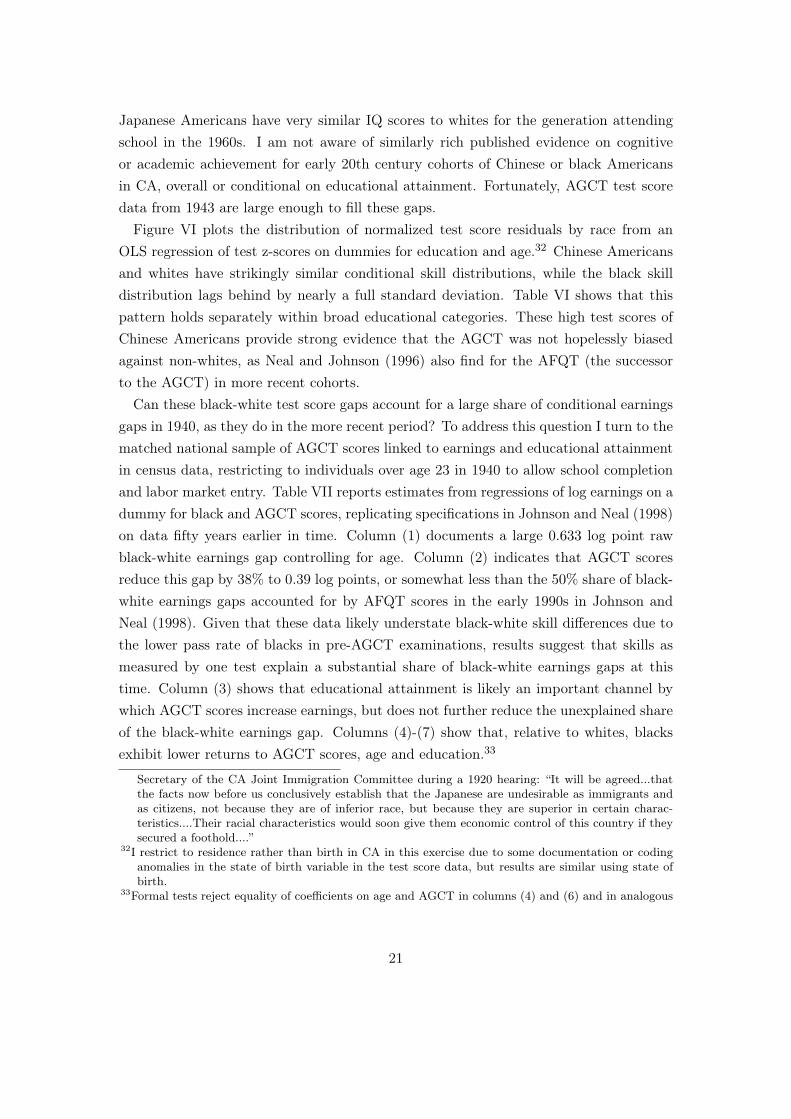
Japanese Americans have very similar IQ scores to whites for the generation attendingschool in the 1960s. I am not aware of similarly rich published evidence on cognitiveor academic achievement for early 20th century cohorts of Chinese or black Americansin CA, overall or conditional on educational attainment. Fortunately, AGCT test scoredata from 1943 are large enough to fill these gaps.
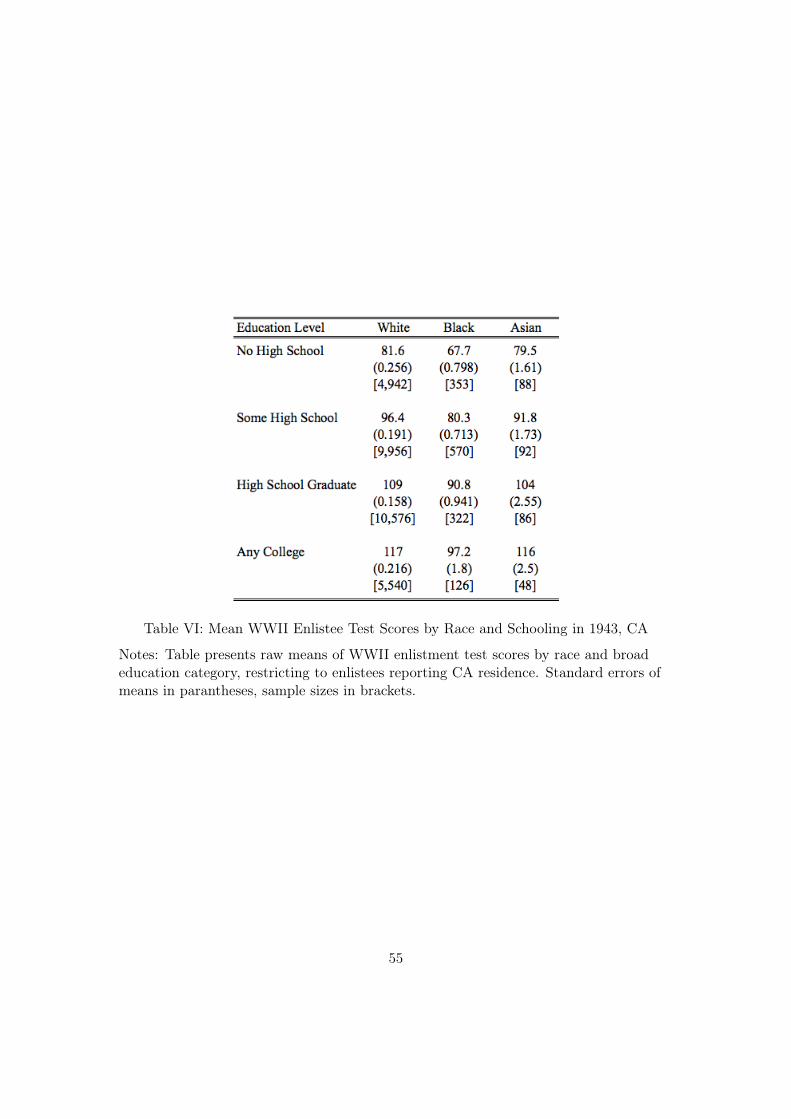
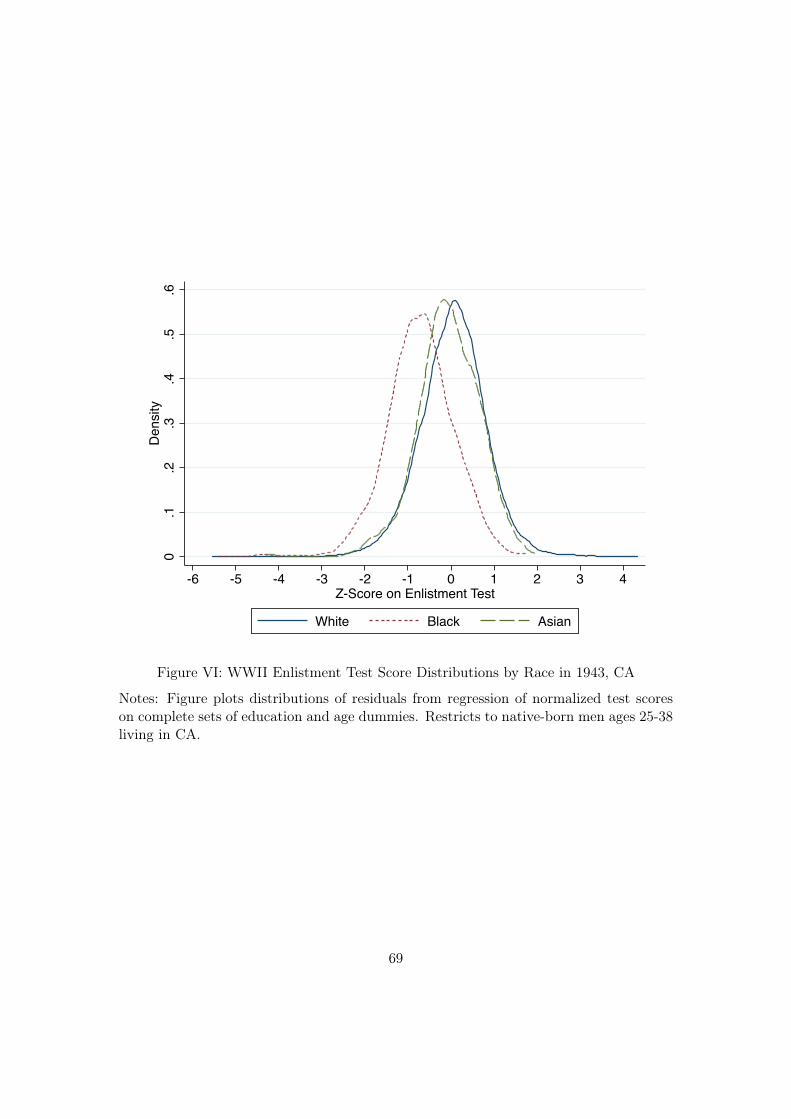
Figure VI plots the distribution of normalized test score residuals by race from anOLS regression of test z-scores on dummies for education and age.32 Chinese Americansand whites have strikingly similar conditional skill distributions, while the black skilldistribution lags behind by nearly a full standard deviation. Table VI shows that thispattern holds separately within broad educational categories. These high test scores ofChinese Americans provide strong evidence that the AGCT was not hopelessly biasedagainst non-whites, as Neal and Johnson (1996) also find for the AFQT (the successorto the AGCT) in more recent cohorts.
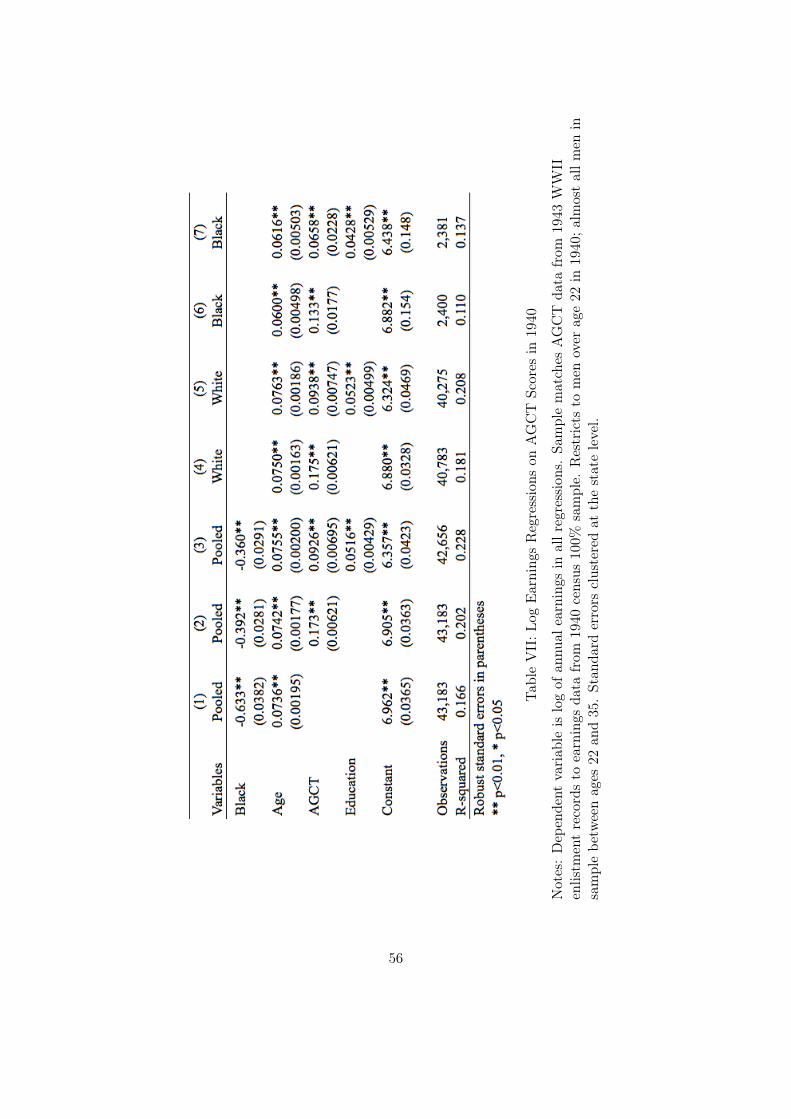
Can these black-white test score gaps account for a large share of conditional earningsgaps in 1940, as they do in the more recent period? To address this question I turn to thematched national sample of AGCT scores linked to earnings and educational attainmentin census data, restricting to individuals over age 23 in 1940 to allow school completionand labor market entry. Table VII reports estimates from regressions of log earnings on adummy for black and AGCT scores, replicating specifications in Johnson and Neal (1998)on data fifty years earlier in time. Column (1) documents a large 0.633 log point rawblack-white earnings gap controlling for age. Column (2) indicates that AGCT scoresreduce this gap by 38% to 0.39 log points, or somewhat less than the 50% share of black-white earnings gaps accounted for by AFQT scores in the early 1990s in Johnson andNeal (1998). Given that these data likely understate black-white skill differences due tothe lower pass rate of blacks in pre-AGCT examinations, results suggest that skills asmeasured by one test explain a substantial share of black-white earnings gaps at thistime. Column (3) shows that educational attainment is likely an important channel bywhich AGCT scores increase earnings, but does not further reduce the unexplained shareof the black-white earnings gap. Columns (4)-(7) show that, relative to whites, blacksexhibit lower returns to AGCT scores, age and education.33
Secretary of the CA Joint Immigration Committee during a 1920 hearing: “It will be agreed...thatthe facts now before us conclusively establish that the Japanese are undesirable as immigrants andas citizens, not because they are of inferior race, but because they are superior in certain charac-teristics....Their racial characteristics would soon give them economic control of this country if theysecured a foothold....”
32I restrict to residence rather than birth in CA in this exercise due to some documentation or codinganomalies in the state of birth variable in the test score data, but results are similar using state ofbirth.
33Formal tests reject equality of coefficients on age and AGCT in columns (4) and (6) and in analogous
21
Taken as a lower bound on the effect of individual skills on earnings, these resultscan explain a substantial share of black-white earnings gaps nationally and in CA in1940. They also imply that full, belated compensation of individual Asian skills afterWWII could account for a substantial share of the decline in the Asian-white conditionalearnings gap by 1970. A rapid change in factor prices for non-white groups with verydifferent factor endowments is therefore one potential explanation for Asians’ divergentgrowth.
8. Social Multipliers in Skill
The above results suggest an important potential role for compensation of individual skillin explaining group earnings dynamics in CA. There are also many reasons to supposethat group skills at the market level may have additional effects on group earnings. Forexample:
• Employers may find it more costly to exclude higher-skilled groups if firms earngreater profits on higher-skilled workers due to pay compression (e.g., Frank, 1984;Acemoglu and Pischke, 1999), or if labor markets for higher-skilled workers aretighter (Biddle and Hamermesh, 2013; Baert et al., 2015).34
• Racial prejudice may represent exaggerated stereotypes causally dependent on a“kernal of truth” about lower-skilled groups (Bordalo et al., 2016).35
regressions (not shown) replacing AGCT with education. I also reject equality of coefficients on age incolumns (5) and (7), as well as joint equality of both AGCT and education across races. Additionalcontrols for hours and weeks worked in these regressions are highly significant but do not reducethe black-white earnings gap further in my sample. Using levels rather than logs, and imputing lowearnings for observations with missing earnings, do not change any of the qualitative results discussedhere. Quadratic terms in AGCT scores are underpowered so I omit them.
34An anecdote in Bain (2000) illustrates this theory. Apparently, railroad employers were highly prej-udiced against Asians in the late 19th century and dismissed them as potential workers, but imme-diately changed their hiring policy upon observing credible evidence of Asians’ high productivity.Booker T. Washington can also be interpreted as advocating this theory, stating that “...as the Ne-gro learned to produce what other people wanted and must have, in the same proportion would hebe respected” Washington (1901). Formalizing this theory would be an interesting task for futureresearch.
35This story is very different from statistical discrimination, which does not require any racial prejudice.There are many examples in US history of higher-skilled individual members of minority groupsexpressing concern about white prejudice inspired by perception of low skills in their broader group.Caro (1975, p. 31) claims that higher-skilled German Jews in New York “realized that non-Jews werelumping them all together, taking the behavior of the newcomers as the stereotype by which theythought of all Jews,” and reacted by seeking to “make the shabby immigrants ’respectable’...” Taylor(1928, p. 82) refers to “"the social ostracism by Americans to which middle and upper-class Mexicansare subject in common with their fellow-nationals,” and claims “[Upper-class Mexicans] profess tounderstand why [white] Americans do not want Mexican laborors as neighbors; but that the same
22
• Higher-skilled groups may contain more managers and business owners who mayact as unprejudiced employers of their own group members.
All of these theories suggest “social multiplier” effects in which a group’s market-wideor aggregate skill distribution can affect group members’ earnings more than would bepredicted by effects of individual skills. Unlike statistical discrimination, these theoriespredict that group mean earnings gaps typically exceed group mean producitivity gaps.36
This point can be demonstrated using a standard linear-in-means peer effects frame-work (e.g., Borjas, 1992; Glaeser et al., 2003). For log earnings yijr and test score xijr
of individual i in market j and race r 2 {w, b}, let log earnings be determined by thetrue relation
where �b denotes the residual black-white log earnings gap, and xjr,�i ⌘ E [xijr|j, r,�i]
or mean test scores of an individual’s own-race peers within a market. I assume eijr ? j, r
to abstract from endogenous sorting. Consider the “short” linear predictor yijr = ↵+ �b+
�xijr + eijr, as estimated above in Table VII and in Neal and Johnson (1996); Johnsonand Neal (1998) on national samples. If blacks tend to have lower-skilled peers such thatCov (1 {r = b} , xjr,�i) < 0, then the short regression understates the share of black-whiteearnings gaps accounted for by black-white skill gaps (�b < �b 0) and the predictedearnings gains associated with group skill improvements (� < �+�). Two approaches canrecover �b and � + �. First, I can include xjr,�i in the regression on matched microdatato estimate equation (5) directly. Second, I can run a version of the short regression ondata aggregated to the level of market and race, yjr = ↵+ �b + �xjr + ejr, which yields�b = �b and � = � + �b. This approach does not require microdata, and therefore allowsme to use the full, unmatched versions of the test score and earnings data, which maybe more representative.
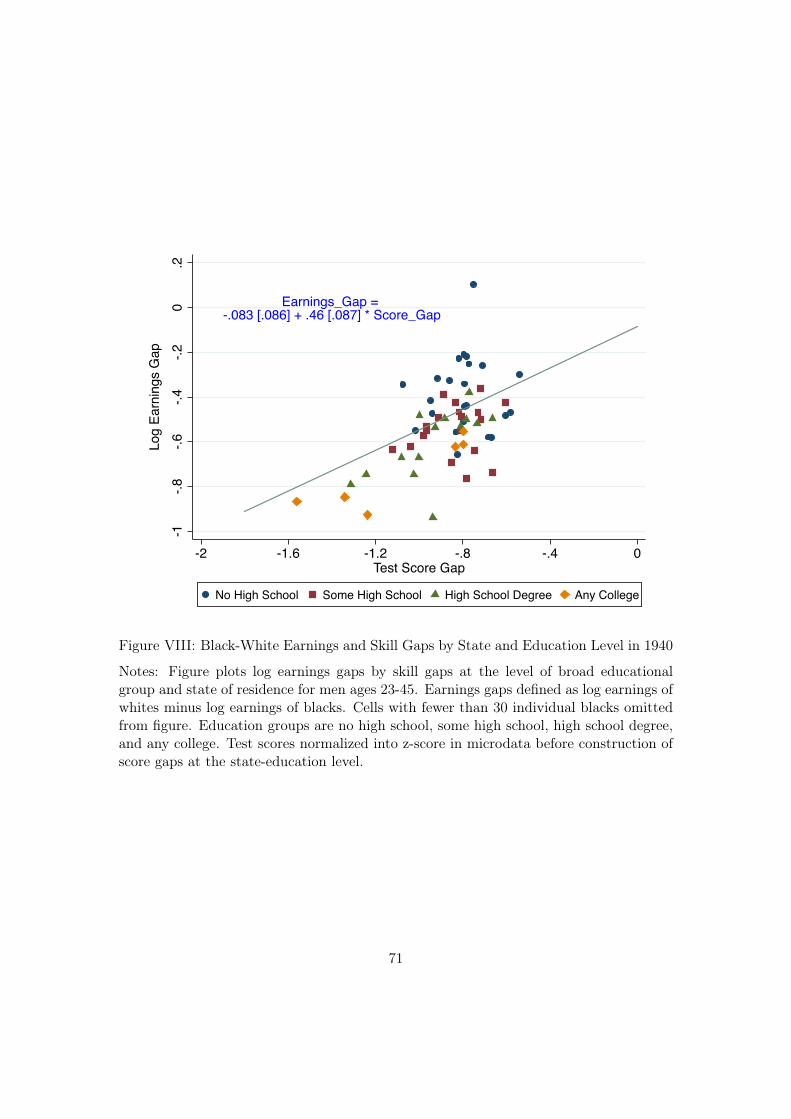
I am unable to test for social multiplier effects in a causal sense due to a lack of exoge-nous variation in group skills, implying potential violations of the assumption eijr ? j, r.However, I can assess whether non-experimental correlations suggest a large potentialrole for social multipliers. I first divide the US into “labor markets” defined by state andfour broad education categories: no high school, some high school, high school degree,
ostracism should be extended to them is bitterly resented.”36These mechanisms also differ from the “ethnic capital” concept in Borjas (1992, 1995); Leon (2005).
Borjas suggests that a person’s own human capital may depend on the aggregate human or financialcapital of her ethnic community during childhood. I am suggesting that the compensation a personreceives for her previously-accumulated human capital may depend on the human capital of hercontemporary peers in the labor market.
23
and any college. I then aggregate earnings by markets and race for men ages 23-38 inthe 1940 100% census, and WWII enlistment test z-scores based on the national scoredistribution for men ages 23-38. Figure VIII plots earnings gaps against test score gapsacross all labor markets along with the estimated regression line. Strikingly, the impliedrelationship predicts small black-white earnings gaps in hypothetical markets withoutblack-white skill gaps, although this prediction is far out of sample. To my knowledge,even this cross-sectional correlation has not been documented previously due to datalimitations.37
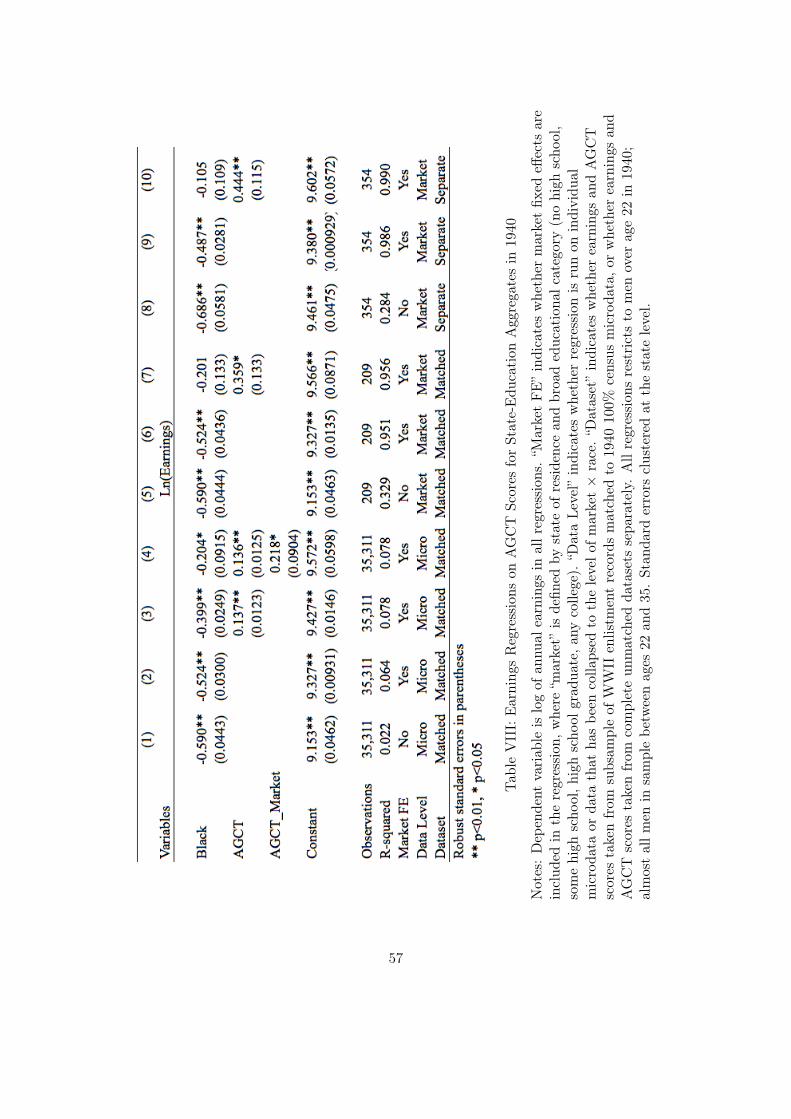
Table VIII presents fixed effects regressions of log earnings on a black dummy variableand AGCT scores in a variety of specifications. In Columns (1)-(3), I estimate a simplifiedversion of the regression in Table VII in the matched microdata. Column (1) documentsa slightly larger black-white earnings gap without age controls. Column (2) controls formarket fixed effects (state ⇥ broad education group), and shows that black-white earningsgaps fall slightly. Column (3) once again shows that AGCT scores account for a slightlysmaller share of black-white earnings gaps in this simpler specification: about 25% ratherthan the 38% reported above. Column (4) adds mean peer test scores to the specification.Consistent with important social multipliers, the black dummy declines dramaticallyand the coefficient on peer scores is large conditional on own scores. Columns (5)-(7)replicate columns (1)-(3) on matched data aggregated to the level of race and market.Again consistent with an important role for intra-group spillovers, the coefficient onAGCT score nearly triples in the aggregate specification, and now accounts for over 60%of black-white earnings gaps. However, these specifications are limited by the smallerand potentially less representative nature of the matched sample, which only containsa subset of all potential markets due to missing data. Therefore, in columns (8)-(10) Ionce again estimate specifications from columns (1)-(3), but now on the full samples oftest score and earnings data without restricting to the matched sample. These columnsstrengthen the findings from the matched sample: the coefficient on group-level AGCTin column (10) is now well over three times its microdata analogue in column (3) andeliminates nearly 80% of the black-white earnings gap.
These results have interesting implications for interpreting Asian upward mobility.Suppose CA labor markets failed to recognize Asians’ skill advantage over local CAblacks in 1940. And suppose that once institutional discrimination declined in the post-war economy, labor markets gradually and fully compensated Asians for this persistent
37The NLSY is too small to estimate black-white test score gaps by state. NAEP data are large enough toestimate black-white test scores by state, but does not contain final educational attainment. ProjectTalent data contain educational attainment at ages 23 and 29 but only for subsets that responded tovoluntary followup surveys.
24
skill advantage over CA blacks at the rate of 0.44 log earnings points per standarddeviation in group test scores (as in Column 10 of Table VIII). This would account forvirtually all of Asians’ extraordinary upward mobility.
Of course, these findings could also be driven by measurement error in individualhuman capital, whereby market-level mean test scores proxy for individual skills (Borjas,1992, 1995); this would represent a different mechanism, but would still be consistentwith the idea that skills largely explain Asians’ upward mobility. The patterns here couldalso be driven by unobserved variables that merely correlate with mean group test scores,such as white prejudice. Distinguishing these theories would require long-term, quasi-experimental variation in peer skills combined with credible measures of labor marketdiscrimination across different markets.
9. Other Explanations for Asian Economic Divergence
So far I have emphasized a key role for Asians’ high initial skills, and the fact that theseskills appear to have been uncompensated in pre-war CA labor markets, in accountingfor Asians’ rapid economic ascendance in the post-war atmosphere of declining discrim-ination. In terms of the conceptual model in section (3), I emphasize the interactionbetween Asians’ ancestral legacy of high skill on the one hand, and improvements in thepost-war contemporary environment for non-whites in CA on the other. However, I haveonly examined non-experimental variation in skills across racial groups and broad, de-scriptive variation in discrimination across groups and over time. Therefore I am not ableto exclude important roles for other aspects of these groups’ ancestral legacies that cor-relate with skills, or more subtle variation in these groups’ contemporary environments.Despite this uncertainty, I argue that my interpretation has important advantages overcompeting explanations.
One alternative explanation is that harsher pre-war discrimination against Asians thanblacks in CA left more room for improvement in Asians’ contemporary environment after1940, and that these larger improvements could have increased Asian earnings even inthe absence of large, previously uncompensated stocks of human capital. Given thatAsians exhibit very similar earnings to blacks in 1940 despite their much higher skills,it is plausible that Asians experienced larger subsequent reductions in discrimination.However, recall that Asian conditional earnings increased after WWII by a sensational0.4 log points relative to CA-born blacks. This is equivalent to something like 4 yearsof educational attainment—an entire college degree! While not impossible, it is hard toimagine that discrimination fell so much more for Asians than local blacks over the 1940-
25
70 period that labor markets awarded Asians but not blacks the equivalent of a collegedegree. It is also implausible that relative improvements in Asian school quality accountfor these gains, which are four times larger than the 0.1 log point relative earningsgains achieved by black high school graduates born in the segregated South betweenthe 1910s and the 1940s due to (surely much larger) relative school quality gains (Cardand Krueger, 1992b). Moreover, I am not aware of any candidate historical forces thatwould have generated such a seismic reduction in discrimination toward Asians but notother CA non-white groups. 38 Given the evidence presented above, it seems morelikely that post-war labor markets in CA opened up in some roughly similar way for allnon-whites, and this gave Asians the room they needed for competitive labor markets tofinally reward their skills. It would be a remarkable coincidence if special post-war gainsin labor market access for Asians specifically, unrelated to high Asian skills, happened togenerate relative gains in Asian conditional earnings that lined up so nicely with returnsto market-level group skill in 1940.
In Section, 6 I argue that factors increasing Asians’ educational mobility, such asdifferent group preferences for education, have played a significant but secondary roleamong the CA-born compared to factors affecting how Asians received compensationfor their skills, and played no role at all for CA-born young adults in 1940. Englishfluency is also unlikely to play a significant role given my focus on CA-born Asians, thevast majority of whom attended integrated schools with many other US-born childrenof other races starting early in childhood (Wollenberg, 1978); I also find nearly identicalresults when I restrict to US-born Asian parents as well as CA-born children.
Table IX displays many additional outcomes for black and Asian parents ages 25-55with CA-born co-residing children in every 20th century census year.39 Some factors areroughly similar for blacks and Asians in most years, including marital status and fertility,casting doubt on any central role for quantity-quality tradeoffs in children (e.g., Beckerand Tomes, 1976; Chiswick, 1988). Asians have slightly greater labor supply, total familyincome in 1950, and likelihood of collecting non-labor income in 1940. However, thesedifferences in non-human capital do not appear large enough to explain Asians’ sharp
38All of the important legislation and court cases overturning legal discrimination against native-born
Asians in CA applied to all non-whites generally (i.e. residency, marriage, employment, and laborunions); removal of Alien Land Laws and special anti-Asian taxes only applied directly to foreign-born Asians. Almost no Asians ever attended segregated “Oriental” schools. Meanwhile, the US hadjust completed a major war against Japan, and China had become a communist dictatorship—notobviously auspicious tidings for white American views toward Asians.
39This sample becomes less comparable across races in more recent decades as rates of single parenthoodhave risen, implying greater exclusion of lower-SES fathers from my sample in groups with higherrates of single parenthood. Unfortunately, the census only asks women about fertility, and thereforeco-residence remains the only method for restricting the sample to parents.
26
subsequent divergence. The largest differences are that Asian parents have been morelikely to live outside cities, self-employ, and rent rather than buy their own homes. It ispossible that something about rural, renting, self-employed lifestyles chosen by Asians inthe early-mid 20th century set their children on a path to greater income growth, and thatthese adult economic choices were not related to Asians’ large cognitive skill advantageover blacks. For example, Asians could have made different choices due to differentpreferences, rather than different skill endowments, and it may be that these preferencesthemselves or the choices they enabled gave their children economic advantages.
While I cannot reject this explanation conclusively, it is less attractive than explana-tions based on human capital endowments. Living outside cities in rented homes hasnot previously been considered a major advantage for children. Bates (1997) providesevidence suggesting that self-employment among immigrants often reflects an absenceof more-preferred labor market opportunities, rather than a preference for entrepreneur-ship or a desire to expose children to distinct skills associated with running one’s ownbusiness. Indeed, Asians’ self-employment rate fell dramatically as their labor marketopportunities expanded and no longer exceeded that of whites by 1980, suggesting self-employment was not a deep cultural preference or deliberate child-rearing strategy butrather a high-skilled group’s temporary response to discriminatory constraints.
10. Robustness
Throughout the analysis I have excluded households with zero and missing total earnings(head + spouse) from the analysis. Many of these zeros represent self-employed familieswith positive labor supply and business income, and many others likely represent mea-surement error or transitory earnings shocks. An alternative approach is therefore toimpute positive household earnings for these households and include them in the anal-ysis. I implement this by calculating average household earnings among all individualswith non-zero earnings in cells defined by year, race, age, sex, education, marital status,and state or country of birth. I assign cell means to individuals with zero and missingearnings based on this set of characteristics, roughly following Autor et al. (1998). Inhouseholds with two earners I take the maximum of these two predictions. For house-holds with zero earnings I follow Neal (2006) and adjust for selection by multiplyingimputed household earnings by 0.6. While this method is ad hoc, it provides a roughcheck on whether households with zero and missing earnings are likely to be driving themain results. Using this new income variable I re-estimate the main results from pseudo-panels in Section 5 and counterfactual black-white earnings gaps in Section 6. Appendix
27
Figures (A.10)-(A.11) document that the main results are largely unchanged.Focusing on household earnings may confound group variation in earnings with group
variation in rates of single parenthood. To examine this I re-estimate group dynasticgrowth rates as in Section 5 using fathers’ and sons’ individual earnings rather thantotal household earnings. Appendix Figure A.12 documents that the results are virtuallyunchanged.
Duncan and Trejo (2016) document that 20% of second-generation Asian Americans inthe 2000s report their race to census enumerators as “white,” and that these Asians tendto have lower schooling than other Asians. However, I find that Asians exhibit unusuallyhigh dynastic growth rates in pseudo-panels for every cohort born in the CA after 1920,and that Asians experienced rapid declines in conditional earnings gaps by the late 1960s.While I cannot rule out a role for endogenous ethnic identification in these results, it seemslikely that a very low share of Asians would have identified themselves as white to censusenumerators in these earlier decades. Note that intermarriage of Asians with whitesincreased dramatically only after 1970, suggesting widespread cultural assimilation tookplace after the main results documented in this paper.
11. Conclusion
In this paper I have set up a context and framework for understanding the remarkableeconomic ascendance of Asian Americans, a “non-white” racial group that experiencedsevere, long-term institutional discrimination yet emerged with incomes similar to whitesby the 1970s. I focus on Asian, black and white children born in CA, which is by far theprimary mainland destination of Asians historically and also the only state with largeenough populations of both Asians and blacks to conduct detailed historical comparisons.
As context, I show that US immigration policy generated positive selection of Asiansboth into migration and family formation, that Asians likely experienced similar or worseprejudice and legal discrimination than blacks living in CA before the 1960s, and thatall of the harshest forms of legal (though not necessarily de facto) discrimination againstnon-white minorities in CA disappeared during the period 1943-59. I then address threemain questions.
Question 1: Does high Asian income reflect high dynastic income growth, or
compositional effects of new immigration? I exploit pseudo-panels linking parentalincome to future income of CA-born children to distinguish group intergenerational in-come mobility from compositional effects of migration. I find that Asian dynasties exhibitextraordinary upward intergenerational mobility. Asian children embody “divergence” in
28
the form of a “rich getting richer” pattern toward local blacks and a “reversal of fortune”pattern toward local whites, in every cohort born in CA since at least the 1920s.
Question 2: Why did Asians achieve more rapid dynastic income growth
than other groups? To explore potential mechanisms underlying Asians’ rapid upwardmobility, I estimate an intergenerational decomposition of group earnings into parentalincome distributions, educational mobility, and children’s earnings conditional on edu-cation. I quantify the importance of these three components by permuting them acrossgroups to construct counterfactual black-white earnings gaps in the next generation.Contrary to public perception, gains in Asian earnings conditional on education haveplayed the dominant role in Asian upward mobility, with a significant but secondary rolefor higher educational mobility, and no significant role for higher parental income.
Question 3: Why were Asians but not blacks able to close their conditional
earnings gap? I exploit a large sample of WWII enlistee cognitive test scores from1943, along with prior research, to assess the contribution of skill gaps to Asian andblack conditional earnings gaps in 1940 in CA. I find large test score gaps for blacksconditional on education, but not for Asians. Asians’ large earnings gaps in the absenceof any observed human capital gap is, to my knowledge, unique among non-white racialgroups in US history (e.g. Trejo, 1997; Hurst, 1997). In national samples combiningdata on test scores, earnings, and education, I find that individual AGCT test scorescan account for 40% of black-white earnings gaps, and that mean group skill gaps acrosslabor markets can account for 80% of black-white mean earning gaps. These market-level effects of mean group skills are large enough to explain relative conditional earningsgains experienced by Asians 1940-70 in CA—and hence Asian upward mobility—underthe assumption that the Asian group-level test score advantage over other non-whiteswas uncompensated in 1940 and fully compensated by 1970.
I conclude that Asian history can be interpreted as a case study in which a largepre-war racial earnings gap almost surely driven by prejudice, rather than productivity,failed to survive post-war removal of harsh legal discrimination. I argue that Asians’ highinitial skills—an ironic byproduct of America’s anti-Asian exclusion policies—interactedwith declining discrimination against all non-whites in CA during the 1943-1959 periodto generate faster Asian economic progress. While this explanation is consistent withthe large magnitude of Asians’ early skill advantage and subsequent earnings gains, it ispossible that aspects of Asian and black ancestral legacies other than skills, or differentialpost-war changes in the contemporary environment facing these groups, could also haveplayed important roles in Asian economic progress. Distinguishing these theories moreconclusively represents a challenging task for future research.
29
NOT FOR PUBLICATION
A. Institutional Discrimination Against Asians and Blacks inCalifornia
Asians have long faced severe political discrimination. Foreign-born Asians were barredfrom naturalization by the Naturalization Act of 1790. This Act excluded Asians fromcitizenship and voting except by birth, and created the important new legal category of“aliens ineligible for citizenship” that would prove useful in crafting future discriminatorylaws. Both Asians and blacks in CA could not testify against a white witness in courtfrom 1853-73 (People v. Hall, 1853, see McClain, 1984), limiting Asians’ legal defenseagainst white aggression. The Chinese Exclusion Act of 1882 and the “Gentlemen’s Agree-ment” in 1907 barred further immigration of all “laborers” from China and Japan, withexceptions for Asian “merchants,” diplomats, students, and teachers and in some casesthe wives of prior Asian residents. Subsequent laws and practices served to encouragereturn-migration and facilitate deportation of lower-skilled Asians, while still allowingcertain higher-skilled and higher-wealth Asians to stay in the US and bring in wives andchildren from Asia (McKenzie et al., 1927; Hutchinson, 1947; Lee, 2005; Daniels, 1990;Chan, 1991).40 Below, I show direct evidence on skill-biased positive selection of Asiansinto both migration and parenthood, consistent with these institutional constraints. Incontrast, CA has never screened black migrants on occupation, skill, wealth, or any othercharacteristics.
Asians have also faced intense economic discrimination. Many cities and states levieddiscriminatory taxes and fees on Asians (1852 Foreign Miner’s Tax, 1852 CommutationTax, 1860 Fishing License, 1862 Police Tax, 1870 “queue” ordinance, 1870 sidewalk or-dinance, and many others). Many professional schools and associations in CA excludedAsians (e.g., State Bar of CA), as did most labor unions (e.g., Knights of Labor, Ameri-can Federation of Labor), and many employers declined to hire Asians well into the 20thcentury (e.g., Mears, 1928, p. 194-204). From 1913-23, virtually all western states passedincreasingly strict Alien Land Acts that prohibited foreign-born Asians from owning land
40Amendments to the Chinese Exclusion Act from 1882-1932 excluded many other smaller-scale mer-chants from exempted classes, eventually requiring proof of international trade with one’s countryof origin (Lee, 2005, pg. 90-91). The Scott Act of 1888 deported over 20,000 Chinese laborers whohappened to be abroad at time of the law’s passage. The Geary Act of 1892 required all Chinese toprove lawful status on demand or face punishment and deportation. The US Supreme Court caseUnited States v. Ju Toy 1905 restricted due process and habeas corpus petitions for anyone enter-ing the US including Chinese with US citizenship. The Gentlemen’s Agreement of 1907 caused theJapanese to screen potential migrants on wealth, occupation, and other characteristics, implementedin part through the Japanese Associations of America (Daniels, 1990). The Immigration Act of 1917created an “Asiatic Barred Zone” excluding other East Asian countries (not Japan) with broaderexceptions for some highly-skilled workers (lawyers, physicians, chemists, civil engineers, etc.), in-troduced literacy requirements for any immigrant over age 16, and expanded discretionary powersof US immigration officials to reject immigrants on these and other grounds. The National OriginsAct of 1924 barred immigration of all foreign-born Asians, including Japanese, as “aliens ineligiblefor citizenship,” yet continued exceptions for wives and children of Chinese merchants.
30
or leasing land for extended periods.41 Asians also faced laws against marriage to whites(1905 amendment to Section 60 of the CA Civil Code) and US citizens (Expatriation Act1907, Cable Act 1922). From 1942-46, the US forcibly relocated over 100,000 mainlandJapanese Americans to military detention camps, in practice destroying a large share ofJapanese American wealth. In contrast, blacks in CA were eligible for citizenship andsuffrage, were officially (though often not de facto) included in CA professional associa-tions and labor unions that excluded Asians, were not covered by the Alien Land Acts,and were not confined or expropriated during WWII.
In education as well, Asians in CA faced legal disadvantages relative to blacks after1890, when the CA Supreme Court ruled in Wysinger v. Crookshank (83 California 593,1890) that CA school laws allowed de jure segregation of Asians and Native Americansbut not blacks or other racial groups (Stephenson, 1910; U.S. Commission on Civil Rights,1977; Wollenberg, 1978). In keeping with this decision, after 1890 a small minority ofAsians in CA did attend de jure segregated schools in San Francisco and Sacramento(Kersey, 1933, pg. 429;Wollenberg, 1978). Evidence suggests that these few cases offormal segregation did reduce school quality for affected students. In district financialreports, the Commodore Stockton “Oriental school” segregating Chinese students in SanFrancisco ranked near the bottom of 106 district elementary schools in per-pupil spend-ing during the 1920s, with spending around 80% of the median school (San Francisco,California, 1924, and other years through 1929).42 Likewise Bell (1935) finds slightlyworse outcomes for Japanese students segregated into Oriental schools in SacramentoCounty. In contrast, there is no documentation of any de jure segregated black schoolsin CA after 1890. Indeed, Graaf et al. (2001, e.g., pages 14, 137) suggests that access torelatively high-quality (Ayres, 1920), racially integrated public schools attracted manySouthern blacks to CA.43
De facto educational segregation of non-white minorities did take place in CA, thoughless comprehensively than in the South (Hendrick, 1975; U.S. Commission on Civil Rights,1977; Wollenberg, 1978; Graaf et al., 2001; Torres-Rouff, 2012). The primary instrumentsof segregation were “restrictive covenants” excluding non-whites from residential neigh-
41Higgs (1978) argues that Alien Land Laws had little practical effect on Asians due to a variety ofloopholes, though Azuma (1994) provides a case study suggesting otherwise.
42Japanese students in San Francisco were not segregated. An attempt to segregate Japanese studentsin San Francisco at the start of the 20th Century led to the Gentleman’s Agreement in 1907, in whichCA agreed not to segregate Japanese students, and Japan agreed to prevent further immigration ofJapanese laborers to the US (e.g., Wollenberg, 1978).
43Consistent with the cited references, I find no documentation of any formally “black” schools in CAin the following additional sources: “Accredited Secondary Schools in the United States” from everyavailable year 1928-1944 in which “Negro schools” are indicated with superscripts (Phillips and UnitedStates Office of Education, 1929; Carr and United States Office of Education, 1930; United StatesOffice of Education, 1933; Carr and United States Office of Education, 1934; United States Officeof Education, 1937; Carr and of Education, 1939; United States Office of Education, 1943; Carrand of Education, 1944), the “Directory of Secondary Day Schools” from years 1949 and 1952 (Riceand United States Office of Education, 1949, 1952), the Sears Sacramento School Survey VolumeII (1928), Auditor’s annual financial reports 1924-42 for Los Angeles, Annual Report of the FresnoPublic Schools 1900-37, and Annual report of the public schools of the City and County of SanFrancisco 1906-29.
31
borhoods along with “manipulation of school boundaries, the location of new schools, anda selective transfer policy” (Hendrick, 1975, pg. 190-191). Los Angeles contains the onlypre-war survey of racial composition across de jure integrated schools, including Asiansand blacks, of which I am aware. This survey was conducted confidentially in 1938 bythe School Board and discussed in Hendrick (1975, pg. 194). I digitize and link thissurvey to data on school inputs from annual financial reports (Board of Education of theCity of Los Angeles, 1938). Table A.1 characterizes schools attended by whites, blacks,Hispanics and Asians (predominantly Japanese Americans) in these data. All minoritiesattended schools containing many whites. While Asians attended schools with higherwhite shares than blacks, group variation in class size and spending per pupil is minimal.Why might Asians have gained greater access to predominantly white schools than otherminorities, despite similarly strong white prejudice against Asians? Evidence below sug-gests one reason: Asian and white children would have tended to possess similar cognitivepreparation for schooling, while blacks would have tended to lag behind and potentiallypose greater problems of classroom management.
Beyond San Francisco and Los Angeles, it is not likely that Asians faced dramaticallymore favorable educational environments than blacks in pre-war CA. Asian and blackschool-age children lived largely in the same counties in CA for most of the 20th cen-tury.44 And within counties Asians and blacks likely faced similar residential restrictions.Two unverified sources report that 80% of homes in Southern CA were unavailable foroccupancy by blacks (U.S. Commission on Civil Rights, 1973, pg. 4) or Asians (Lotchin,2011, pg. 174, footnote 57); Mangum (1940, pg. 149) asserts that restrictions in CA“generally include [Asians] as well as the Negro”; and many covenants quoted in publi-cations exclude both blacks and Asians or all non-whites (e.g., Shelley v. Kraemer (334US 1, 1948)). In San Francisco, Chinese apparently faced harsher residential restrictionsthan blacks before WWII (Broussard, 1993, p. 31-32), though in Los Angeles residen-tial restrictions appear to have affected all non-whites from the early 20th century Sides(2004, p. 17-18).
Finally, minorities tend to face more harsh educational segregation in places wherethey compose a larger share of the local school-age population (e.g., Margo, 1990; Cardand Krueger, 1992b), and this factor would have disadvantaged Asians relative to blacksin CA up through the 1940s.45
Many aspects of institutional discrimination against minorities in CA weakened after1940 and well before the federal Civil Rights Act of 1964. In 1941, President Rooseveltissued Executive Order 8802 prohibiting discrimination by race among government agen-
44Over the 1920-40 period, Asians were slightly more concentrated in San Francisco and Sacramento,and blacks were slightly more concentrated in Los Angeles, Alameda (Oakland) and San Diego. Infuture research, it would be useful to compare exact residential patterns for blacks and Asians in CA1900-1940, but processing residential address in the 100% census data for CA is beyond the scope ofthis paper.
45While Asians in CA were a larger share of local populations than blacks before 1940, they were stillvery sparse compared to blacks in the South at this time. For example, black and white schoolresource gaps were very large in Southern states in 1920 where black population shares exceeded50%, but were nearly equal in states with black population shares under 10% (Card and Krueger,1992b, Figure II). For comparison, in 1920 CA was 3.4% Asian.
32
cies and their contractors in defense industries, and related antidiscrimination ExecutiveOrders were issued by Presidents Truman, Eisenhower, Kennedy, and Johnson. In 1943,Congress overturned the Chinese Exclusion Acts and granted Chinese Americans eligibil-ity for naturalization. In 1946, CA Governer Earl Warren repealed state laws permittingsegregated schooling of Asians and Native Americans after federal courts declared de jureschool segregation for Mexican Americans illegal under CA state law (Wollenberg 1974,Mendez et al v. Westminister [sic] School District of Orange County, et al, 64 F.Supp.544 (S.D. Cal. 1946), affirmed, 161 F.2d 774 (9th Cir. 1947)). Also in 1946, 59% of CAvoters opposed strengthening the anti-Japanese Alien Land Law through Proposition15, contrasting with only 25% of CA voters who had opposed a similarly anti-Japaneseproposition in 1920. In 1948 the US Supreme Court invalidated restrictive covenants(Shelley v. Kraemer 334 US 1) and extended equal protection to “aliens ineligible to citi-zenship” in cases such as access to commercial licenses (Takahashi v. California Fish andGame Commission, 334 US 410), while the CA Supreme Court struck down all state lawsbarring inter-racial marriage (Perez v. Sharp, 32 Cal.2d 711). In 1952, the CA SupremeCourt declared all prior Alien Land Laws unconstitutional (Fujii v. California 38 Cal2nd 718). CA legislators began introducing bills to prohibit racial and religious discrim-ination in employment starting in 1945, and in 1959 CA passed the Fair EmploymentPractices Act prohibiting discrimination by employers, labor unions, and employmentagencies on the basis of race, religion, color, national origin, or ancestry.
These changes before 1960 all would have tended to increase competition for minorityworkers in the labor market by removing legal barriers to employment; by inducingvoluntary racial integration by firms and unions anticipating future legal developmentsor seeking excuses to end costly exclusionary policies only valued by some whites; andby eroding broad social norms required to sustain high levels of racial exclusion (e.g.,Heckman and Payner, 1989; Donohue and Heckman, 1991). I am not able to pin downcausal effects of any specific change in legislation or social norms on racial outcomes.Rather, I argue that all these changes suggest a relaxation of previously severe labormarket restrictions on minority workers over the decades after 1940.
Asians may have had one advantage in their contemporary environment over blacksin CA: ethnic community organizations such as the Chinese Six Companies and family“clans,” and the Japanese Associations of America Daniels (1990). These organizationslobbied on behalf of their communities at all levels of governments to curtail discrimina-tory legislation, with limited success. They also provided some social insurance and lawenforcement services, at points helped to screen potential migrants to comply with USexclusion laws and home countries’ national interests, and in the Japanese case openlyadvanced a cultural agenda of high educational attainment and model citizen behav-ior. It is difficult to quantify the advantages imparted to Asians by these organizations.However, blacks in CA also had many organizations serving similar purposes, includ-ing NAACP chapters, community groups, churches, and media outlets. Moreover, whileAsians may have benefitted from political support of their home countries, blacks in CAbenefitted more directly from the right to vote, which CA fully granted to black citizensboth de jure and de facto unlike many Southern states (Graaf et al., 2001).
33
B. Data Appendix
The decennial census is the only data set large enough and extending back far enoughin time to conduct detailed historical comparisons of Asians with other groups.46 I relyprimarily on census data from 1940-2000, when income and education are both available,though also make limited use of censuses back to 1850 (Ruggles et al., 2015). I rely onrecently digitized 100% sample 1940 census data, making it possible to examine minoritiesin pre-war CA and to match census data with test score data. I define “Asians” broadlyas Chinese, Japanese, and “Other Asian or Pacific Islander”, though most Asians upthrough 1970 were Chinese or Japanese. Asians have been identified in the census racevariable through “enumerator observation” (1850-1950) and self-reporting (1960-2000) inevery year back to 1850.47
I focus on household annual labor earnings (head + spouse) as my primary measure ofincome for several reasons: non-labor income is not available in the 1940 census, hourlywages suffer from measurement error in reported hours48 (Baum-Snow and Neal, 2009);both earnings of head and hourly wages do not capture total resources available for in-vestments in children’s education; and household wages allow pooling of male and femalechildren on a comparable footing in order to maximize sample size. I confirm robustnessof my main results to all these decisions in Section 10. I estimate the relationship betweenparental earnings and children’s education using the subset of children co-residing withparents in their late twenties after most children have completed schooling, and adjustfor missing independent children using the method developed in Hilger (2016).49
I also make use of recently-discovered World War II enlistment data containing ArmyGeneral Classification Test (AGCT) scores for a large sample of enlistees in 1943 (Fer-rie et al. (2012); also see Aaronson and Mazumder (2011); Carruthers and Wanamaker(2016)). The AGCT was intended to measure “ability to learn” in the army environment(not “innate” abilities) and contained 140-150 multiple-choice questions on vocabulary,
46The Current Population Survey is another large, long-standing survey. For this paper, census dataare preferable to CPS data because the March CPS begins in 1962, only introduces “Asian/PacificIslander” to its racial classification in 1988, and excludes military and incarcerated individuals fromits sample.
47Carter (2015) documents significant over- and under-counts of Chinese Americans in the 1940 fullcount data at the national level, but not in California (she reports a 3% under-count of ChineseAmericans in California). The over-count problem is generally much more severe. I adjust forthis problem in the 1940 full count data by setting the race variable to missing for individualsidentified as Chinese (Japanese) in states where fewer than 30% of Chinese (Japanese) report “mothertongue” of Chinese (Japanese). This results in dropping all Chinese Americans in Delaware, Ohio,Kansas, Missouri, Alabama, North Carolina, Oklahoma, and Tennessee and all Japanese Americans inMichigan, Minnesota, North Dakota, Alabama, Oklahoma, and Tennessee in 1940. This adjustmenthas very little impact on national statistics because these states are a small share of all Asians in theUS at this time.
48Neal (2006) imputes hours from CPS data, but the CPS does not separately identify Asians in its racevariable before 1988 and is too small to provide useful imputations for Asians in later years.
49In Hilger (2016), I show that the method generates educational mobility statistics that match differentmobility patterns across blacks and whites and time trends before the 1980s as measured in severalother survey datasets with complete parent-child linkages, and that correlate strongly with incomemobility variation across states after 1980 using tax data from Chetty et al. (2014).
34
arithmetic, and block counting. The test correlated strongly with IQ scores, displayedhigh reliability and validity, strongly predicted in-service and post-service occupations,and strongly correlated with satisfactory completion of military assignments. Impor-tantly, the AGCT sample contains a positively selected sample of enlistees because thetest was only administered to individuals who passed brief preliminary examinations ofphysical, educational, and emotional fitness (Bingham, 1946; Ginzberg, 1959). Overall,only 73% of white enlistees and 53% of black enlistees took the AGCT.50 Low educa-tional attainment and quality, roughly associated with sub-4th grade levels of literacy inspoken and written English, accounted for most of this racial discrepancy, though dis-crimination by white examiners and possibly greater ambivalence toward military serviceby blacks also played some role (Ginzberg, 1959; Smith, 2013).51 Despite lower initialpass rates for blacks, the military and hence the AGCT test score sample deliberatelymaintained racial balance by increasing the number of initial black enlistees (Ginzberg,1959, p. 120).52 Therefore AGCT scores likely understate black-white gaps in educationand cognitive skills in the broader population, and this should be kept in mind whendiscussing results below.
Despite these selection problems, this extraordinarily large sample of cognitive testscores allows me to conduct three novel empirical exercises. First, I separately examinetest scores of Chinese, black and white enlistees born in the 1920s and living in CA in1943, during a period when many Jim Crow laws were still in effect.53 Second, I matchthese test score data to 100% individual census data in 1940 to assess cross-sectionaleffects of individual test scores on earnings of young men. Third, I use test score andearnings data separately on full unmatched samples to compare black-white test scoreand earnings gaps across labor markets defined by state of residence and broad educationcategory.
I match AGCT and census data on exact state of birth, race, first name and lastname, and year of birth plus or minus one year.54 I obtain a match rate of nearly40%, which is high by the standards of census matching, perhaps due to the short timeinterval between the two datasets.55 Summary statistics for men in the 1940 census
50Previous work making use of these test scores does not appear to recognize this selection problem.51Malcolm X, for example, claims to have feigned a mental disorder during his psychological examination
to avoid military service (X et al., 1992).52Pre-AGCT preliminary exams took place on one-day visits of potential enlistees to “induction stations.”
Only individuals passing these tests would return several weeks later to “reception centers” for multipledays of more detailed testing including the AGCT intended to guide their occupational assignment inthe military (Hershey 1943, pg. 52-53 shows order of events, pg 50-51 documents share of whites andblacks reaching reception centers for AGCT testing, also seeLew 1944; Ginzberg 1959). I have beenunable to obtain the rejection rate for Chinese enlistees; Ginzberg (1959, p. 120 footnote) claims themilitary only published rejection rates for blacks and non-blacks separately.
53Japanese Americans are almost entirely unrepresented among WWII enlistees in 1943 due to theJapanese Internment policy following Pearl Harbor.
54I drop individuals who would be under age 23 in 1940 to assure that most individuals are no longerin school, and individuals with reported education under 5 years, which is the 2nd percentile ofeducation in this year.
55For example, Long and Ferrie (2013); Abramitzky et al. (2014) match males across multiple decennialcensuses and obtain match rates around 10-15%.
35
sample, the 1943 enlistment records sample, and the matched data, for both US andCA residents are presented in Table A.2. Chinese American men ages 18-38 represent0.8% of all CA residents in both the 1940 census and the test score data, consistent withoverall composition of WWII servicemen (Smith, 1947). Blacks are over-represented inthe test score data among CA residents, but under-represented at the national level asamong servicemen generally (Smith, 1947). Some of this discrepancy between US andCA samples may reflect rapid migration of blacks to CA between 1940 and 1943 (Graafet al., 2001). Overall, the test score data contain about 3% of men ages 18-38 in the1940 census, both for the US and CA. Table A.2 also indicates that the matched sampleis fairly representative of the AGCT data. Test scores are slightly higher in the matchedsample, but similarly dispersed. Age, education, and race are also similar in the matchedsample, with the exception that I match almost no Chinese Americans, most likely dueto difficulties matching Chinese names. I therefore only examine Asians in unmatchedtest score data.
Finally, in Section 3 and Appendix A I make use of novel historical datasets on schoolinputs at a Chinese segregated school in San Francisco in the 1920s, data on school inputsand racial composition of public schools in Los Angeles in 1938, narratives of workplacediscrimination contained in complaints filed to the federal Fair Employment PracticesCommittee in CA during WWII, and new data on racial composition of individual firmsin the Bay Area in 1943 and 1944 gathered by the War Manpower Commission duringWWII and shared with the Fair Employment Practices Commission in CA.
C. Basic Historical Trends: Aggregate Time Series
In this appendix I plot national aggregate outcomes by race over all available years ofdata, reweighted to match the white age and gender distribution in each year and re-stricting to ages 25-65. I focus on national trends with no further restrictions, ratherthan trends restricting to those born in the US or in CA, because national trends mayhave informed broader perceptions of Asian American history. To further illustrate theimportance of ancestral legacy, results in this section incorporate Native Americans as asecond “involuntary immigrant” group that has undergone multiple centuries of institu-tional discrimination in both human capital and labor markets (e.g., Page, 2004).
As discussed in the paper, these comparisons furnish useful historical context, but theyconfound intergenerational group mobility with compositional changes from migration(Borjas, 1987; Chen, 2011; Suzuki, 1995, 2002). Figure A.1 illustrates the magnitudeof this problem by plotting gross immigration flows into the US from various Asiancountries since 1820. The Chinese Exclusion Act, the Gentlemen’s Agreement, and the1965 Immigration Act are all discernable. On the right-hand axis, the dashed line labeled“Share” plots total Asian immigrant flows as a share of the total Asian population stockin the US in the previous decade, and indicates that migration flows were large relativeto stocks even before the 1965 Immigration Act, and much larger thereafter. Return-migration flows also affect the composition of Asians between censuses (Suzuki, 1995).Below I develop comparisons that partly address these problems.
36
Figure A.2a plots basic literacy rates (ability to read and write in any language) byrace and year, which captures some low minimum level of schooling.56 Asians had muchhigher literacy rates than blacks and Native Americans in 1870, but this gap had closed by1900. Figure A.2b plots average educational attainment by race and year. In every year1940-2000, Asians exhibit significantly higher education than all other groups, followedby whites, followed by blacks and Native Americans.
Figure A.3 plots log earnings of men 1940-2000. All three minorities reduce theirearnings gaps with whites after 1940. I also impute log earnings in earlier periods basedon occupation.57 Figure A.3b displays imputed log earnings of men from 1880-2000. Allminorities exhibit convergence toward whites over most of the last 150 years. However,blacks and Native Americans do not display any clear convergence toward Asians inactual or imputed earnings.
Table A.3 presents the most common occupation for each race by year, and sketchesout the different occupational trajectories underlying Figure A.3b. In 1860-80, manyAsians were “mine operatives and laborers.” Later Asians tended to work on farms aswage laborers, rather than tenants, again reflecting differences in regional economies.Asians then worked in restaurants, laundries and other service industries before shiftinginto more white-collar positions in late 20th century. In comparison, blacks and NativeAmericans tended to work on farms as tenants after the Civil War, and have remainedin lower-skilled agriculture and manufacturing throughout the 20th century.
Unsurprisingly given the different ancestral legacies discussed above, these aggregatenational trends characterize Asians as higher-skilled than other longstanding US minori-ties at every point over the past 150 years. The perception that Asians began theirhistory in the US disadvantaged by lower skills and earnings could potentially be truerelative to whites, but is not plausible when comparing Asians to blacks or Native Amer-icans at the national level. In contrast, trends in human capital and earnings among theCA-born are more consistent with this perception, as shown in Appendix Figures A.4-A.5. Among the CA-born, Asians and blacks appear similarly disadvantaged in 1940,but Asians rapidly overtake both blacks and whites in education and earnings over sub-sequent decades. Unfortunately, these figures also confound effects of intergenerationalgroup mobility with time-varying selective migration, now to an even greater extent dueto inter-state migration of blacks and whites in addition to international migration ofAsians.
56Only free blacks were asked about literacy by census enumerators through 1860, and only “taxed”Native Americans were asked about literacy up through 1870. I therefore drop these observationsfrom the figure due to concerns about selection. A fire destroyed the 1890 census.
57I follow Smith (1984) and Margo (1990) and impute earnings back to 1860 based on earnings inoccupations in 1940, allowing earnings to differ by native-born status and restricting to men ages25-65. I do not allow earnings to differ by race within occupations in this imputation. By fixingearnings within occupation the imputation provides a simple index of occupational quality. Toharmonize occupations across years I rely on the IPUMS variable OCC1950.
37
D. Testing Validity of Pseudo-Panels
I test the assumptions required to obtain valid pseudo-panels by testing for anomalouschanges in the size and gender composition of cohorts defined by place of birth.58 Ap-pendix Figures A.6-A.7 plot log frequencies for these cohort-blocks born in the US andCA, respectively. In a truly balanced pseudo-panel, cohort size weakly declines overtime due to death and out-migration. While I find this restriction is approximately sat-isfied in most cases, cohort size does increase between some censuses for some races.These violations may reflect inconsistencies in census sampling techniques or individuals’self-reported age, place of birth or race. However, the violations are typically small incomparison to the large changes in Asian population size and composition displayed inFigure A.1.59
I also assess the validity of these pseudo-panels by tracking their gender compositionover time. Earlier cohorts of Asians reporting US birth exhibit “excess” males due tomass falsification of US nativity records by largely male Asian migrants after the de-struction of immigration records in the 1906 San Francisco earthquake, and possibly dueto widespread incentives to avoid restrictions on foreign-born Asians through false nativ-ity papers (Bureau of the Census, 1914; Chang, 2004). If this “paper sons” phenomenonsomehow continued into later cohorts we would expect to see excess men or excess volatil-ity of gender ratios. Appendix Figures A.8 and A.9 plot the share of men in each of thesecohorts and races for native-born and CA-born cohorts, respectively. The figures doc-ument a male share very close to 50%, falling slightly as cohorts age, which is exactlythe pattern that would arise from valid pseudo-cohorts due to the greater longevity ofwomen. While there are some anomalies for certain cohorts in certain years, the selectedpseudo-cohorts appear reasonable based on both stable frequencies and gender balanceover time.
58These tests are not perfect because consistent cohort size may conceal changes in the composition ofthe cohort from migration flows that cancel out on net.
59Reweighting the pseudo-cohorts to maintain an internally-consistent age distribution over time has nosignificant effect on the results.
38
References
Aaronson, D. and B. Mazumder (2011): “The Impact of Rosenwald Schools on BlackAchievement,” Journal of Political Economy, 119, 821–888.
Abramitzky, R., L. P. Boustan, and K. Eriksson (2014): “A Nation of Immi-grants: Assimilation and Economic Outcomes in the Age of Mass Migration,” Journalof Political Economy, 122, 467–506.
Acemoglu, D. and J.-S. Pischke (1999): “The Structure of Wages and Investmentin General Training,” Journal of Political Economy, 107, 539–572.
Aigner, D. J. and G. G. Cain (1977): “Statistical Theories of Discrimination in LaborMarkets,” Industrial and Labor Relations Review, 30, 175–187.
Arrow, K. (1972): “Some Mathematical Models of Race in the Labor Market,” in RacialDiscrimination in Economic Life, ed. by A. H. Pascal, Lexington, MA: LexingtonBooks.
Arrow, K. J. (1971): “Some Models of Racial Discrimination in the Labor Market,”Rand Memorandum 6253-RC.
Autor, D. H., L. F. Katz, and A. B. Krueger (1998): “Computing Inequality:Have Computers Changed the Labor Market?” Quarterly Journal of Economics, 113,1169–1214.
Ayres, L. P. (1920): An Index Number for State School Systems, Department of edu-cation, Russell Sage foundation.
Azariadis, C. and A. Drazen (1990): “Threshold Externalities in Economic Devel-opment,” The Quarterly Journal of Economics, 105, 501–526.
Azuma, E. (1994): “Japanese Immigrant Farmers and California Alien Land Laws: AStudy of the Walnut Grove Japanese Community,” California History, 73, 14–29.
Baert, S., B. Cockx, N. Gheyle, and C. Vandamme (2015): “Is There LessDiscrimination in Occupations Where Recruitment Is Difficult?” ILR Review,0019793915570873.
Bain, D. H. (2000): Empire Express: Building the First Transcontinental Railroad, NewYork: Penguin Books.
Barro, R. J. and X. Sala-i Martin (1992): “Convergence,” Journal of PoliticalEconomy, 100, 223–251.
Bates, T. (1997): Race, Self-Employment, and Upward Mobility: An Illusive AmericanDream, Woodrow Wilson Center Press.
39
Baum-Snow, N. and D. Neal (2009): “Mismeasurement of Usual Hours Worked Inthe Census and ACS,” Economics letters, 102.
Becker, G. (1957): [1971] The Economics of Discrimination, Chicago: University OfChicago Press, 2nd edition ed.
Becker, G. S. and N. Tomes (1976): “Child Endowments and the Quantity andQuality of Children,” Journal of Political Economy, 84, 143–162.
Bell, R. (1935): Public school education of second-generation Japanese in California,California: Stanford University press.
Biddle, J. E. and D. S. Hamermesh (2013): “Wage discrimination over the businesscycle,” IZA Journal of Labor Policy, 2, 7.
Bingham, W. V. (1946): “Inequalities in Adult Capacity From Military Data,” Science,104, 147–152.
Board of Education of the City of Los Angeles (1938): “Controller’s AnnualFinancial Report For the FIscal Year Ending June 30, 1938,” Tech. rep.
Bogardus, E. S. (1926): “Social Distance: A Measuring Stick,” The Survey, 169–171.
——— (1928): Immigration and race attitudes, D.C. Heath, google-Books-ID:OdK5f9e6tukC.
——— (1959): Social distance, Los Angeles, Calif: The Antioch Press, oCLC: 611745527.
Bordalo, P., K. Coffman, N. Gennaioli, and A. Shleifer (2016): “Stereotypes,”Quarterly Journal of Economics, Forthcoming.
Borjas, G. J. (1987): “Self-Selection and the Earnings of Immigrants,” The AmericanEconomic Review, 77, 531–553.
——— (1992): “Ethnic Capital and Intergenerational Mobility,” The Quarterly Journalof Economics, 107, 123–150.
——— (1993): “The Intergenerational Mobility of Immigrants,” Journal of Labor Eco-nomics, 11.
——— (1994): “Long-Run Convergence of Ethnic Skill DIfferentials: The Children andGrandchildren of the Great Migration,” Industrial and Labor Relations Review, 47,553–573.
Branch, T. (1989): Parting the Waters : America in the King Years 1954-63, NewYork: Simon & Schuster, reprint edition ed.
40
Brandt, L., D. Ma, and T. G. Rawski (2014): “From Divergence to Convergence:Reevaluating the History Behind China’s Economic Boom,” Journal of Economic Lit-erature, 52, 45–123.
Broussard, A. S. (1993): Black San Francisco: The Struggle for Racial Equality in theWest, 1900-1954, University Press of Kansas, google-Books-ID: jgwVAAAAYAAJ.
Bureau of the Census (1914): “Bulletin 127: Chinese and Japanese in the UnitedStates, 1910,” Tech. rep.
Cameron, S. V. and J. J. Heckman (1993): “Comment on Trends in College Entryamong Whites, Blacks, and Hispanics by Robert M. Hauser,” in Studies of Supply andDemand in Higher Education, ed. by C. T. Clotfelter and M. Rothschild, Universityof Chicago Press, January, 61–120.
Card, D. and A. B. Krueger (1992a): “Does School Quality Matter ? Returns toEducation and the Characteristics of Public Schools in the United States,” The Journalof Political Economy, 100, 1–40.
——— (1992b): “School Quality and Black-White Relative Earnings: A Direct Assess-ment,” The Quarterly Journal of Economics, 107, 151–200.
Caro, R. (1975): The Power Broker: Robert Moses and the Fall of New York, NewYork: Vintage Books.
Carr, M. J. S. and U. S. O. of Education (1939): Accredited Secondary Schools inthe United States. Bulletin, 1939, No. 2, Office of Education, United States Departmentof the Interior.
——— (1944): Accredited Secondary Schools in the United States, 1944. Bulletin, 1944,No. 4, US Office of Education, Federal Security Agency.
Carr, M. J. S. and United States Office of Education (1930): Accredited Sec-ondary Schools in the United States. Bulletin, 1930, No. 24, Office of Education, UnitedStates Department of the Interior.
——— (1934): Accredited Secondary Schools in the United States. Bulletin, 1934, No.17, Office of Education, United States Department of the Interior.
Carruthers, C. K. and M. H. Wanamaker (2016): “Separate and Unequal in theLabor Market: Human Capital and the Jim Crow Wage Gap,” Journal of Labor Eco-nomics.
Carter, S. B. (2015): “A Note on the Classification of Chinese in the IPUMS Full-CountData Sets for 1880 and 1940,” Unpublished Note.
Chan, S. (1991): “The Exclusion of Chinese Women, 1870-1943,” in Entry Denied: Ex-clusion and the Chinese Community in America, 1882-1943, Philadelphia, PA: TempleUniversity Press, 94–146.
41
Chang, I. (2004): The Chinese in America: A Narrative History, London: PenguinBooks, reprint edition ed.
Chant, S. N. F. and S. S. Freedman (1934): “A quantitative comparison of thenationality preferences of two groups,” The Journal of Social Psychology, 5, 116–120.
Charles, K. K. and J. Guryan (2008): “Prejudice and Wages : An Empirical As-sessment of Becker’s The Economics of Discrimination,” Journal of Political Economy,116, 773–809.
Chen, J. (2011): “Chinese Immigration to the United States: History, Selectivity andHuman Capital,” Working Paper.
Chetty, R., N. Hendren, P. Kline, and E. Saez (2014): “Where is the land ofOpportunity? The Geography of Intergenerational Mobility in the United States,”The Quarterly Journal of Economics, 129, 1553–1623.
Chiswick, B. R. (1983): “An Analysis of the Earnings and Employment of Asian-American Men,” Journal of Labor Economics, 1, 197–214.
——— (1988): “Differences in Education and Earnings Across Racial and Ethnic Groups:Tastes, Discrimination, and Investments in Child Quality,” The Quarterly Journal ofEconomics, 103, 571.
Cloud, P. and D. W. Galenson (1987): “Chinese immigration and contract labor inthe late nineteenth century,” Explorations in Economic History, 24, 22–42.
——— (1991): “Chinese immigration: Reply to charles McClain,” Explorations in Eco-nomic History, 28, 239–247.
Conlisk, J. (1974): “Can Equalization of Opportunity Reduce Social Mobility?” TheAmerican Economic Review, 64, 80–90.
Cooper, M. M. (2003): “Japanese American Wages, 1940-1990,” Ph.D. thesis, TheOhio State University.
Cutright, P. (1973): Achievement, mobility, and the draft: their impact on the earningsof men, U.S. Social Security Administration, Office of Research and Statistics.
Daniels, R. (1990): Asian America: Chinese and Japanese in the United States since1850, Seattle: University of Washington Press, reprint edition ed.
Darity Jr., W., J. Dietrich, and D. K. Guilkey (1997): “Racial and EthnicInequality in the United States: A Secular Perspective,” The American EconomicReview, 87, 301–305.
Dickens, W. T. and J. R. Flynn (2006): “Black Americans Reduce the Racial IQGap Evidence From Standardization Samples,” Psychological Science, 17, 913–920.
42
Diner, H. R. (2006): The Jews of the United States, 1654 to 2000, Berkeley: Universityof California Press.
Donohue, J. and J. Heckman (1991): “Continuous versus Episodic Change : TheImpact of Civil Rights Policy on the Economic Status of Blacks,” .
Duleep, H. O. and S. G. Sanders (2012): “The Economic Status of Asian AmericansBefore and After the Civil Rights Act,” SSRN Scholarly Paper ID 2089668, SocialScience Research Network, Rochester, NY.
Duncan, B. and S. J. Trejo (2016): “The Complexity of Immigrant Generations:Implications for Assessing the Socioeconomic Integration of Hispanics and Asians,”Working Paper 21982, National Bureau of Economic Research.
Ferrie, J. P., K. Rolf, and W. Troesken (2012): “Cognitive disparities, leadplumbing, and water chemistry: Prior exposure to water-borne lead and intelligencetest scores among World War Two U.S. Army enlistees,” Economics & Human Biology,10, 98–111.
Flynn, J. R. (1991): Asian Americans: Achievement Beyond IQ, Psychology Press,google-Books-ID: H1lC6Dff8y8C.
Frank, B. R. H. (1984): “Are Workers Paid their Marginal Products ?” The AmericanEconomic Review, 74, 549–571.
Fryer, R. G. (2010): “Racial Inequality in the 21st Century : The Declining Significanceof Discrimination,” Handbook of Labor Economics, 4.
Fryer, R. G. and S. D. Levitt (2006): “The Black-White Test Score Gap ThroughThird Grade,” American Law and Economics Review, 8, 249–281.
——— (2013): “Testing for Racial Differences in the Mental Ability of Young Children,”American Economic Review, 103, 981–1005.
Galor, O. and J. Zeira (1993): “Income Distribution and Macroeconomics,” TheReview of Economic Studies, 60, 35–52.
Gao, P. (2016): “The rise of education in China through the 20th century,” .
Ginzberg, E. (1959): The Lost Divisions, Columbia University Press, google-Books-ID:ZXtijgEACAAJ.
Glaeser, E. L., J. A. Scheinkman, and B. I. Sacerdote (2003): “The SocialMultiplier,” Journal of the European Economic Association, 1, 345–353.
Goldberg, M. S. (1982): “Discrimination, Nepotism, and Long-Run Wage Differen-tials,” The Quarterly Journal of Economics, 97, 307–319.
Gonzalez, J. (2011): Harvest of Empire: A History of Latinos in America, New York:Penguin Books, revised edition ed.
43
Graaf, L. B. D., K. Mulroy, and Q. Taylor, eds. (2001): Seeking El Dorado:African Americans in California, Los Angeles : Seattle: University of WashingtonPress, first edition ed.
Guilford, J. P. (1931): “Racial Preferences of a Thousand American University Stu-dents,” Journal of Social Psychology, 2, 179–204.
Hartley, E. (1946): Problems in Prejudice, King’s Crown Press, google-Books-ID:vsRODQEACAAJ.
Heckman, J. J. and B. S. Payner (1989): “Determining the Impact of Federal An-tidiscrimination Policy on the Economic Status of Blacks: A Study of South Carolina,”The American Economic Review, 79, 138–177.
Hendrick, I. G. (1975): “Public Policy Toward the Education of Non-White MinorityGroup Children in California, 1849-1970. Final Report.” Tech. rep., California Uni-versity Riverside School of Education and National Institute of Education (DHEW),Washington D.C.
Hershey, L. B. (1943): Selective service in wartime, 2d report of the Director of Selec-tive Service, 1941-42., United States Selective Service System.
Higgs, R. (1977): “Firm-Specific Evidence on Racial Wage Differentials and WorkforceSegregation,” The American Economic Review, 67, 236–245.
——— (1978): “Landless by Law: Japanese Immigrants in California Agriculture to1941,” The Journal of Economic History, 38, 205–225.
Hilger, N. G. (2016): “The Great Escape: Intergenerational Mobility in the UnitedStates Since 1940,” Working Paper 21217, National Bureau of Economic Research.
Hirschman, C. and M. G. Wong (1986): “The Extraordinary Educational Attain-ment of Asian-Americans: A Search for Historical Evidence and Explanations,” SocialForces, 65, 1.
Hurst, M. (1997): “The determinants of earnings differentials for indigenous Americans:Human capital, location, or discrimination?” The Quarterly Review of Economics andFinance, 37, 787–807.
Hutchinson, E. P. (1947): “The Present Status of Our Immigration Laws and Policies,”The Milbank Memorial Fund Quarterly, 25, 161.
Ichihashi, Y. (1932): Japanese in the United States, Arno Press, google-Books-ID:aUznnQEACAAJ.
Jensen, R. (2002): “’No Irish Need Apply’: A Myth of Victimization,” Journal of SocialHistory, 36, 405–429.
44
Johnson, W. R. and D. Neal (1998): “Basic skills and the black-white earnings gap,”The Black-White test score gap, 480–497.
Katz, D. and F. H. Allport (1931): Students’ attitudes, a report of the Syracuseuniversity reaction study, Syracuse, N.Y.
Katz, D. and K. W. Braly (1935): “Racial prejudice and racial stereotypes,” TheJournal of Abnormal and Social Psychology, 30, 175–193.
Kenny, K. (2006): “Violence, Race, and anti-Irish Sentiment in the Nineteenth Cen-tury,” in Making the Irish American: History and Heritage of the Irish in the UnitedStates, ed. by J. J. Lee and M. Casey, New York: NYU Press, 289–301.
Kersey, V. (1933): “Biennial report of the California State Department of Educationfor the school years ending June 30, 1931 and June 30, 1932, Part II,” .
Kristof, N. (2015): “The Asian Advantage,” The New York Times.
Lang, K. and J.-Y. K. Lehmann (2012): “Racial Discrimination in the Labor Market:Theory and Empirics,” Journal of Economic Literature, 50, 959–1006.
Lee, E. (2005): At America’s Gates: Chinese Immigration during the Exclusion Era,1882-1943, UNC Press.
Lee, J. and M. Zhou (2015): The Asian American Achievement Paradox, New York:Russell Sage Foundation.
Leeuwen, B. v. (2007): Human Capital and Economic Growth in India, Indonesia,and Japan: A Quantitative Analysis, 1890-2000, Box Press shop, google-Books-ID:JAxpCWzpDuQC.
Leon, A. (2005): “Does ’Ethnic Capital’ Matter? Identifying Peer Effects in the Inter-generational Transmission of Ethnic Differentials,” Unpublished Manuscript.
Lew, E. A. (1944): “Interpreting the Statistics of Medical Examinations of Selectees,”Journal of the American Statistical Association, 39, 345–356.
Long, J. and J. Ferrie (2013): “Intergenerational Occupational Mobility in GreatBritain and the United States Since 1850: Reply,” American Economic Review, 103,2041–2049.
Lotchin, R. W. (2011): “Japanese Relocation in World War II and the Illusion ofUniversal Racism,” Journal of The Historical Society, 11, 155–181.
Mangione, J. (1993): La Storia: Five Centuries of the Italian American Experience,New York: Harper Perennial.
Mangum, C. S. (1940): The legal status of the Negro, Chapel Hill: The University ofNorth Carolina press.
45
Margo, R. A. (1990): Race and Schooling in the South, 1880-1950: An EconomicHistory, Chicago: University Of Chicago Press, 1 edition ed.
——— (2016): “Obama, Katrina, and the Persistence of Racial Inequality,” The Journalof Economic History, 76, 301–341.
McClain, C. J. (1984): “The Chinese Struggle for Civil Rights in Nineteenth CenturyAmerica: The First Phase, 1850-1870,” California Law Review, 72, 529–568.
McKenzie, R. D., Institute of Pacific Relations. American Council, andH. Institute of Pacific Relations. Conference (2nd : 1927 Honolulu(1927): Oriental exclusion : the effect of American immigration laws, regulations,and judicial decisions upon the Chinese and Japanese on the American Pacific coast,New York : American Group, Institute of Pacific Relations.
Mears, E. G. (1928): Resident Orientals on the American Pacific coast; their legal andeconomic status, Chicago, Ill. : The University of Chicago Press.
Minnesota Population Center and Ancestry.com (2013): “IPUMS RestrictedComplete Count Data: Version 1.0 [Machine-readable database],” Tech. rep., Univer-sity of Minnesota, Minneapolis.
Murayama, Y. (1984): “Contractors, collusion, and competition: Japanese immigrantrailroad laborers in the Pacific Northwest, 1898-1911,” Explorations in Economic His-tory, 21, 290–305.
Neal, D. (2006): “Chapter 9: Why Has Black-White Skill Convergence Stopped?” inHandbook of the Economics of Education, Elsevier, vol. 1, 511–576.
Neal, D. A. and W. R. Johnson (1996): “The Role of Premarket Factors in Black-White Wage Differences,” Journal of Political Economy, 104(5): 869–895.
Nordyke, E. C. and Y. S. Matsumoto (1977): “Japanese in Hawaii: a Historicaland Demographic Perspective,” .
Page, J. (2004): In the Hands of the Great Spirit: The 20,000-Year History of AmericanIndians, New York: Free Press, new edition edition ed.
Pfaelzer, J. (2008): Driven Out: The Forgotten War against Chinese Americans,Berkeley: University of California Press.
Phillips, F. M. and United States Office of Education (1929): AccreditedSecondary Schools in the United States. Bulletin, 1928, No. 26, Bureau of Education,Department of the Interior.
Ramsey, F. P. (1928): “A Mathematical Theory of Saving,” The Economic Journal, 38,543–559.
46
Rappaport, J. (2005): “How does labor mobility affect income convergence?” Journalof Economic Dynamics and Control, 29, 567–581.
Rediker, M. (2008): The Slave Ship: A Human History, New York: Penguin Books,reprint edition ed.
Rice, M. C. and United States Office of Education (1952): Directory of sec-ondary day schools, 1951-52: showing accredited status, enrollment, staff, and otherdata, Washington, D.C.: Federal Security Agency, Office of Education.
Rice, M. F. C. and United States Office of Education (1949): Directory of sec-ondary schools in the United States, Circular (United States. Office of Education)250,Washington: U. S. Govt. Print. Off.
Romer, P. M. (1986): “Increasing Returns and Long-Run Growth,” Journal of PoliticalEconomy, 94, 1002–1037.
Rothstein, J. and N. Wozny (2014): “Permanent Income and the Black- White TestScore Gap,” Journal of Human Resources, 48, 509–544.
Ruggles, S. J., K. Genadek, R. Goeken, J. Grover, and M. Sobek (2015): In-tegrated Public Use Microdata Series: Version 6.0 [Machine-readable database]., Min-neapolis: University of Minnesota.
San Francisco, California (1924): “Annual Report of the Public Schools of the Cityand County of San Francisco,” Tech. rep.
Sides, J. (2004): L.A. City Limits: African American Los Angeles from theGreat Depression to the Present, University of California Press, google-Books-ID:De1uGmvpw30C.
Smith, M. (1947): “Populational Characteristics of American Servicemen in World WarII,” The Scientific Monthly, 65, 246–252.
Smith, P. J. (1984): “Race and Human Capital,” The American Economic Review, 74,685–698.
Smith, T. L. (2013): “4-F: The Forgotten Unfit of the American Military in World WarII,” Ph.D. thesis, Texas Woman s University.
Solon, G. (2015): “What Do We Know So Far about Multigenerational Mobility?”Working Paper 21053, National Bureau of Economic Research.
Solow, R. M. (1956): “A Contribution to the Theory of Economic Growth,” The Quar-terly Journal of Economics, 70, 65–94.
Stephenson, G. T. (1910): Race distinctions in American law, New York: AssociationPress.
47
Sue, S. and S. Okazaki (2009): “Asian-American educational achievements: A phe-nomenon in search of an explanation.” Asian American Journal of Psychology, S, 45–55.
Suzuki, M. (1995): “Japanese Immigrant Economic Achievement and Return Migration,1920-1930,” The Journal of Economic History, 55, 889–901.
——— (2002): “Selective Immigration and Ethnic Economic Achievement: JapaneseAmericans before World War II,” Explorations in Economic History, 39, 254–281.
Takaki, R. (1998): Strangers from a Different Shore: A History of Asian Americans,Updated and Revised Edition, Boston: Little, Brown and Company, revised and up-dated edition ed.
Taylor, P. S. (1928): Mexican labor in the United States Imperial Valley, Berkeley,CA: University of California Press.
Thurstone, L. L. (1927a): “A law of comparative judgment,” Psychological Review,34, 273–286.
——— (1927b): “Psychophysical Analysis,” The American Journal of Psychology, 38,368–389.
——— (1928): “An Experimental Study of Nationality Preferences,” The Journal ofGeneral Psychology, 1, 405–425.
Torche, F. (2015): “Analyses of Intergenerational Mobility An Interdisciplinary Re-view,” The ANNALS of the American Academy of Political and Social Science, 657,37–62.
Torres-Rouff, D. (2012): “Becoming Mexican: Segregated Schools and Social Scien-tists in Southern California, 1913-1946,” Southern California Quarterly, 94, 91–127.
Trejo, S. J. (1997): “Why Do Mexican Americans Earn Low Wages?” Journal ofPolitical Economy, 105, 1235–1268.
United States Office of Education (1933): Accredited Secondary Schools in theUnited States. Supplement to Bulletin, 1930, No. 24, Office of Education, United StatesDepartment of the Interior.
——— (1937): Accredited Secondary Schools in the United States. Supplement to Bul-letin, 1934, No. 17, Office of Education, United States Department of the Interior.
——— (1943): Accredited Secondary Schools in the United States. Bulletin, 1942, No. 3.Supplement to Bulletin, 1939, No. 2, US Office of Education, Federal Security Agency.
U.S. Commission on Civil Rights (1973): “Understanding Fair Housing,” Tech.Rep. 42.
——— (1977): A generation deprived: Los Angeles school desegregation, Washington.
48
Washington, B. T. (1901): Up from Slavery: An Autobiography, Garden City, NewYork: Doubleday & Company, Inc.
Wollenberg, C. (1974): “Mendez v. Westminster: Race, Nationality and Segregationin California Schools,” California Historical Quarterly, 53, 317–332.
——— (1978): All Deliberate Speed: Segregation and Exclusion in California Schools,1855-1975, University of California Press.
X, M., A. Haley, and A. Shabazz (1992): The Autobiography of Malcolm X: As Toldto Alex Haley, Ballantine Books, reissue edition ed.
Young, D. (1927): “Some effects of a course in American race problems on the raceprejudice of 450 undergraduates at the University of Pennsylvania,” The Journal ofAbnormal and Social Psychology, 22, 235–242.
49
Tabl
eI:
Rac
ialP
reju
dice
Aga
inst
Bla
cks
and
Asi
ans,
1926
-56
Not
es:
Tabl
epr
esen
tsra
nkin
gof
blac
ks,C
hine
sean
dJa
pane
sein
vari
ous
publ
ishe
dst
udie
sex
ploi
ting
surv
eyda
taon
raci
alat
titu
des
toco
nstr
uct
mea
sure
sof
prej
udic
eag
ains
tgr
oups
.R
anki
ngof
0in
dica
tes
min
imum
prej
udic
e,an
dra
nkin
gof
1in
dica
tes
max
imum
prej
udic
e.W
here
not
othe
rwis
eno
ted,
subj
ects
insu
rvey
sar
epr
edom
inan
tly
whi
teA
mer
ican
s.a
Kat
zan
dA
llpor
t(1
931)
only
incl
ude
anab
ridg
edso
cial
dist
ance
surv
eyre
flect
ing
will
ingn
ess
toac
cept
vari
ous
nati
onal
itie
s/et
hnic
itie
sin
toon
e’s
frat
erni
ty/s
oror
ityat
aco
llege
.b
Ran
king
sfo
rH
artl
ey(1
946)
excl
ude
ficti
onal
plac
ebo
nati
onal
itie
s(e
.g.
“Wal
loni
an”)
,and
grou
psth
atar
eno
tna
tion
alit
ies
(e.g
.,“N
azis
”).
cAv
erag
esex
clud
eN
ewY
ork
Uni
vers
itybe
caus
esa
mpl
eis
disp
ropo
rtio
nate
lyJe
wis
hA
mer
ican
,and
How
ard
Uni
vers
itybe
caus
esa
mpl
eis
disp
ropo
rtio
nate
lyB
lack
.
50
Table II: Institutional Discrimination Against Asians and Blacks in California
Notes: See Appendix A for discussion and sources underlying this table.
51
Tabl
eII
I:E
duca
tion
alSe
lect
ion
into
Mig
rati
onby
Nat
iona
lity/
Rac
e,19
40-2
000
Not
es:
Num
bers
inta
ble
repr
esen
tye
ars
ofsc
hool
ing
rath
erth
anhi
ghes
tgr
ade
atta
ined
for
both
Chi
nese
inC
hina
and
Japa
nese
inJa
pan.
Edu
cati
onof
Chi
nese
inC
hina
take
nfr
omTa
ble
3of
Gao
(201
6).
Edu
cati
onof
Japa
nese
inJa
pan
take
nfr
omTa
ble
A.7
.1of
Leeu
wen
(200
7).
Edu
cati
onof
allg
roup
sin
US
refle
cthi
ghes
tgr
ade
atta
ined
.C
hine
sean
dJa
pane
se“I
nU
S”re
stri
ctto
fore
ign-
born
toid
enti
fym
igra
nts
who
likel
yre
ceiv
eded
ucat
ion
inco
untr
yof
orig
in.
Bla
cks
and
whi
tes
“In
US”
excl
ude
resi
dent
sof
CA
,whi
lebl
acks
and
whi
tes
“In
CA
”in
clud
ere
side
nts
ofC
Aw
how
ere
born
outs
ide
ofC
Ain
orde
rto
iden
tify
“mig
rant
s”to
CA
.
52
Tabl
eIV
:Occ
upat
iona
lSel
ecti
onin
toFa
ther
hood
byR
ace,
1900
-200
0
Not
es:
Pre
sent
sO
CC
SCO
RE
for
men
livin
gin
CA
,and
men
livin
gin
CA
co-r
esid
ing
wit
hth
eir
own
child
ren.
“Per
cent
Diff
eren
ce”
indi
cate
sth
epe
rcen
tdi
ffere
nce
inav
erag
eO
CC
SCO
RE
betw
een
thes
etw
ogr
oups
ofm
enw
ithi
nra
cean
dye
ar.
“Per
cent
ofM
enin
CA
wit
hK
ids”
indi
cate
sth
esh
are
ofm
enliv
ing
inC
Aw
hoar
eco
-res
idin
gw
ith
own
child
ren.
53
Tabl
eV
:Im
plic
atio
nsof
Inte
rgen
erat
iona
lDec
ompo
siti
onfo
rN
ext
Gen
erat
ion,
Bor
nin
CA
Not
es:
Pre
sent
ses
tim
ated
log
hous
ehol
dea
rnin
gsin
stea
dyst
ate
usin
gpa
ram
eter
esti
mat
esin
Tabl
e(A
.4)
and
equa
tion
(2).
“Asi
anE
duca
tion
”as
sign
sbl
acks
the
esti
mat
edin
terc
ept
and
slop
eof
Asi
ans’
cond
itio
nale
xpec
tati
onof
child
ren’
sed
ucat
ion
wit
hre
spec
tto
pare
ntal
inco
me.
“Asi
anE
arni
ngs”
assi
gns
blac
ksth
ees
tim
ated
inte
rcep
tan
dsl
ope
ofA
sian
s’co
ndit
iona
lex
pect
atio
nof
child
ren’
sea
rnin
gsw
ith
resp
ect
toth
eir
educ
atio
n.“A
sian
Pare
ntal
Inco
me”
refe
rsto
Asi
anm
ean
pare
ntal
inco
me.
Est
imat
esba
sed
onsa
mpl
ere
stri
cted
toch
ildre
nbo
rnin
CA
.
54
Table VI: Mean WWII Enlistee Test Scores by Race and Schooling in 1943, CA
Notes: Table presents raw means of WWII enlistment test scores by race and broadeducation category, restricting to enlistees reporting CA residence. Standard errors ofmeans in parantheses, sample sizes in brackets.
55
Tabl
eV
II:L
ogE
arni
ngs
Reg
ress
ions
onA
GC
TSc
ores
in19
40
Not
es:
Dep
ende
ntva
riab
leis
log
ofan
nual
earn
ings
inal
lreg
ress
ions
.Sa
mpl
em
atch
esA
GC
Tda
tafr
om19
43W
WII
enlis
tmen
tre
cord
sto
earn
ings
data
from
1940
cens
us10
0%sa
mpl
e.R
estr
icts
tom
enov
erag
e22
in19
40;a
lmos
tal
lmen
insa
mpl
ebe
twee
nag
es22
and
35.
Stan
dard
erro
rscl
uste
red
atth
est
ate
leve
l.
56
Tabl
eV
III:
Ear
ning
sR
egre
ssio
nson
AG
CT
Scor
esfo
rSt
ate-
Edu
cati
onA
ggre
gate
sin
1940
Not
es:
Dep
ende
ntva
riab
leis
log
ofan
nual
earn
ings
inal
lreg
ress
ions
.“M
arke
tFE
”in
dica
tes
whe
ther
mar
ket
fixed
effec
tsar
ein
clud
edin
the
regr
essi
on,w
here
“mar
ket”
isde
fined
byst
ate
ofre
side
nce
and
broa
ded
ucat
iona
lcat
egor
y(n
ohi
ghsc
hool
,so
me
high
scho
ol,h
igh
scho
olgr
adua
te,a
nyco
llege
).“D
ata
Leve
l”in
dica
tes
whe
ther
regr
essi
onis
run
onin
divi
dual
mic
roda
taor
data
that
has
been
colla
psed
toth
ele
velo
fmar
ket⇥
race
.“D
atas
et”
indi
cate
sw
heth
erea
rnin
gsan
dA
GC
Tsc
ores
take
nfr
omsu
bsam
ple
ofW
WII
enlis
tmen
tre
cord
sm
atch
edto
1940
100%
cens
usm
icro
data
,or
whe
ther
earn
ings
and
AG
CT
scor
esta
ken
from
com
plet
eun
mat
ched
data
sets
sepa
rate
ly.
All
regr
essi
ons
rest
rict
sto
men
over
age
22in
1940
;al
mos
tal
lmen
insa
mpl
ebe
twee
nag
es22
and
35.
Stan
dard
erro
rscl
uste
red
atth
est
ate
leve
l.
57
Table IX: Various Outcomes for Parents of CA-Born Children by Race, 1900-2000
Notes: Sample restricts to parents ages 25-55 co-residing with CA-born children. Allcells reweighted within year to match age and sex distribution of black parents ofCA-born children. Total family income deflated with CPI-Urban for 2000. Missingvalues indicate unavailability of variable in IPUMS census year.
58
Tabl
eA
.1:A
vera
geSc
hool
Cha
ract
eris
tics
byR
ace
inLo
sA
ngel
es,1
938
Not
es:
Dat
aon
raci
alco
mpo
siti
onof
scho
ols
obta
ined
from
1938
surv
eyde
scri
bed
inte
xt.
Dat
aon
scho
olin
puts
in19
38ob
tain
edfr
omB
oard
ofE
duca
tion
ofth
eC
ityof
Los
Ang
eles
(193
8).
Spen
ding
per
pupi
lcon
vert
edin
to20
16do
llars
usin
gth
eC
onsu
mer
Pri
ceIn
dex
-U
rban
.
59
Table A.2: Summary Statistics
Notes: Table presents summary statistics for three samples for all US residents and CAresidents. All samples restrict to men. “AGCT Sample” is the sample of WWIIenlistment records from 1943. “Census Sample” is 100% IPUMS census microdata for1940. “AGCT-Census Match” is a match of these two prior datasets on first name, lastname, state of birth, race and year of birth plus or minus one year.
60
Table A.3: Top Occupation by Race, 1860-2000
Notes: Occupation shares calculated for men age 25-65, excluding residents of Alaskaand Hawaii. Each race reweighted to match age distribution of blacks in each year.
Figure II: Intergenerational Change in Household Earnings Ratios: Born in CA
Notes: Figure plots earnings ratios for parents of children age 1-17 in 1940, 1960, 1970and 1980 on the x-axes, and earnings ratios for children in these 17-year cohort blocksat later ages in subsequent censuses starting 20 years in the future when children areages 21-37, up to maximum ages of 51-67. All earnings ratios are plotted with respectto Asians of the same ages in the same parent and child groups. Household earningsplots earnings of head and spouse, counting absence of spouse as zero spousal earnings.Households with zero total earnings excluded from estimates. Points above 1 on thex-axis imply parents of age 1-17 year olds in a group are richer than Asian parents of age1-17 year olds in the same year, and points above 1 on the y-axis imply a group’s childrenin later censuses are richer than Asian children in later censuses. Points in the shadedarea indicate that a group’s children’s income has converged toward Asian children’sincome from larger group income gaps of parents. Points below the shaded area indicatethat a group is either falling further behind Asians intergenerationally (“Rich gettingricher”) or has been overtaken by Asians intergenerationally (“Reversal of fortune”).
65
0.1
.2.3
Mas
s
1 2 3 4 5 6 7 8 9 10Household Earnings Decile
White Black Asian
(a) Born in US
0.0
5.1
.15
.2M
ass
1 2 3 4 5 6 7 8 9 10Household Earnings Decile
White Black Asian
(b) Born in CA
Figure III: Parental Income Distribution for Native-Born by Race, 1940
Notes: Figures plot the probability mass functions for total parental income deciles ofnative-born children under age 18 in 1940. Deciles calculated over full US population,and therefore held fixed across races and locations.
66
56
78
910
1112
1314
Hig
hest
Gra
de C
ompl
eted
7 8 9 10 11Log Parental Income
White Black Asian
(a) Born in US, 1940
56
78
910
1112
1314
Hig
hest
Gra
de C
ompl
eted
7 8 9 10 11Log Parental Income
White Black Asian
(b) Born in CA, 1940
89
1011
1213
1415
1617
Hig
hest
Gra
de C
ompl
eted
8 9 10 11 12Log Parental Income
White Black Asian
(c) Born in CA, 1980
Figure IV: Educational Attainment by Log Parental Income
Notes: Hawaii and Alaska excluded. Figure adjusts for independent children and poolsages 22-29. Log parental income calculated as sum of head and spouse earnings over fullpopulation age 25-65.
Figure V: Log Household Earnings by Highest Grade Attained: Born in CA
Notes: Restricts to CA-born ages 25-65. Reweights all groups to age and sex distributionof CA-born blacks in each year. Earnings deflated using CPI-Urban to 2011 dollars.
68
0.1
.2.3
.4.5
.6D
ensi
ty
-6 -5 -4 -3 -2 -1 0 1 2 3 4Z-Score on Enlistment Test
White Black Asian
Figure VI: WWII Enlistment Test Score Distributions by Race in 1943, CA
Notes: Figure plots distributions of residuals from regression of normalized test scoreson complete sets of education and age dummies. Restricts to native-born men ages 25-38living in CA.
69
-.6-.4
-.20
.2
Blac
k-W
hite
Log
Ear
ning
s G
ap
1940 1960 1980 2000Year
Actual White Parental IncomeWhite Educational Mobility White Earnings
(a) Imputing White Earnings Components to Blacks
-.6-.4
-.20
.2
Blac
k-W
hite
Log
Ear
ning
s G
ap
1940 1960 1980 2000Year
Actual Asian Parental IncomeAsian Educational Mobility Asian Earnings
(b) Imputing Asian Earnings Components to Blacks
Figure VII: Counterfactual Black-White Log Earnings Gaps in CA, 1940-2000
Notes: Figure presents simulated black-white log earnings gaps using estimates of thefour parameters in Equation (2) for each race r and each generation t, ↵r,t,�r,t, �r,t, ✓r,t asshown in Table V, as well as mean parental income E [yr,t�1]. “Earnings” refers to log ofhousehold earnings (head + spouse). “Actual” predicts black-white earnings gaps usingestimated parameters for each racial group. “White Parental Income” assigns to blacksthe white parental income distribution. “White Educational Investments” assigns toblacks the white conditional expectation of children’s education with respect to parentalincome. “White Earnings” assigns to blacks the white expectation of household earningscondional on education. Panel (b) repeats this but assigns these respective componentsfrom Asians to blacks. All estimates restrict to “children” born in CA.
No High School Some High School High School Degree Any College
Figure VIII: Black-White Earnings and Skill Gaps by State and Education Level in 1940
Notes: Figure plots log earnings gaps by skill gaps at the level of broad educationalgroup and state of residence for men ages 23-45. Earnings gaps defined as log earnings ofwhites minus log earnings of blacks. Cells with fewer than 30 individual blacks omittedfrom figure. Education groups are no high school, some high school, high school degree,and any college. Test scores normalized into z-score in microdata before construction ofscore gaps at the state-education level.
China Japan Hong Kong Korea Philippines Vietnam Other Asia Share
Figure A.1: Gross Immigration into US from Various Asian Countries, 1821-1991
Notes: Data on immigration flows taken from Department of Homeland Security, Year-book of Immigration Statistics 2003. “Share” divides number of new Asian immigrantsarriving between year T-10 and year T by total number of Asians present in the US in yearT-10. Data on stock of Asians from census data, adjusted to include Japanese in Hawaiias reported in Table I in Nordyke and Matsumoto (1977). Immigration totals include“foreign nationals who, during a fiscal year, were granted lawful permanent residence(i.e., admitted as immigrants or became legal permanent residents), were admitted intothe United States on a temporary basis (e.g., tourists, students, or workers), applied forasylum or refugee status, or were naturalized.” No adjustment made for undocumentedimmigration.
72
.2.4
.6.8
1Pe
rcen
t Lite
rate
1870 1880 1890 1900 1910 1920 1930Year
White Black Asian Native American
(a) Percent Literate, 1880-1930
78
910
1112
1314
15H
ighe
st G
rade
Atta
ined
1940 1950 1960 1970 1980 1990 2000Year
White Black Asian Native American
(b) Highest Grade Attained, 1940-2000
Figure A.2: Human Capital by Race, 1880-2000
Notes: Literacy defined as ability to read and write in any language. Figure restricts toages 25-65 and excludes residents of Alaska and Hawaii. All races reweighted to matchage and sex distribution of blacks in every year.
73
8.5
99.
510
10.5
Log
Earn
ings
1940 1950 1960 1970 1980 1990 2000Year
White Black Asian Native American
(a) Log Earnings, 1940-2000
99.
29.
49.
69.
810
Impu
ted
Log
of E
arni
ngs
1880 1900 1920 1940 1960 1980 2000Year
White Black Asian Native American
(b) Imputed Log Earnings, 1880-2000
Figure A.3: Log Earnings of Men, 1880-2000
Notes: Panel (a) plots average log male earnings age 25-65 by race and year. Panel(b) plots average imputed log male earnings age 25-65 by race and year, with imputa-tion based on earnings in 1940 averaged by cells defined by OCC1950 and native-bornstatus, excluding observations with zero earnings or missing occupation, and restrictingto household heads. Residents of Hawaii and Alaska excluded and races reweighted tomatch age distribution of blacks in every year.
74
.2.4
.6.8
1Pe
rcen
t Lite
rate
1870 1880 1890 1900 1910 1920 1930Year
White Black Asian Native American
(a) Percent Literate, 1880-1930
78
910
1112
1314
15H
ighe
st G
rade
Atta
ined
1940 1950 1960 1970 1980 1990 2000Year
White Black Asian Native American
(b) Highest Grade Attained, 1940-2000
Figure A.4: Human Capital by Race, CA-Born 1880-2000
Notes: Restricting to individuals born in California. Literacy defined as ability to readand write in any language. Figure restricts to ages 25-65 and excludes residents of Alaskaand Hawaii. All races reweighted to match age and sex distribution of blacks in everyyear.
75
8.5
99.
510
10.5
Log
Earn
ings
1940 1950 1960 1970 1980 1990 2000Year
White Black Asian Native American
(a) Log Earnings, 1940-2000
8.5
99.
510
Impu
ted
Log
of E
arni
ngs
1880 1900 1920 1940 1960 1980 2000Year
White Black Asian Native American
(b) Imputed Log Earnings, 1880-2000
Figure A.5: Log Earnings of Men, CA-Born 1880-2000
Notes: Restricting to individuals born in California. Panel (a) plots average log maleearnings age 25-65 by race and year. Panel (b) plots average imputed log male earningsage 25-65 by race and year, with imputation based on earnings in 1940 averaged by cellsdefined by OCC1950 and native-born status, excluding observations with zero earnings ormissing occupation, and restricting to household heads. Residents of Hawaii and Alaskaexcluded and races reweighted to match age distribution of blacks in every year.
76
1-1711-27
21-3731-47 41-57
51-67
61-77
1-1711-27
21-37 31-4741-57
1-1711-27 21-37 31-47
1-17 11-27 21-37
16.8
1717
.217
.417
.617
.818
Log
of F
requ
ency
1940 1960 1980 2000Year
Age 1-17 in 1940 Age 1-17 in 1960Age 1-17 in 1970 Age 1-17 in 1980
(a) White
1-17 11-27
21-3731-47
41-5751-67
61-77
1-17
11-2721-37 31-47
41-57
1-1711-27
21-37 31-471-17
11-2721-37
14.5
1515
.516
Log
of F
requ
ency
1940 1960 1980 2000Year
Age 1-17 in 1940 Age 1-17 in 1960Age 1-17 in 1970 Age 1-17 in 1980
(b) Black
1-17 11-27 21-3731-47
41-5751-67
61-77
1-17 11-27
21-3731-47
41-57
1-17
11-2721-37
31-47
1-17
11-2721-37
1111
.512
12.5
1313
.5Lo
g of
Fre
quen
cy
1940 1960 1980 2000Year
Age 1-17 in 1940 Age 1-17 in 1960Age 1-17 in 1970 Age 1-17 in 1980
(c) Asian
Figure A.6: Log Frequencies of Pseudo-Cohorts: Born in US
Notes: Figure plots log of frequencies by race for cohorts of native-born individuals age1-17 in in 1940, 1960, 1970, 1980.
77
1-1711-27 21-37 31-47 41-57 51-67
61-77
1-17 11-27 21-37 31-47 41-57
1-17 11-27 21-37 31-471-17
11-2721-37
13.5
1414
.515
15.5
Log
of F
requ
ency
1940 1960 1980 2000Year
Age 1-17 in 1940 Age 1-17 in 1960Age 1-17 in 1970 Age 1-17 in 1980
(a) White
1-17 11-27 21-37
31-4741-57 51-67
61-77
1-17 11-27 21-37 31-47 41-57
1-17 11-27 21-37 31-471-17 11-27 21-37
9.5
1010
.511
11.5
1212
.513
13.5
Log
of F
requ
ency
1940 1960 1980 2000Year
Age 1-17 in 1940 Age 1-17 in 1960Age 1-17 in 1970 Age 1-17 in 1980
(b) Black
1-17 11-27 21-37 31-47 41-57 51-6761-77
1-1711-27
21-3731-47
41-57
1-17
11-27
21-3731-47
1-17
11-2721-37
10.5
1111
.512
12.5
Log
of F
requ
ency
1940 1960 1980 2000Year
Age 1-17 in 1940 Age 1-17 in 1960Age 1-17 in 1970 Age 1-17 in 1980
(c) Asian
Figure A.7: Log Frequencies of Pseudo-Cohorts: Born in CA
Notes: Figure plots log of frequencies by race for cohorts of individuals born in CA ages1-17 in 1940, 1960, 1970, 1980.
78
1-1711-27 21-37 31-47 41-57
51-67
61-77
1-1711-27 21-37 31-47 41-57
1-1711-27 21-37 31-471-17 11-27 21-37
.4.4
5.5
.55
.6Sh
are
Mal
e
1940 1960 1980 2000Year
Age 1-17 in 1940 Age 1-17 in 1960Age 1-17 in 1970 Age 1-17 in 1980
(a) White
1-17
11-27
21-3731-47 41-57
51-67
61-77
1-17 11-27
21-37 31-47 41-57
1-17
11-27
21-37 31-47
1-1711-27
21-37
.4.4
5.5
.55
.6Sh
are
Mal
e
1940 1960 1980 2000Year
Age 1-17 in 1940 Age 1-17 in 1960Age 1-17 in 1970 Age 1-17 in 1980
(b) Black
1-17 11-2721-37
31-47
41-57
51-67
61-77
1-1711-27
21-37 31-4741-57
1-1711-27 21-37 31-471-17 11-27 21-37
.4.4
5.5
.55
.6Sh
are
Mal
e
1940 1960 1980 2000Year
Age 1-17 in 1940 Age 1-17 in 1960Age 1-17 in 1970 Age 1-17 in 1980
(c) Asian
Figure A.8: Male Share in Pseudo-Cohorts: Born in US
Notes: Figure plots male share by race for cohorts of native-born individuals age 1-17 in1940, 1960, 1970, 1980.
79
1-1711-27
21-3731-47 41-57 51-67
61-77
1-1711-27 21-37 31-47 41-57
1-1711-27
21-37 31-471-17 11-27 21-37
.4.4
5.5
.55
.6Sh
are
Mal
e
1940 1960 1980 2000Year
Age 1-17 in 1940 Age 1-17 in 1960Age 1-17 in 1970 Age 1-17 in 1980
(a) White
1-1711-27
21-37
31-47
41-57
51-67
61-77
1-1711-27
21-37 31-47 41-57
1-17
11-27 21-37 31-47
1-17 11-27
21-37
.4.4
5.5
.55
.6Sh
are
Mal
e
1940 1960 1980 2000Year
Age 1-17 in 1940 Age 1-17 in 1960Age 1-17 in 1970 Age 1-17 in 1980
(b) Black
1-17 11-27
21-37 31-4741-57
51-6761-77
1-17
11-27
21-37 31-4741-57
1-1711-27
21-3731-471-17 11-2721-37
.4.4
5.5
.55
.6Sh
are
Mal
e
1940 1960 1980 2000Year
Age 1-17 in 1940 Age 1-17 in 1960Age 1-17 in 1970 Age 1-17 in 1980
(c) Asian
Figure A.9: Male Share in Pseudo-Cohorts: Born in CA
Notes: Figure plots male share by race for cohorts of individuals born in CA ages 1-17in 1940, 1960, 1970, 1980.