US & International Trade in Tilapia products: 2003 and Beyond Kevin Fitzsimmons University of Arizona American Tilapia Association International West Coast Seafood Show Los Angeles, CA November 4, 2002
Transcript
US & International Trade in Tilapia products: 2003 and
Beyond
Kevin FitzsimmonsUniversity of Arizona
American Tilapia Association
International West Coast Seafood Show
Los Angeles, CA
November 4, 2002
Introduction
Review worldwide tilapia productionExamine production costsExamine current tilapia markets Discuss problems of supply and demandOpportunities to expand productionOpportunities to expand markets
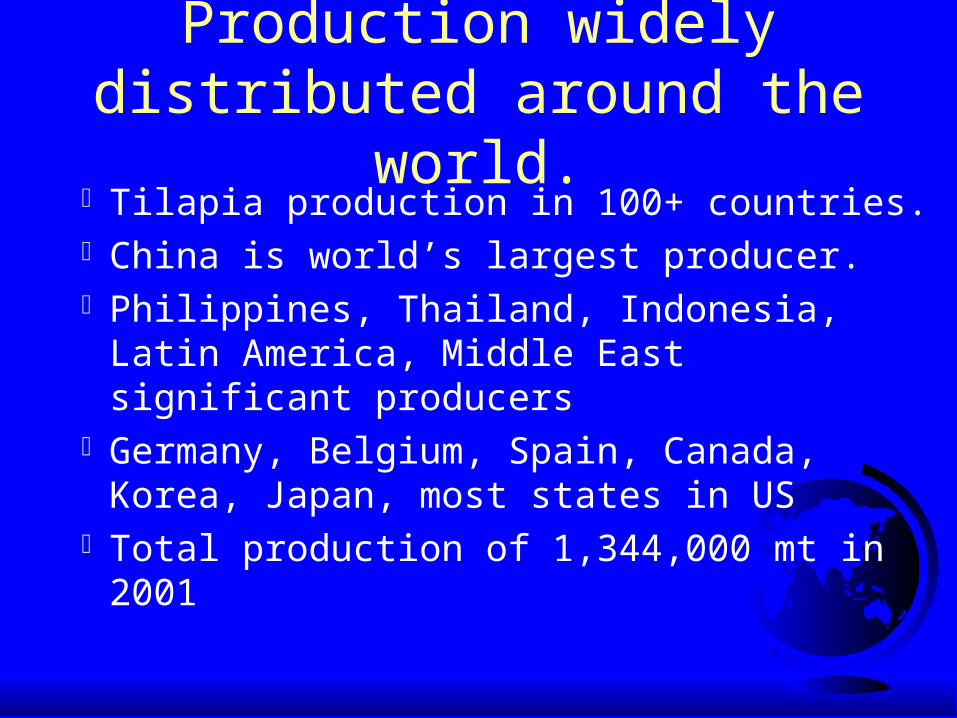
Production widely distributed around the world.
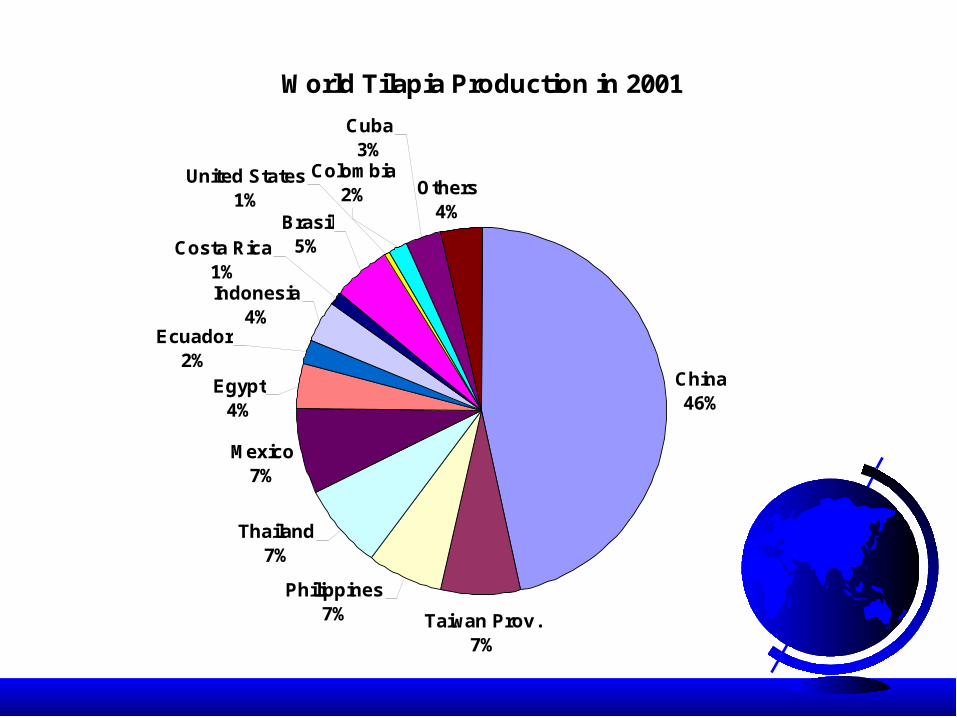
Tilapia production in 100+ countries.China is world’s largest producer.Philippines, Thailand, Indonesia, Latin
America, Middle East significant producersGermany, Belgium, Spain, Canada, Korea,
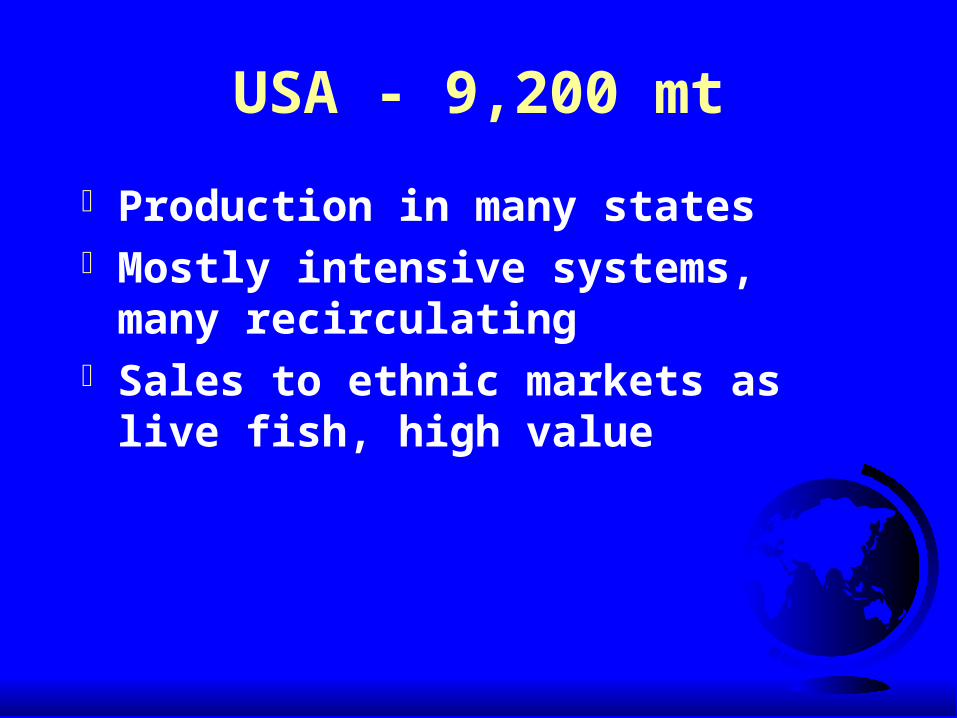
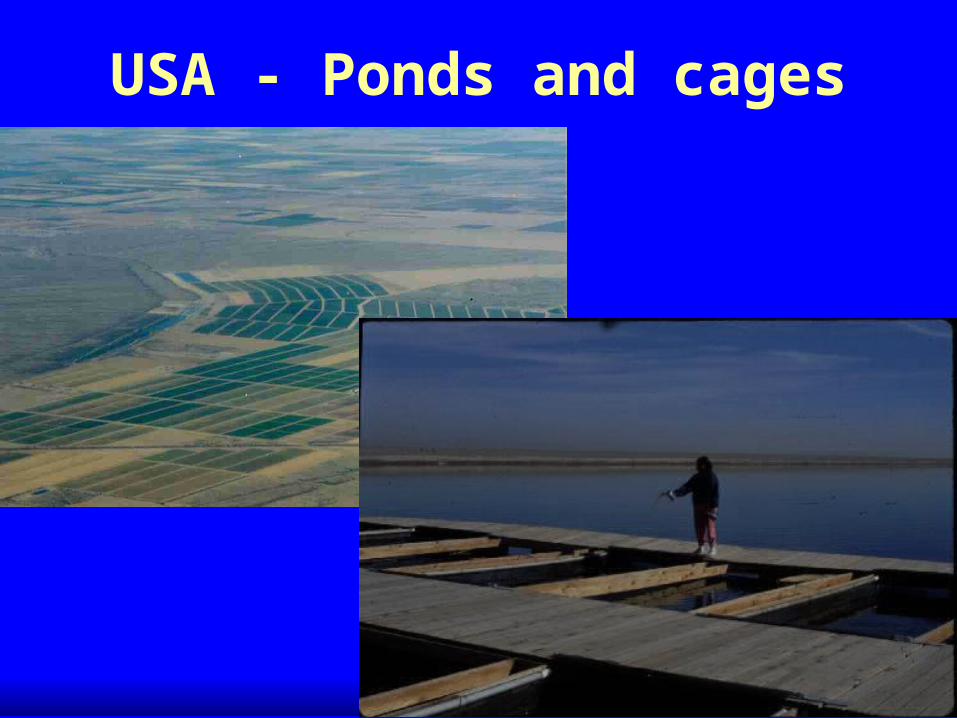
Japan, most states in USTotal production of 1,344,000 mt in 2001
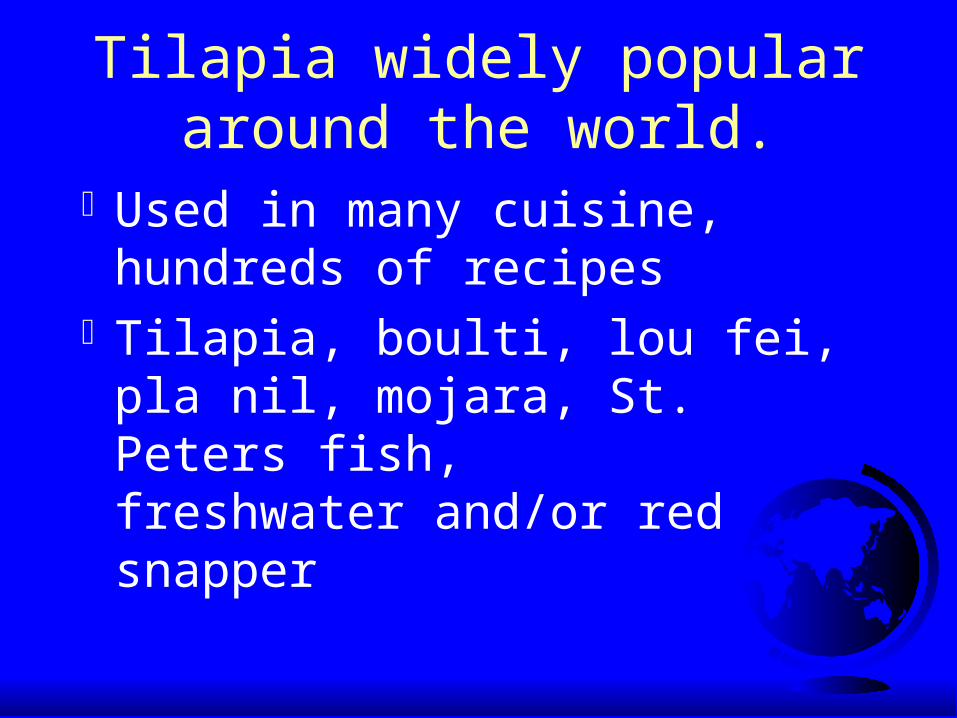
Tilapia widely popular around the world.
Used in many cuisine, hundreds of recipes
Tilapia, boulti, lou fei, pla nil, mojara, St. Peters fish, freshwater and/or red snapper
Established market demandAccepted in many national dishesPopular in many forms (live,
whole, fillets, fresh and frozen, smoked, sashimi, fried skins)
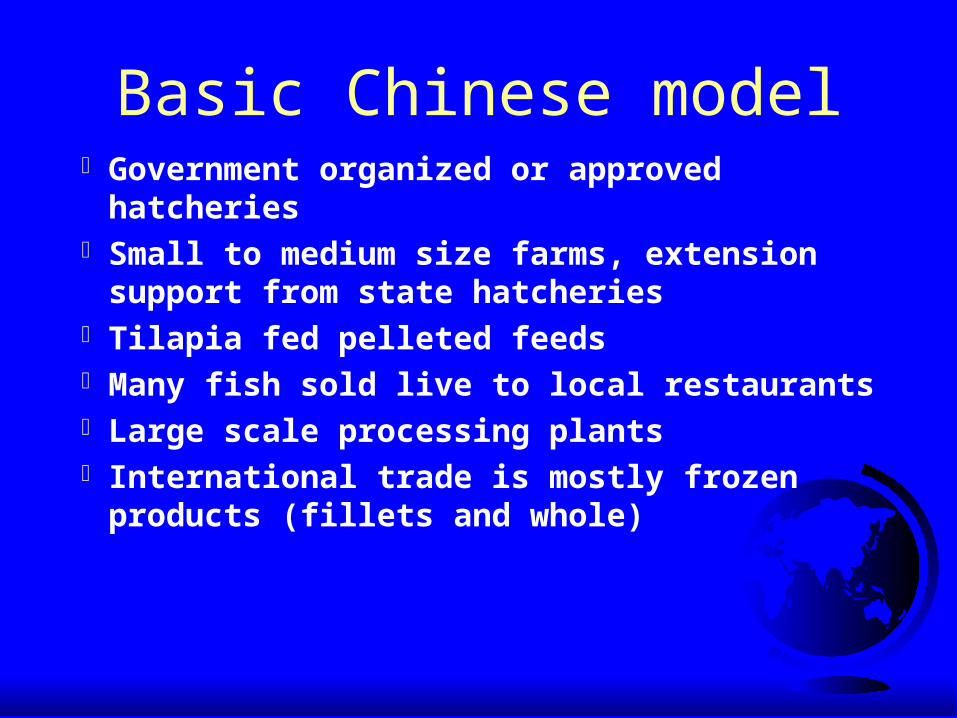
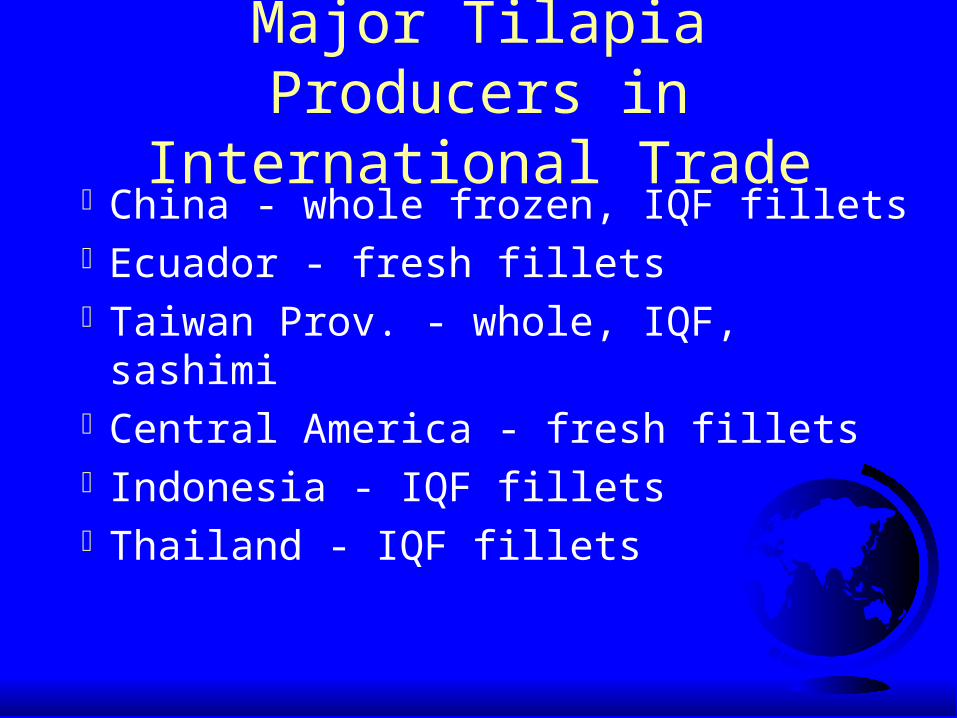
Basic Chinese model Government organized or approved hatcheries Small to medium size farms, extension support
from state hatcheries Tilapia fed pelleted feeds Many fish sold live to local restaurants Large scale processing plants International trade is mostly frozen products
(fillets and whole)
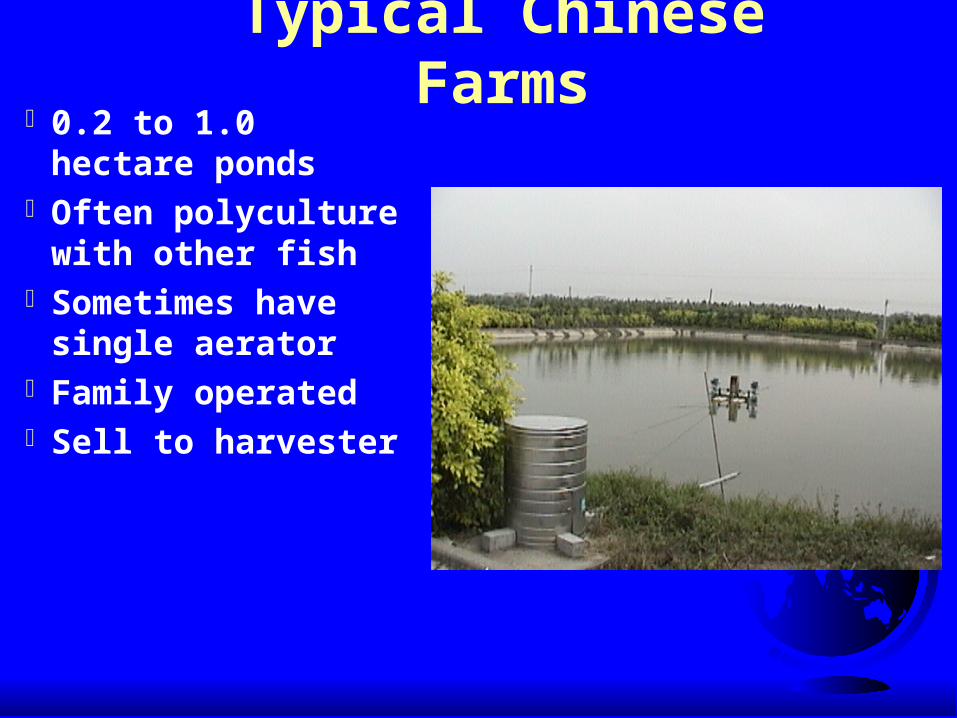
Typical Chinese Farms0.2 to 1.0 hectare
pondsOften polyculture
with other fishSometimes have
single aeratorFamily operatedSell to harvester
Carbon monoxide Most plants appear to
use carbon monoxide Some gas in chambers
others infuse in bags before freezing
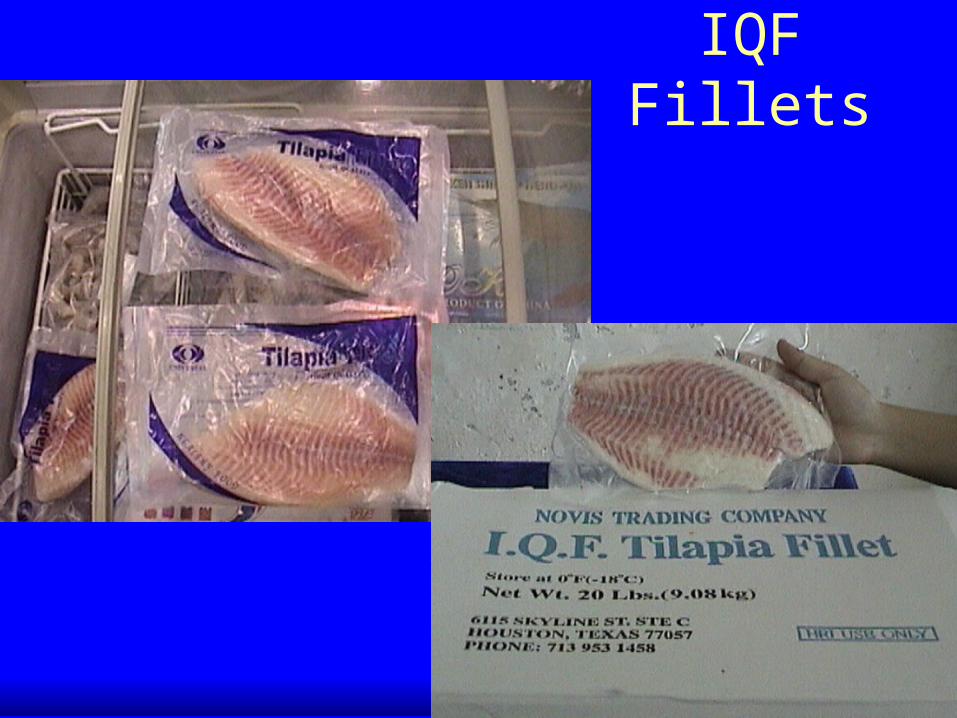
Bagging individual fillets
IQF Fillets
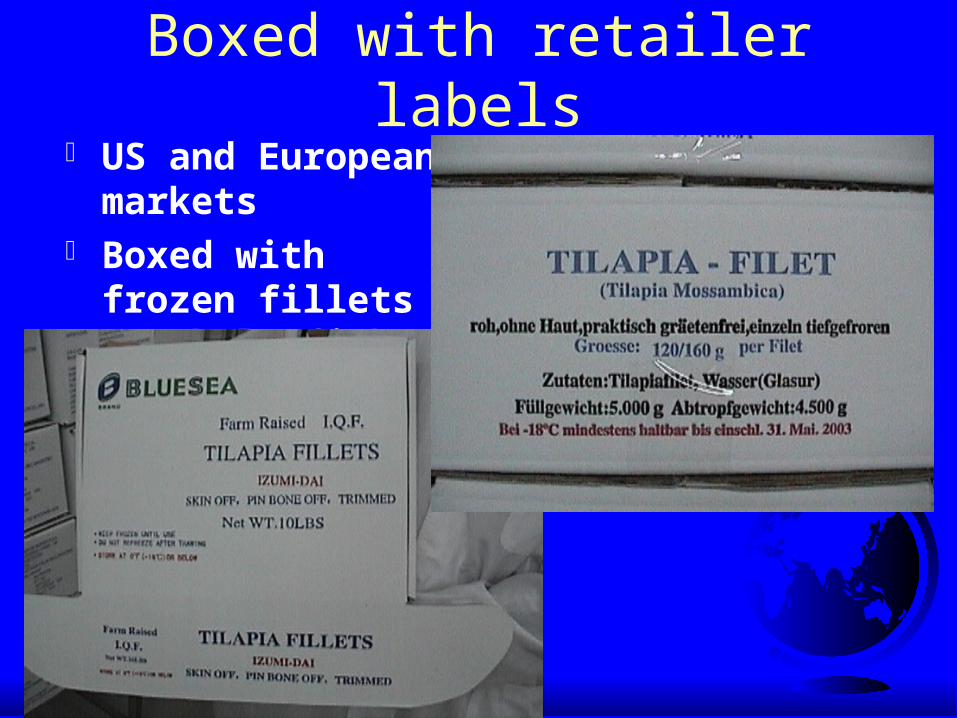
Boxed with retailer labels US and European
markets Boxed with frozen
fillets or whole fish
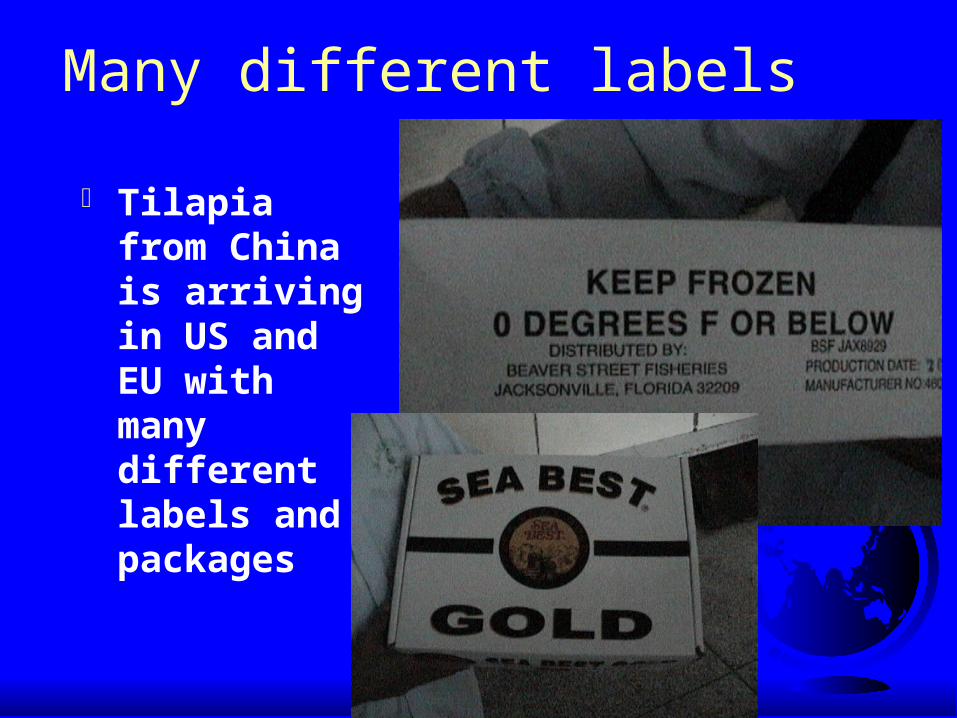
Many different labels
Tilapia from China is arriving in US and EU with many different labels and packages
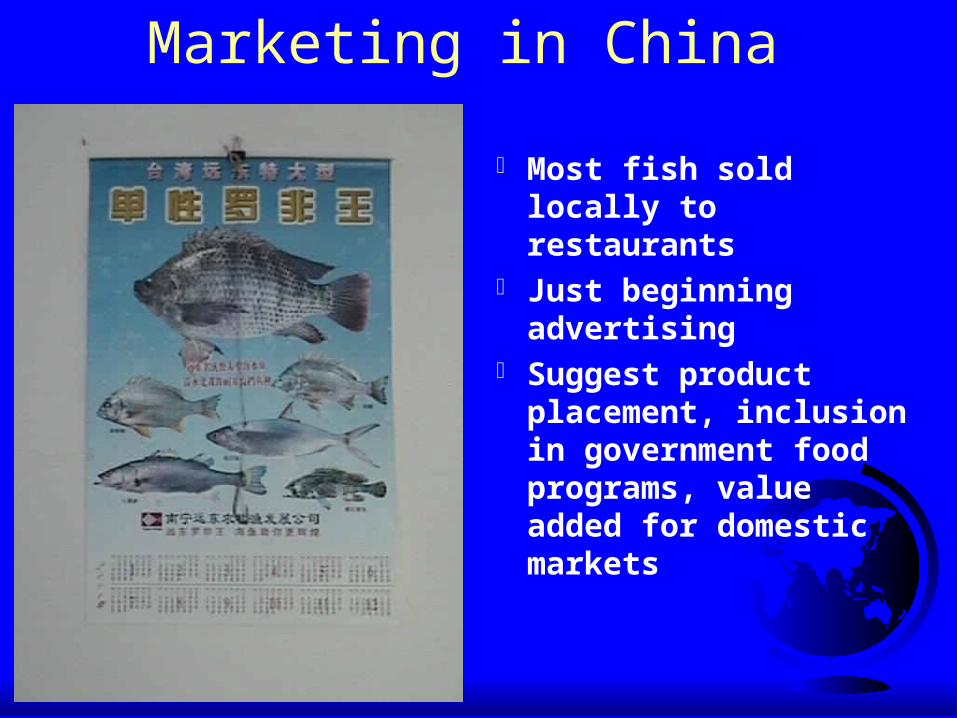
Marketing in China
Most fish sold locally to restaurants
Just beginning advertising
Suggest product placement, inclusion in government food programs, value added for domestic markets
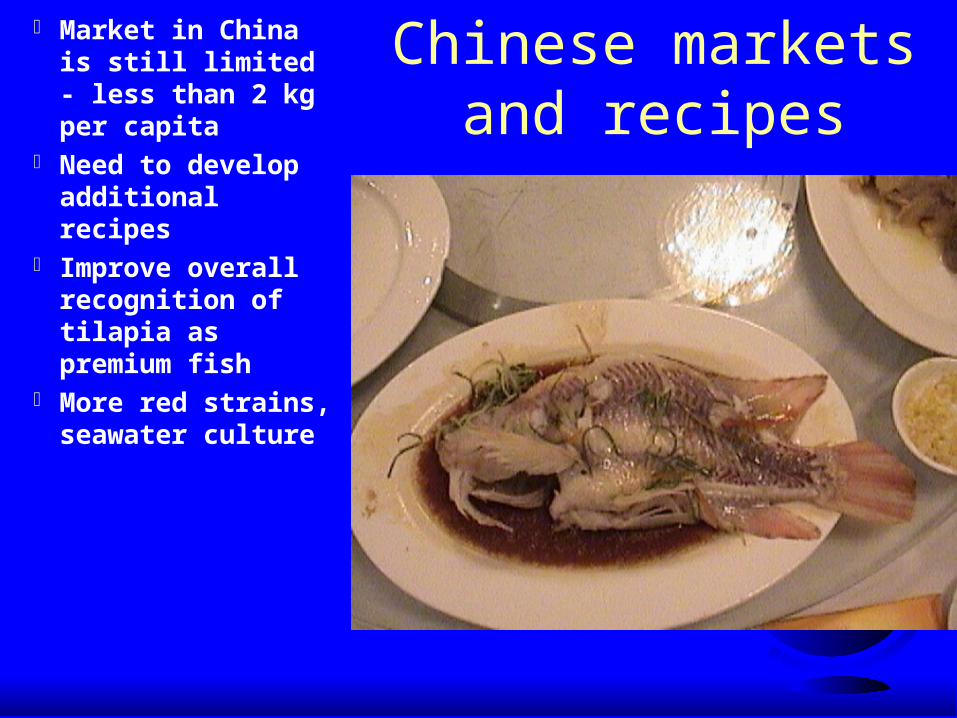
Chinese markets and recipes
Market in China is still limited - less than 2 kg per capita
Need to develop additional recipes
Improve overall recognition of tilapia as premium fish
More red strains, seawater culture
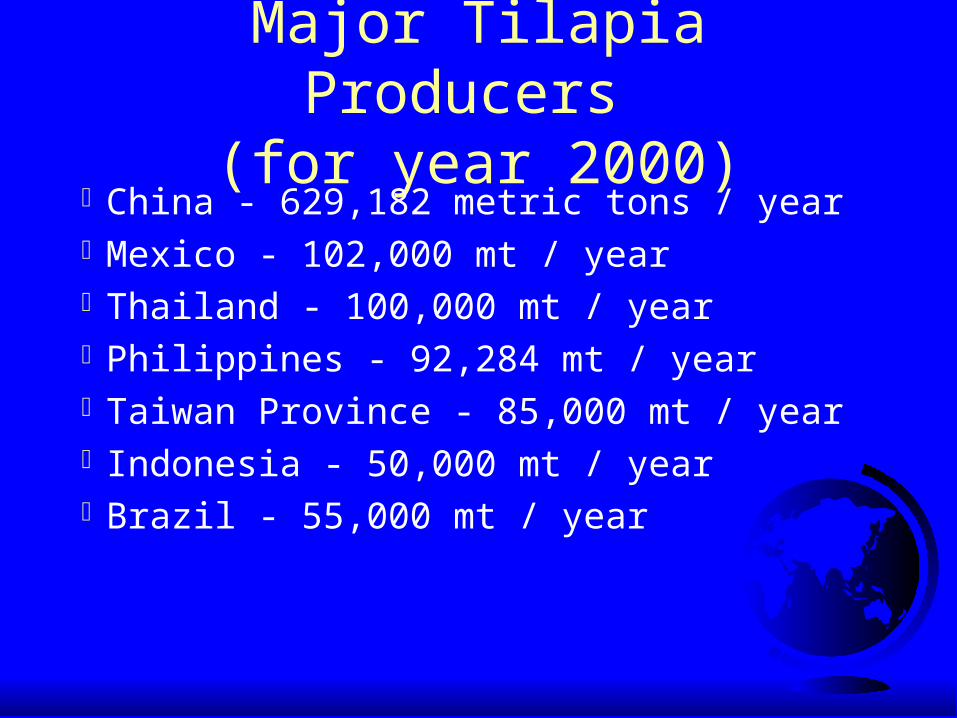
Thailand - 100,000 mt Many small producers Mostly pond production Fertilized and pellet fed Some vertically integrated growers developing C.P. Group developing contract grower
network C.P. pushing “Top Tim” brand of red tilapia
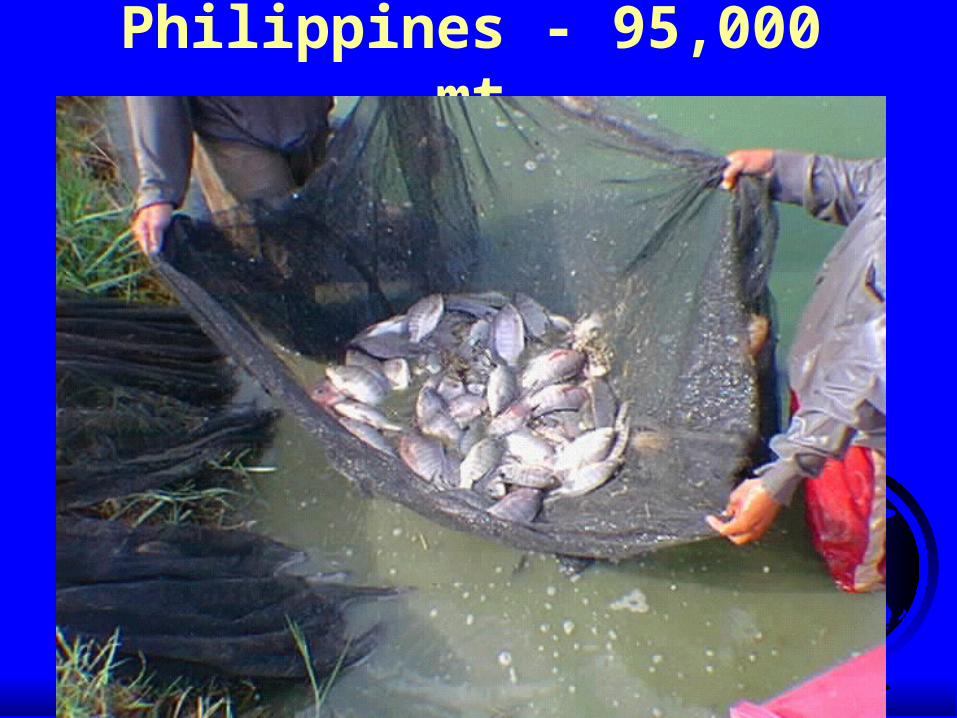
Philippines - 95,000 mt
Cages in Irrigation Reservoirs100 m2 cages in Philippines
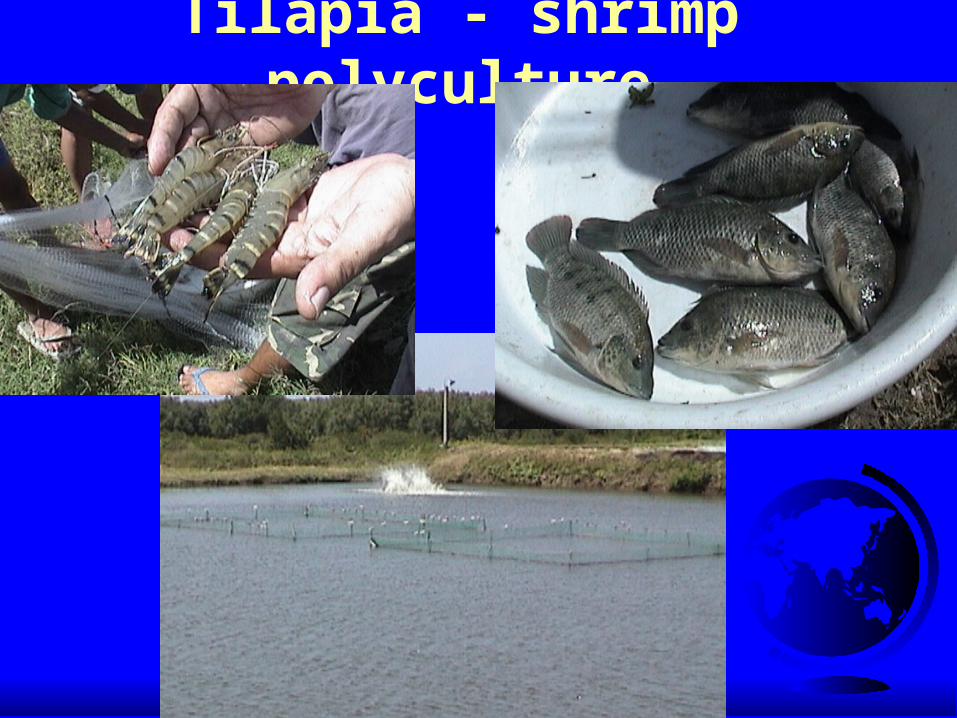
Tilapia - shrimp polyculture
Direct retail sales
Philippines - Strong domestic demand
Early introduction of tilapia Center of research and development Developed tilapia-shrimp polyculture
system
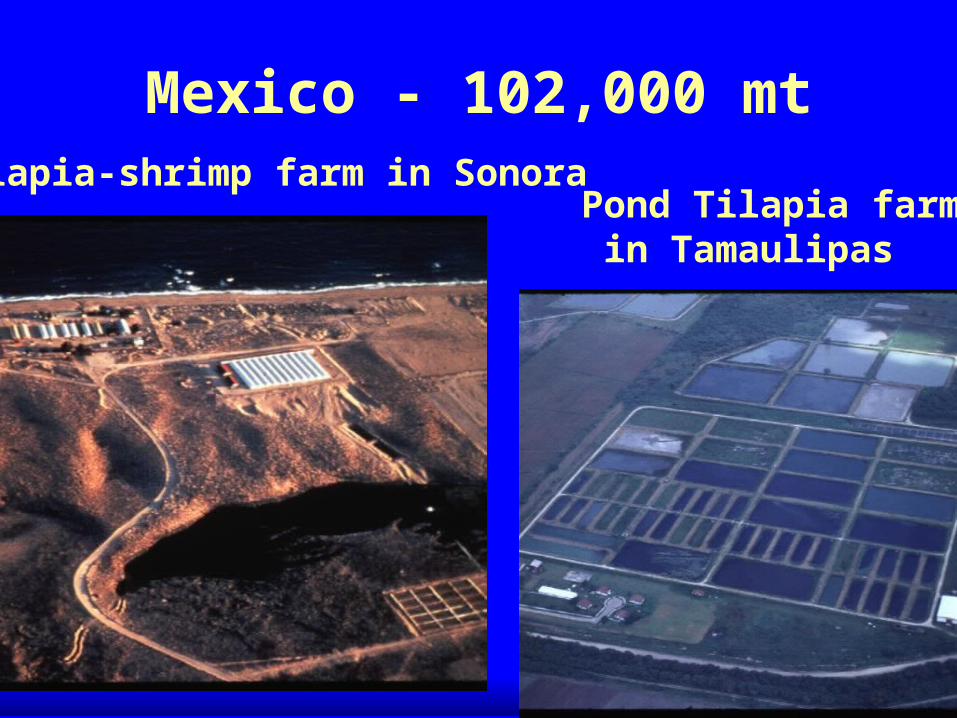
Mexico - 102,000 mtTilapia-shrimp farm in Sonora
Pond Tilapia farm in Tamaulipas
Tilapia production in Mexico
Production in most states of Mexico Most production in southern states Intensive in north, lake ranching in south Repopulation of reservoirs Problem with FAO definition of
aquaculture Tilapia-shrimp polyculture in seawater
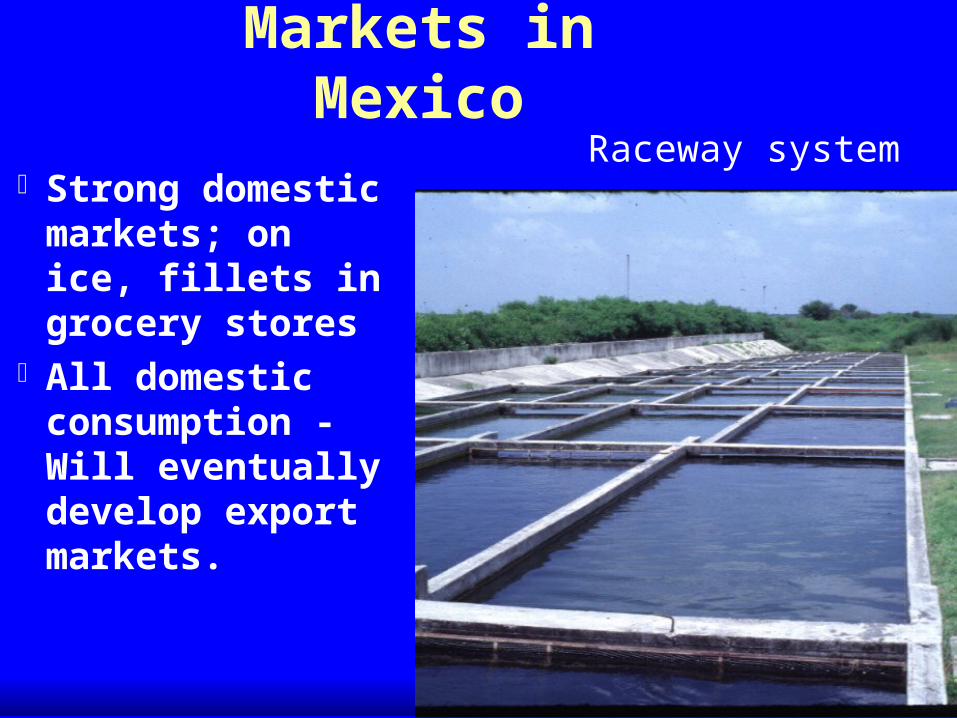
Markets in Mexico
Strong domestic markets; on ice, fillets in grocery stores
All domestic consumption - Will eventually develop export markets.
Raceway system
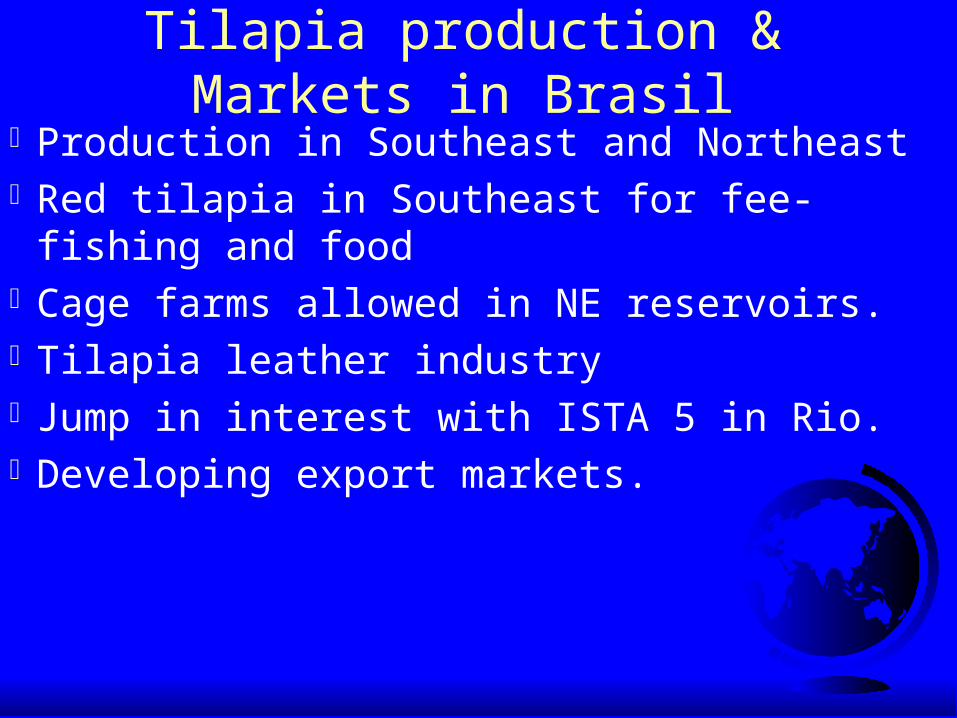
Brazil - 65,000 mt
Tilapia production & Markets in Brasil
Production in Southeast and NortheastRed tilapia in Southeast for fee-fishing
and foodCage farms allowed in NE reservoirs.Tilapia leather industryJump in interest with ISTA 5 in Rio.Developing export markets.
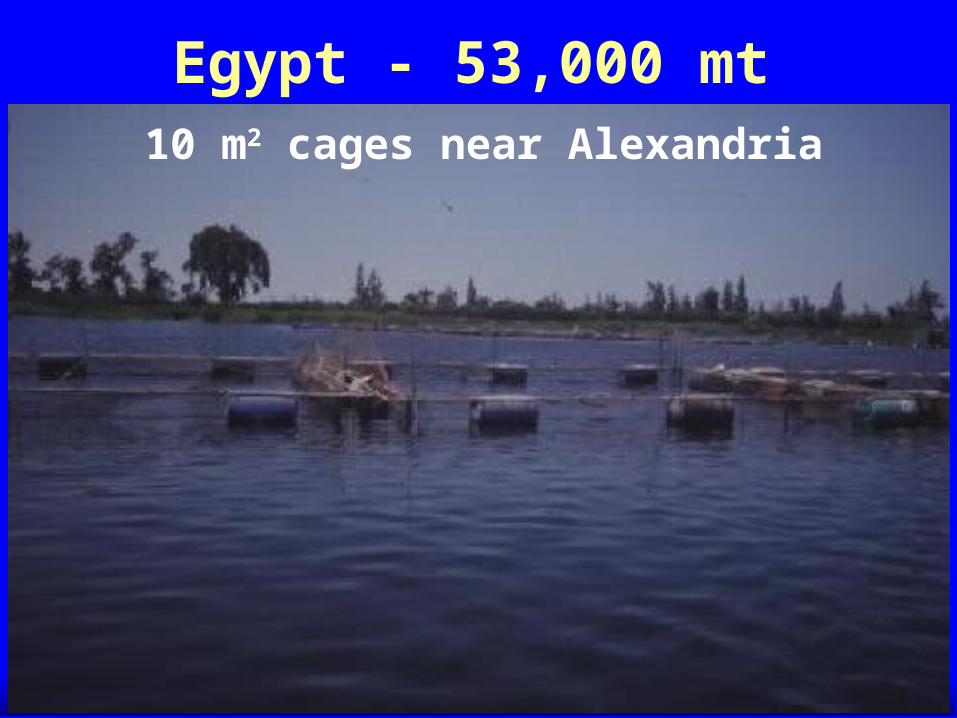
Egypt - 53,000 mt10 m2 cages near Alexandria
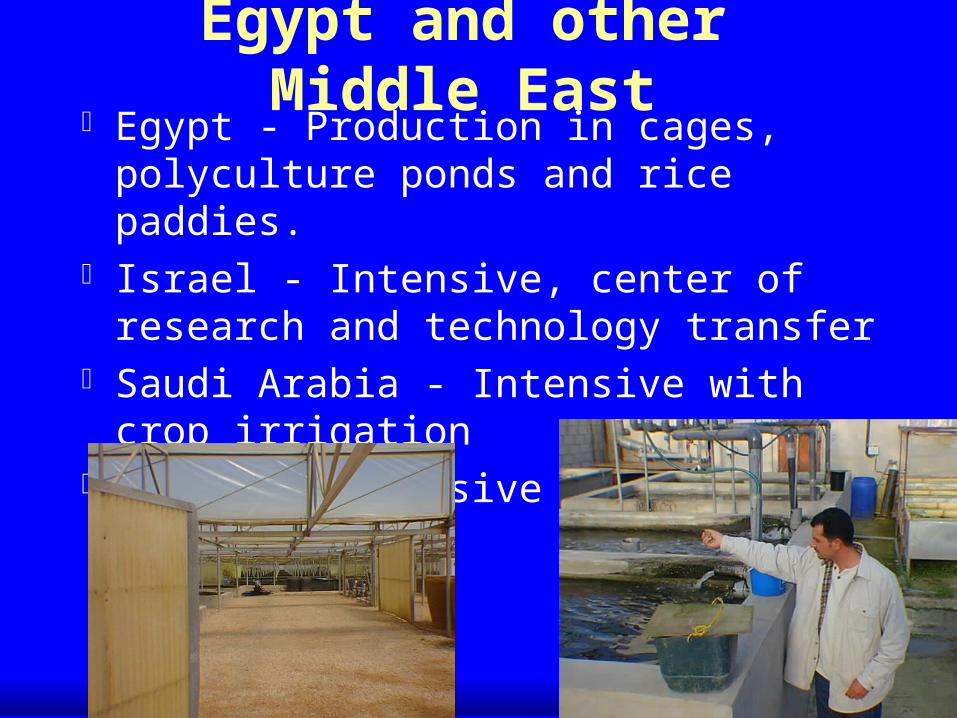
Egypt and other Middle East Egypt - Production in cages, polyculture
ponds and rice paddies. Israel - Intensive, center of research and
technology transfer Saudi Arabia - Intensive with crop
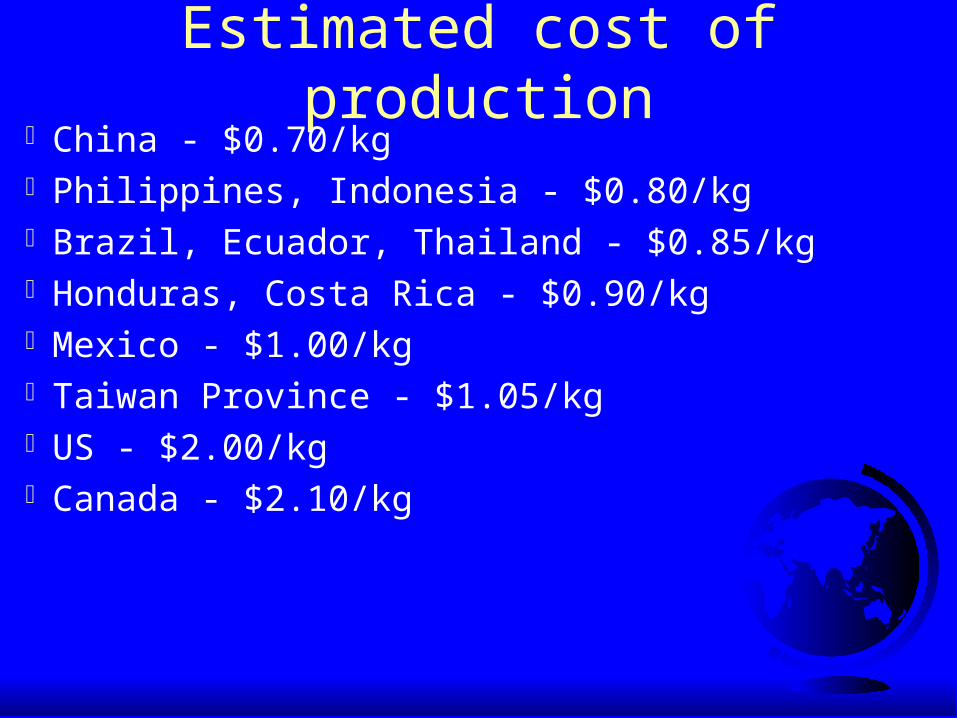
Estimated cost of productionChina - $0.70/kgPhilippines, Indonesia - $0.80/kgBrazil, Ecuador, Thailand - $0.85/kgHonduras, Costa Rica - $0.90/kgMexico - $1.00/kgTaiwan Province - $1.05/kgUS - $2.00/kgCanada - $2.10/kg
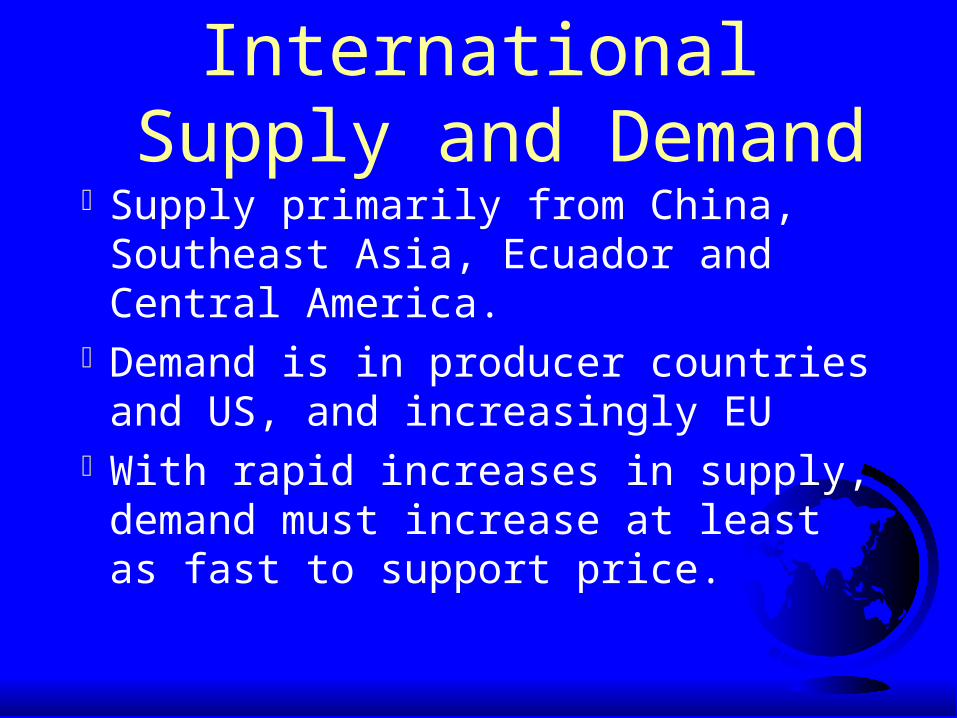
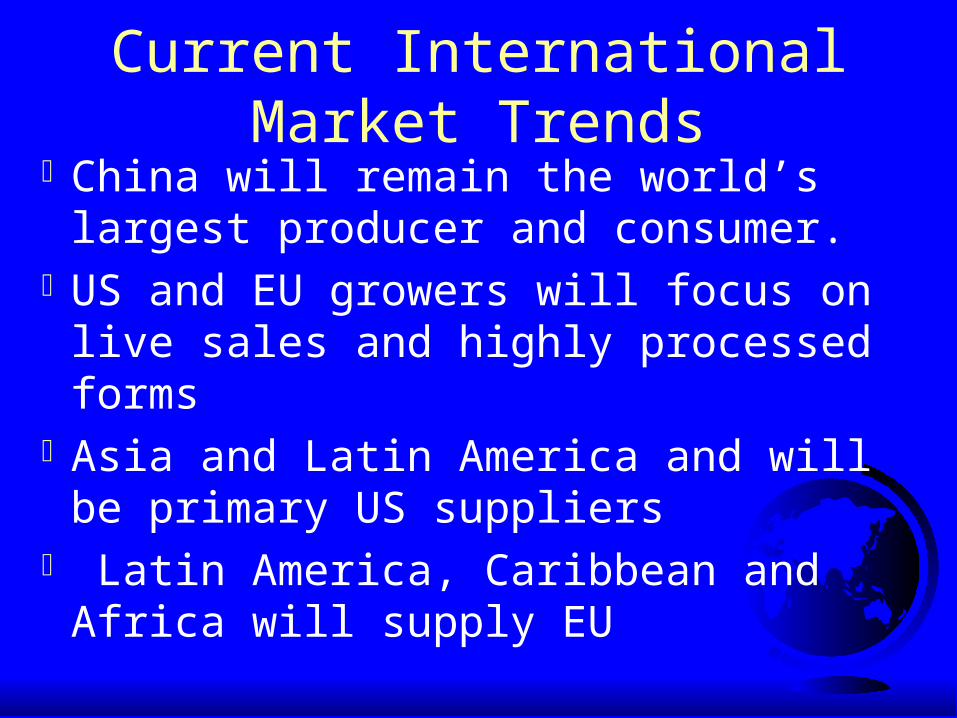
Current International Market Trends
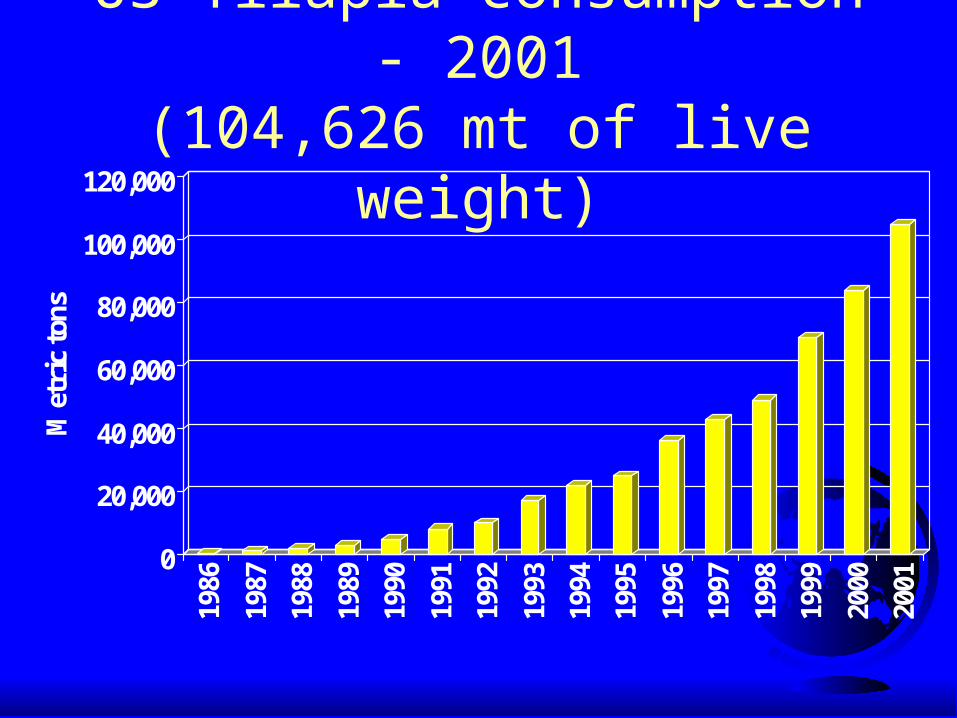
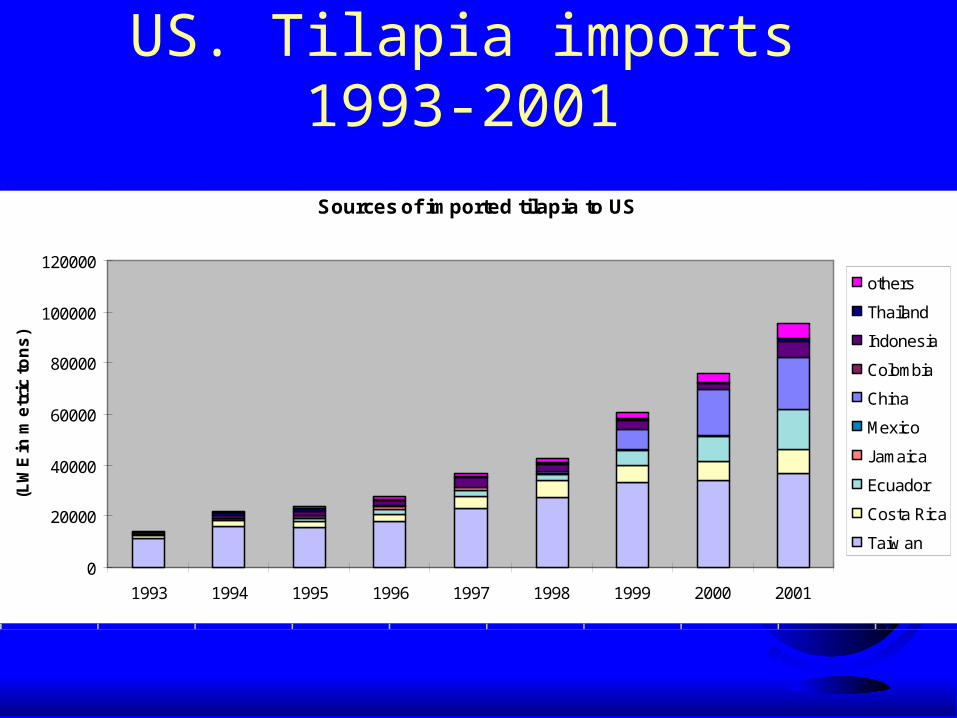
Increase in demand for all forms of tilapia
Demand increase will be greatest for fresh fillets
Prices have been constant for several years and will remain stable, will not increase with inflation.
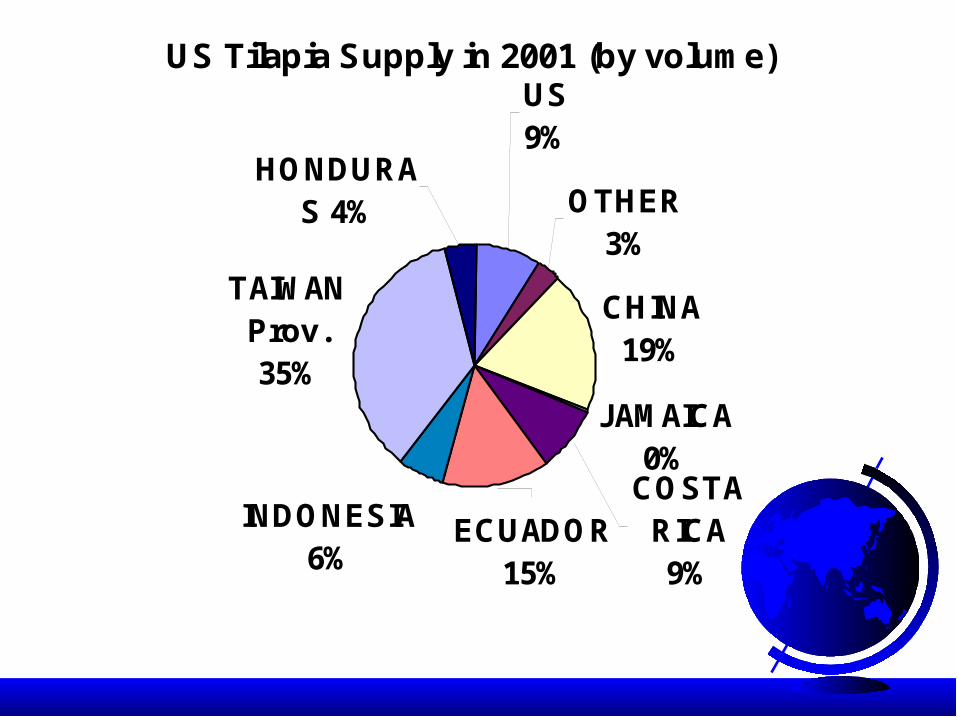
Current International Market TrendsChina will remain the world’s largest
producer and consumer.US and EU growers will focus on live
sales and highly processed formsAsia and Latin America and will be
primary US suppliers Latin America, Caribbean and Africa will
supply EU
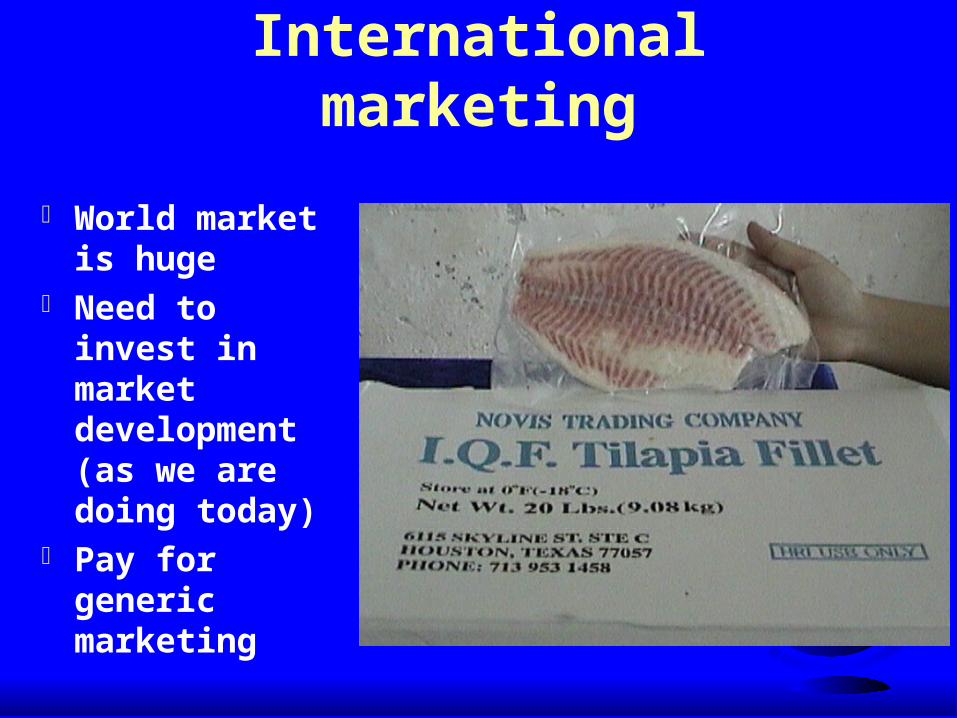
International marketing
World market is huge
Need to invest in market development (as we are doing today)
Pay for generic marketing
Packaging and Delivery
Packaging and Delivery
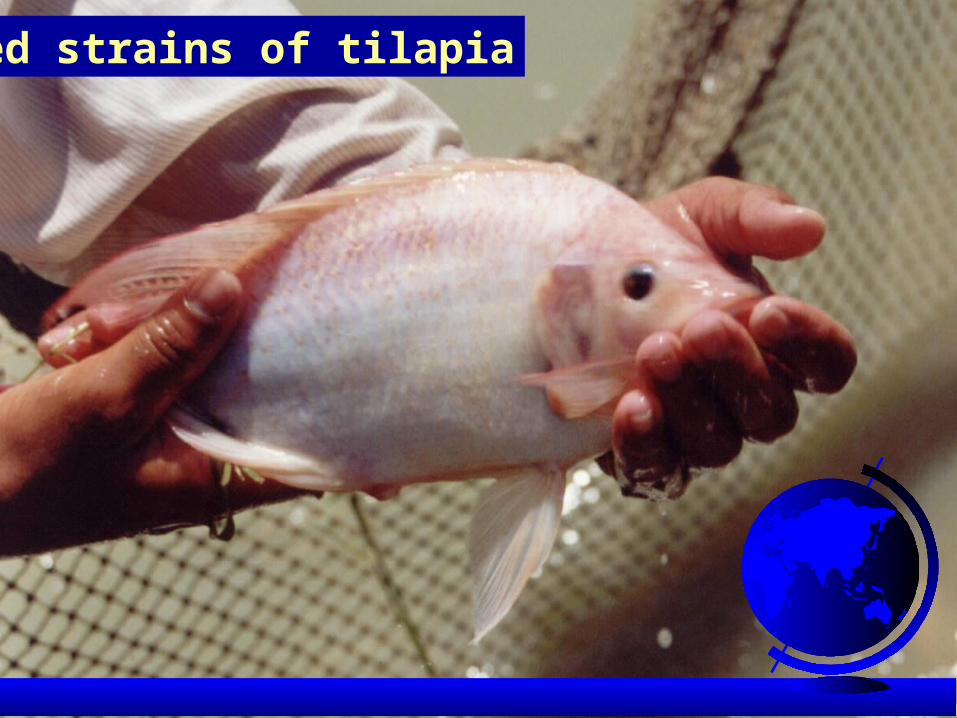
Red strains of tilapia
New recipes
New recipes
Sashimi
Fried tilapia skins
www.tilapia.org
Dear Kevin, I recently began using Tilapia fillets farm raised by Sea
Best and distributed by Beaver Street Fisheries, Inc. I buy these in individual vacuum sealed packages in one pound bags at Wal-Mart in San Marcos, Texas. My husband has diabetes and we both are very weight conscious. This fish is the perfect food item for us, I love the way it is packaged, just use what I need for one meal, it is reasonably priced, always available in the market and consistently high quality. I trust you will forward these comments to the producer.
I LOVE THE PRODUCT!!!! Marian Birnie Aug. 12, 2001
Changes and Predictions
Further intensification in virtually every country
Production will be 75% Oreochromis niloticus, 20% Red strains, O. aureus and O. mossambicus mostly for hybridization
Production will be 50% intensive ponds, 25% cages, 10% intensive recirculating systems
Changes and Predictions Further intensification in virtually every country
Production will be 75% Oreochromis niloticus, 20% Red strains, O. aureus and O. mossambicus mostly for hybridization
Production will be 50% intensive ponds, 25% cages, 10% intensive recirculating systems
Changes and Predictions Further intensification in virtually every country Production will be 75% Oreochromis niloticus, 20% Red
strains, O. aureus and O. mossambicus mostly for hybridization
Production will be 50% intensive ponds, 25% cages, 10% intensive recirculating systems
Changes and Predictions
Leather goods from skin will become a significant contributor to profitability
Processing and "value-adding" will intensify in producing
countries Polyculture with shrimp will become common in most
shrimp farming areas
Changes and Predictions Leather goods from skin will become a significant
contributor to profitability
Processing and "value-adding" will intensify in producing countries
Polyculture with shrimp will become common in most shrimp farming areas
Changes and Predictions Leather goods from skin will become a significant contributor to
profitability
Processing and "value-adding" will intensify in producing
countries Polyculture with shrimp will
become common in most shrimp farming areas (already practiced in Thailand, Philippines, Mexico, US, Ecuador, Peru, Eritrea)
Changes and Predictions
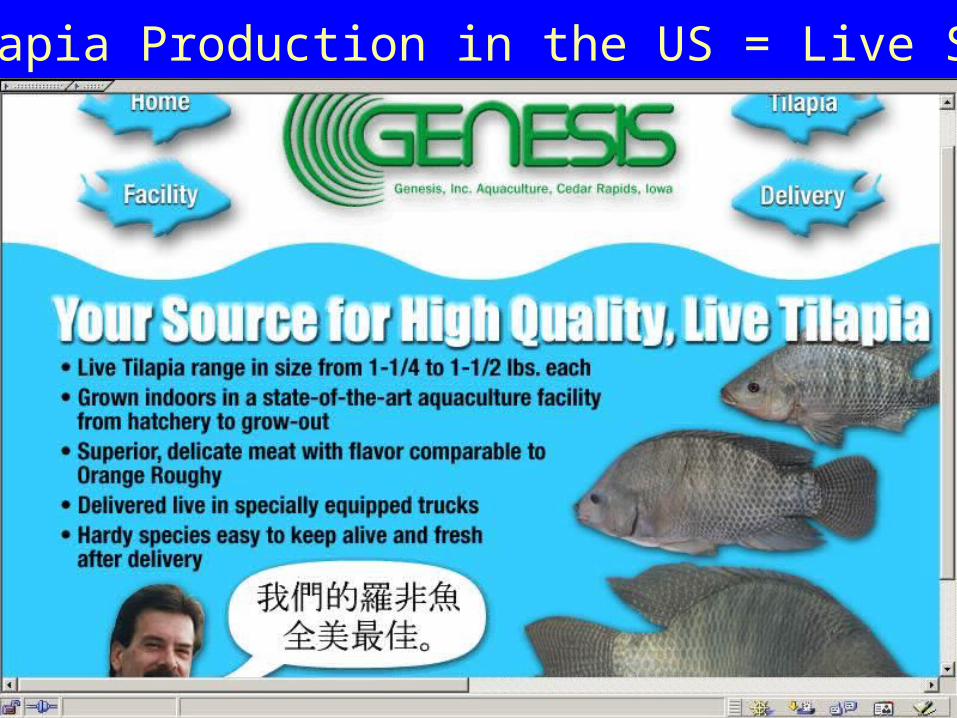
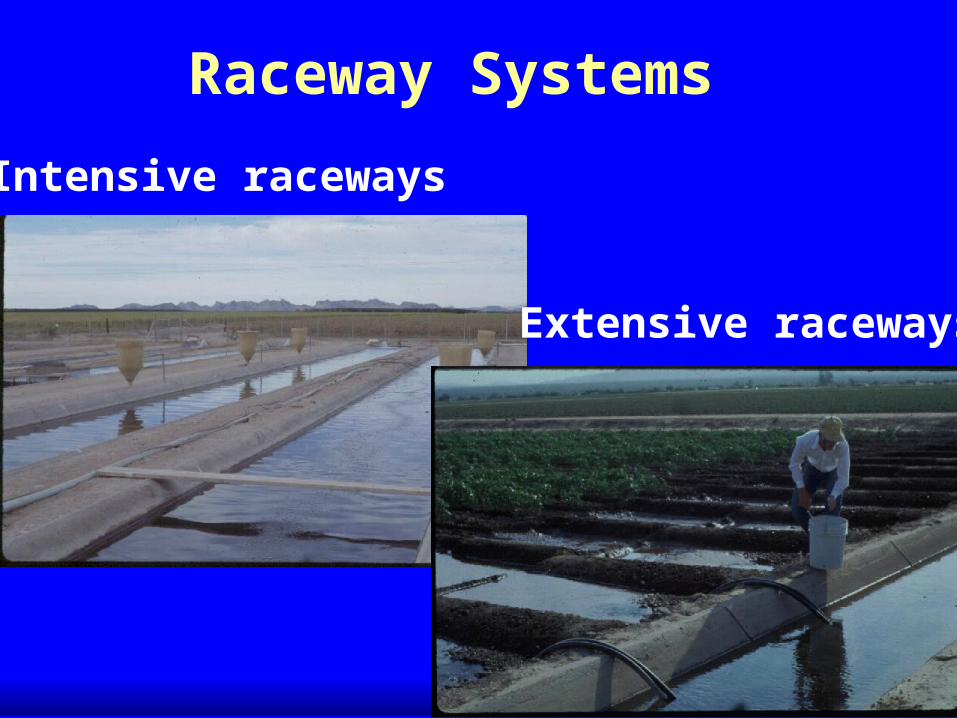
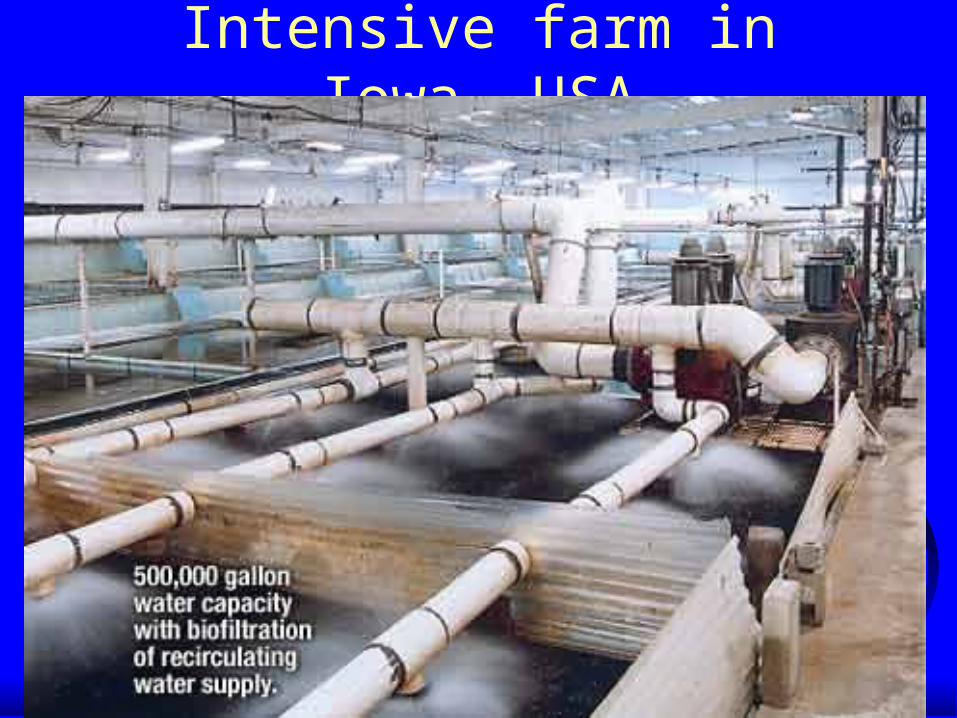
US production will increase slowly, intensifying current production methods
Changes and Predictions US production will increase slowly, intensifying current
production methods
World tilapia production will reach 1,400,000 mt in 2002 and 2,000,000 mt by 2010
Conclusions - Marketing tilapia
Increasing demand / markets should begin in producing country
Opening new markets will be required in China, Philippines, Japan, Korea and US
Many techniques can be used to build markets Many are free or low cost (product
placement, samples, live tanks, Web sites) Most effective forms require investment
Thanks to: Mr. Howard Johnson West Coast Seafood Show