Page 1
Final Presentation
Patty Chuang, John Millspaugh, Molly Patrick, Stephanie Trottier | 04/23/2010 | CAWS1
Water Quality Testing and Water
Use Assessments in
Capiz Province, Philippines
Capiz Assessment and Water Solutions
Page 2
Final Presentation
Patty Chuang, John Millspaugh, Molly Patrick, Stephanie Trottier | 04/23/2010 | CAWS
Population: 700,000
Roxas City: 132,000 people
16 municipalities
Main economies Fishing
Farming
2
Provincial Health Office
Study Area: Capiz Province
Page 3
Final Presentation
Patty Chuang, John Millspaugh, Molly Patrick, Stephanie Trottier | 04/23/2010 | CAWS
Provincial Health Officer: Dr. Jarvis Punsalan
Sanitary Engineer: Jane Delos Reyes
3
Page 4
Final Presentation
Patty Chuang, John Millspaugh, Molly Patrick, Stephanie Trottier | 04/23/2010 | CAWS4
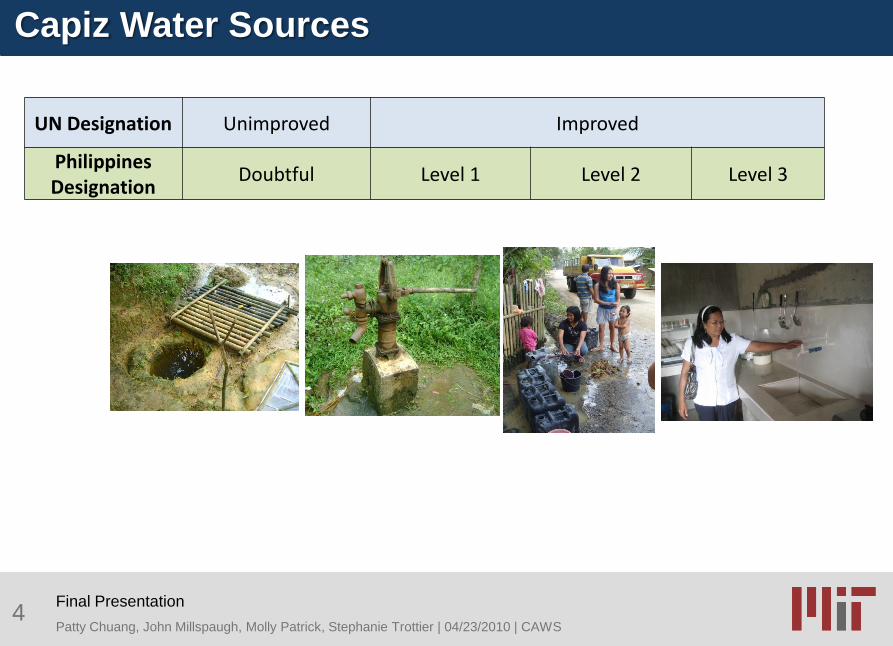
Capiz Water Sources
UN Designation Unimproved Improved
Philippines Designation
Doubtful Level 1 Level 2 Level 3
Page 5
Final Presentation
Patty Chuang, John Millspaugh, Molly Patrick, Stephanie Trottier | 04/23/2010 | CAWS
Selective testing of water sources in 16 municipalities of
Capiz Province for EC-Kit verification and water quality
mapping
Selective testing of water sources to determine the accuracy
of the H2S and Easygel tests and to determine their potential
as complementary EC-Kit tests
Village site visits in each municipality for source and
community water use assessments
Modeling for Panay River water resources planning and
management
5
Project Scope
Page 6
Final Presentation
Patty Chuang, John Millspaugh, Molly Patrick, Stephanie Trottier | 04/23/2010 | CAWS
Comparison of EC-Kit with Quanti-Tray®:
Testing, Verification, and Drinking Water
Quality Mapping
Patty Chuang
6
Page 7
Final Presentation
Patty Chuang, John Millspaugh, Molly Patrick, Stephanie Trottier | 04/23/2010 | CAWS
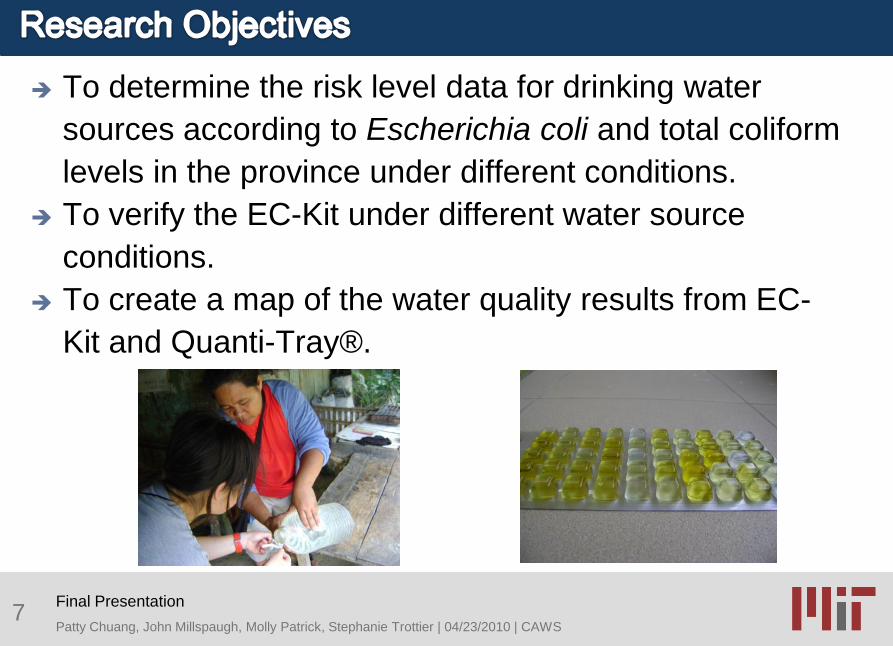
To determine the risk level data for drinking water
sources according to Escherichia coli and total coliform
levels in the province under different conditions.
To verify the EC-Kit under different water source
conditions.
To create a map of the water quality results from EC-
Kit and Quanti-Tray®.
7
Page 8
Final Presentation
Patty Chuang, John Millspaugh, Molly Patrick, Stephanie Trottier | 04/23/2010 | CAWS
The EC-Kit Simple and inexpensive kit
Two complementary tests for E. coli Colilert 10 mL Presence/Absence test
3M‟s Petrifilm™ Enumerative test
IDEXX Quanti-Tray® and Quanti-Tray®/2000 Enzyme substrate coliform tests
Use semi-automated quantification methods based on the
Standard Methods Most Probable Number (MPN) model
Provides bacterial counts of up to 200.5 MPN /100 mL
of sample (or 2419 MPN /100 mL for Quanti-
Tray/2000)
8
Page 9
Final Presentation
Patty Chuang, John Millspaugh, Molly Patrick, Stephanie Trottier | 04/23/2010 | CAWS
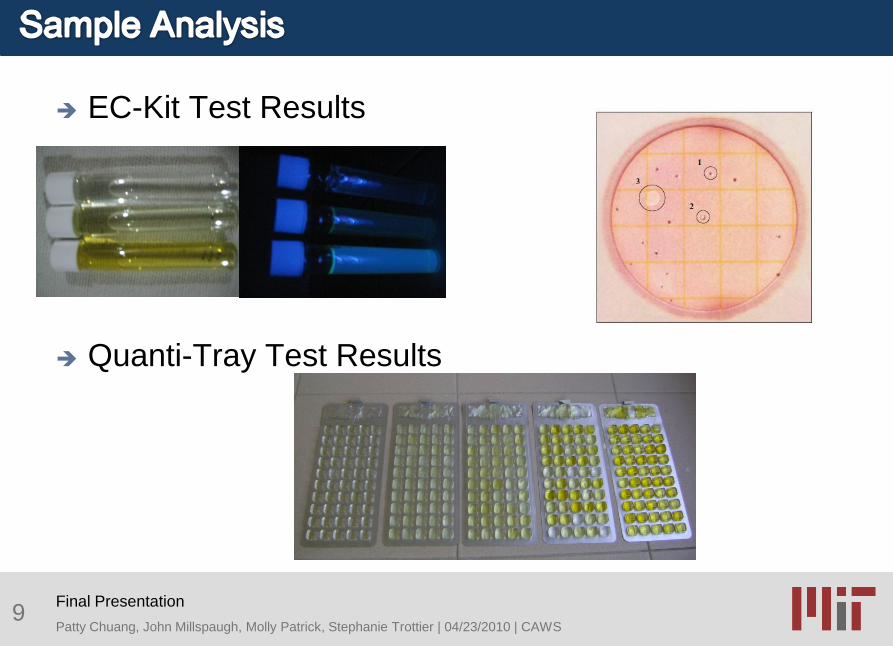
EC-Kit Test Results
Quanti-Tray Test Results
9
Page 10
Final Presentation
Patty Chuang, John Millspaugh, Molly Patrick, Stephanie Trottier | 04/23/2010 | CAWS
E.coli counts from Colilert and Petrifilm enable the
determination of different levels of risk
10
(Adapted from WHO, 1997, replacing “thermotolerant bacteria” with “E. coli”) (Metcalf, 2006)
EC-Kit Results Risk Level Categories
Colilert E. coli Result
(Metcalf, 2006)
Petrifilm E. coli Result
(Metcalf, 2006)
Risk Level
(WHO, 1997)
E.coli in sample
(coliform forming unit per
100 mL) (WHO, 1997)
Absent (clear = below detection) 0 Conformity < 1
Absent (clear = below detection) 0 Low 1-10
Present (yellow, blue fluorescence) 0 Intermediate 10-100
Present (yellow, blue fluorescence)1-10 (blue with gas
bubbles count)High 100-1000
Present (yellow, blue fluorescence)> 10 (blue with gas
bubbles count)Very High > 1000
Page 11
Final Presentation
Patty Chuang, John Millspaugh, Molly Patrick, Stephanie Trottier | 04/23/2010 | CAWS
Water Quality Test Results
561 water samples 521 water samples collected in Capiz Province
40 water samples collected from the Charles River
Each sample was tested in the field using the two
component tests of the EC-Kit and Quanti-Tray®
For all statistical analyses, STATA: Data Analysis and
Statistical Software (Version 11.0) was used
Page 12
Final Presentation
Patty Chuang, John Millspaugh, Molly Patrick, Stephanie Trottier | 04/23/2010 | CAWS
Chi-square test for Capiz Water Samples
Quanti-Tray® Most Probable Number
Risk Level Conformity/Low/Intermediate High/Very High Total
PetrifilmTMLow/Conformity/Intermediate 353 19 372
High/Very High 43 106 149
Total 396 125 521
Quanti-Tray®
Presence Absence Total
ColilertPresence 242 32 274
Absence 101 146 247
Total 343 178 521
Quanti-Tray® Most Probable Number
Risk Level Conformity/Low Intermediate High/Very High Total
EC-Kit
Low/Conformity 230 13 4 247
Intermediate 76 34 15 125
High/Very High 13 30 106 149
Total 319 77 125 521
χ² =254.3837
Pr = 0.000
χ² =129.923
Pr = 0.000
χ² =336.2617
Pr = 0.000
Page 13
Final Presentation
Patty Chuang, John Millspaugh, Molly Patrick, Stephanie Trottier | 04/23/2010 | CAWS
Quanti-Tray® Most Probable Number
Risk Level Conformity/Low/Intermediate High/Very High Total
PetrifilmTMLow/Conformity/Intermediate 68% 4% 71%
High/Very High 8% 20% 29%
Total 76% 24% 100%
2x2 Frequency Distribution Table for Capiz
Quanti-Tray®
Presence Absence Total
ColilertPresence 46% 6% 53%
Absence 19% 28% 47%
Total 66% 34% 100%
Quanti-Tray® Most Probable Number
Risk Level Conformity/Low Intermediate High/Very High Total
EC-Kit
Low/Conformity 44% 2% 1% 47%
Intermediate 15% 7% 3% 24%
High/Very High 2% 6% 20% 29%
Total 61% 15% 24% 100%
True Results
= 88%
True Results
= 74%
True Results
= 71%
Page 14
Final Presentation
Patty Chuang, John Millspaugh, Molly Patrick, Stephanie Trottier | 04/23/2010 | CAWS14
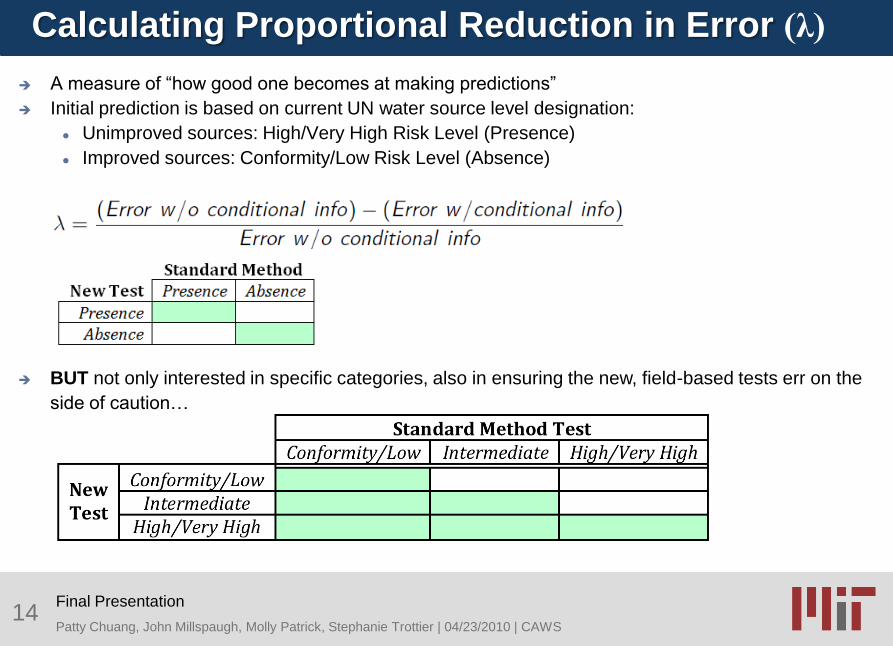
Calculating Proportional Reduction in Error (λ)
A measure of “how good one becomes at making predictions”
Initial prediction is based on current UN water source level designation:
Unimproved sources: High/Very High Risk Level (Presence)
Improved sources: Conformity/Low Risk Level (Absence)
BUT not only interested in specific categories, also in ensuring the new, field-based tests err on the
side of caution…
Page 15
Final Presentation
Patty Chuang, John Millspaugh, Molly Patrick, Stephanie Trottier | 04/23/2010 | CAWS15
Proportional Reduction in Error
Tests ErrorProportional Reduction
in Error (λ)
Unimproved + Quanti-Tray 15%
Unimproved + Colilert 12% 25%
Unimproved + Petrifilm 37% -138%
Unimproved + EC-Kit 6% 63%
Improved + Quanti-Tray 64%
Improved + Colilert 27% 58%
Improved + Petrifilm 39% 39%
Improved + EC-Kit 6% 60%
Page 16
Final Presentation
Patty Chuang, John Millspaugh, Molly Patrick, Stephanie Trottier | 04/23/2010 | CAWS17
Page 17
Final Presentation
Patty Chuang, John Millspaugh, Molly Patrick, Stephanie Trottier | 04/23/2010 | CAWS19
Water Quality Mapping
Page 18
Final Presentation
Patty Chuang, John Millspaugh, Molly Patrick, Stephanie Trottier | 04/23/2010 | CAWS20
Water Quality Mapping
Page 19
Final Presentation
Patty Chuang, John Millspaugh, Molly Patrick, Stephanie Trottier | 04/23/2010 | CAWS
Conclusion Each component of EC-Kit and the entire kit is correlated to
Quanti-Tray® in a statistically significant way (chi-square test)
We can make better predictions with the use of just Colilert, but
not Petrifilm (due to detection limit)
A combination of both tests in the form of the EC-Kit allows for
best predictions
Proportional reduction in error in using the EC-Kit is 62.5% for
unimproved water sources and 59.8% for improved water
sources
21
Conclusion
Page 20
Final Presentation
Patty Chuang, John Millspaugh, Molly Patrick, Stephanie Trottier | 04/23/2010 | CAWS
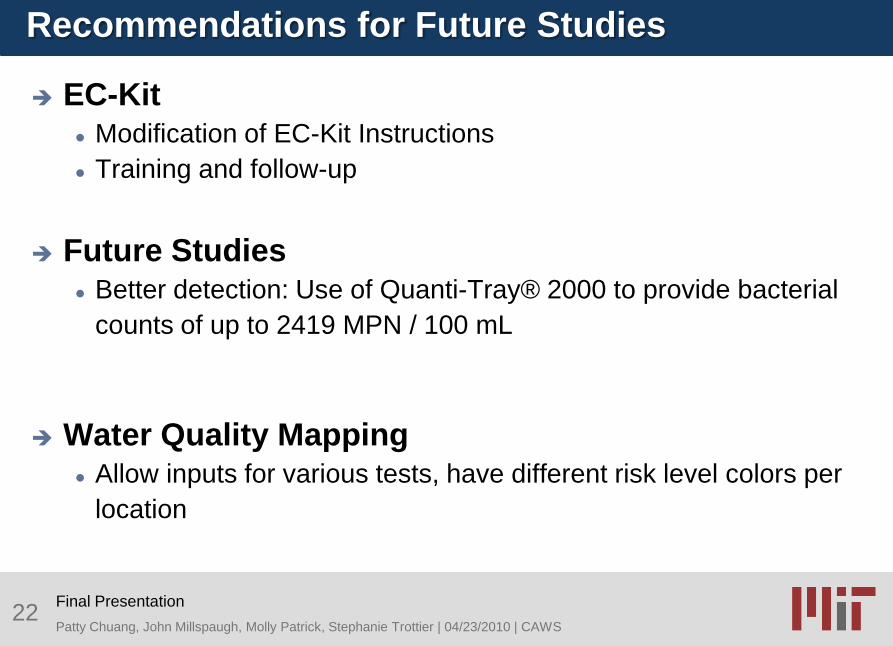
EC-Kit Modification of EC-Kit Instructions
Training and follow-up
Future Studies Better detection: Use of Quanti-Tray® 2000 to provide bacterial
counts of up to 2419 MPN / 100 mL
Water Quality Mapping Allow inputs for various tests, have different risk level colors per
location
22
Recommendations for Future Studies
Page 21
Final Presentation
Patty Chuang, John Millspaugh, Molly Patrick, Stephanie Trottier | 04/23/2010 | CAWS
New potential tests for EC-Kit:Hydrogen Sulfide (H2S) Test
Easygel Test
Water Quality Assessment
Stephanie Trottier
23
Page 22
Final Presentation
Patty Chuang, John Millspaugh, Molly Patrick, Stephanie Trottier | 04/23/2010 | CAWS
Validate the accuracy of the H2S test, Easygel, and EC-Kit
tests (Colilert and Petrifilm) against a Standard Methods test Field tests in Capiz Province (vs. Quanti-Tray)
Laboratory tests at MIT, Cambridge (vs. Quanti-Tray and membrane
filtration)
Compare accuracy of H2S test using different testing
parameters Sample volume (10, 20 and 100 mL)
Test reagent (Laboratory-made and HACH Pathoscreen)
Provide Recommendations Combination of tests that yield the most accurate results
Price and practicality/ease of use
24
Page 23
Final Presentation
Patty Chuang, John Millspaugh, Molly Patrick, Stephanie Trottier | 04/23/2010 | CAWS25
H2S test Presence/Absence test
Detects presence or
absence of H2S-producing
bacteria
n = 203 samples
Easygel test Enumerative test
E.coli and total coliform
colony counts
n = 83 samples
Micrology Laboratories, 2009
Page 24
Final Presentation
Patty Chuang, John Millspaugh, Molly Patrick, Stephanie Trottier | 04/23/2010 | CAWS26
Colilert Presence/Absence test
Detects presence or
absence of E.coli and total
coliform
n = 218 samples
Petrifilm test Enumerative test
E.coli and total coliform
colony counts
n = 218 samples
Photo credit: Robert MetcalfWork Journal, 2009
Page 25
Final Presentation
Patty Chuang, John Millspaugh, Molly Patrick, Stephanie Trottier | 04/23/2010 | CAWS
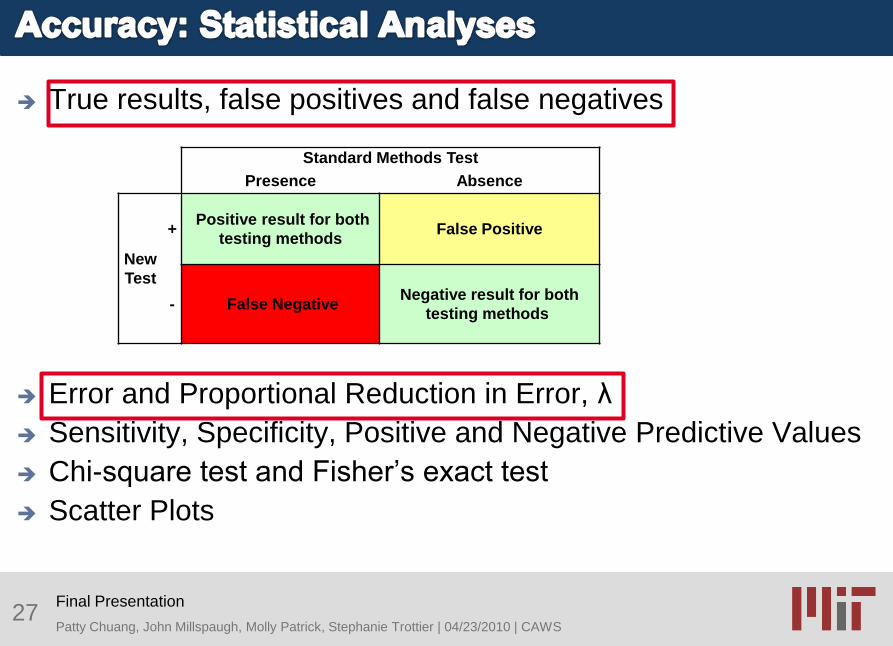
True results, false positives and false negatives
Error and Proportional Reduction in Error, λ
Sensitivity, Specificity, Positive and Negative Predictive Values
Chi-square test and Fisher‟s exact test
Scatter Plots
27
Standard Methods Test
Presence Absence
New
Test
+Positive result for both
testing methodsFalse Positive
- False NegativeNegative result for both
testing methods
Page 26
Final Presentation
Patty Chuang, John Millspaugh, Molly Patrick, Stephanie Trottier | 04/23/2010 | CAWS28
TEST n True ResultsFalse
Positives
False
Negatives
10-mL H2S 203 80% 9% 11%
20-mL H2S 203 84% 10% 6%
100-mL H2S 202 80% 16% 4%
20-mL HACH 203 79% 9% 12%
Easygel 83 81% 1% 17%
Colilert 218 83% 5% 11%
Petrifilm 218 67% 3% 30%
No clear “best test”
Need to test the accuracy of test combinations…
Page 27
Final Presentation
Patty Chuang, John Millspaugh, Molly Patrick, Stephanie Trottier | 04/23/2010 | CAWS29
λ
A measure of “how good one becomes at making predictions”
Initial prediction is based on current UN water source level
designation
Unimproved sources: High/Very High Risk Level (Presence)
Improved sources: Conformity/Low Risk Level (Absence)
BUT not only interested in specific categories, also in ensuring
the new, field-based tests err on the side of caution…
Page 28
Final Presentation
Patty Chuang, John Millspaugh, Molly Patrick, Stephanie Trottier | 04/23/2010 | CAWS30
λ
COMBINATIONSUnimproved Sources Improved Sources
Error λ n Error λ n
EC-Kit (Colilert + Petrifilm) 3.6% 51% 28 4.8% 90% 126
Petrifilm + 10-mL H2S test 9.1% 82% 33 3.5% 93% 114
Petrifilm + 20-mL H2S test 12.1% -33% 33 2.4% 95% 126
Petrifilm + 100-mL H2S test 6.1% 33% 33 1.6% 97% 125
Petrifilm + 20-mL HACH test 15.2% -67% 33 1.6% 97% 125
Easygel + Colilert 0.0% 100% 13 0.0% 100% 28
Easygel + 10-mL H2S test 0.0% 100% 4 0.0% 100% 18
Easygel + 20-mL H2S test 0.0% 100% 4 0.0% 100% 19
Easygel + 100-mL H2S test 0.0% 100% 3 0.0% 100% 19
Easygel + 20-mL HACH test 0.0% 100% 3 0.0% 100% 22
Page 29
Final Presentation
Patty Chuang, John Millspaugh, Molly Patrick, Stephanie Trottier | 04/23/2010 | CAWS
Other factors to include:
Cost of test vials/bottles
Cost of sterile sampling bags
Freight and transportation charges
31
TESTCost/test in
United States
Cost/test in
Philippines
EC-Kit ~$3.00 ~$3.00
10-mL H2S $0.07 $0.17
20-mL H2S $0.14 $0.33
100-mL H2S $0.35 $0.83
20-mL HACH $0.59 n/a
Easygel $1.63 n/a
Page 30
Final Presentation
Patty Chuang, John Millspaugh, Molly Patrick, Stephanie Trottier | 04/23/2010 | CAWS
Tests were rated based on the following criteria
Scores (Very Poor: 1 to Very Good: 5) were assigned
for each criterion
32
1. Ease of training for test users: testers and readers
2. Ease of acquiring/making reagents
3. Ease of transportation, storage, and disposal of samples and tests
4. Ease of processing samples
5. Short incubation times
6. Use of electric incubator
7. Easy-to-read results
Page 31
Final Presentation
Patty Chuang, John Millspaugh, Molly Patrick, Stephanie Trottier | 04/23/2010 | CAWS33
CriteriaH2S test
Easygel EC-KitLab HACH
Ease of training test users 5 5 4 3
Ease of acquiring/making reagents 2 5 3 2
Ease of
transportation/storage/disposal of
samples and tests
3 4 3 3
Ease of processing samples 5 5 4 3
Short incubation times 5 3 4 4
Use of electric incubator 5 5 5 5
Easy-to-read results 5 5 4 2
TOTAL 30 32 27 22
Page 32
Final Presentation
Patty Chuang, John Millspaugh, Molly Patrick, Stephanie Trottier | 04/23/2010 | CAWS
Recommendations, based on data presented: P/A test: 20-mL H2S test
Quantitative test: Easygel test
Combination: Easygel + 20-mL H2S test is the best combination,
based on accuracy (TR, FP, FN, and λ), cost, and
practicality/ease of use
Future studies Perform a larger scale Easygel verification, in conjunction with
the 20-mL H2S test
For Easygel + 20-mL H2S test results: refine corresponding
WHO Risk Levels
Look at test result accuracy of combination of 2 P/A tests, and
find corresponding WHO Risk Levels
34
Recommendations and Future Studies
Page 33
Final Presentation
Patty Chuang, John Millspaugh, Molly Patrick, Stephanie Trottier | 04/23/2010 | CAWS
Recommendations for at-risk
water supplies in Capiz Province
Using Water Source and Community
Assessments
Molly Patrick
35
Page 34
Final Presentation
Patty Chuang, John Millspaugh, Molly Patrick, Stephanie Trottier | 04/23/2010 | CAWS
Make technical, managerial and strategic
recommendations for improving water quality and
management in Capiz
Overarching motivation to provide useful, realistic and
sustainable recommendations for the PHO and Capizians
Primary Project Objective
Page 35
Final Presentation
Patty Chuang, John Millspaugh, Molly Patrick, Stephanie Trottier | 04/23/2010 | CAWS
Conduct technical assessments of identified „at-risk‟
water supplies
Infrastructure
Hazard identification
Use qualitative research methods to assess the non-
technical issues
Different needs for water for different purposes
Perceived quality needed for different uses
Fieldwork Objectives
Page 36
Final Presentation
Patty Chuang, John Millspaugh, Molly Patrick, Stephanie Trottier | 04/23/2010 | CAWS38
Water Source and Community Assessments
52 WHO Sanitary (Site) Surveys
51 Stakeholder Interviews and Group
Discussions
Stakeholders Barangay captain/official/councilor
Farmer
Household user – mainly women
Page 37
Final Presentation
Patty Chuang, John Millspaugh, Molly Patrick, Stephanie Trottier | 04/23/2010 | CAWS39
Water Quality Results- Quanti-Tray ®
Shows improving water quality with Source Level
0
20
40
60
80
100
Doubtful Level 1 Level 2 Level 3
% o
f to
tal (c
um
ula
tiv
e)
Source Level
Overall E.coli Risk Level by source level (%)- Capiz Province
High/Very High
Intermediate
Low
Conformity
WHO Risk Level
N = 61 371 67 70
Page 38
Final Presentation
Patty Chuang, John Millspaugh, Molly Patrick, Stephanie Trottier | 04/23/2010 | CAWS40
Water Quality Results- Quanti-Tray ®
Level 1 sources show highest variability in water quality
0
20
40
60
80
100
120
140
Conformity Low Intermediate High/Very High
# o
f sam
ple
s
WHO Risk Level
Source Level distribution by WHO Risk Level- Capiz Province
Doubtful
Level 1
Level 2
Level 3
Source Level
Page 39
Final Presentation
Patty Chuang, John Millspaugh, Molly Patrick, Stephanie Trottier | 04/23/2010 | CAWS41
LEVEL Water Source Code Water Source
D OD Open dug well
US Unprotected spring
SW Surface water (Rivers, streams, creeks)
OT Others not mentioned above
L1 SWP Shallow well with pump (<60 ft)
JMP Jetmatic Pump w/ or w/o motor
DWP Deep well with pump (>60 ft)
PDW Protected dug well
PS Protected spring w/o distribution
RW Rain water catchments (ferro cement tanks)
L2 GPS Gravity protected spring w/ pipe distribution,
Communal tap stands
DWP Deep well w/ pump w/ pipe distribution,
Communal tap stands
L3 WD Water Districts
LWUA Local water utilities administration
BAWASA Barangay waterworks system
Water Source Types
Page 40
Final Presentation
Patty Chuang, John Millspaugh, Molly Patrick, Stephanie Trottier | 04/23/2010 | CAWS42
Water Quality Results- Quanti-Tray ®
Level 2 and Level 3 source types showed 70% or more of samples in the low risk to conformity levels
0
10
20
30
40
50
60
70
80
90
100
OT
SW
OD
US
JM
P
SW
P
RW
DW
P
PD
W PS
DW
P (
L2)
GP
S
LW
UA
D L1 L2 L3
% o
f to
tal (c
um
ula
tiv
e)
Water Source Type
WHO Risk Level per Source Type
High/Very High
Intermediate
Low
Conformity
N = 6 1 42 12 293 30 19 13 9 7 30 37 70
WHO Risk Level
Page 41
Final Presentation
Patty Chuang, John Millspaugh, Molly Patrick, Stephanie Trottier | 04/23/2010 | CAWS43
WHO Sanitary Survey Results
Page 42
Final Presentation
Patty Chuang, John Millspaugh, Molly Patrick, Stephanie Trottier | 04/23/2010 | CAWS44
WHO Sanitary Survey Results
77% of sources surveyed High/Very High Risk Level
0
10
20
30
40
50
60
70
80
90
100
OD JMP PS PDW DWP
D L1 L2
% o
f so
urc
es
sam
ple
d (
cum
ula
tiv
e)
Water Source Type
Sanitary Survey Risk Level by water source type (%)- Capiz Province
Very High
High
Intermediate
Low
WHO Risk Level
WHO Sanitary Survey conducted in January 2010
N = 22 25 2 2 1
Page 43
Final Presentation
Patty Chuang, John Millspaugh, Molly Patrick, Stephanie Trottier | 04/23/2010 | CAWS
Major Hazards: Unprotected Wells
Broken or cracked platform Broken handpump Use of dirty water to prime
the pump Improper siting Poor drainage
Broken platform
Unsanitary priming
Page 44
Final Presentation
Patty Chuang, John Millspaugh, Molly Patrick, Stephanie Trottier | 04/23/2010 | CAWS
Major hazards: Inadequate Site Protection
Proximity of septic tanks (or latrines) to wells
Page 45
Final Presentation
Patty Chuang, John Millspaugh, Molly Patrick, Stephanie Trottier | 04/23/2010 | CAWS
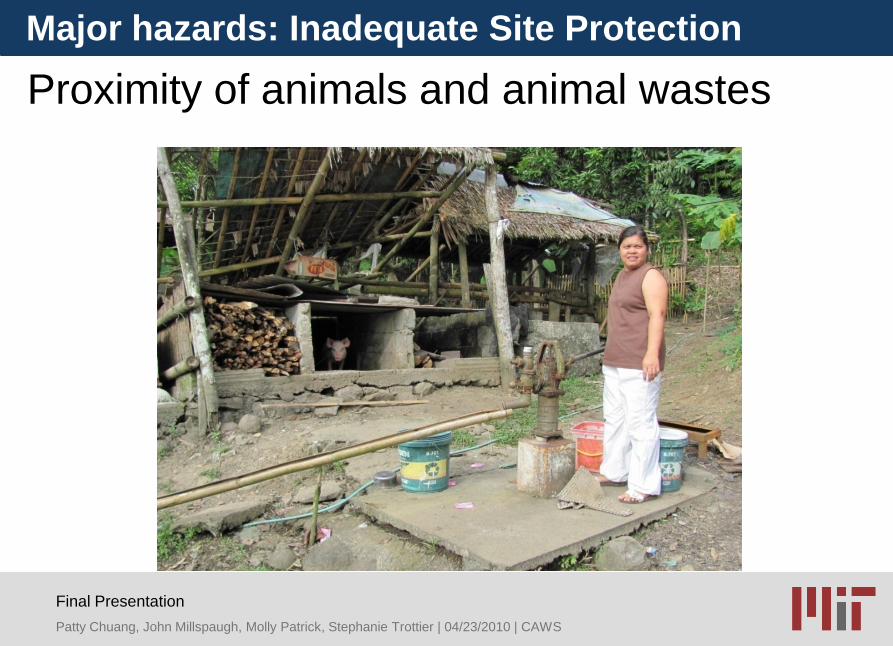
Proximity of animals and animal wastes
Major hazards: Inadequate Site Protection
Page 46
Final Presentation
Patty Chuang, John Millspaugh, Molly Patrick, Stephanie Trottier | 04/23/2010 | CAWS48
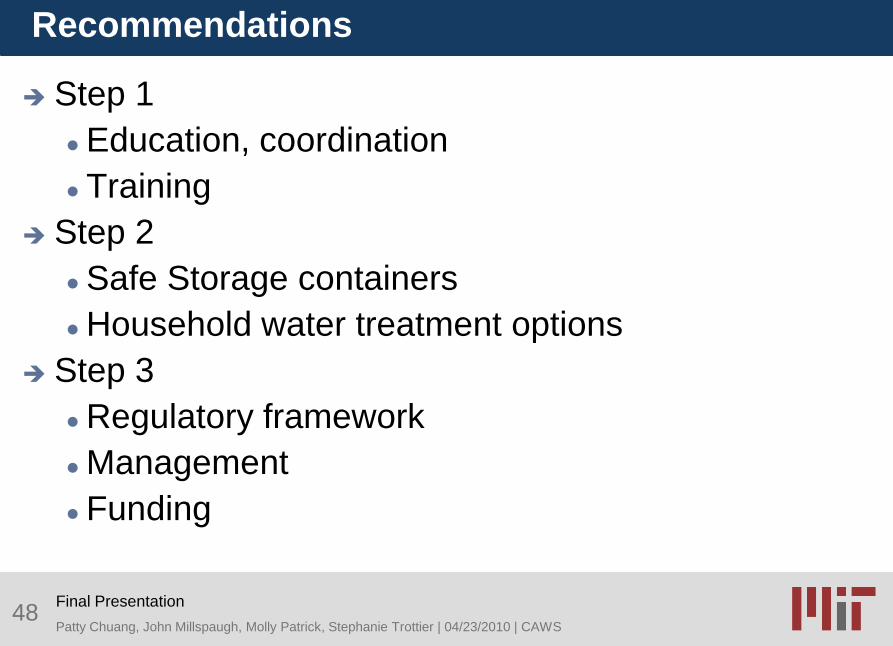
Recommendations
Step 1
Education, coordination
Training
Step 2
Safe Storage containers
Household water treatment options
Step 3
Regulatory framework
Management
Funding
Page 47
Final Presentation
Patty Chuang, John Millspaugh, Molly Patrick, Stephanie Trottier | 04/23/2010 | CAWS49
Step 1- education, coordination
Required education
Basic groundwater flow
Structural components of source types
Hazardous activities
Coordination
Proposed sessions by municipality
Creation of municipal consortiums Communication, alliances
Pooling of technical and financial resources
Enforce regular site inspections
Page 48
Final Presentation
Patty Chuang, John Millspaugh, Molly Patrick, Stephanie Trottier | 04/23/2010 | CAWS50
Step 1- training
Train local citizens as water source technicians
To maintain and repair public (D, L1, L2) supplies
Precedent „Circuit Riders‟ in Honduras
handpump technicians in India
Per municipality
Training by provincial water utilities
Volunteers or paid positions Funding considerations
Page 49
Final Presentation
Patty Chuang, John Millspaugh, Molly Patrick, Stephanie Trottier | 04/23/2010 | CAWS51
Step 2- HWTS
Provide and promote the use of „safe storage‟
containers
Government supplied or sold at-cost
Boiling or household chlorination recommended
Explore household treatment options
Contact NGO‟s, companies providing HWTS technologies in
Philippines
Aquatabs, PuR, Megafresh, Biosand Filter
Page 50
Final Presentation
Patty Chuang, John Millspaugh, Molly Patrick, Stephanie Trottier | 04/23/2010 | CAWS52
Step 3- regulations, management, funding
Context and constraints
Decentralization of water management (1980‟s)
Level 3: Provincial organizations Local Water Utility Administrations (LWUA) and Water Districts (WD)
High fees
Public Level 1 and Level 2: No formal organization Barangay council
General annual budget
No fees or small fees
PHO in charge of public health In charge of testing
In charge of Sanitation Inspectors
Lack control over budget allocation at the barangay, municipal level
Page 51
Final Presentation
Patty Chuang, John Millspaugh, Molly Patrick, Stephanie Trottier | 04/23/2010 | CAWS53
Step 3- regulations, management, funding
Existing Regulations
Implementing Rules and Regulations of the Code on
Sanitation of the Philippines- Chapter II Water Supply
(1995)
Philippine National Standards for Drinking Water (2007)
Capiz needs to develop a strategic plan for aligning
their efforts with regulatory requirements
Quantify personnel gaps
“ resource gaps
“ funding gaps
Page 52
Final Presentation
Patty Chuang, John Millspaugh, Molly Patrick, Stephanie Trottier | 04/23/2010 | CAWS54
Step 3- regulations, management, funding
Management
Decentralization of water management (1980‟s)
Government roles LWUA and WD can act as advisors to barangay-level organization on
technical and financial management
Municipal consortium Coordinating technicians
Coordinating inspection schedules
Page 53
Final Presentation
Patty Chuang, John Millspaugh, Molly Patrick, Stephanie Trottier | 04/23/2010 | CAWS55
Step 3- regulations, management, funding
Funding
Dedicated budgets for water improvements
Needs assessments
Funds required for: safe storage
technicians
repair/maintenance of public L1
increased access to L2/L3
decreased expense of L3
Page 54
Final Presentation
Patty Chuang, John Millspaugh, Molly Patrick, Stephanie Trottier | 04/23/2010 | CAWS
Strong Municipal and Barangay-level Organization
Page 55
Final Presentation
Patty Chuang, John Millspaugh, Molly Patrick, Stephanie Trottier | 04/23/2010 | CAWS
Screening Model Optimization
for Panay River Basin Planning
and Management
57
Water Resources Assessment
John Millspaugh
Page 56
Final Presentation
Patty Chuang, John Millspaugh, Molly Patrick, Stephanie Trottier | 04/23/2010 | CAWS
To analyze the decision to implement infrastructure in
the Panay River Basin for the purposes of flood
protection, hydropower generation, and irrigating rice
fields
58
Project Objective
Source:http://www.deokso.or.kr/data2000/lib/download.php?v_file=0029/200910022206520.htm&v_name=090929__Massive_flooding_in_Philippines-2.htm
Page 57
Final Presentation
Patty Chuang, John Millspaugh, Molly Patrick, Stephanie Trottier | 04/23/2010 | CAWS59
Decision Sites
Image adapted from: http://nwin.nwrb.gov.ph/Prog&Proj/JICA/studies/water_resources/studies/0605.htm
Page 58
Final Presentation
Patty Chuang, John Millspaugh, Molly Patrick, Stephanie Trottier | 04/23/2010 | CAWS
Time Increments
648 Time Steps, t
600 Months, m
48 12-hr flood times, v
8 flood occurrences at end of June, u 50 yr-flood occurring in the 26th year
25 yr-floods occurring in the 13th and 39th years
10 yr-floods occurring in the 3rd, 8th, 18th, 31st, and 43rd
years
60
Page 59
Final Presentation
Patty Chuang, John Millspaugh, Molly Patrick, Stephanie Trottier | 04/23/2010 | CAWS
Network Diagram
61
Page 60
Final Presentation
Patty Chuang, John Millspaugh, Molly Patrick, Stephanie Trottier | 04/23/2010 | CAWS
Decision Variables
Capacities of Facilities: Reservoirs (CAPRes), Hydropower (CAPPower), Land (CAPLand)
Water Management at Each Site and Time Increment: Storage (S), Release (Out), Export (Export)
Energy Produced at Each Site per Time Increment: Energy (E)
62
Page 61
Final Presentation
Patty Chuang, John Millspaugh, Molly Patrick, Stephanie Trottier | 04/23/2010 | CAWS
Screening Model + Simulation Model
Maximize (MPesos):
Benefits = f(hydropower, irrigation fields,
flood protection)
Amortized Cost = Facilities built, 6%
interest rate assumed
Operation and Maintenance Cost, 10%
yearly of the cost of capital costs
63
Page 62
Final Presentation
Patty Chuang, John Millspaugh, Molly Patrick, Stephanie Trottier | 04/23/2010 | CAWS
Benefits
64
Costs
Site Site (MPesos/KW)
Panay 1 Panay 1 0.0304
Panay 2 Panay 2 0.0324
Badbaran Badbaran 0.0596
Mambusao Mambusao 0.0546
Model Equations
Flood Region , Flood Factors for equation (MPesos/summed MCM for 3 days)1 0.56632 0.4533 1.3774 1.70625 1.0784
Site , Preventable Flood factor (MPesos of damage/summed MCM outflow for 3 day flood period)
Panay 1 0Panay 2 2.3533
Badbaran 1.9817Mambusao 2.7846
Page 63
Final Presentation
Patty Chuang, John Millspaugh, Molly Patrick, Stephanie Trottier | 04/23/2010 | CAWS
Constraints
Continuity
65
1 2 3 4 5 6 7 8 9 10 11 120
10
20
30
40
50
60
70
80
90
1
2
3
4
5
6
7
8
9
10
11
months
Mean F
low
Additio
n p
er
month
(MC
M)
Mean Yearly Hydrologic Flow Additions for 11 Sites
Monthly Flood Prevention:
Page 64
Final Presentation
Patty Chuang, John Millspaugh, Molly Patrick, Stephanie Trottier | 04/23/2010 | CAWS
Reservoirs
6666
Panay 1
MambusaoBadbaran
Panay 2
Page 65
Final Presentation
Patty Chuang, John Millspaugh, Molly Patrick, Stephanie Trottier | 04/23/2010 | CAWS
Constraints
Reservoirs
67
Storage constrained to capacity:
Reservoir size constrained:
Site Resmax (MCM)Panay 1 182.22Panay 2 535.47
Badbaran 734.55Mambusao 743.07
Storage-Head Relationship:
Storage-Surface Area Relationship:
Page 66
Final Presentation
Patty Chuang, John Millspaugh, Molly Patrick, Stephanie Trottier | 04/23/2010 | CAWS
Energy and Irrigation
68
Energy Production:Site effic Hydromax (KW)
Panay 1 0.6814 7000
Panay 2 0.5983 6000
Badbaran 0.64 2550
Mambusao 0.64 2250
*Nest1 Irrigation Constraints:
Site Landmax (ha)Panay 1 0
Panay 2 500Badbaran 0
Mambusao 0
Constraints
Page 67
Final Presentation
Patty Chuang, John Millspaugh, Molly Patrick, Stephanie Trottier | 04/23/2010 | CAWS
Screening Model Solution
Site Reservoir (MCM) Dam height (m) Hydropower (KW) Irrigation Land (ha)Panay 1 88.506 32.20 2393.972 N/APanay 2 517.676 16.85 5609.582 500
Badbaran 206.122 15.55 2550 N/AMambusao 150.946 14.50 2250 N/A
69
Results
Page 68
Final Presentation
Patty Chuang, John Millspaugh, Molly Patrick, Stephanie Trottier | 04/23/2010 | CAWS
Objective Function
70
Mean Flow = 23,404 MPesos
Varying Flow = 23048 MPesos-1.5%
Results
5 10 15 20 25 30 35 40 45 50400
450
500
550
600
650
year
Obje
ctive F
unction (
MP
esos)
Objective Function
Page 69
Final Presentation
Patty Chuang, John Millspaugh, Molly Patrick, Stephanie Trottier | 04/23/2010 | CAWS
Flood Control
71
10 20 30 400
500
1000
1500
2000
12 hr-increments of flood periods
Flo
odflow
(m
3/s
)
Dumalag Flood Region
10 20 30 400
500
1000
1500
2000
12 hr-increments of flood periods
Flo
odflow
(m
3/s
)
Badbaran Flood Region
10 20 30 400
500
1000
1500
2000
12 hr-increments of flood periods
Flo
odflow
(m
3/s
)
Cuartero Flood Region
10 20 30 400
500
1000
1500
2000
12 hr-increments of flood periods
Flo
odflow
(m
3/s
)
Sigma Flood Region
5 10 15 20 25 30 35 40 450
200
400
600
800
1000
1200
1400
1600
1800
2000
12 hr-increments of flood periods
Flo
odflow
(m
3/s
)
Panay Flood Region
Results
Page 70
Final Presentation
Patty Chuang, John Millspaugh, Molly Patrick, Stephanie Trottier | 04/23/2010 | CAWS
Panay 2 Monthly Flows and Energy Production
75
2 4 6 8 10 12 14 16 18 20 22 240
100
200
300
400
500
months from years 10 and 11
MC
M/m
onth
Panay 2 Site: Inflow (blue), Outflow (red), Storage at end of month (green)
Outflow Inflow
Storage
2 4 6 8 10 12 14 16 18 20 22 240
1
2
3
4
x 106
months from years 10 and 11
KW
hr/
month
Panay 2 Site Energy Production
Page 71
Final Presentation
Patty Chuang, John Millspaugh, Molly Patrick, Stephanie Trottier | 04/23/2010 | CAWS
Sensitivity Analysis
Sensitivity to O&M and Interest Rate
81
5101520
4
6
8
1.2
1.4
1.6
1.8
2
2.2
2.4
2.6
2.8
3
x 104
Interest Rate for Amortization (%)
Yearly O&M as a Percentage of Capital Cost (%)
Objective Function Sensitivity via Screening Model
Obje
ctive F
unction (
MP
esos)
Page 72
Final Presentation
Patty Chuang, John Millspaugh, Molly Patrick, Stephanie Trottier | 04/23/2010 | CAWS
Sensitivity Analysis
Sensitivity of Facility Sizes from Varying
Flows
82
Page 73
Final Presentation
Patty Chuang, John Millspaugh, Molly Patrick, Stephanie Trottier | 04/23/2010 | CAWS
Conclusions
High Potential Flood Protection – 46% overall reduction, 19% in Panay
Hydropower – 91.6% of the total benefits
Irrigation – Potential was always maximized
No Hydropower/Flood Protection Tradeoff
Farming Organic – Institutional arrangement
Operation and Maintenance – Better Attention Needed
83
Page 74
Final Presentation
Patty Chuang, John Millspaugh, Molly Patrick, Stephanie Trottier | 04/23/2010 | CAWS
More Conclusions
Other Stakeholders Displaced People – Relocation and Social Cost
Aquaculture – Maintain/Improve River‟s Health
New Opportunities – Consistent Electricity, Breaking the
Typhoon Cycle
Data Needs
Further Simulations
84
Page 75
Final Presentation
Patty Chuang, John Millspaugh, Molly Patrick, Stephanie Trottier | 04/23/2010 | CAWS
Questions?
85