36
An AMCOW Country Status Overview Water Supply and Sanitation in Uganda Turning Finance into Services for 2015 and Beyond
For enquiries, contact:Water and Sanitation Program–Africa RegionThe World Bank, Upper Hill RoadP.O. Box 30577, 00100, Nairobi, KenyaTel: +(254) 20 322 6300 E-mail: [email protected] site: www.wsp.org
An AMCOW Country Status Overview
Water Supply and Sanitation in UgandaTurning Finance into Services for 2015 and Beyond

The first round of Country Status Overviews (CSO1) published in 2006 benchmarked the preparedness of sectors of 16 countries in Africa to meet the WSS MDGs based on their medium-term spending plans and a set of ‘success factors’ selected from regional experience. Combined with a process of national stakeholder consultation, this prompted countries to ask whether they had those ‘success factors’ in place and, if not, whether they should put them in place.
The second round of Country Status Overviews (CSO2) has built on both the method and the process developed in CSO1. The ‘success factors’ have been supplemented with additional factors drawn from country and regional analysis to develop the CSO2 scorecard. Together these reflect the essential steps, functions and results in translating finance into services through government systems – in line with Paris Principles for aid effectiveness. The data and summary assessments have been drawn from local data sources and compared with internationally reported data, and, wherever possible, the assessments have been subject to broad-based consultations with lead government agencies and country sector stakeholders, including donor institutions.
This second set of 32 Country Status Overviews (CSO2) on water supply and sanitation was commissioned by the African Ministers’ Council on Water (AMCOW). Development of the CSO2 was led by the World Bank administered Water and Sanitation Program (WSP) in collaboration with the African Development Bank (AfDB), the United Nations Children’s Fund (UNICEF), the World Bank and the World Health Organization (WHO).
This report was produced in collaboration with the Government of Uganda and other stakeholders during 2009/10. Some sources cited may be informal documents that are not readily available.
The findings, interpretations, and conclusions expressed in this volume do not necessarily reflect the views of the collaborating institutions, their Executive Directors, or the governments they represent. The collaborating institutions do not guarantee the accuracy of the data included in this work. The boundaries, colors, denominations, and other information shown on any map in this work do not imply any judgment on the part of the collaborating institutions concerning the legal status of any territory or the endorsement or acceptance of such boundaries.
The material in this publication is copyrighted. Requests for permission to reproduce portions of it should be sent to [email protected]. The collaborating institutions encourage the dissemination of this work and will normally grant permission promptly. For more information, please visit www.amcow.net or www.wsp.org.
Photograph credits: Cover photograph by The Water and Sanitation Program Photographs published with permission from Gallo Images/Getty Images/AFP and The Bigger Picture/Reuters Other photograph by Sustainable Sanitation Alliance (SuSanA)/Enno Schroeder (GIZ)
© 2011 Water and Sanitation Program

1
Water Supply and Sanitation in UgandaTurning Finance into Services for 2015 and Beyond
An AMCOW Country Status Overview

2
Strategic Overview
The institutions responsible for water and sanitation service delivery in Uganda have undergone tremendous reform since the 1990s, with a marked improvement in their capacity and level of professionalism. This, coupled with steady investments in water supply infrastructure over the last 30 years, has led to a remarkable improvement in access to safe water supplies in rural and urban areas. The use of improved sanitation has also increased, although at a lower rate. The Government of Uganda recognizes that these improvements in access have not been uniform. There are wide discrepancies in access to rural water supplies between and within districts and in response the government has adjusted resource allocation accordingly. The challenge to more equitable service delivery is that many of the poorly served areas are also difficult to serve with cheap technologies, and anticipated public investments are insufficient to address the scale of the problem.
In the urban water supply and sewerage context, Uganda is now entering the final leg of sector reforms, having established a regulation unit for urban water supply and sanitation. Although access to safe water in urban areas has continued to improve, the major discrepancies between government and Joint Monitoring Programme data raise questions and render international comparisons challenging.
The comparatively slow rate of increase of urban and rural sanitation coverage is a reflection of the continuing operational lack of clarity in roles and responsibilities as well as a very low level of public funding. However, recent efforts to enforce by-laws are encouraging.
Uganda’s population growth of over 3 percent per year, one of the highest in the world, puts a considerable strain on public sector service delivery, not just for water and sanitation but also in other areas such as health and education. Considerable investments still need to be made to increase access to improved water supplies, but at the same time investments are required to maintain
and replace existing infrastructure as cost recovery does not cover the replacement of small town systems and is insufficient to meet even operation and maintenance in rural areas. Anticipated public funds are inadequate to deal with these dual demands of expansion and replacement. The considerable finance gap that exists for water and sanitation means that the positive gains of the past may plateau.
Monitoring and evaluation mechanisms in Uganda have been a model of good practice in Africa with Joint Sector Reviews (JSR) having been held since 2000. The JSR process, supported by its working groups and comprehensive sector performance report, has helped link decision making in the sector to a balanced set of indicators including access to water and sanitation; functionality; equity; and value for money. However, more emphasis should be placed on implementation monitoring, a point that is recognized and being addressed by the government.
An analysis of the rural water supply service delivery pathway suggests that the functions for sustaining infrastructure are the weakest link within the Ugandan context—a country which otherwise has a dynamic, vibrant, and progressive water supply and sanitation sector. Uganda, with 80 percent of rural and small town systems functioning, performs well in comparison to other countries. Nevertheless, it is this relative weakness for sustaining service delivery, coupled with low anticipated public investment that provides the genesis for the overarching question raised through the CSO analysis. Will Uganda be able to maintain the tremendous gains it has made in improving access to water and sanitation? Uganda, with its strong institutions has witnessed remarkable improvements in access but the low investment anticipated for the future may see these gains eroded.
The second AMCOW Country Status Overview (CSO2) has been produced in collaboration with the Government of Uganda and other stakeholders.
An AMCOW Country Status Overview
2

3
Water Supply and Sanitation in Uganda: Turning Finance into Services for 2015 and Beyond
3
Agreed priority actions to tackle these challenges, and ensure finance is effectively turned into services, are:
Rural water supply• ExaminetheextenttowhichreplacementcostsarecoveredintheStrategicSectorInvestmentPlan(SSIP).• Revisittheviabilityoftherelativelyhigh-costtechnologymixassetoutintheSSIP.• Explorearangeofmanagementandmaintenanceoptionsforsmallpipedwatersupplies.
Urban sanitation and hygiene• Reportonsanitationactivities,outputs,andoutcomesinlinewiththeIntegratedSanitationandHygienestrategy.• Increaseemphasisontheimprovementofexistingfacilities,notjustontheconstructionofnewfacilities.• Exploreadditionalwaysofencouragingurbancouncilsandtownboardstoenforceby-laws.• DevelopaframeworkforcollaborationbetweenKampalaCityCouncil,theNationalWaterandSewerageCorporation,
private cesspool emptiers, and consumers under the auspices of those who govern sanitation in Uganda (Ministry of WaterandEnvironmentandMinistryofHealth).
Sectorwide• Increasethelevelofpublicfinanceforwaterservicedeliveryandsanitation.• Furtherexploremechanismstoraiseprivatefinanceforwatersupplyfacilitiesthroughself-supplyandoutput-based
aid.• Improvejointplanning,implementation,andmonitoringofwaterandenvironmentactivities.• Increasetheemphasisonregulationofurbanandruralwatersupplies.• Improvetheanalysisofthesocioeconomicimpactofparticulartechnologiesandmanagementoptionsinruraland
urban areas.
Urban water supply• AnalyzethereasonsforthedifferencesbetweenUgandaBureauofStatisticsandMinistryofWaterandEnvironment
access data.• Examinethefinancialviabilityofpipedwatersuppliesinsmalltowns.• ReportfullyontheperformanceoftheNationalWaterandSewerageCorporationandtheWaterAuthoritiesinthe
Annual Sector Performance Measurement Report.• Ensurethattheneedforsafewaterforthepoorisbalancedwiththeneedtorecovercosts,orpubliclysupportthe
operation and maintenance of piped water supplies.
Rural sanitation and hygiene• Reportonsanitationactivities,outputs,andoutcomesinlinewiththeIntegratedSanitationandHygienestrategy.• Showtheextenttowhichsanitationinitiatives(promotion,enforcementofby-laws,capacity-buildingoftheprivate
sector) lead to outcomes.• Reportmorefullyontheactivitiesandoutcomesofactivitiesundertakenbytheotherstakeholdersinthesector.

4

5
Acronyms and Abbreviations ........................................................................................................................... 6
1. Introduction .................................................................................................................................................... 7
2. Sector Overview: Coverage and Finance Trends ............................................................................................... 8
3. Reform Context: Introducing the CSO2 Scorecard ......................................................................................... 11
4. Institutional Framework ................................................................................................................................ 13
5. Financing and its Implementation .................................................................................................................. 15
6. SectorMonitoringandEvaluation ................................................................................................................. 18
7. Subsector: Rural Water Supply ...................................................................................................................... 19
8. Subsector: Urban Water Supply ..................................................................................................................... 22
9. Subsector: Rural Sanitation and Hygiene ....................................................................................................... 25
10. Subsector: Urban Sanitation and Hygiene ...................................................................................................... 27
Notes and References ................................................................................................................................... 30
Contents

6
Acronyms and Abbreviations
AfDB AfricanDevelopmentBankAMCOW African Ministers’ Council on WaterCAPEX CapitalexpenditureCSO2 Country Status Overviews (second round)GNI Gross domestic incomeGoU Government of UgandaHH HouseholdISH Improved Sanitation and Hygiene JMP JointMonitoringProgramme(UNICEF/WHO)JWSSPS Joint Water and Sanitation Sector Program
Support KDS KampalaDeclarationonSanitationLIC Low-income countryM&E MonitoringandevaluationMDG MillenniumDevelopmentGoalMoH Ministry of Health MoES MinistryofEducationandSportsMoWE MinistryofWaterandEnvironmentMTEF Medium-TermExpenditureFramework
NDP NationalDevelopmentPlanNGO Nongovernmental organizationNWSC National Water and Sewerage CorporationO&M Operations and maintenanceOPEX OperationsexpenditurePEAP PovertyEradicationActionPlanPRSP Poverty Reduction Strategy PaperRSH Rural sanitation and hygiene subsectorRWS Rural water supply subsectorSSIP Sector Strategic Investment Plans SWAp Sector-Wide ApproachUBOS Uganda Bureau of Statistics USH Urban sanitation and hygiene subsectorUWASNET UgandaWaterandSanitationNGONetworkUWS Urban water supply subsectorWSDF WaterandSanitationDevelopmentFacilitiesWSP Water and Sanitation ProgramWUC Water user committee
Exchangerate: US$1 = 2,177 Ugandan Shilling.1
An AMCOW Country Status Overview

7
1. Introduction
The African Ministers’ Council on Water (AMCOW) commissioned the production of a second round of Country Status Overviews (CSOs) to better understand what underpins progress in water supply and sanitation and what its member governments can do to accelerate that progress across countries in Sub-Saharan Africa (SSA).2 AMCOW delegated this tasktotheWorldBank’sWaterandSanitationProgramandtheAfricanDevelopmentBankwhoareimplementingitinclosepartnershipwithUNICEFandWHOinover30countriesacrossSub-SaharanAfrica(SSA).ThisCSO2reporthasbeenproducedincollaborationwiththeGovernmentofUganda(GoU)andotherstakeholdersduring2009/10.
The analysis aims to help countries assess their own service delivery pathways for turning finance into water supply and sanitation services in each of four subsectors: rural and urban water supply, and rural and urban sanitation and hygiene. The CSO2 analysis has three main components: a review of past coverage; a costing model to assess the adequacy of future investments; and a scorecard which allows diagnosis of particular bottlenecks along the service delivery pathway. The CSO2’s contribution is to answer not only whether past trends and future finance are sufficient to meet sector targets, but what specific issues need to be addressed to ensure finance is effectively turned into accelerated coverage in water supply and sanitation. In this spirit, specific priority actions have been identified through consultation. A synthesis report, available separately, presents best practice and shared learning to help realize these priority actions.
Water Supply and Sanitation in Uganda: Turning Finance into Services for 2015 and Beyond

8
2. Sector Overview: Coverage and Finance Trends
Coverage: Assessing Past Progress
Competing current and baseline coverage statistics for water supply and sanitation are provided by the Joint Monitoring Programme (JMP), the Ministry of Water and Environment (MoWE,, for water), and theMinistryof Health (MoH, for sanitation), meaning that there are different figures for progress towards sector targets. National targets also differ from those of the Millennium DevelopmentGoals(MDGs).3 In the case of water supply, the Ministry’s figures are based on known infrastructure multiplied by an assumed number of users for each improved source, resulting in a 2008 coverage estimate of 63 percent.4 For sanitation, the Ministry’s figures are based on household surveys which include inspection of sanitation facilities, with coverage estimated to be 64 percent. National targets for water and sanitation by 2015 are 80 percent in each case.
According to the JMP, water coverage has increased significantly in Uganda, rising from a 1990 baseline of 43 percent, to 68 percent in 2008. Past trends indicate that thewatersupplyMDGtargetof72percentby2015couldbe met, with considerable infrastructure still required to
keep up with population growth. However, past trends alone are not sufficient to predict future water access, and the low anticipated public investments mean that it is likely thatUgandawillactuallyfallshortoftheMDGtarget.
Sanitation coverage has also increased, but at a much lower rate than for water. With sanitation coverage at an estimated 48 percent (JMP data), from a base of 39 percent, Uganda is not on track to meet the sanitation MDGof70percentby2015.ThetrendlinebasedontheMoH estimates also falls short of the national target of 80 percent coverage (Figure 1). Investment Requirements: Testing the Sufficiency of Finance
Past trends in coverage increase are only one part of the evidence base for determining whether Uganda will meet the MDG targets. Investments in the sector alterthe projections for better or worse. The Government of Uganda (GoU) has developed a Sector Investment Model (SIM) and a Strategic Sector Investment Plan (SSIP).5 The SSIP indicates that anticipated public investments will not be sufficient for the national targets (80 percent for water
100%
80%
60%
40%
20%
0%1985 1990 1995 2000 2005 2010 2015 2020
Government estimates
JMP estimates
Government target
MDGtarget
Cov
erag
e
Figure 1Progress in water supply and sanitation coverage
100%
80%
60%
40%
20%
0%1985 1990 1995 2000 2005 2010 2015 2020
Government estimates (2008)
JMP estimates
Government target
MDGtarget
Cov
erag
e
Sources:Forgovernmentestimatesandtargets:MoWE.2009.WaterandEnvironmentSectorPerformanceReport; forJMPcoverage/MDGtargets:JMP2010report.
An AMCOW Country Status Overview
Sanitation Water supply

9
and 80 percent for sanitation) to be met. The investments are also inadequate to enable attainment of the MDGtargets. For water supply, the fast expanding population means that ensuring that the national target of 80 percent is met requires an additional 1.2 million rural and 0.2 million urban dwellers to be served with improved water sources every year for seven years. For sanitation, an additional 1.7 million rural and 0.5 million urban dwellers need to gain access (based on JMP estimates of 2008 coverage).
According to the SSIP estimates US$125 million per year will be required to reach 77 percent water coverage in rural areas and 100 percent in urban areas (Table 1). It should be noted that the SSIP gives a number of scenarios, including a scenario whereby the target has been reduced to be more in line with anticipated funding. In the case of water supply, the construction of facilities is primarily paid for by the public sector6 with operation and maintenance (O&M) costs mainly covered by user fees. According to the Ministerial Policy Statement, however, the public sector will only invest US$51 million per year in construction (2009 to 2011). This indicates an annual shortfall of almost US$ 74 million (Figure 2).
In the case of sanitation, public investments are limited to sewerage, sanitation in public places, and activities to build up the demand, supply, and enabling environment for Improved Sanitation and Hygiene (ISH). The GoU plans to invest US$10 million per year in urban sanitation (mainly sewerage) and US$3 million per year in rural sanitation
(2009 to 2011). Based on interpretation of existing user contribution policies,7 the CSO analysis estimates that this could leverage annual household investments of US$11 million per year and US$45 million per year in urban and rural areas, respectively: slightly more than what is required in rural areas and slightly less in urban areas. There is, however, uncertainty about the exact scale of these user contributions, and how they can be effectively leveraged from households in practice, through a combination of promotion, marketing, and targeted subventions for hardware. As a result, the depiction of sanitation capital investments in Figure 2—that is, largely met by households—is unlikely to be realized. Finance required for promotion and marketing (‘software’) is additional to what is depicted in Table 2 sets out the O&M requirements. The public investment requirements set out in the SSIP may be on the low side, as it is assumed that users will pay for O&M. Although this is in line with national policy, the practice is not always adhered to. In addition, some of the piped water supplies in urban areas and small rural towns are not able to meet their running costs, suggesting that subsidies may be necessary in some instances, while efforts are made to improve efficiency and cost recovery. The assumed technology mix for rural water supplies in the SSIP places high emphasis on piped water supplies (50 percent by 2015), which has major implications on the per capita investment costs, as well as on future O&M. However, it should be noted that the individual per capita costs are not high in comparison to other countries in the region. A further weakness in the
0 20 40 60 80 100
RequiredCAPEXRequired OPEX
US$million/year
PublicCAPEXincludingpublicfacilitiesanddemonstation(anticipated)
HouseholdCAPEX(assumed)
CAPEXdeficit
Figure 28
Required vs. anticipated (public) and assumed (household) expenditure
0 50 100 150 200
RequiredCAPEX RequiredOPEX
US$million/year
PublicCAPEX(anticipated)
HouseholdCAPEX(assumed)
CAPEXdeficit
Source: SSIP and CSO2 costing.
Water Supply and Sanitation in Uganda: Turning Finance into Services for 2015 and Beyond
Sanitation Water supply

10
Table 2Annual OPEX requirements
Subsector OPEX US$ million/year
Rural water supply 19Urban water supply 46Water supply total 65Rural sanitation 8Urban sanitation 3Sanitation total 11
Source: SSIP for rural and urban water supply; SSIP rural and urban sanitation.
the service delivery pathway in its entirety, locating the bottlenecks and presenting the agreed priority actions to help address them.
SSIP is that it does not include investment requirements for sanitation and hygiene promotion and capacity building as these are beyond the mandate of the MoWE. These costs are covered in the Integrated Sanitation and Hygiene Finance Strategy, which is still to be fully operationalized. There is an expectation of substantial investments in sanitation by households in both rural and urban areas.
These considerations are only part of the picture. Bottlenecks can in fact occur throughout the service delivery pathway—all the institutions, processes, and actors that translate sector funding into sustainable services. Where the pathway is well developed, sector funding should turn into services at the estimated unit costs. Where it is not, the above investment requirements may be gross underestimates. The rest of this report evaluates
An AMCOW Country Status Overview
Table 1Estimated investment requirements and financing gap to meet the 2015 Government National Targets9
Coverage Target Population CAPEX Anticipated Assumed Total (JMP) requiring requirements public CAPEX HH deficit access CAPEX
1990 2008 2015 Total Public Domestic External Total
% % % ‘000/year Rural water supply 39% 64% 77% 1,169 63 60 18 9 27 1 35Urban water suply 78% 91% 100%* 201 62 62 6 19 24 0 38Water supply total 43% 67% 80% 1,351 125 122 23 28 51 1 73Rural sanitation 40% 49% 77% 1,730 45 0.0 0 3 3 45 -Urban sanitation 35% 38% 100% 541 24 11 0.4 10 10 11 3Sanitation total 39% 48% 80% 2,253 69 11 0.4 13 13 56 -
US$ million/year
* The SSIP urban water supply target is more modest than the original national target of 100 percent.Sources: SSIP for rural and urban water supply; SSIP plus CSO model for urban sanitation, and CSO for rural sanitation.

11
Water Supply and Sanitation in Uganda: Turning Finance into Services for 2015 and Beyond
3. Reform Context: Introducing the CSO2 Scorecard
Since the late 1980s, the policy and legislative framework for the water and sanitation sector in Uganda has evolved tremendously. This evolution puts the service delivery pathway in context, which can then be explored in detail using the CSO2 scorecard, an assessment tool providing a snapshot of reform progress across the building blocks that make up the pathway. The CSO2 scorecard assesses the building blocks of service delivery in turn: three building blocks which relate to enabling services, three which relate to developing new services, and three which relate to sustainingservices.Eachbuildingblockisassessedagainstspecific indicators and scored from 1 to 3 accordingly.10
Efforts to improve water and sanitation have takenplace in the context of broad institutional and economic reforms, including a shift from projects to a Sector-Wide Approach (SWAp) to planning; construction, and in some cases management, by the private sector; a shift in the role of government from service provider to policy maker; and decentralized service delivery, particularly of rural water supplies and sanitation. The prominence of water and sanitation was raised with the establishment of the PovertyEradicationActionPlan(PEAP)in1997,11 coupled with debt relief and a Poverty Action Fund (PAF). Reform studies led to the development of Strategic Investment Plans (SIPs) with appropriate policies, strategies, action areas, and associated costs. These factors contribute to Uganda’s scorecard results relating to enabling service delivery, with average scores that are slightly ahead of those for its economic peer group of low-income countries with a Gross National Income (GNI) per capita of US$500 or below12 (Figure 3).
The water policy (1995) calls for equitable service delivery, and sets out that government will subsidize construction of the majority of rural and urban water supplies. From 2008 clear and transparent allocation criteria have been in place for the allocation of water and sanitation resources to district
local governments. It emphasizes low cost technologies and an approach which integrates behavior change with improving access to safe water. In contrast there are no subventions for household sanitation facilities in Ugandan policies, other than towards sewerage connections. The public health act calls for every building to have a latrine. The year 1997 witnessed pledges to improve sanitation intheKampalaDeclarationonSanitationbutthesewere,on the whole, not turned into practice, largely because the responsibilities were not matched with resources. The finalization of the Integrated Sanitation and Hygiene Strategy in 2006 and more emphasis on the enforcement of by-laws have been milestones in terms of catalyzing action with respect to sanitation. However, there is still a need to determine the extent to which actions on the
Figure 3Average scorecard results for enabling, sustaining and developing service delivery, and peer-group comparison
Enabling
Sustaining Developing
Uganda average scores
Averages, LICs, GNI p.p. <=$500
Source: CSO2 scorecard.

12
ground translate into sanitation outcomes. Several of these factors are considered as specific indicators by the CSO2 scorecard, which shows that Uganda’s average scores for developing new services, and sustaining existing services, are ahead of the regional peer-group average, though there is still room for improvement (Figure 3).
An AMCOW Country Status Overview
Table 3Key dates in the reform of the sector in Uganda
Year Event
1962 Independence
1986 National Resistance Movement came into power
1995 Constitution of Uganda13
1995 EndofSouthWestintegratedHealthandWaterProject(knownbytheacronymSWIP)whichranfrom1987
1995 Water Statute
1995 EndofNationalWaterandSanitation(Watsan)Program
1997 Local Governments Act
1997 KampalaDeclarationonSanitation16
1997 Start of Civil Service Reform Program
1997 DevelopmentofPovertyEradicationActionPlan(PEAP)
1999 Water Policy18
Endof Role of Government transitions from service provision to overall sector planning, resource mobilization, 1990s policymaking, regulation, and facilitation
2000 FirstGovernmentandDevelopmentPartners’AnnualJointSectorReview Rural Water and Sanitation Reform Study Completed
2001 Memorandum of Understanding on Sanitation signed14
2001 EndofWaterandEnvironmentalSanitation(WES)Programwhichranfrom1995
2002 EndofRuralWaterandSanitation(EasternUganda)Project(RUWASA)whichranfrom1991
2003 Urban Water and Sanitation Reform Study completed15
2004 First Sector Performance Report
2005 All other reform studies completed (that is, Water for Production and Water Resources Management). All subsector strategies and strategic investment plans are thus in place
2005 NationalEnvironmentalHealthPolicy17
2009 Strategic Sector Investment Plan (revised) completed
2010 NationalDevelopmentPlanLaunched
Sections 4 to 6 highlight challenges across three thematic areas—the institutional framework, finance and monitoringandevaluation(M&E).Performanceagainsttherelated scorecard indicators, which give an empirical basis for evaluation, are highlighted at the beginning of each section. The scorecards for each subsector are presented in their entirety in Sections 7 to 10.
13
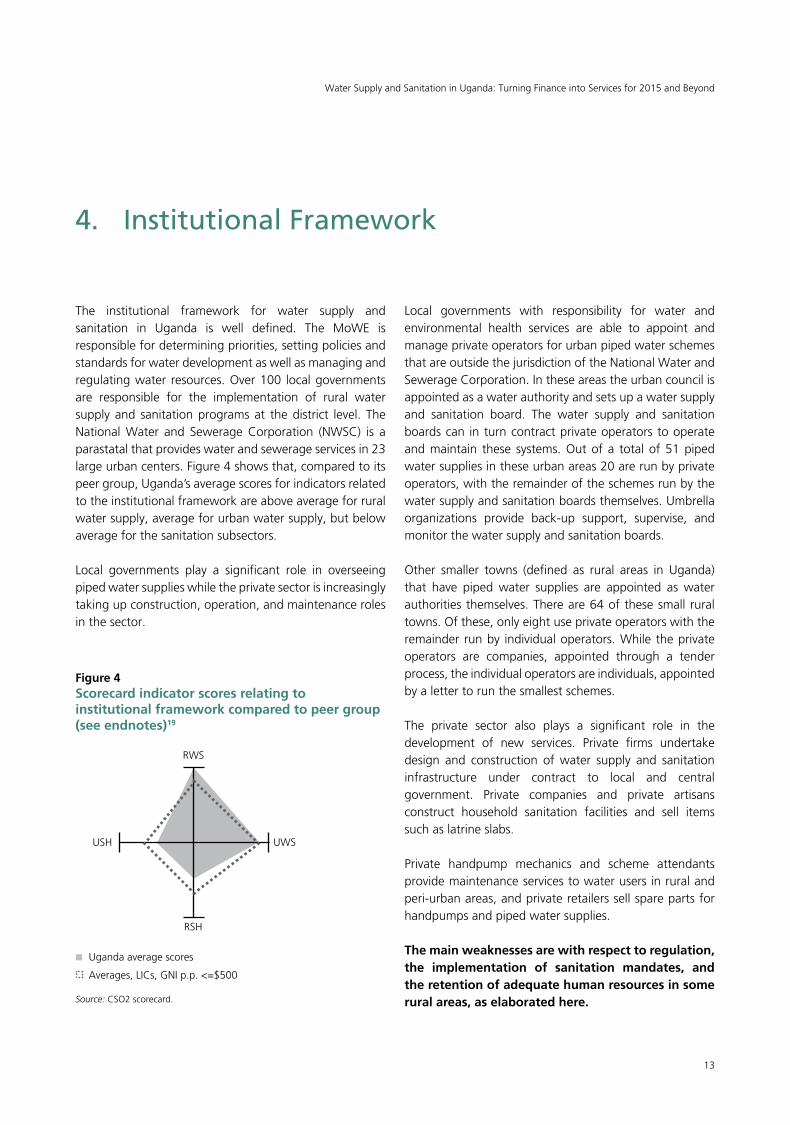
The institutional framework for water supply and sanitation in Uganda is well defined. The MoWE isresponsible for determining priorities, setting policies and standards for water development as well as managing and regulating water resources. Over 100 local governments are responsible for the implementation of rural water supply and sanitation programs at the district level. The National Water and Sewerage Corporation (NWSC) is a parastatal that provides water and sewerage services in 23 large urban centers. Figure 4 shows that, compared to its peer group, Uganda’s average scores for indicators related to the institutional framework are above average for rural water supply, average for urban water supply, but below average for the sanitation subsectors. Local governments play a significant role in overseeing piped water supplies while the private sector is increasingly taking up construction, operation, and maintenance roles in the sector.
Local governments with responsibility for water and environmental health services are able to appoint and manage private operators for urban piped water schemes that are outside the jurisdiction of the National Water and Sewerage Corporation. In these areas the urban council is appointed as a water authority and sets up a water supply and sanitation board. The water supply and sanitation boards can in turn contract private operators to operate and maintain these systems. Out of a total of 51 piped water supplies in these urban areas 20 are run by private operators, with the remainder of the schemes run by the water supply and sanitation boards themselves. Umbrella organizations provide back-up support, supervise, and monitor the water supply and sanitation boards.
Other smaller towns (defined as rural areas in Uganda) that have piped water supplies are appointed as water authorities themselves. There are 64 of these small rural towns. Of these, only eight use private operators with the remainder run by individual operators. While the private operators are companies, appointed through a tender process, the individual operators are individuals, appointed by a letter to run the smallest schemes.
The private sector also plays a significant role in the development of new services. Private firms undertake design and construction of water supply and sanitation infrastructure under contract to local and central government. Private companies and private artisans construct household sanitation facilities and sell items such as latrine slabs.
Private handpump mechanics and scheme attendants provide maintenance services to water users in rural and peri-urban areas, and private retailers sell spare parts for handpumps and piped water supplies.
The main weaknesses are with respect to regulation, the implementation of sanitation mandates, and the retention of adequate human resources in some rural areas, as elaborated here.
Water Supply and Sanitation in Uganda: Turning Finance into Services for 2015 and Beyond
4. Institutional Framework
Figure 4Scorecard indicator scores relating to institutional framework compared to peer group (see endnotes)19
Uganda average scores
Averages, LICs, GNI p.p. <=$500
Source: CSO2 scorecard.
RWS
RSH
USH UWS

14
An AMCOW Country Status Overview
Ensuring adequate regulation. An urban regulation unit has been established, which should ultimately become an autonomous regulatory authority. In the rural context, there is no separate regulation unit, with the MoWEvettingbudgetsandworkplans,andalsoprovidingtechnical support to district local governments rather than explicitly undertaking a regulatory role. The regulation of the sanitation subsector also remains weak, although there are now considerable efforts to develop and enforce ordinances and by-laws at local government level.
Clarifying roles and responsibilities for sanitation. A memorandum of understanding to clarify roles and responsibilities for sanitation and hygiene between the MoWE, the MoH, and the Ministry of Education andSports (MoES)was signed in2001buthasnot resultedin coordinated operational action. Responsibilities for sanitation and hygiene promotion require particular
attention: The District Health Departments and PublicHealthDepartmentsareresponsiblefortheenforcementofpublic health legislation as well as sanitation and hygiene promotion. Despite the sizable health care network,which extends down to the village level, performance with respect to sanitation promotion is weak due to inadequate human and financial resources and poor incentives.
Strengthening human resources at local level. In addition to the limited support for local-level sanitation and hygiene promotion, there are local-level capacity constraints for the upkeep of rural water supply systems. Communities are responsible for operating and maintaining communal rural water supply facilities and are responsible for household sanitation facilities. However, it appears that there is need for consistent sensitization and mobilization activities as well as better training and post-construction support, including accountability.

15
Water Supply and Sanitation in Uganda: Turning Finance into Services for 2015 and Beyond
The scorecard indicators relating to finance range from the development of a SWAp and costed investment program, to the overall sufficiency of finance and extent of utilization (foreign and domestic). A national planning process is well established, national targets have been set, andaSSIPhasbeendeveloped.TheNationalDevelopmentPlan(NDP)20 guides overall resource allocation. The annual national planning process is consultative and involves all levels of government. It leads to the finalization of the Medium-TermExpenditureFramework(MTEF).AlthoughtheMTEF includes projections for the next three years,past experience shows that actual allocation tends to be lower than the projections. A 10-year ISH Promotion Financing Strategy was launched in 2006; 2009 witnessed the release of the consolidated SSIP for water supply and sanitation. In the case of urban water supply the consolidated SSIP targets have been reduced to 80 percent coverage in large urban centers and 65 percent in small (urban) towns by 2015. Rural water and all sanitation targets are in line with national targets. The SSIP is accompanied by a detailed Strategic Sector Investment Model which provides estimates of
the investment needs according to sector and subsector targetsandislinkedtotheMoWE’sgeographicinformationsystem. However, as noted below, finance is not adequate to reach these targets, meaning that sector institutions will have to carefully prioritize their activities and make difficult tradeoffs between rates of expansion and equity of expansion. As can be seen from Figure 5, average indicator scores are high across most subsectors compared to Uganda’s peer group—with the exception of urban water supply which is affected by its low and declining budget allocations relative to its targets. As outlined below there are a number of strengths, as well as outstanding challenges, in the way financial resources are obtained, allocated, and disbursed.
Building on impressive government and donor alignment, harmonization, and coordination. As a result of the increasingly robust government systems and stronger institutions, the GoU and its donors have sought to align and harmonize their modalities of cooperation. In the water and sanitation sector, there is a strong drive to make use of government systems as well as strengthen them from within. However, lengthy government procurementprocesses couldbe improvedupon.Donorcoordination with respect to water and sanitation is good, with monthly meetings held to exchange knowledge and foster a common approach to government. The Water and Environment Sector Working Group (WESWG) enablesdialogue and exchange between the MoWE, donors,nongovernmental organizations (NGOs) and other related ministries.
For sanitation, with responsibilities split between the MoWE,MoES,andtheMoH,coordinationhasnotbeensimple, but is undertaken by the National Sanitation WorkingGroup. At the district level, the DistrictWaterand Sanitation Coordination Committees bring district technical staff (from water, health, and education) and the NGOs together. The Uganda Water and Sanitation NGO Network (UWASNET), undertakes networking and
5. Financing and its Implementation
Figure 5Scorecard indicator scores relating to financing and its implementation, compared to peer group21
Uganda average scores
Averages, LICs, GNI p.p. <=$500
RWS
RSH
USH UWS
Source: CSO2 scorecard.
16
An AMCOW Country Status Overview
coordination of some 160 NGOs and acts as the main focal point between the government and NGOs at the national level. An ‘Association of Private Water Operators’ has also been established.
Beyond the water and sanitation sector, a Joint Budget Support Framework brings together the donors who provide budget support to Uganda. A Joint Assessment Framework assesses performance in Health, Education,Water and Sanitation, and Roads. The sector inputs to this Framework are used to trigger earmarked and general budget support disbursements. Committees and working groups for coordination and dialog have been established at national and district government levels.
Ambitious targets constrained by limited resources. Access to clean and safe water is a goal reflected in Uganda’s Constitutionandisalso incorporatedintheNDPaspartof the objectives of the social sector. The policy objective, which includes the national target, is: “Sustainable safe water supply and sanitation facilities to 77 percent of the rural population and 100 percent of the urban population by the year 2015, based on management responsibility and ownership by the users, with an 80 percent–90 percent effective use and functionality of facilities.” Currently, however, these ambitious targets are constrained by limited financing to the sector. The NDP expenditureframework allocates an average of 4.1 percent of the
national budget to water and environment, corresponding to around US$220 million. This incorporates funds for the environment and natural resources as well as for water supply and sanitation. The budget allocation is declining; it is also not yet clear the extent to which these figures will actuallybeusedinthepreparationoftheMTEF,whichhasan allocation of around US$51 million per year for water and sanitation for the next three years.
These amounts are set in relation to sector ceilings, which means that even if donors were to increase funds to the sector, these would be offset by a reduction in government funding. For some time it has been argued that the sector ceiling for water and sanitation is too low to allow investments to keep up with population growth. However, with government priorities in the short- and medium-term on roads, energy, schools, and water for production, the ceiling for water and sanitation has not beenraisedsignificantly.TheMoWEandotherkeyplayersface the challenge of making a strong case for further investment by demonstrating the impact of investments in the sector, in social and economic terms.
Replicating a SWAp in the sanitation subsectors. Overall, water supply and sanitation service delivery has been moving away from a project approach. The capacity of government institutions to formulate policies and develop strategies as well as to plan, budget, exercise
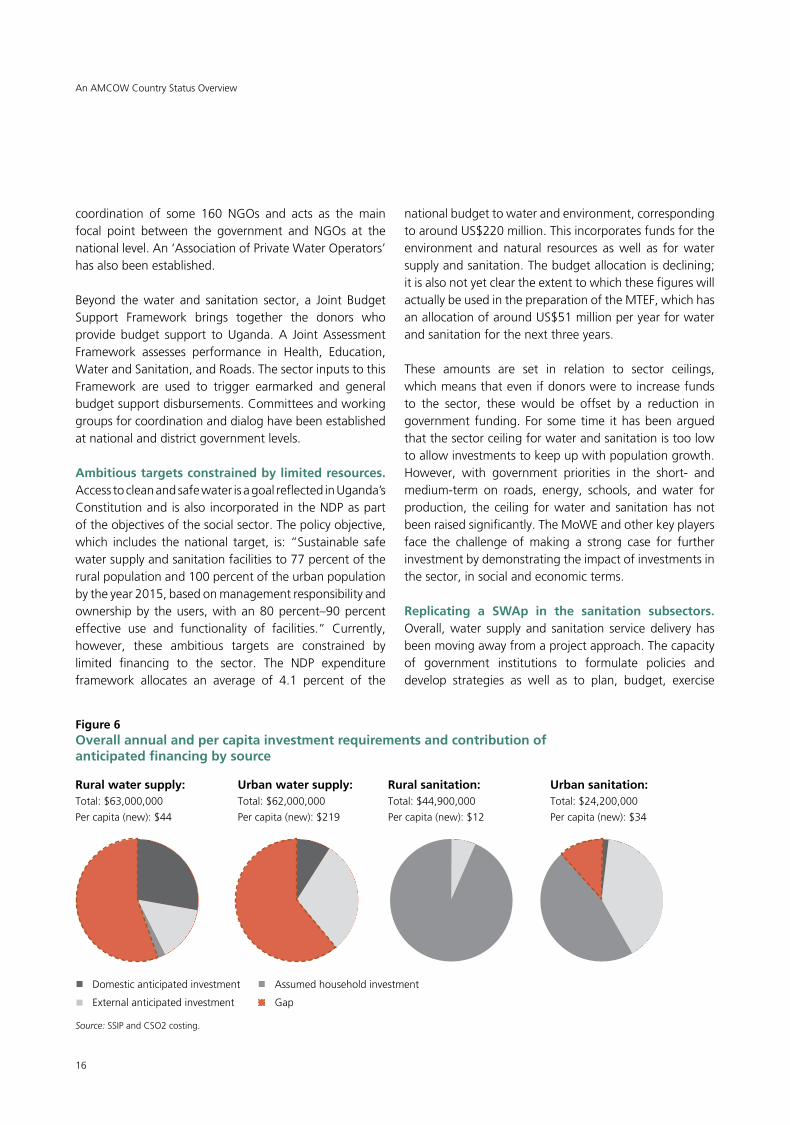
Rural water supply:Total: $63,000,000
Per capita (new): $44
Urban water supply:Total: $62,000,000
Per capita (new): $219
Rural sanitation:Total: $44,900,000
Per capita (new): $12
Urban sanitation:Total: $24,200,000
Per capita (new): $34
Domesticanticipatedinvestment
Externalanticipatedinvestment
Assumed household investment
Gap
Source: SSIP and CSO2 costing.
Figure 6Overall annual and per capita investment requirements and contribution of anticipated financing by source

17
Water Supply and Sanitation in Uganda: Turning Finance into Services for 2015 and Beyond
financial control, and undertake technical supervision, monitoring and performance measurement has increased significantly over the last five years. A SWAp is in place for rural water supply. Most government funding for rural water supply and sanitation investments is transferred to the GoU consolidated fund and then remitted to the district local governments as theDistrictWater andSanitationDevelopmentConditionalGrant. In the case of rural sanitation, however, planning, funding, and implementation are still highly fragmented. Urban water supply is in the process of shifting a sizeable amount of investment from projects to a sectorwide approach, with the establishment of regional Water and Sanitation DevelopmentFacilities (WSDF).Urbansanitationremainsfragmented with activities undertaken under various projects.ThehopeisthattheWSDFwillhelpcoordinatethis subsector also, thus replicating the successful model within the rural water supply subsector.
Disaggregating water and sanitation expenditures. At the national and local government levels, budget codes enable rural and urban expenditure to be disaggregated. However, water and sanitation expenditure cannot be
separated for the MoWE or district local governments.Expenditureonwateror sanitationby localgovernmentgrants other than the District Water and SanitationDevelopment Conditional Grant is not published. Inaddition, the details of expenditure on sanitation by the MoH are not published. It is thus not possible to relate publicexpenditureonsanitationtooutcomes.DetailsofexpenditureonsewerageineachtownbytheMoWEarepublished, but this is not the case for subsequent O&M spending.
Extending criteria for equitable allocation of finance from rural water supply to other subsectors. There are no overall published criteria for allocation of budgets between rural and urban areas. However, within the rural context transparent allocation criteria are used to determine funding to each district local government. As yet there are no allocation criteria for construction of urban town systems but this should be addressed as part of the WSDF.Inthecaseofsmalltowns,criteriawithrespecttomaintenance and expansion finance have been published. Allocation criteria for sanitation are currently meaningless given the fragmentation of, and lack of a distinct budget line for, the subsectors.

18
The M&E system in Uganda is well developed andinstitutionalized. The basic framework and data to carry out a sector review are in place. A thorough annual review process takes place whereby key actions are agreed. A comprehensive Sector Performance Report is published annually providing information on budgets, expenditure, and outputs, as well as progress against a balanced set of indicators (including access to water and sanitation, functionality, equity, value for money, and compliance with permit conditions).
Information on budgets and expenditure is available. On-budget expenditure for water and sanitation is fully reported on by the MoWE (in the Sector Performance
Report as well as the annual report). Quarterly and annual reports are submitted to the Ministry of Finance by the MoWEanddistrict localgovernments.AuditedaccountsforMoWEarenotpublishedbuttheannualreportfromtheAuditor General is submitted to Parliament and published on the internet. NWSC publishes audited accounts in its annual report.
ScorecardindicatorsrelatingtoM&Earefoundthroughoutthe service delivery pathway, from the presence of an annual review to the monitoring of output and consistency of household surveys in monitoring water supply and satiation outcomes. Although Uganda scores very well in relation to its peers (Figure 7), there is still scope for further improvement, as discussed here.
Improving consistency and quality of data collected. There are various institutions which undertake monitoring and inspection of water supply services (including the Ministry of Local Government and Ministry of Finance, Planning and Economic Development, and AuditorGeneral) but the findings are not always consistent across institutions. Consistency across these sources needs to improve, and discrepancies discussed in the Sector Performance Report. The resulting actions also need to be coordinated across institutions.
Further improving sanitation uptake data. Sanitation uptake in rural areas appears to be well monitored through the Health Inspectors’ Annual Sanitation Survey (HIASS) but greater use of the results in interpreting the link between government intervention in sanitation and the reasons why households build latrines is needed. Furthermore, urban areas need to be included.
6. Sector Monitoring and Evaluation
Figure 7Scorecard indicator scores relating to sector M&E, compared to peer group22
RWS
RSH
Uganda average scores
Averages, LICs, GNI p.p. <=$500
USH UWS
Source: CSO2 scorecard.
An AMCOW Country Status Overview

19
Water Supply and Sanitation in Uganda: Turning Finance into Services for 2015 and Beyond
7. Subsector: Rural Water Supply
Priority actions for rural water supply
• Increasethelevelofpublicfinanceforservicedelivery.
• Furtherexploremechanismstoraiseprivatefinanceforwatersupplyfacilitiesthroughself-supply.
• Improvetheanalysisofthesocioeconomicimpactofparticulartechnologiesandmanagementoptions.
• Improvejointplanning,implementation,andmonitoringofwaterandenvironmentactivities.
• Increasetheemphasisonregulationofruralwatersupplies.
• Examine the extent to which replacement costs are covered in the Strategic Sector Investment Plan(SSIP).
• Revisittheviabilityoftherelativelyhigh-costtechnologymixassetoutintheSSIP.
• Explorearangeofmanagementandmaintenanceoptionsforsmallpipedwatersupplies.
existing facilities is also an aspect that needs to be taken into account in rural investments. The extent to which nonfunctional sources are, in fact, in need of replacement is not clear.
Figure 9 shows that anticipated investments of US$27 million per year for rural water supply are nowhere near enough to enable the national rural target of 77 percent to be met—there is also a substantial shortfall relativetotheruralshareoftheMDGtarget(70percent).
Rural water coverage in Uganda stood at 64 percent in 2008, according to the JMP. Although past trends indicate that Uganda is on its way to meeting the rural share of the MDGtarget,of70percent(basedonJMPcoveragedata),and the national government target of 77 percent, based onMoWEcoveragedata,therealityisthatfuturefundingis grossly inadequate. The expected future technology mix, with its high emphasis on piped water supplies exacerbates this problem, as per capita costs are expected to more than double by 2015. The cost of replacement of
Figure 8Rural water supply coverage
100%
80%
60%
40%
20%
0%1985 1990 1995 2000 2005 2010 2015 2020
Government estimates
JMP improved
Government target
JMP, piped
Sources:Forgovernmentdata:MoWE;forJMPdataandMDGtarget: JMP 2010 report.
Figure 9Rural water supply investment requirements to mean national targets
0 50 100
RequiredCAPEX Required OPEX
US$million/year
PublicCAPEX(anticipated)
HouseholdCAPEX(assumed)
CAPEXdeficit
Source: SSIP.

20
Replacement costs are factored into the SSIP’s estimate of CAPEXrequirements,showninFigure9,thoughtheCSO2analysis predicts a much higher cost of replacement. The change in technology mix from providing piped water to around 10 percent of those gaining access, to around 45 percent, effectively doubles the average per capita cost, albeit with a higher level of service. It should be noted that the per capita investment requirement (based on SSIP annual requirement divided by number of people to serve per year) is not particularly high for the region. Thus it is the technology mix rather than the individual technologies which account for the high cost. Additional operation and maintenance requirements of US$19 million are likely to presentanadditionalburdenonanticipatedpublicCAPEXas long as cost recovery from users is inadequate.
The CSO scorecard for rural water supply (Figure 10) uses a simple color code to indicate: building blocks that are largely in place, acting as a driver on service delivery (score >2, green); building blocks that are a drag on service delivery and require attention (score 1–2, yellow); and building blocks that are inadequate, constituting a barrier to service delivery and a priority for reform (score <1, red). Figure 10 indicates that although Uganda scores very highly with respect to the enabling and developing stages of service delivery, the sustaining stage is weak, with the issue of expansion receiving a score of zero. This pattern is amplified when Uganda’s performance is compared to its peers—with a lower average score for sustaining building blocks, but higher score for building blocks relating to enabling and developing services (Figure 11). The particular issues for the lower scoring building blocks are:
Figure 11Rural water supply scorecard
• With regard to financing issues, high rates ofabsorption and generally sufficient numbers of staff and private sector contractors result in a high score for the expenditure building block. However, the budget building block score is reduced because, while budgetstructuresfortheDistrictWaterandSanitationDevelopmentConditionalGrantcanbeclearlyidentified,there is insufficient budget allocated to the subsector.
• Intermsofequity,theMoWEhastakenastrongstanceto address the inequitable distribution of rural water services between districts by allocating more funds to underserved parts of the country. Ongoing work to map water supplies across the entire country (the
EnablingPolicy
3 3 2 3 1.5 2.5 1 0 2
Planning Budget Expenditure Equity Output Maintenance Expansion Use
Developing Sustaining
Source: CSO2 scorecard.
An AMCOW Country Status Overview
Figure 12Average RWS scorecard scores for enabling, sustaining, and developing service delivery, and peer-group comparison
Enabling
Uganda average scores
Averages, LICs, GNI p.p. <=$500
Sustaining Developing
Source: CSO2 scorecard.

21
Water Supply and Sanitation in Uganda: Turning Finance into Services for 2015 and Beyond
Water Atlas Update project, WATSUp) will provide a new, GPS-referenced inventory and should enable data inconsistencies regarding access and functionality to be ironed out, provide a better estimate of replacement requirements, and further improve allocation.
• Challengesrelatingtothemaintenance,expansionanduse building blocks constrain the ability of Uganda’s rural water supply subsector to sustain its existing infrastructure. Although funding is available to district local governments for training as well as follow-up of communities with improved water points, the extent to which these activities are carried out is not clear. The reliability of data from district local governments with respect to community management and collection of
user fees is questionable. Of particular concern is the fact that water users appear to not trust their water user committees with the fees collected.23 MoWErecognizes that the O&M of rural water supplies is problematic, and an initiative to improve this is under way at central, district and subcounty levels (the initiative is an undertaking from the 2008 Joint Sector Review). Rural water supply point sources are one-off investments and are not expanded. Piped schemes in rural growth centers can be expanded after construction but this is not widely undertaken and dataisnotsufficienttoenableanalysisofCAPEXforexpansion. Overall there is a lack of cost recovery even for replacement of existing facilities in rural areas.

22
An AMCOW Country Status Overview
8. Subsector: Urban Water Supply
Priority actions for urban water supply
• Increasethelevelofpublicfinanceforservicedelivery.
• Improvejointplanning,implementation,andmonitoringofwaterandenvironmentactivities.
• Improvetheanalysisofthesocioeconomicimpactofparticulartechnologiesandmanagementoptions.
• AnalyzethereasonsforthedifferencesbetweenUgandaBureauofStatisticsandMinistryofWaterandEnvironment access data.
• Examinethefinancialviabilityofpipedwatersuppliesinsmalltowns.
• ReportfullyontheperformanceoftheNationalWaterandSewerageCorporationandtheWaterAuthoritiesin the Annual Sector Performance Measurement Report.
• Ensurethattheneedforsafewaterforthepoorisbalancedwiththeneedtorecovercosts,orpubliclysupport the operation and maintenance of piped water supplies.
• FurtherexploremechanismstoraiseprivatefinanceforwatersupplyfacilitiesthroughOutputBasedAid.
• Increasetheemphasisonregulationofurbanwatersupplies.
by 2015. This large discrepancy needs to be addressed to better influence decision making and render international comparisons meaningful. According to the JMP, access to piped water has been increasing at a similar rate as access to improved water overall, indicating that urban water utilities are keeping pace with urban population growth,
Figure 12Urban water supply coverage
100%
80%
60%
40%
20%
0%1985 1990 1995 2000 2005 2010 2015 2020
Government estimates
JMP improved
Government target
JMP, piped
Sources:Forgovernmentdata:MoWEandUNDP;forJMPdataandMDGtarget: JMP 2010 report.
Cov
erag
e
Figure 13Urban water supply investment requirements to meet a target of 80 percent
0 50 100 150
RequiredCAPEXRequiredOPEX
US$million/yearPublicCAPEX(anticipated)
HouseholdCAPEX(assumed)
CAPEXdeficit
Source: SSIP and CSO2 costing.
Based on JMP data, Uganda has already achieved the urban share of the MDG target (89 percent) with 91percent of population covered (Figure 12). However, this divergesconsiderablyfromtheMoWEfigureof66percentin2009(theonlyavailablebaselineisaUNDPestimatefor2001), against a national target of 100 percent coverage

23
Figure 15Average UWS scorecard scores for enabling, sustaining, and developing service delivery, and peer-group comparison
Enabling
Uganda average scores
Averages, LICs, GNI p.p. <=$500
Sustaining Developing
Source: CSO2 scorecard.
but are not yet making a significant impact in bringing piped water to those that already use other improved sources.
The SSIP estimates that an annual investment of US$62 million per year is required to enable access to safe water for 75 percent of the urban population by 2010 (Figure 13). The CSO2 costing model portrays lower investment requirements for new capital (relative to JMP rather than MoWE coverage data) but higher replacement coststhan in the SSIP. However, both methods indicate that the anticipated on-budget annual investment of US$24 million per year for urban water supply will not be enough
to enable the above-mentioned subsector targets to be met by 2015. It should also be noted that projected O&M requirements depicted in Figure 13 are likely to place additional strain on public finance, as these are not being fully met by tariffs.
The CSO2 scorecard for urban water supply (Figure 14) indicates that the scores for urban water supply are fairly even throughout the service delivery pathway (enabling, developing, and sustaining). In comparison to its peers, Uganda’s urban water supply subsector registers above average scores throughout the service delivery pathway (Figure 15). However, some aspects are weaker than others. The budget and equity scores are moderate and there still remain considerable challenges with respect to equity and the ‘downstream’ building blocks of maintenance and expansion, as elaborated below.
In the case of the NWSC, Performance Contracts setting out goals and targets have been signed since 2000, with the fourth contract signed in 2010. In the other urban areas with piped water supplies, the urban council is appointed as aWaterAuthority.TheMoWEhasaperformancecontractwith each Water Authority, which sets up a Water Supply and Sewerage Board (WSSB). Normally, the board hires a private operator to operate and maintain the system and provide services through a management contract of no more than three years. Regulation of urban water supply has been weak, although this is set to change now that an urban regulation unit has been established within the MoWE. It isplannedthat thiswillultimatelybecomeanindependent regulatory authority.
Figure 14Urban water supply scorecard
EnablingPolicy
2.5 2.5 1.5 3 1.5 3 1.5 2 3
Planning Budget Expenditure Equity Output Maintenance Expansion Use
Developing Sustaining
Source: CSO2 scorecard.
Water Supply and Sanitation in Uganda: Turning Finance into Services for 2015 and Beyond

24
An AMCOW Country Status Overview
In terms of equity, initiatives to provide water for the urban poor have been undertaken to a limited extent. It has, however, been noted that more investment is required for this based on the CSO2 scorecard scores, and there is little targeting of finance to urban areas most in need, through the use of allocation criteria.
Uganda has made some progress in enabling its utilities to meet their maintenance needs and expand organically, though there is still some way to go. The NWSC reinvests about 20 percent of its turnover into rehabilitation and expansion. The NWSC tariff covers operating costs as a whole,andcross-subsidizesbetweentowns.Effectivetariffadjustment mechanisms are in place for NWSC towns and urban councils. However, in the case of the small towns not under NWSC, there are no cross-subsidies through the tariff, and the running costs for 27 percent of schemes
cannot be met from the tariff, with the result that these schemes rely on grants.
The NWSC’s debt obligations of about US$77 million have been transferred to the government. Although the Corporation could seek commercial finance for expansion and replacement, there are concerns that this would create a new debt trap for it. Commercial borrowing is not a legal option for small town water supplies. The NWSC places considerable emphasis on customer care. A recent integrity survey24 found that customers experience corrupt practices by both NWSC and private operators. Service quality is reasonable for the NWSC, with water supplied on average 20 hours per day in most NWSC towns, while the average down time for piped water in small towns stands at around 43 days per year.

25
According to the JMP, rural sanitation coverage in Uganda in 2008 stood at 49 percent. The country is completely off-track tomeet the rural share of theMDG target of70 percent. However, Ministry of Health data show rural sanitation coverage to be higher, (62 percent in 2008 and 68 percent in 2009), against a national subsector target of 77 percent. The JMP data also suggest that an additional 22 percent of rural Ugandans use shared sanitation facilities, which it does not count as ‘improved’.
There are no subsidies for rural domestic sanitation in Uganda, which relies on a carrot and stick approach of sanitation promotion coupled with enforcement. Thus,
9. Subsector: Rural Sanitation and Hygiene
Priority actions for rural sanitation and hygiene
• Increasethelevelofpublicfinanceforsanitation.
• Improvejointplanning,implementation,andmonitoringofwaterandenvironmentactivities.
• Improvetheanalysisofthesocioeconomicimpactofparticulartechnologiesandmanagementoptions.
• Reportonsanitationactivities,outputs,andoutcomesinlinewiththeIntegratedSanitationandHygienestrategy.
• Showtheextenttowhichsanitationinitiatives(promotion,enforcementofby-laws,capacity-buildingofthe private sector) lead to outcomes.
• ReportmorefullyontheactivitiesandoutcomesofactivitiesundertakenbytheMinistryofHealthandlocal governments as a way of encouraging them to be more active.
the bulk of expected investments in rural sanitation shown in Figure 17 (US$45 million) are assumed household investments, which require concerted public intervention in the form of promotion and marketing.25 There is recognition that public actions need to be stepped up further, but funding levels for promotion are extremely low and actions are fragmented among different projects, many of which are undertaken by NGOs rather than through a sectorwide approach. A dedicated budget line for sanitation has been created but no funds are in place, and discussions as to which ministry should oversee the budget line are ongoing.
Figure 17Rural sanitation investment requirements
0 10 20 30 40 50 60
RequiredCAPEX Required OPEX
US$million/year
PublicCAPEXincludingpublicfacilitiesanddemonstation(anticipated)
HouseholdCAPEX(assumed) CAPEXdeficit
Source: CSO2 costing.
Figure 16Rural sanitation coverage
100%
80%
60%
40%
20%
0%1985 1990 1995 2000 2005 2010 2015 2020
Government estimates
JMP improved
Government target
JMP, improved + shared
Sources:Forgovernmentdata:MoH;forJMPdataandMDGtarget:JMP 2010 report.
Cov
erag
eWater Supply and Sanitation in Uganda: Turning Finance into Services for 2015 and Beyond

26
An AMCOW Country Status Overview
In comparison with peer-group countries, rural sanitation performance is weak with respect to the enabling stage, but stronger with respect to developing and sustaining the infrastructure (Figure 19). The scorecard (Figure 18) indicates that the upstream elements of policy and planning (within the enabling stage) could be further improved. However, inadequate budget allocation remains the biggest challenge to further improve rural sanitation. Sanitation expenditure can also not be fully separated out from water supply at the central government level.
Within the policy building block, institutional leadership remains an issue at the local level. Given decentralization, it is the responsibility of each local government to prioritize (or not prioritize) sanitation. The extent of promotion and enforcement by local governments varies widely. Uganda
Figure 19Average RSH scorecard scores for enabling, sustaining, and developing service delivery, and peer-group comparison
has launched a 10-year financing strategy for ISH26 but implementation is still at an early stage. Coordination of rural sanitation has improved at national level thanks to the National Sanitation Working Group, but there is still scope for further coordination, particularly with respect to reporting on the various initiatives and making sure that the activities are in line with government policy and the ISH financing strategy. Ensuring that each ministry is held accountable for fulfilling its sanitation responsibility is a major challenge, as no official body has a mandate for this. At local government level there are some cases of exemplary coordination as well as improvement of sanitation coverage from which others could learn. However, in general there is a lack of monitoring and analysis of the effectiveness of consistent and reliable funding or particular sanitation promotion tools, and enforcement practices. It would also be prudent to closely examine the links between promotion and enforcement activities to outcomes and thus systematically measure the effectiveness of particular practices. As can be seen from the score for the uptake building block, the rate at which households are responding to government encouragement to build sanitation facilities and change behavior regarding sanitation is currently inadequate to meet subsector targets. The HIASS collects information about the quantity and quality of household latrines in rural areas and provides a potential platform to understand the links between government output and household uptake.
The downstream aspects of sanitation markets for soap, toilets, and latrines in rural Uganda exist, and are being exploited to a certain extent, but are still relatively poorly understood. The ISH financing strategy aims to build the supply chain and private sector capacity for sanitation.
Figure 18Rural sanitation scorecard
Enabling
Uganda average scores
Averages, LICs, GNI p.p. <=$500
Sustaining Developing
Source: CSO2 scorecard.
EnablingPolicy
1.5 2 0 3 0.5 2 1 1 2
Planning Budget Expenditure Equity Output Markets Uptake Use
Developing Sustaining
Source: CSO2 scorecard.

27
Water Supply and Sanitation in Uganda: Turning Finance into Services for 2015 and Beyond
According to the 2008 JMP data, 38 percent of urban dwellers use sanitation facilities. However, this figure would rise to a very high value of 94 percent if shared facilities were also counted. MoH data estimates that urban sanitation coverage is 73 percent. Although shared facilities are included in the estimates, facilities which are not of a certain minimum standard are not counted.
According to the JMP, urban sanitation coverage has increased at a very slow rate since 1990 (Figure 20), and
10. Subsector: Urban Sanitation and Hygiene
Priority actions for urban sanitation and hygiene
• Increasethelevelofpublicfinanceforsanitation.
• Improvejointplanning,implementation,andmonitoringofwaterandenvironmentactivities.
• Reportonsanitationactivities,outputs,andoutcomesinlinewiththeISHstrategy.
• Improvetheanalysisofthesocioeconomicimpactofparticulartechnologiesandmanagementoptions.
• Increaseemphasisontheimprovementofexistingfacilities,notjustontheconstructionofnewfacilities.
• Exploreadditionalwaysofencouragingurbancouncilsandtownboardstoenforceby-laws.
• DevelopaframeworkforcollaborationbetweenKampalaCityCouncil,theNationalWaterandSewerageCorporation,privatecesspoolemptiersandconsumersundertheauspicesoftheregulatorswhogovernsanitation in Uganda.
projected coverage for 2015 is below the subsector’s shareofthesanitationMDG(68percent)andwellbelowthe national government target of 100 percent coverage by 2015.
The total annual urban sanitation capital investment requirement is estimated to be US$24 million (Figure 21). This incorporates the cost of sewerage infrastructure as set out in the SSIP, as well as connection costs and on-site sanitation facilities. Public investments in sanitation
Figure 21Urban sanitation investment requirements
0 10 20 30 40
RequiredCAPEX Required OPEX
US$million/year
Source: Sources: SSIP and CSO2 costing.
Figure 20Urban sanitation coverage
100%
80%
60%
40%
20%
0%1985 1990 1995 2000 2005 2010 2015 2020
Government estimates
JMP improved
Government target
JMP, improved + shared
Sources:Forgovernmentdata:MoH;forJMPdataandMDGtarget: JMP 2010 report.
Cov
erag
e
PublicCAPEX(anticipated) HouseholdCAPEX(assumed)
CAPEXdeficit

28
An AMCOW Country Status Overview
(Figure 21) for urban sewerage facilities and sanitation facilities in public places of US$10 million per year are anticipated, with an additional US$11 million per year in assumed user contributions. It should be noted that there is no subvention for on-site sanitation—as for rural sanitation the bulk of household investments are expected to be leveraged through promotion rather than financial support. The costs for such ‘software’ activities are additional to those presented in Figure 21. Additional O&M costs of US$7 million per year are also projected for urban sanitation.
Figure 23 shows that Uganda’s urban sanitation service delivery pathway scores better than the average for its peer countries, but that there is considerable room for improvement.
The scorecard in Figure 22 indicates that, as in the case of rural sanitation, the upstream, ‘enabling’ elements of policy and planning could be further improved but inadequate budget allocation remains a major challenge for the further improvement of urban sanitation. Local participation in the allocation of urban sanitation funds is very weak, hence the low equity score. With respect to sustaining the service delivery pathway, poor market development and insufficient uptake by households are significant obstacles which still need to be overcome.
Hygiene, the environment, and the water quality of Lake Victoria are all seriously threatened by inadequate sanitation services in Kampala and other towns. On-site sanitation and sewerage is lacking, treatment of effluent is grossly inadequate, and there is considerable urban run-off. On-site sanitation facilities in urban areas are not subsidized, whereas connection to the sewerage network is. However, sewerage services in general do not benefit the poorest members of society.
There is also limited subsidized septage collection in Kampala City, although not enough to meet the demand. It is through the enforcement of by-laws and approval of housing plans that urban sanitation is assured. However, the extent of the enforcement varies considerably and public sector capacity to do this is weak. Efforts to improve urban sanitation are highly fragmented, and mandates are not fully adhered to. The collection and treatment of septage in Kampala city is grossly inadequate. There are no major public programs to develop private sector capacity in urban sanitation as yet although there is clearly a latent market potential in this area. Financial flows are not sufficient to meet the urban sanitation MDG target
Figure 22Urban sanitation and hygiene scorecard
Figure 23Average USH scorecard scores for enabling, sustaining, and developing service delivery, and peer-group comparison
EnablingPolicy
1.5 2 0 3 0 1.5 0.5 1 2
Planning Budget Expenditure Equity Output Markets Uptake Use
Developing Sustaining
Enabling
Uganda average scores
Averages, LICs, GNI p.p. <=$500
SustainingDeveloping
Sources: CSO2 Scorecard
Source: CSO2 scorecard.

29
Water Supply and Sanitation in Uganda: Turning Finance into Services for 2015 and Beyond
(68 percent), with allocation rather than absorption being the main issue. Work has just started to prepare a Small Towns Sanitation and Hygiene strategy. As yet there is no systematic effort to understand the correlation between efforts to improve urban sanitation and outcomes.
According to a recent study (WSP 2008) on sanitation inKampala“rampant illegal sanitationpractices, lackofregulation and enforcement, and the limited functionality of Bugolobi sewage treatment works have all had a negative impact on Kampala’s environment and causedadded pollution to water resources. As a result, NWSC estimates that its water purification costs have tripled
over the last three years”. The study recommends the development of a framework of relationships between KampalaCityCouncil,theNWSC,privatecesspoolemptieroperators(throughthePrivateEmptiersAssociation)andconsumers under the auspices of the regulators who govern the water and sanitation sector in Uganda.
The sewerage networks in Uganda only cover 3.6 percent of the urban population and there are weaknesses in the sewerage treatment capacity. The NWSC cannot readily disaggregate sewerage costs from water supply so the financial viability of sewerage treatment in Uganda is not clear.
30
An AMCOW Country Status Overview
NotesandReferences
However while theMoWE and JMP rural water figuresare reasonably close, the same cannot be said for urban water supply. The MoWE uses different definitions forurban coverage than UBOS. As a result, the JMP estimates coverage at over 90 percent compared to 61 percent accordingtotheMoWE,for2008.ThiswidediscrepancydeservesfurtherattentionbytheMoWEandUBOS.
5 Ministry of Water and Environment (MoWE). 2009.Strategic Sector Investment Plan for the Water and Sanitation Sector in Uganda. Final, July 2009
6 For this analysis, a small user contribution of 5 percent for rural water supply capital costs has been assumed.
7 Public subventions are currently only offered for sewerage.8 The CSO2 costing model does not attempt to estimate
the per capita cost of ‘software’ interventions relative to targets, because the contribution of such interventions to increased coverage is not precisely understood.
9 Due to rounding, component figures may not sum tototals.
10 The CSO2 scorecard methodology and conceptual framework are discussed in detail in the synthesis report.
11 GovernmentofUganda(GoU).2004.PovertyEradicationActionPlan(PEAP).
12 World Bank Atlas Method.13 GoU. 1995. Constitution of the Republic of Uganda.14 GoU. 2001. Memorandum of Understanding on Ministerial
responsibilitiesforSanitation/HygienePromotionActivities.15 MoWE. 2003. Urban Water and Sanitation Reform
Strategy.16 GoU.1997.TheKampalaDeclarationonSanitation(KDS).17 MinistryofHealth,EnvironmentalHealthDivision.2005.
NationalEnvironmentalHealthPolicy.18 GoU. 1999. The National Water Policy. Government of
Uganda.
1 Global Economic Monitor, The World Bank. 2010average.
2 The first round of CSOs was carried out in 2006 covering 16 countries and is summarized in the report, ‘Getting Africa On-TracktoMeettheMDGsonWaterandSanitation’.
3 Targets differ for the following reasons: There is some variation in the assumed 1990 baseline values for the JMP andMoWEfigures,withimplicationsfortheMDGtargets.WhereastheMoWEdataindicatesthatruralcoveragewasaround 20 percent in 1990, the 2008 JMP report currently showsavalueof39percentcoveragein1990.TheMDGprogressReport forUganda (UNDP2003)andStatisticalAbstract (UBOS 2008) state that the MDG target forrural water is 62 percent (based on a rural coverage of 23 percent in 1990). However, the JMP 1990 value of 39 percent, as reported in the 2010 report, places the rural shareof theMDGtargetat70percent. Forconsistencywith the JMP, the CSO analysis uses a target of 70 percent fortheruralshareoftheMDGtarget.Inthecaseofurbanwatersupply,thereisalackofreliabledatafor1990.UNDP(2003) indicates that coverage in 2001 was 60 percent. For the CSO, the 2010 JMP report figure of 78 percent is accepted for urban coverage in 1990. This gives a target of89percentfortheshareofthewatersupplyMDGinurbanareas.TheoverallwaterMDGis thus72percent,whichisconsistentwithUganda’sNationalDevelopmentPlan. It should be noted that theMDG targets are notparticularly relevant within Uganda as national targets for rural and urban water coverage are considerably higher, at 77 percent and 100 percent, respectively, with a combined target of 80 percent by 2015.
4 The national headline water access figures from the MoWEarebasedon infrastructure records (fromdistrictlocal government, urban councils and the NWSC). It is these headline figures which are set against the national targets.MoWErecognizestheUgandaBureauofStatistics(UBOS) national survey data, which feeds into the JMP.

31
19 Indicators relating to the institutional framework section are as follows: All subsectors: targets in national development plans/PRSP; subsector policy agreed andapproved (gazetted as part of national policy or as standalonepolicy);RWS/UWS:institutionalrolesdefined;RSH/USH:institutionalleadappointed.
20 GoU. 2010. National Development Plan (2010/2011 to2014/2015).
21 Indicators relating to the section on financing and its implementation are as follows: All subsectors: programmatic Sector-Wide Approach; investment program based on MDGneedsassessment;sufficientfinancetomeetMDG(subsidy policy for sanitation); percent of official donor commitments utilized; percent of domestic commitments utilized.
22 IndicatorsrelatingtothesectorM&Esectionareasfollows:All subsectors: annual review setting new undertakings; subsector spend identifiable in budget (UWS: inc. recurrent subsidies);budgetcomprehensivelycoversdomestic/donorfinance;RWS,RSH,andUSH:domestic/donorexpenditurereported; UWS: audited accounts and balance sheets from
utilities; RWS, RSH, and USH: periodic analysis of equity criteria by civil society organizations and government; UWS: pro-poor plans developed and implemented by utilities; RWS/UWS: nationally consolidated reportingofoutput;RSH/USH:monitoringofquantity andqualityof uptake relative to promotion and subsidy efforts; all subsectors: questions and choice options in household surveysconsistentwithMDGdefinitions.
23 Water and Sanitation Program and Water Integrity Network. 2009. Baseline Survey on Integrity in the Ugandan Water Supply and Sanitation Sector (WSS).
24 See note 23.25 Duetotheintegrationofthispolicyassumptionintothe
costing model (that is, a 100 percent user contribution), the ‘Assumed household investment’ bar is equivalent tothe‘TotalCAPEXrequirements’.Withoutasignificantincrease in promotion and other forms of ‘software’, this amount will remain theoretical.
26 GoU. 2006. 10-year Improved Sanitation and Hygiene Promotion Financing Strategy (ISH).
Water Supply and Sanitation in Uganda: Turning Finance into Services for 2015 and Beyond

Notes

The first round of Country Status Overviews (CSO1) published in 2006 benchmarked the preparedness of sectors of 16 countries in Africa to meet the WSS MDGs based on their medium-term spending plans and a set of ‘success factors’ selected from regional experience. Combined with a process of national stakeholder consultation, this prompted countries to ask whether they had those ‘success factors’ in place and, if not, whether they should put them in place.
The second round of Country Status Overviews (CSO2) has built on both the method and the process developed in CSO1. The ‘success factors’ have been supplemented with additional factors drawn from country and regional analysis to develop the CSO2 scorecard. Together these reflect the essential steps, functions and results in translating finance into services through government systems – in line with Paris Principles for aid effectiveness. The data and summary assessments have been drawn from local data sources and compared with internationally reported data, and, wherever possible, the assessments have been subject to broad-based consultations with lead government agencies and country sector stakeholders, including donor institutions.
This second set of 32 Country Status Overviews (CSO2) on water supply and sanitation was commissioned by the African Ministers’ Council on Water (AMCOW). Development of the CSO2 was led by the World Bank administered Water and Sanitation Program (WSP) in collaboration with the African Development Bank (AfDB), the United Nations Children’s Fund (UNICEF), the World Bank and the World Health Organization (WHO).
This report was produced in collaboration with the Government of Uganda and other stakeholders during 2009/10. Some sources cited may be informal documents that are not readily available.
The findings, interpretations, and conclusions expressed in this volume do not necessarily reflect the views of the collaborating institutions, their Executive Directors, or the governments they represent. The collaborating institutions do not guarantee the accuracy of the data included in this work. The boundaries, colors, denominations, and other information shown on any map in this work do not imply any judgment on the part of the collaborating institutions concerning the legal status of any territory or the endorsement or acceptance of such boundaries.
The material in this publication is copyrighted. Requests for permission to reproduce portions of it should be sent to [email protected]. The collaborating institutions encourage the dissemination of this work and will normally grant permission promptly. For more information, please visit www.amcow.net or www.wsp.org.
Photograph credits: Cover photograph by The Water and Sanitation Program Photographs published with permission from Gallo Images/Getty Images/AFP and The Bigger Picture/Reuters Other photograph by Sustainable Sanitation Alliance (SuSanA)/Enno Schroeder (GIZ)
© 2011 Water and Sanitation Program

For enquiries, contact:Water and Sanitation Program–Africa RegionThe World Bank, Upper Hill RoadP.O. Box 30577, 00100, Nairobi, KenyaTel: +(254) 20 322 6300 E-mail: [email protected] site: www.wsp.org
An AMCOW Country Status Overview
Water Supply and Sanitation in UgandaTurning Finance into Services for 2015 and Beyond


