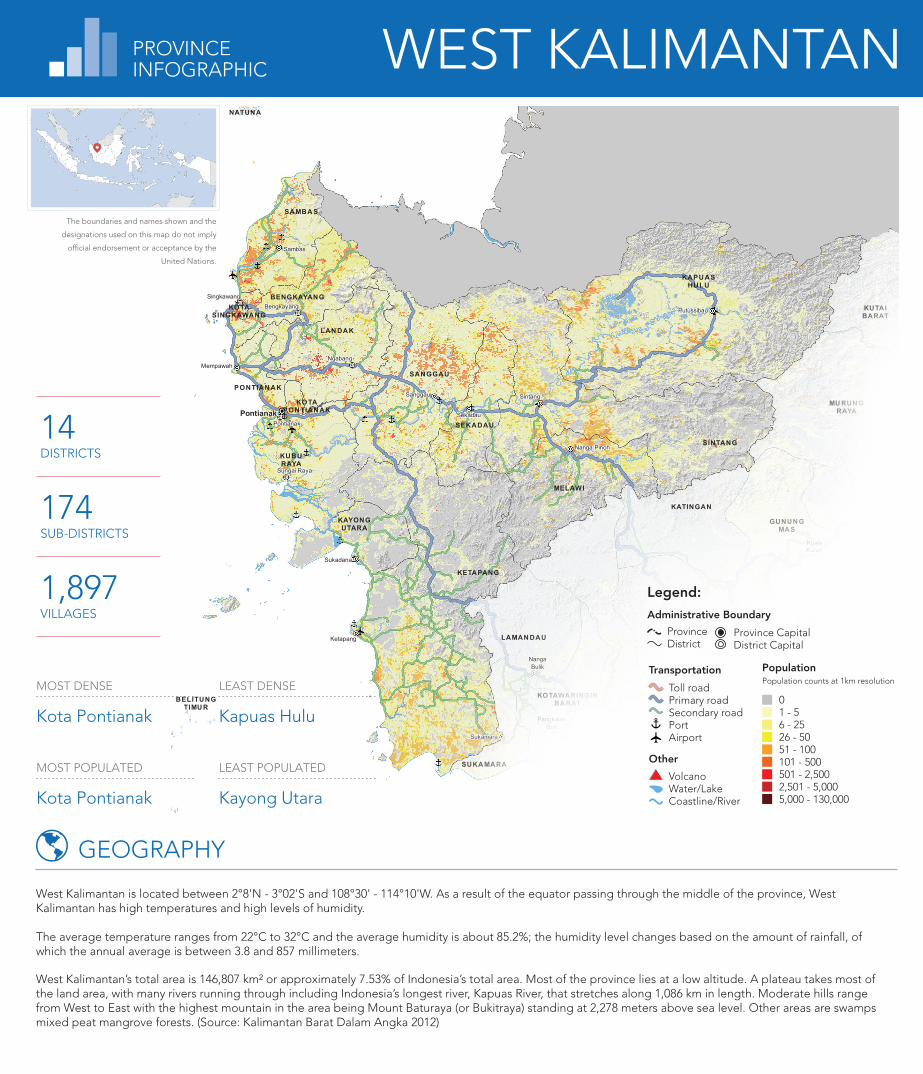
BELITUNG TIMUR NATUNA SAMBAS BENGKAYANG LANDAK PONTIANAK SANGGAU KETAPANG SINTANG KAPUAS HULU SEKADAU MELAWI KAYONG UTARA KUBU RAYA KOTA PONTIANAK KOTA SINGKAWANG KOTAWARINGIN BARAT KOTAWARINGIN TIMUR KAPUAS BARITO UTARA SUKAMARA LAMANDAU SERUYAN KATINGAN PULANG PISAU GUNUNG MAS MURUNG RAYA KOTA PALANGKA RAYA BARITO KUALA KUTAI BARAT Palangkaraya Pontianak Pontianak Singkawang Bengkayang Putussibau Ketapang Mempawah Sambas Sintang Sukadana Sungai Raya Ngabang Nanga Pinoh Sanggau Sekadau Palangka Raya Kuala Kapuas Pangkalan Bun Sampit Kuala Kurun Nanga Bulik Pulang Pisau Sukamara Kuala Pembuang 0 1 - 5 6 - 25 26 - 50 51 - 100 101 - 500 501 - 2,500 2,501 - 5,000 5,000 - 130,000 Population Population counts at 1km resolution Transportation Toll road Primary road Secondary road Port Airport Province Capital District Capital Other Volcano Water/Lake Coastline/River Administrative Boundary Legend: Province District LEAST POPULATED Kayong Utara MOST DENSE Kota Pontianak MOST POPULATED Kota Pontianak LEAST DENSE Kapuas Hulu 14 DISTRICTS 174 SUB-DISTRICTS 1,897 VILLAGES West Kalimantan is located between 2°8'N - 3°02'S and 108°30' - 114°10'W. As a result of the equator passing through the middle of the province, West Kalimantan has high temperatures and high levels of humidity. The average temperature ranges from 22°C to 32°C and the average humidity is about 85.2%; the humidity level changes based on the amount of rainfall, of which the annual average is between 3.8 and 857 millimeters. West Kalimantan’s total area is 146,807 km² or approximately 7.53% of Indonesia’s total area. Most of the province lies at a low altitude. A plateau takes most of the land area, with many rivers running through including Indonesia’s longest river, Kapuas River, that stretches along 1,086 km in length. Moderate hills range from West to East with the highest mountain in the area being Mount Baturaya (or Bukitraya) standing at 2,278 meters above sea level. Other areas are swamps mixed peat mangrove forests. (Source: Kalimantan Barat Dalam Angka 2012) GEOGRAPHY The boundaries and names shown and the designations used on this map do not imply official endorsement or acceptance by the United Nations. PROVINCE INFOGRAPHIC WEST KALIMANTAN
West Kalimantan is located between 2°8'N - 3°02'S and 108°30' - 114°10'W. As a result of the equator passing through the middle of the province, West Kalimantan has high temperatures and high levels of humidity.
The average temperature ranges from 22°C to 32°C and the average humidity is about 85.2%; the humidity level changes based on the amount of rainfall, of which the annual average is between 3.8 and 857 millimeters.
West Kalimantan’s total area is 146,807 km² or approximately 7.53% of Indonesia’s total area. Most of the province lies at a low altitude. A plateau takes most of the land area, with many rivers running through including Indonesia’s longest river, Kapuas River, that stretches along 1,086 km in length. Moderate hills range from West to East with the highest mountain in the area being Mount Baturaya (or Bukitraya) standing at 2,278 meters above sea level. Other areas are swamps mixed peat mangrove forests. (Source: Kalimantan Barat Dalam Angka 2012)
GEOGRAPHY
The boundaries and names shown and the
designations used on this map do not imply
official endorsement or acceptance by the
United Nations.
PROVINCEINFOGRAPHIC WEST KALIMANTAN
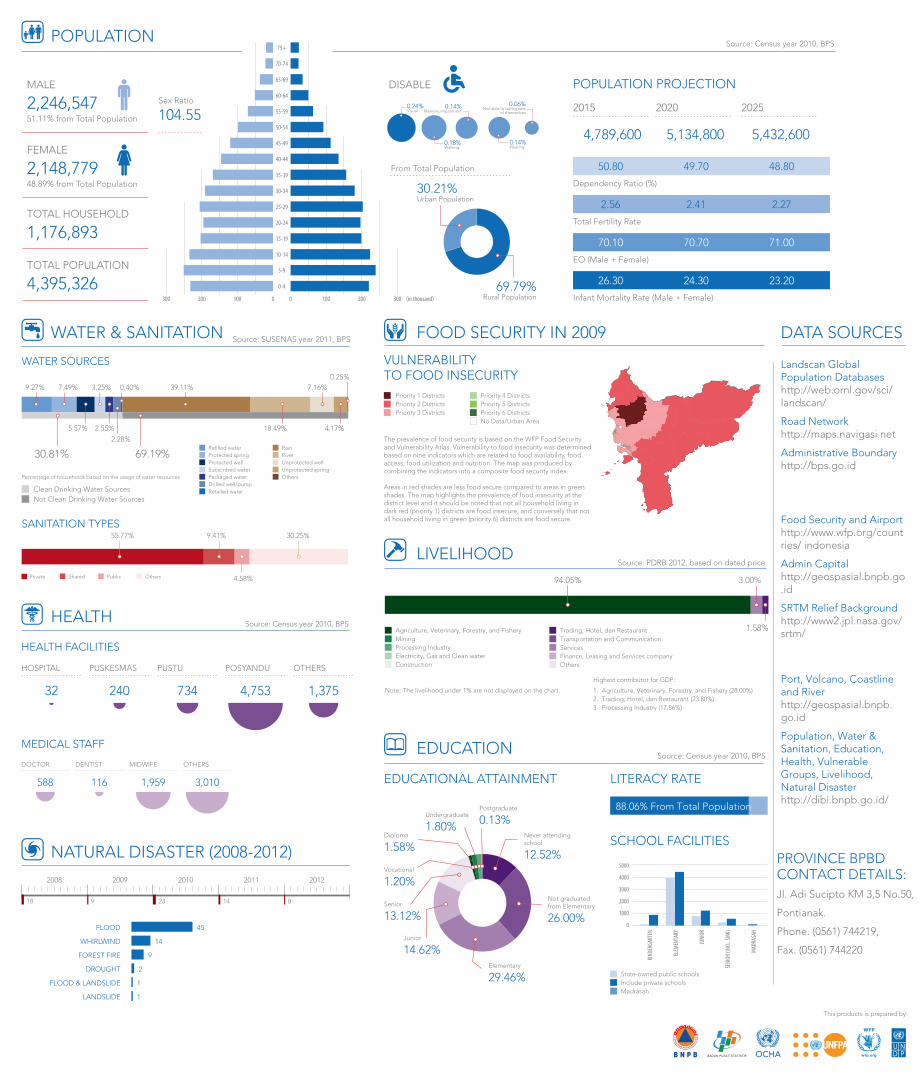
POPULATION
24
DISABLE
From Total Population
30.21%Urban Population
69.79%Rural Population
0-4
5-9
10-14
15-19
20-24
25-29
30-34
35-39
40-44
45-49
50-54
55-59
60-64
65-69
70-74
75+
0 100 200 3000100200300 (in thousand)
2015
4,789,600
2020
5,134,800
2025
5,432,600
POPULATION PROJECTION
Total Fertility Rate
Infant Mortality Rate (Male + Female)
Dependency Ratio (%)
EO (Male + Female)
50.80
2.56
70.10
26.30
48.80
2.27
71.00
23.20
49.70
2.41
70.70
24.30
TOTAL HOUSEHOLD
1,176,893
TOTAL POPULATION
4,395,326
MALE
2,246,54751.11% from Total Population
Sex Ratio
104.55
FEMALE
2,148,77948.89% from Total Population
0.24%Visual
0.18%Walking
0.14%Memory impairment
0.14%Hearing
0.06%Not able to taking care
of themselves
WATER & SANITATION
Private Public OthersShared
SANITATION TYPES55.77% 9.41%
4.58%
30.25%
30.81% 69.19%
9.27% 7.49% 3.25% 0.40% 39.11%
5.57% 2.55% 18.49%
WATER SOURCES
4.17%
7.16%0.25%
Protected wellProtected spring
Unprotected wellRiver
Unprotected spring
Rain
Subscribed waterPackaged water
Refilled water
Drilled well/pumpRetailed water
Others
2.28%
Clean Drinking Water Sources Not Clean Drinking Water Sources
Percentage of households based on the usage of water resources
Priority 4 DistrictsPriority 5 DistrictsPriority 6 DistrictsNo Data/Urban Area
The prevalence of food security is based on the WFP Food Security and Vulnerability Atlas. Vulnerability to food insecurity was determined based on nine indicators which are related to food availability, food access, food utilization and nutrition. The map was produced by combining the indicators into a composite food security index. Areas in red shades are less food secure compared to areas in green shades. The map highlights the prevalence of food insecurity at the district level and it should be noted that not all household living in dark red (priority 1) districts are food insecure, and conversely that not all household living in green (priority 6) districts are food secure.
VULNERABILITYTO FOOD INSECURITY
Highest contributor for GDP:
1. Agriculture, Veterinary, Forestry, and Fishery (28.00%)2. Trading, Hotel, dan Restaurant (23.80%)3. Processing Industry (17.86%)
ServicesFinance, Leasing and Services companyOthers
Transportation and CommunicationTrading, Hotel, dan Restaurant
Processing IndustryElectricity, Gas and Clean waterConstruction
MiningAgriculture, Veterinary, Forestry, and Fishery
94.05% 3.00%
Note: The livelihood under 1% are not displayed on the chart.
1.58%
LIVELIHOOD
EDUCATION
EDUCATIONAL ATTAINMENT LITERACY RATE
State-owned public schoolsInclude private schoolsMadrasah
88.06% From Total Population
Senior
13.12%
Vocational
1.20%Not graduatedfrom Elementary
26.00%
Elementary
29.46%
Junior
14.62%
Diploma
1.58%
Undergraduate
1.80%
Postgraduate
0.13%Never attendingschool
12.52%
KIND
ERGA
RTEN
ELEM
ENTA
RY
JUNI
OR
SENI
OR (I
NCL.
SMK)
MAD
RASA
H
SCHOOL FACILITIES
0
1000
2000
3000
4000
5000
Source: SUSENAS year 2011, BPS
Source: Census year 2010, BPS
Source: Census year 2010, BPS
Source: PDRB 2012, based on dated price
Source: Census year 2010, BPS
DATA SOURCES
PROVINCE BPBD CONTACT DETAILS: Jl. Adi Sucipto KM 3,5 No.50,
Pontianak.
Phone. (0561) 744219,
Fax. (0561) 744220
Landscan Global Population Databaseshttp://web.ornl.gov/sci/ landscan/
Road Networkhttp://maps.navigasi.net
Administrative Boundaryhttp://bps.go.id
Food Security and Airporthttp://www.wfp.org/countries/ indonesia