Active-transport walking behavior: destinations, durations, distances Hugh Millward a,⇑ , Jamie Spinney a , Darren Scott b a Department of Geography, Saint Mary’s University, Halifax, NS, Canada b TransLAB (Transportation Research Lab), School of Geography and Earth Sciences, McMaster University, Hamilton, ON, Canada article info Keywords: Walking Walkability Active transport Destinations Durations Distances abstract This paper fills a gap in our knowledge of active-transport (AT) walking, by presenting detailed aspects of walking behavior for a medium-sized North American city. It analyzes the frequency and length of walk- ing episodes, categorized by origins, purposes, and destinations, and also investigates distance-decay functions for major destinations. The study employs day-after recall time diary and questionnaire data from the 2007–8 Space–Time Activity Research (STAR) survey conducted in Halifax, Canada. GPS co-ordi- nate data enhanced the accuracy of location information, start times, and end times of the 1790 AT walk- ing episodes, while GIS software was used to compute a shortest-path distance between the origin and destination of each episode. Home is both the most common origin and destination for AT walks, and the most common purpose is travel-to-shop rather than travel-to-work. Most walks are to non-home locations, such as retail establish- ments and offices. Particularly important are restaurants and bars, grocery stores, shopping centers, banks, and other services. All major destinations show strong distance-decay effects: most walks are shorter than 600 m, and very few exceed 1200 m. The assumption employed in the walkability literature, that one should restrict the ‘neighborhood of opportunity’ to walking destinations within 1000 m of the home, is seen to be well justified. However, a planning policy focus on the walker’s home neighborhood is revealed as questionable, since the majority of walking trips do not originate from the home. The rela- tionship between urban land-use patterns and walkability may therefore require some rethinking. Ó 2012 Elsevier Ltd. All rights reserved. 1. Introduction and aims The promotion of active-transport (AT) walking is an important goal of both land-use and transportation planning, since walking is an environmentally–friendly alternative to motorized travel in ur- ban areas, and an important form of healthy physical activity (Sal- lis et al., 2004). Walking research tends to reside in two bodies of literature (health/leisure versus transport/land-use), both with their own viewpoints, methods, and policy orientations. Both ap- proaches to walking research have suffered from a lack of objective data on walking behavior, typically relying on recall questionnaires using subjective categories of walking frequencies and durations. In particular, little information is available on the geography of walking behavior: travel episode origins and destinations, routes, and lengths (durations and distances). This paper addresses this gap in our knowledge. We report and assess aggregated AT walking behavior derived from the innova- tive STAR (Space–Time Activity Research) time-use and transport survey, which tracked respondents using a GPS-enabled (global positioning system) personal data device. Elsewhere, we used STAR data to investigate travel purposes, participant characteristics, and travel episode timing (season, day of week, time of day) (Spinney et al., 2012). Our focus in the current paper is on origins, destina- tions, durations, and distances. We are particularly interested to investigate the assumption, frequently made in the planning liter- ature, that AT walking episodes normally originate or terminate at home. We also investigate in detail the major attractors (destina- tions) for purposeful walking, and gauge their attractive power (gravitational weights) and distance-decay functions. 2. Related theory and empirical research Of the four domains of physical activity (i.e., leisure, active transportation, personal care, and work activities) (Armstrong and Bull, 2006; World Health Organization, 2002), walking is an important component of both the active transportation and leisure domains. Studies have shown that walking is the most common form of leisure-time physical activity in Canada (Gilmour, 2007), the US (Rafferty et al., 2002), and Europe (Pucher and Dijkstra, 2003), and leisure walking has been the focus of most walking studies. Health researchers and public health officials are attracted to the potential for enhancing healthy exercise thorough leisure 0966-6923/$ - see front matter Ó 2012 Elsevier Ltd. All rights reserved. http://dx.doi.org/10.1016/j.jtrangeo.2012.11.012 ⇑ Corresponding author. Address: Department of Geography, Saint Mary’s Uni- versity, 923 Robie St., Halifax, NS, Canada B3H 3C3. Tel.: +1 902 420 5739; fax: +1 902 496 8213. E-mail address: [email protected](H. Millward). Journal of Transport Geography 28 (2013) 101–110 Contents lists available at SciVerse ScienceDirect Journal of Transport Geography journal homepage: www.elsevier.com/locate/jtrangeo
Transcript
Journal of Transport Geography 28 (2013) 101–110
Contents lists available at SciVerse ScienceDirect
Journal of Transport Geography
journal homepage: www.elsevier .com/ locate / j t rangeo
Hugh Millward a,⇑, Jamie Spinney a, Darren Scott b
a Department of Geography, Saint Mary’s University, Halifax, NS, Canadab TransLAB (Transportation Research Lab), School of Geography and Earth Sciences, McMaster University, Hamilton, ON, Canada
This paper fills a gap in our knowledge of active-transport (AT) walking, by presenting detailed aspects ofwalking behavior for a medium-sized North American city. It analyzes the frequency and length of walk-ing episodes, categorized by origins, purposes, and destinations, and also investigates distance-decayfunctions for major destinations. The study employs day-after recall time diary and questionnaire datafrom the 2007–8 Space–Time Activity Research (STAR) survey conducted in Halifax, Canada. GPS co-ordi-nate data enhanced the accuracy of location information, start times, and end times of the 1790 AT walk-ing episodes, while GIS software was used to compute a shortest-path distance between the origin anddestination of each episode.
Home is both the most common origin and destination for AT walks, and the most common purpose istravel-to-shop rather than travel-to-work. Most walks are to non-home locations, such as retail establish-ments and offices. Particularly important are restaurants and bars, grocery stores, shopping centers,banks, and other services. All major destinations show strong distance-decay effects: most walks areshorter than 600 m, and very few exceed 1200 m. The assumption employed in the walkability literature,that one should restrict the ‘neighborhood of opportunity’ to walking destinations within 1000 m of thehome, is seen to be well justified. However, a planning policy focus on the walker’s home neighborhood isrevealed as questionable, since the majority of walking trips do not originate from the home. The rela-tionship between urban land-use patterns and walkability may therefore require some rethinking.
� 2012 Elsevier Ltd. All rights reserved.
1. Introduction and aims
The promotion of active-transport (AT) walking is an importantgoal of both land-use and transportation planning, since walking isan environmentally–friendly alternative to motorized travel in ur-ban areas, and an important form of healthy physical activity (Sal-lis et al., 2004). Walking research tends to reside in two bodies ofliterature (health/leisure versus transport/land-use), both withtheir own viewpoints, methods, and policy orientations. Both ap-proaches to walking research have suffered from a lack of objectivedata on walking behavior, typically relying on recall questionnairesusing subjective categories of walking frequencies and durations.In particular, little information is available on the geography ofwalking behavior: travel episode origins and destinations, routes,and lengths (durations and distances).
This paper addresses this gap in our knowledge. We report andassess aggregated AT walking behavior derived from the innova-tive STAR (Space–Time Activity Research) time-use and transportsurvey, which tracked respondents using a GPS-enabled (global
ll rights reserved.
eography, Saint Mary’s Uni-el.: +1 902 420 5739; fax: +1
rd).
positioning system) personal data device. Elsewhere, we used STARdata to investigate travel purposes, participant characteristics, andtravel episode timing (season, day of week, time of day) (Spinneyet al., 2012). Our focus in the current paper is on origins, destina-tions, durations, and distances. We are particularly interested toinvestigate the assumption, frequently made in the planning liter-ature, that AT walking episodes normally originate or terminate athome. We also investigate in detail the major attractors (destina-tions) for purposeful walking, and gauge their attractive power(gravitational weights) and distance-decay functions.
2. Related theory and empirical research
Of the four domains of physical activity (i.e., leisure, activetransportation, personal care, and work activities) (Armstrongand Bull, 2006; World Health Organization, 2002), walking is animportant component of both the active transportation and leisuredomains. Studies have shown that walking is the most commonform of leisure-time physical activity in Canada (Gilmour, 2007),the US (Rafferty et al., 2002), and Europe (Pucher and Dijkstra,2003), and leisure walking has been the focus of most walkingstudies. Health researchers and public health officials are attractedto the potential for enhancing healthy exercise thorough leisure
102 H. Millward et al. / Journal of Transport Geography 28 (2013) 101–110
walking (Trost et al., 2002; Williams et al., 2008), and to a lesserextent through active transport (Hamer and Chida, 2008; Kitchenet al., 2011; Merom et al., 2010; Shephard, 2008), but someresearchers (Cervero and Duncan, 2003) caution that many aspectsof the North American built environment ‘‘conspire againstwalking’’.
In the land-use planning literature, considerable research hasfocused on relationships between walking activity, health, andthe built environment, typically using self-reported quantities oftotal walking, or of leisure walking. These studies inform and sup-port policies aimed at increasing the mode share of walking, andhypothesize that walking behaviors are significantly affected bythe ‘‘walkability’’ of neighborhoods focused on respondents’ homes(typically employing a buffer radius of one kilometer). They makean implicit assumption, therefore, that walking largely or exclu-sively occurs within such neighborhood areas. Early conceptualand expository papers on this theme were provided by Atash(1994), Crane (2000), Frank and Engelke (2001), Handy et al.(2002), Moudon and Lee (2003), and Saelens et al. (2003). Manyempirical studies have been conducted, and several meta-studiesare now available (Ewing and Cervero, 2010; Gebel et al., 2007;Lee and Moudon, 2004; Renalds et al., 2010; Sallis, 2009; Saelensand Handy, 2008). A large proportion of the studies use walkabilitymeasures of residential density, street connectivity, and land-usemix derived from an early study by Boarnet and Sarmiento(1998), but incorporated into a single ‘walkability index’ by Franket al. (2005). Though easy to use and understand, this index hasvaried in its details and sub-index weightings from study to study.In addition, the sub-indexes are inter-correlated, so that their ef-fects are not simply additive, and their separate contributions arenot reported. An alternative approach, taken by Lee and Moudon(2006), employs multiple regression to isolate the separate effectsof a host of land-use and urban-form measures (and personal char-acteristics too). Their ‘shotgun’ approach is more statistically rigor-ous, but far less opaque, and difficult to replicate.
Many walkability studies have focused on measuring and pre-dicting all walking, undifferentiated by purpose. Some studies, par-ticularly those employing questionnaires derived from an IPAQ(International Physical Activity Questionnaire), differentiate be-tween walking for leisure/recreation and walking for transport(AT), and a small number of studies have focused largely or exclu-sively on walking for transport. Of the latter, we should particu-larly note studies by Cerin et al. (2007), Duncan et al. (2010),Frank et al. (2006, 2007, 2008a), Kitchen et al. (2011), McGinnet al. (2007), and Yang and Diez-Roux (2012). Recently, severalstudies have examined the prevalence of walking to school, andits relationship to neighborhood walkability (Spinney and Mill-ward, 2011a; Babey et al., 2009; Collins and Kearns, 2010; Meromet al., 2006; Mitra et al., 2010; Pont et al., 2009; Timperio et al.,2006).
Transport researchers have been concerned to identify the fac-tors that affect mode choice and trip rates relating to active travel.Following important early studies by Frank and Pivo (1994) andCervero and Kockelman (1997), several papers have examinedwalking mode choice and trip behavior in comparison to cyclingand motorized modes (Cervero et al., 2009; Chen and McKnight,2007; Kelly et al., 2011; Rodriguez and Joo, 2004; Schwanen andMokhtarian, 2005; Walton and Sunseri, 2010). Newbold et al.(2005) examined walking trip-choice in relation to age cohorts,while Scheiner (2010) related the choice to age cohorts, sex, citysize, availability of car, and trip distance. Using several Germansurveys, he showed that walking is the dominant trip mode at dis-tances below one kilometer, and still very important in the 1–2 kmband.
A major problem with walking studies in general, but particu-larly those focusing on neighborhood walkability, has been the
quality and reliability of data on walking behaviors. Most walkabil-ity studies have relied on subjective recall questionnaires, typicallyderived from IPAQ. They measure amount of walking activity by asmall number of subjective categories, rather than by exact num-ber or length of walking episodes, and they are influenced by bothrecall bias and social-desirability bias (CFLRI, 2009; Klesges et al.,2003; LaMonte et al., 2003; Rizzo et al., 2007; Van der Ploeget al., 2010). As an example, Cerin et al. (2007) related both objec-tive and perceived measures of neighborhood walkability to self-reported estimates of weekly duration of walking for transport,and self-reported monthly frequency of walking to specific desti-nations. A few walking studies have employed time diaries, whichare more accurate than recall questionnaires (e.g. Forsyth et al.,2007; Frank et al., 2008b, 2010), and one research team used atime-diary in combination with accelerometers to measure dis-tances (Forsyth et al., 2007, 2008). All walkability studies, however,focus on correlating urban form measures with a single measure ofrespondent walking activity (often a category rather than scalemeasure), and do not attempt to analyze the varying characteris-tics of the walking episodes themselves.
Time diary data have long been recognized as an importantmethod for measuring and studying human behavior (Ås, 1978;Gershuny, 2000; Meier, 1959; Robinson and Godbey, 1999). Sev-eral recent studies have employed national time-use surveys toinvestigate walking behaviors. Studies by Tudor-Locke et al.(2005) for Australia and for the United States (Tudor-Locke et al.,2007) revealed interesting variations between walking for leisureand walking for transport. These findings are complemented bydata from Canadian national health surveys on the self-reportedprevalence of walking for exercise (Bryan and Katzmarzyk, 2009).Adams (2010) uses the United Kingdom national Time Use Surveyto focus specifically on active-transport (AT) walking/bicycling,and to model the characteristics of those participating in AT. Inthe United States, the 2009 National Household Travel Survey,based on a 24-h travel diary, has yielded useful data on distancesand durations of walking trips, employing seven broad purposecategories (Yang and Diez-Roux, 2012).
In a recent study the authors employed GPS-verified time-diarydata from the Halifax STAR project to provide a thorough compar-ison of AT-walking versus leisure walking (Spinney et al., 2012).The results indicate substantial and significant differences betweenthe two types of walking, related to participants, location catego-ries, and timing (season, day of week, and time of day). Comparedto walking for recreation, walking for transport has higher partici-pation rates and more occurrences, and travel episodes are morelikely to originate and terminate outside of the home. Similar tofindings for Australia (Tudor-Locke et al., 2005), we found thatwalking for transport contributes less to total physical activity thanwalking for recreation, because the latter exhibits much longerdurations, both per travel episode and per participant.
The current study builds on this earlier work by providing amore detailed examination of AT-walking related to origins anddestinations, highlighting the importance of some specific serviceand amenity destinations. A notable ‘‘first’’ is the use of GPS datato measure accurately the origin and destination of walking epi-sodes, and thereby calculate travel episode distances accurately,thus enabling us to study both time-decay and distance-decaygradients.
3. Data and methods
3.1. The STAR survey
This study employs time-diary and questionnaire data, and GPSgeo-coordinate data, from the Space–Time Activity Research
H. Millward et al. / Journal of Transport Geography 28 (2013) 101–110 103
(STAR) survey conducted in Halifax, Canada. This was the world’sfirst large-scale application of a GPS-assisted prompted recall sur-vey, and the ‘‘largest GPS sample within the context of a householdtravel survey project undertaken to date’’ (Bricka, 2008, p. 3). De-tailed descriptions of the survey design (Spinney and Millward,2011b; TURP, 2008a), and a socio-demographic profile of respon-dent characteristics (Millward and Spinney, 2011), are reportedelsewhere. A brief summary of the survey design follows. The tar-get population for this randomly-selected sample was privatedwellings in Halifax Regional Municipality (HRM), a county-sizedmetropolitan area along the east coast of Nova Scotia, Canada.The survey was conducted between April 2007 and May 2008.The primary sampling unit was the household, while the secondarysampling unit was a randomly selected individual member of thehousehold, over the age of 15, who acted as the primary respon-dent, and completed a computer-assisted telephone interview(CATI) questionnaire, carried a cellular-assisted GPS device (Hew-lett Packard iPAQ hw6955) for a 48-h reporting period, maintaineda daily ‘‘activity log’’ during that period, and completed a two-daytime-diary survey the day after the two-day reporting period hadended. The respondents’ descriptions of their activities were aidedby the GPS data for prompting and validation purposes, and latercategorized into 188 different activity codes that, for validationand comparison purposes, were based on Statistics Canada’s2005 General Social Survey on Time Use (TURP, 2008b).
3.2. Measures of walking
The STAR survey, like other time-dairy surveys, captured thecomplete daily record of consecutive activity episodes or events(see Harvey, 1990), which include the activity being performed(e.g., eat, sleep, work), the start and end time of each event, andconcurrent contextual information, such as the location of theevent (e.g., home, work, outdoors). The STAR survey provides ‘‘tra-vel mode’’ (e.g., car as driver, bus, walking) information using thelocation of each event, and employs the activity code of each eventto capture the ‘‘travel purpose’’ (e.g., code 90 is used for ‘‘travel to/from work’’, while code 390 represents travel for ‘‘shopping andservices’’). We used activity information to identify all walkingfor recreation events (code 821), but the identification of walkingfor transport events required the use of information about boththe main activity and the location of each episode. That is, walkingfor transport includes all travel activities whose location indicateswalking as the travel mode. On the other hand, walking for recre-ation includes recreational walking, hiking, and jogging activities,and while most of the location codes indicate walking, this activitymay occur at any location, including parks, trails, and even shop-ping malls, as examples.
Time-diary data collection was aided by GPS data to enhancethe accuracy of start times and end times of each walking episode,whether for transport or recreation, with the data used to computethe time duration of each episode. TransCAD�, a geographic infor-mation system (GIS) for solving transportation problems, was usedto compute a network-based shortest-path (i.e. Manhattan) dis-tance between the GPS-derived origin and destination of eachwalking episode. Walkable roads and trails comprised the ‘‘walk-ing’’ network used to complete this task.1 Episode speed was com-puted by dividing network distance by time duration. While most ATwalks in the STAR data are defined as single-episode trips, from onestationary location to another, the coding protocol and GPS softwareused a one-min temporal resolution, which precluded direct mea-surement of travel distances and speeds for many sequential travel
1 The network data were obtained from DMTI™ Spatial Inc.’s CanMap� RouteLogistics GIS data product, Version 2008.3.
location (STL) travel episodes (multi-modal travel episode chains).As an example, a respondent might be driven to work by his/herspouse, but walk the final few blocks. If the respondent was not sta-tionary at the drop-off point for more than 1 min, the location of thedrop-off point was often not captured by the GPS or the interviewer.Most of these intermediate locations would be bus stops and parkinglots, and in most travel surveys these data would not exist at all. Ofthe 3810 AT-walking travel episodes in the STAR dataset, 883 (or23.2%) were identified as STL travel episodes, and were excludedfrom the analysis. In addition to STL travel episodes, there are alsoa number of ‘‘round-trip episodes’’ that were identified, in whichthe origin and destination have the same locational co-ordinates.Again, distances and speeds could not be calculated for these epi-sodes, and they were excluded. Most such travel episodes were rec-reational walks, but 206 AT round-trip episodes were also excluded.A small number of ‘‘apparent’’ AT round-trip episodes show in the ta-bles in this paper: GPS data confirmed these to be valid travel epi-sodes, with different origin and destination co-ordinates (e.g. twobuildings on a college campus), so that distances and speeds couldbe calculated accurately using TransCAD�.
There were also some travel distances, brought to light byexcessive travel speeds, that resulted from inaccuracies in the‘places and locations’ (PAL) database used to geo-code originsand destinations when GPS data were not available to the inter-viewer. The PAL database contains geographic coordinates andstandard industrial classification (SIC) code information for morethan 12,000 non-residential ‘‘locations,’’ but only 91% of these aregeo-coded to the street/civic address. Distance and speed compu-tations for travel episodes to/from the remaining 9% are inherentlyliable to error, but we detected the most egregious errors fromexcessively slow and fast travel speeds. Only travel episodes withspeeds in the following ranges were allowed: walking (AT and rec-reational) = 2–10 km/h, bicycle = 3–30 km/h, car = 3–110 km/h,bus = 3–110 km/h.
3.3. Statistical analysis
Statistical analysis, performed using the Statistical Package forthe Social Sciences (SPSS) version 15.0, was used to characterizeaggregate categories of walking for transport (purposes and desti-nations), and to investigate the significance of differences betweensuch categories. Summary statistics, including measures of bothcentral tendency and dispersion, are used to characterize AT walk-ing, while mean and median values for other travel modes are usedto provide reference. Cross-tabulations of origins and destinationsare used to illustrate the percentage distribution of travel episodes,while mean distances and durations are also illustrated using ori-gin–destination matrices. The percentage distributions of AT walk-ing trips are examined along with mean durations and distancesfor each travel purpose, for destinations based on SIC codes, andfor destination localities (major employment nodes). We also em-ployed simple linear regression to derive time-decay and distance-decay gradients related to key destinations.
4. Results and discussion
4.1. Walking durations
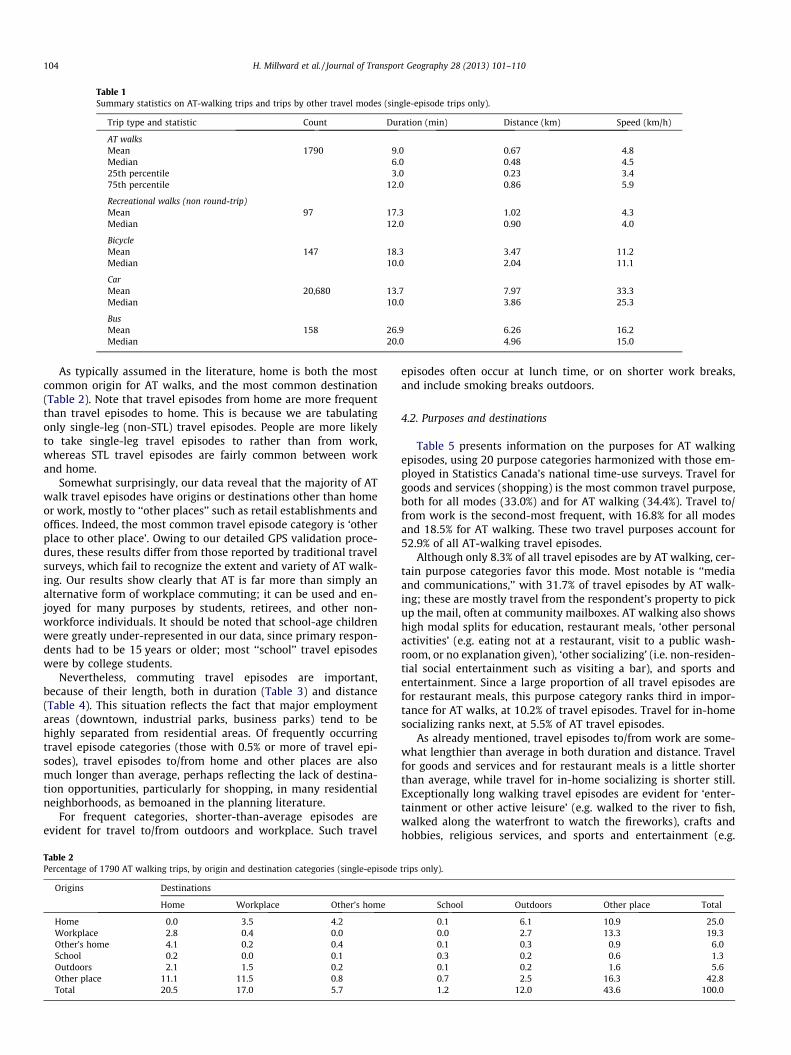
As Table 1 shows, AT walking tends to be somewhat faster thanrecreational walking, as befits its more purposeful nature. ATwalks, however, tend to be shorter in both time and duration, witha median time duration of only six minutes. This is half the dura-tion of recreational walks, or of travel episodes by bicycle andcar, and one third the duration of bus travel episodes.
Table 1Summary statistics on AT-walking trips and trips by other travel modes (single-episode trips only).
Trip type and statistic Count Duration (min) Distance (km) Speed (km/h)
104 H. Millward et al. / Journal of Transport Geography 28 (2013) 101–110
As typically assumed in the literature, home is both the mostcommon origin for AT walks, and the most common destination(Table 2). Note that travel episodes from home are more frequentthan travel episodes to home. This is because we are tabulatingonly single-leg (non-STL) travel episodes. People are more likelyto take single-leg travel episodes to rather than from work,whereas STL travel episodes are fairly common between workand home.
Somewhat surprisingly, our data reveal that the majority of ATwalk travel episodes have origins or destinations other than homeor work, mostly to ‘‘other places’’ such as retail establishments andoffices. Indeed, the most common travel episode category is ‘otherplace to other place’. Owing to our detailed GPS validation proce-dures, these results differ from those reported by traditional travelsurveys, which fail to recognize the extent and variety of AT walk-ing. Our results show clearly that AT is far more than simply analternative form of workplace commuting; it can be used and en-joyed for many purposes by students, retirees, and other non-workforce individuals. It should be noted that school-age childrenwere greatly under-represented in our data, since primary respon-dents had to be 15 years or older; most ‘‘school’’ travel episodeswere by college students.
Nevertheless, commuting travel episodes are important,because of their length, both in duration (Table 3) and distance(Table 4). This situation reflects the fact that major employmentareas (downtown, industrial parks, business parks) tend to behighly separated from residential areas. Of frequently occurringtravel episode categories (those with 0.5% or more of travel epi-sodes), travel episodes to/from home and other places are alsomuch longer than average, perhaps reflecting the lack of destina-tion opportunities, particularly for shopping, in many residentialneighborhoods, as bemoaned in the planning literature.
For frequent categories, shorter-than-average episodes areevident for travel to/from outdoors and workplace. Such travel
Table 2Percentage of 1790 AT walking trips, by origin and destination categories (single-episode
Origins Destinations
Home Workplace Other’s home
Home 0.0 3.5 4.2Workplace 2.8 0.4 0.0Other’s home 4.1 0.2 0.4School 0.2 0.0 0.1Outdoors 2.1 1.5 0.2Other place 11.1 11.5 0.8Total 20.5 17.0 5.7
episodes often occur at lunch time, or on shorter work breaks,and include smoking breaks outdoors.
4.2. Purposes and destinations
Table 5 presents information on the purposes for AT walkingepisodes, using 20 purpose categories harmonized with those em-ployed in Statistics Canada’s national time-use surveys. Travel forgoods and services (shopping) is the most common travel purpose,both for all modes (33.0%) and for AT walking (34.4%). Travel to/from work is the second-most frequent, with 16.8% for all modesand 18.5% for AT walking. These two travel purposes account for52.9% of all AT-walking travel episodes.
Although only 8.3% of all travel episodes are by AT walking, cer-tain purpose categories favor this mode. Most notable is ‘‘mediaand communications,’’ with 31.7% of travel episodes by AT walk-ing; these are mostly travel from the respondent’s property to pickup the mail, often at community mailboxes. AT walking also showshigh modal splits for education, restaurant meals, ‘other personalactivities’ (e.g. eating not at a restaurant, visit to a public wash-room, or no explanation given), ‘other socializing’ (i.e. non-residen-tial social entertainment such as visiting a bar), and sports andentertainment. Since a large proportion of all travel episodes arefor restaurant meals, this purpose category ranks third in impor-tance for AT walks, at 10.2% of travel episodes. Travel for in-homesocializing ranks next, at 5.5% of AT travel episodes.
As already mentioned, travel episodes to/from work are some-what lengthier than average in both duration and distance. Travelfor goods and services and for restaurant meals is a little shorterthan average, while travel for in-home socializing is shorter still.Exceptionally long walking travel episodes are evident for ‘enter-tainment or other active leisure’ (e.g. walked to the river to fish,walked along the waterfront to watch the fireworks), crafts andhobbies, religious services, and sports and entertainment (e.g.
During Work 5.2 6.4 4.0 10.4 0.83To or from work 16.8 9.2 18.5 10.8 0.84For domestic work 2.0 10.1 2.5 7.8 0.62For household child 6.4 3.8 3.0 8.0 0.59For household adults 5.5 0.6 0.4 10.9 0.94For goods and services 33.0 8.7 34.4 8.5 0.62To restaurant meals 4.6 18.6 10.2 7.8 0.55For other personal activities 0.9 17.3 1.8 8.2 0.62For education 1.1 18.9 2.4 9.7 0.77For civic & voluntary activity 3.3 6.8 2.7 6.3 0.46For religious services 1.8 3.5 0.8 14.9 1.12For transportation assistance 4.1 3.8 1.9 5.4 0.45To sports & entertainment 2.0 11.1 2.7 12.5 0.92For in-home socializing 5.2 8.9 5.5 6.9 0.53For other socializing 1.9 12.9 3.0 9.8 0.74For physically active leisure 3.9 7.8 3.7 9.8 0.69For coaching 0.1 0.0 0.0 – –For crafts and hobbies 0.2 2.9 0.1 16.0 1.03For entertaining or other active
leisure1.2 2.3 0.3 24.5 1.88
For media or communication 0.6 31.7 2.2 5.3 0.40Total 100.0 8.3 100.0 9.0 0.67
H. Millward et al. / Journal of Transport Geography 28 (2013) 101–110 105
walked to baseball game, walked to the movie theatre). Exception-ally short travel episodes are recorded for media or communica-tions (to mailbox), transportation assistance (i.e. unpaid helpwith transportation given to friends, neighbors or relatives whodo not live in the respondent’s household), civic and voluntaryactivity, and in-home socializing (often involving visits withfriends and neighbors).
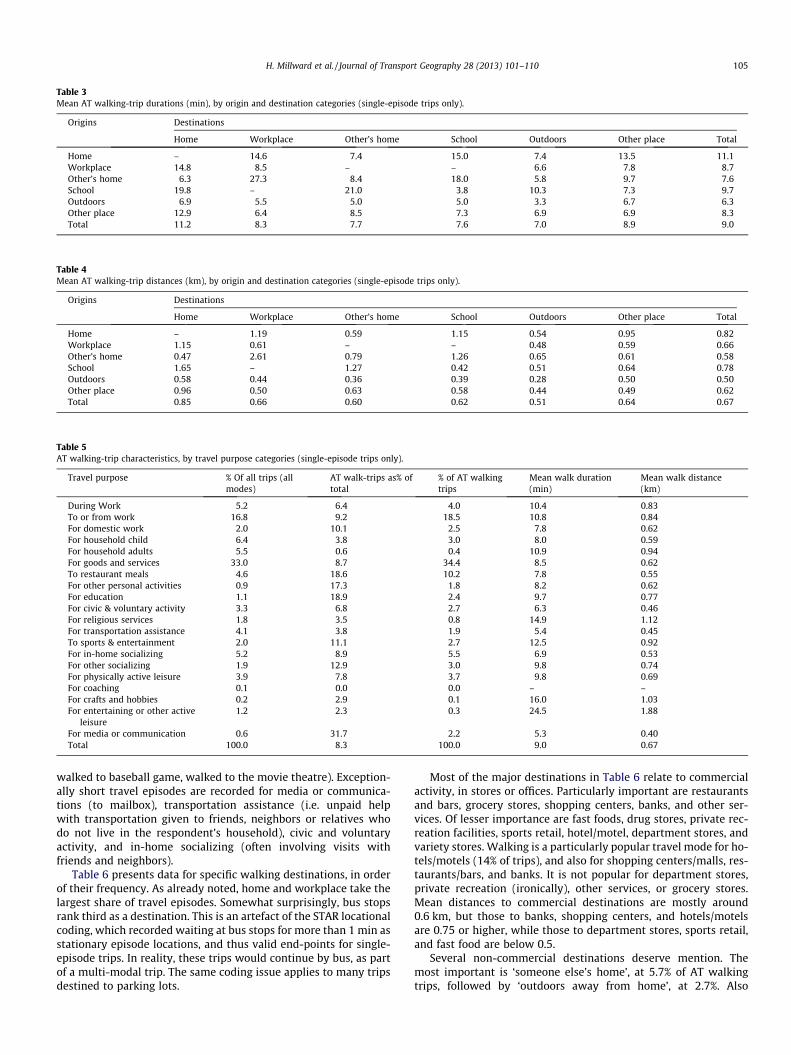
Table 6 presents data for specific walking destinations, in orderof their frequency. As already noted, home and workplace take thelargest share of travel episodes. Somewhat surprisingly, bus stopsrank third as a destination. This is an artefact of the STAR locationalcoding, which recorded waiting at bus stops for more than 1 min asstationary episode locations, and thus valid end-points for single-episode trips. In reality, these trips would continue by bus, as partof a multi-modal trip. The same coding issue applies to many tripsdestined to parking lots.
Most of the major destinations in Table 6 relate to commercialactivity, in stores or offices. Particularly important are restaurantsand bars, grocery stores, shopping centers, banks, and other ser-vices. Of lesser importance are fast foods, drug stores, private rec-reation facilities, sports retail, hotel/motel, department stores, andvariety stores. Walking is a particularly popular travel mode for ho-tels/motels (14% of trips), and also for shopping centers/malls, res-taurants/bars, and banks. It is not popular for department stores,private recreation (ironically), other services, or grocery stores.Mean distances to commercial destinations are mostly around0.6 km, but those to banks, shopping centers, and hotels/motelsare 0.75 or higher, while those to department stores, sports retail,and fast food are below 0.5.
Several non-commercial destinations deserve mention. Themost important is ‘someone else’s home’, at 5.7% of AT walkingtrips, followed by ‘outdoors away from home’, at 2.7%. Also
Table 6AT walking trips, by specific destinations (single-episode trips only).
SIC-based destinations % of AT walking trips (n = 1790) AT walking trips as% of all trips Mean walk duration (min) Mean distance (km)
Total 100.0 8.3 9.0 0.67Respondent’s home 20.8 6.0 11.1 0.84Workplace 17.0 17.2 8.3 0.66Bus stop or ferry terminal 9.1 44.3 7.0 0.51Restaurant or bar 7.8 10.7 7.7 0.52Someone else’s home 5.7 4.8 7.7 0.60Grocery store 5.2 6.7 8.4 0.63Other retail 3.7 7.4 8.1 0.59Shopping center or mall 3.3 12.4 10.6 0.75Outdoors away from home 2.7 20.2 7.5 0.56Bank 2.7 10.7 10.6 0.78School 2.4 8.4 10.4 0.76Other services 2.3 6.3 8.6 0.66College or university 1.6 19.6 7.9 0.66Fast food 1.5 7.1 7.1 0.45Drug store 1.5 9.9 7.4 0.51Government Services 1.3 9.2 10.0 0.78Park or Beach 1.1 11.2 12.0 0.80Place of worship 0.9 5.5 12.6 0.91Private Recreation Facility 0.9 6.0 7.8 0.67Library 0.8 16.3 10.9 0.74Retail Sports and Apparel 0.8 9.5 4.9 0.37Motel or Hotel 0.7 14.0 10.5 0.75Hospital 0.7 7.1 10.3 0.84Department Store 0.6 2.3 5.2 0.36Variety Store 0.6 6.8 8.1 0.50Parking Lot or Structure 0.6 20.0 3.8 0.32Gas Station 0.5 1.8 3.9 0.26Barber or Salon 0.5 9.5 10.2 0.72All Other 2.8 3.3 10.7 0.75
106 H. Millward et al. / Journal of Transport Geography 28 (2013) 101–110
important are schools and college/university. Trips to schools havea particularly long mean distance, so only 8.4% of school trips usethe walking mode. By comparison, almost 20% of trips to college/university employ walking.
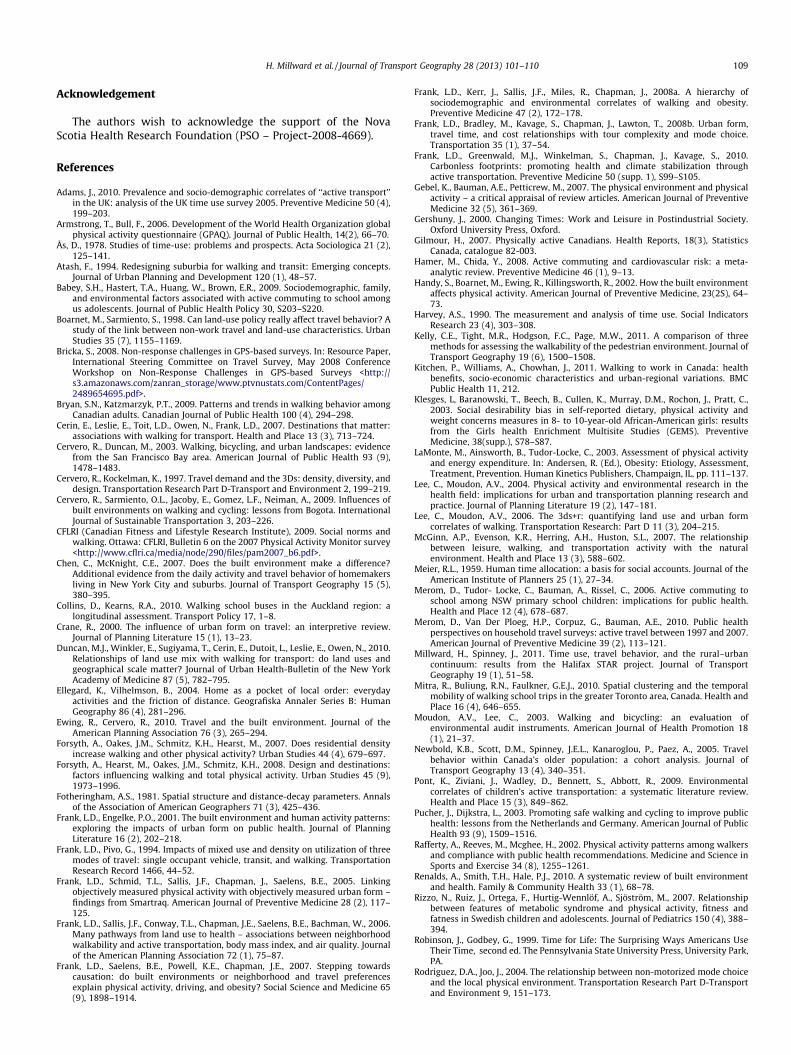
Fig. 1. Location of major employment n
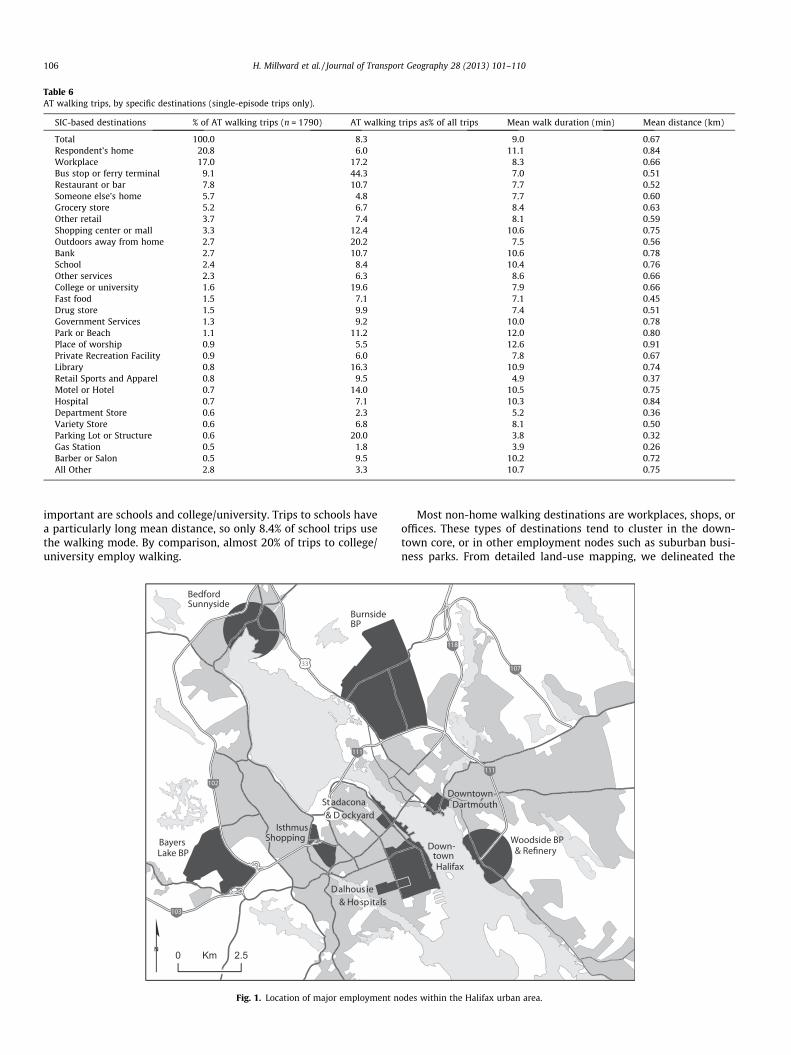
Most non-home walking destinations are workplaces, shops, oroffices. These types of destinations tend to cluster in the down-town core, or in other employment nodes such as suburban busi-ness parks. From detailed land-use mapping, we delineated the
odes within the Halifax urban area.
Table 7AT walking trips, to destinations in major employment nodes (single-episode tripsonly, to non-home destinations).
Major employment node % Of allnon-homeATwalkingtrips(n = 1423)
Burnside business park 1.4 3.4 9.4 0.87Bayers lake business park 1.3 3.2 3.1 0.31Woodside BP and imperial
oil refinery0.8 7.0 10.8 0.98
H. Millward et al. / Journal of Transport Geography 28 (2013) 101–110 107
10 official business parks, the Halifax and Dartmouth downtowndistricts (either side of Halifax Harbor), and six other employmentnodes (three in the inner city and three in the suburbs). Locationsof the major nodes are shown in Fig. 1. As Table 7 shows, downtownHalifax alone takes 42% of AT walks with non-home destinations,and downtown Dartmouth a further 7%. Following these are severalwell-established shopping areas in the inner suburbs, an inner-cityhospital/university district, and an inner-city military district. ATwalking trips take a large share of all trips to the downtown and in-ner-city nodes, and an impressive 38% of trips to downtown Halifax.
The three largest suburban business parks are listed in Table 7,but they generate only a small share of AT walking episodes. Burn-side is a particularly large employment node, with half as manyjobs as downtown Halifax, but its low-density auto/truck orienta-tion is clearly apparent, in that only 3.4% of trips are in the ATwalking mode, compared to 38% downtown. Bayers Lake BusinessPark is primarily a retail power center, where most walking tripsare between adjacent big-box retail outlets, as can be inferred fromthe short mean duration and distance.
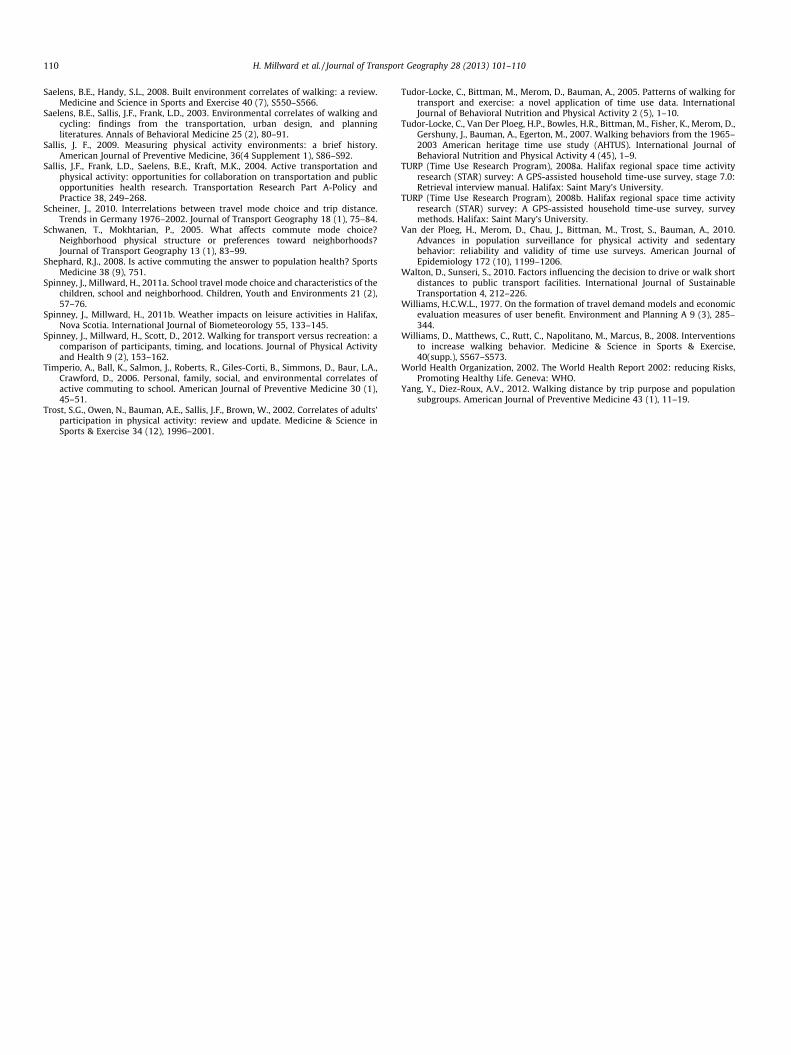
4.3. Distance-decay gradients
As shown earlier, AT walking episodes tend to be short in bothduration and distance. This suggests a strong ‘‘friction of distance’’(Ellegard and Vilhelmson, 2004) effect, in which the propensity towalk declines exponentially with distance and/or time (Fothering-ham, 1981; Williams, 1977). If the distance-decline effects for var-ious destination types are strong and highly predictable, then wehave important evidence that can be subsequently incorporatedinto empirically-derived predictive models of walking behavior.
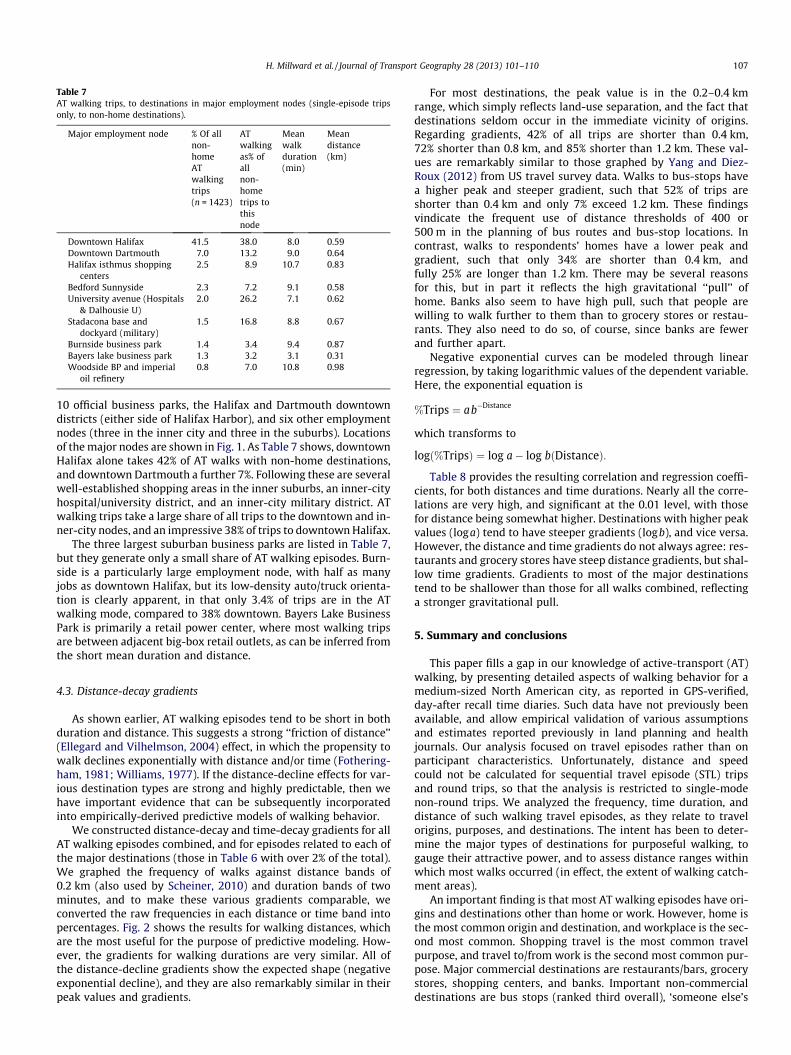
We constructed distance-decay and time-decay gradients for allAT walking episodes combined, and for episodes related to each ofthe major destinations (those in Table 6 with over 2% of the total).We graphed the frequency of walks against distance bands of0.2 km (also used by Scheiner, 2010) and duration bands of twominutes, and to make these various gradients comparable, weconverted the raw frequencies in each distance or time band intopercentages. Fig. 2 shows the results for walking distances, whichare the most useful for the purpose of predictive modeling. How-ever, the gradients for walking durations are very similar. All ofthe distance-decline gradients show the expected shape (negativeexponential decline), and they are also remarkably similar in theirpeak values and gradients.
For most destinations, the peak value is in the 0.2–0.4 kmrange, which simply reflects land-use separation, and the fact thatdestinations seldom occur in the immediate vicinity of origins.Regarding gradients, 42% of all trips are shorter than 0.4 km,72% shorter than 0.8 km, and 85% shorter than 1.2 km. These val-ues are remarkably similar to those graphed by Yang and Diez-Roux (2012) from US travel survey data. Walks to bus-stops havea higher peak and steeper gradient, such that 52% of trips areshorter than 0.4 km and only 7% exceed 1.2 km. These findingsvindicate the frequent use of distance thresholds of 400 or500 m in the planning of bus routes and bus-stop locations. Incontrast, walks to respondents’ homes have a lower peak andgradient, such that only 34% are shorter than 0.4 km, andfully 25% are longer than 1.2 km. There may be several reasonsfor this, but in part it reflects the high gravitational ‘‘pull’’ ofhome. Banks also seem to have high pull, such that people arewilling to walk further to them than to grocery stores or restau-rants. They also need to do so, of course, since banks are fewerand further apart.
Negative exponential curves can be modeled through linearregression, by taking logarithmic values of the dependent variable.Here, the exponential equation is
%Trips ¼ ab�Distance
which transforms to
logð%TripsÞ ¼ log a� log bðDistanceÞ:
Table 8 provides the resulting correlation and regression coeffi-cients, for both distances and time durations. Nearly all the corre-lations are very high, and significant at the 0.01 level, with thosefor distance being somewhat higher. Destinations with higher peakvalues (loga) tend to have steeper gradients (logb), and vice versa.However, the distance and time gradients do not always agree: res-taurants and grocery stores have steep distance gradients, but shal-low time gradients. Gradients to most of the major destinationstend to be shallower than those for all walks combined, reflectinga stronger gravitational pull.
5. Summary and conclusions
This paper fills a gap in our knowledge of active-transport (AT)walking, by presenting detailed aspects of walking behavior for amedium-sized North American city, as reported in GPS-verified,day-after recall time diaries. Such data have not previously beenavailable, and allow empirical validation of various assumptionsand estimates reported previously in land planning and healthjournals. Our analysis focused on travel episodes rather than onparticipant characteristics. Unfortunately, distance and speedcould not be calculated for sequential travel episode (STL) tripsand round trips, so that the analysis is restricted to single-modenon-round trips. We analyzed the frequency, time duration, anddistance of such walking travel episodes, as they relate to travelorigins, purposes, and destinations. The intent has been to deter-mine the major types of destinations for purposeful walking, togauge their attractive power, and to assess distance ranges withinwhich most walks occurred (in effect, the extent of walking catch-ment areas).
An important finding is that most AT walking episodes have ori-gins and destinations other than home or work. However, home isthe most common origin and destination, and workplace is the sec-ond most common. Shopping travel is the most common travelpurpose, and travel to/from work is the second most common pur-pose. Major commercial destinations are restaurants/bars, grocerystores, shopping centers, and banks. Important non-commercialdestinations are bus stops (ranked third overall), ‘someone else’s
Fig. 2. Distance-decay gradients for major AT-walking destinations.
Table 8Linear regressions: percentage of AT walking trips to destination (Y) against distance/duration (X).a
Major destinations X = distance (km) X = time duration (min)
r Coeff.b Peak log a Slope log b r Coeff. c Peak log a Slope log b
All destinations .99 1.456 �.643 .94 1.282 �.048Respondent’s home .95 1.359 �.519 .91 1.193 �.037All workplaces .92 1.328 �.543 .88 1.111 �.039School .85 1.248 �.401 .57 1.014 �.020Bus stop or ferry terminal .91 1.351 �.569 .88 1.277 �.052Restaurant or bar .93 1.427 �.652 .81 1.035 �.032Grocery store .96 1.458 �.614 .80 1.078 �.028Bank .81 1.343 �.355 .39 0.987 �.010
a Note: Y = a b�X and logY = loga � logb(X).b All significant at a = .01.c All significant at a = .01, except School at .04 and Bank at .21.
108 H. Millward et al. / Journal of Transport Geography 28 (2013) 101–110
home’, ‘outdoors away from home’, school, and college/university.All major destinations show strong and highly predictabledistance-decay and time-decay effects, which can be modeled asnegative-exponential equations. These distance and time gradientsdemonstrate that most walks are quite short (typically less than600 m) and very few walks exceed 1200 m.
Given the desire to accommodate walkers of varying ages andabilities when planning the location of facilities such as bus stops,the oft-used walking range of 400 m (Atash, 1994) is partially vin-dicated. Also, the assumption frequently employed in the walkabil-ity literature (and specifically in the widely-used ‘‘walkabilityindex’’), that one should restrict the ‘neighborhood of opportunity’to walking destinations within 1000 m of the home, is seen to bewell justified. However, a planning policy focus on the walker’s
home neighborhood is revealed as questionable, since the majorityof walking trips do not originate from the home. Our results there-fore suggest that some re-thinking may be required regarding therelationship between urban land-use patterns and walkability.Planners concerned with increasing AT walking opportunitiesand walking’s mode share should recognize the importance ofnon-home trips, and encourage opportunities for them. This paperdemonstrates that we are now in a position to construct empiri-cally-derived predictive models of walking behavior. Such modelswill be more conceptually sound than existing predictive toolssuch as the walkability index, and can be tailored to focus onspecific destinations or destination-categories, or to predict totalAT-walking activity around a home, workplace, or other originlocation.
H. Millward et al. / Journal of Transport Geography 28 (2013) 101–110 109
Acknowledgement
The authors wish to acknowledge the support of the NovaScotia Health Research Foundation (PSO – Project-2008-4669).
References
Adams, J., 2010. Prevalence and socio-demographic correlates of ‘‘active transport’’in the UK: analysis of the UK time use survey 2005. Preventive Medicine 50 (4),199–203.
Armstrong, T., Bull, F., 2006. Development of the World Health Organization globalphysical activity questionnaire (GPAQ). Journal of Public Health, 14(2), 66–70.
Ås, D., 1978. Studies of time-use: problems and prospects. Acta Sociologica 21 (2),125–141.
Atash, F., 1994. Redesigning suburbia for walking and transit: Emerging concepts.Journal of Urban Planning and Development 120 (1), 48–57.
Babey, S.H., Hastert, T.A., Huang, W., Brown, E.R., 2009. Sociodemographic, family,and environmental factors associated with active commuting to school amongus adolescents. Journal of Public Health Policy 30, S203–S220.
Boarnet, M., Sarmiento, S., 1998. Can land-use policy really affect travel behavior? Astudy of the link between non-work travel and land-use characteristics. UrbanStudies 35 (7), 1155–1169.
Bricka, S., 2008. Non-response challenges in GPS-based surveys. In: Resource Paper,International Steering Committee on Travel Survey, May 2008 ConferenceWorkshop on Non-Response Challenges in GPS-based Surveys <http://s3.amazonaws.com/zanran_storage/www.ptvnustats.com/ContentPages/2489654695.pdf>.
Bryan, S.N., Katzmarzyk, P.T., 2009. Patterns and trends in walking behavior amongCanadian adults. Canadian Journal of Public Health 100 (4), 294–298.
Cerin, E., Leslie, E., Toit, L.D., Owen, N., Frank, L.D., 2007. Destinations that matter:associations with walking for transport. Health and Place 13 (3), 713–724.
Cervero, R., Duncan, M., 2003. Walking, bicycling, and urban landscapes: evidencefrom the San Francisco Bay area. American Journal of Public Health 93 (9),1478–1483.
Cervero, R., Kockelman, K., 1997. Travel demand and the 3Ds: density, diversity, anddesign. Transportation Research Part D-Transport and Environment 2, 199–219.
Cervero, R., Sarmiento, O.L., Jacoby, E., Gomez, L.F., Neiman, A., 2009. Influences ofbuilt environments on walking and cycling: lessons from Bogota. InternationalJournal of Sustainable Transportation 3, 203–226.
CFLRI (Canadian Fitness and Lifestyle Research Institute), 2009. Social norms andwalking. Ottawa: CFLRI, Bulletin 6 on the 2007 Physical Activity Monitor survey<http://www.cflri.ca/media/node/290/files/pam2007_b6.pdf>.
Chen, C., McKnight, C.E., 2007. Does the built environment make a difference?Additional evidence from the daily activity and travel behavior of homemakersliving in New York City and suburbs. Journal of Transport Geography 15 (5),380–395.
Collins, D., Kearns, R.A., 2010. Walking school buses in the Auckland region: alongitudinal assessment. Transport Policy 17, 1–8.
Crane, R., 2000. The influence of urban form on travel: an interpretive review.Journal of Planning Literature 15 (1), 13–23.
Duncan, M.J., Winkler, E., Sugiyama, T., Cerin, E., Dutoit, L., Leslie, E., Owen, N., 2010.Relationships of land use mix with walking for transport: do land uses andgeographical scale matter? Journal of Urban Health-Bulletin of the New YorkAcademy of Medicine 87 (5), 782–795.
Ellegard, K., Vilhelmson, B., 2004. Home as a pocket of local order: everydayactivities and the friction of distance. Geografiska Annaler Series B: HumanGeography 86 (4), 281–296.
Ewing, R., Cervero, R., 2010. Travel and the built environment. Journal of theAmerican Planning Association 76 (3), 265–294.
Forsyth, A., Oakes, J.M., Schmitz, K.H., Hearst, M., 2007. Does residential densityincrease walking and other physical activity? Urban Studies 44 (4), 679–697.
Forsyth, A., Hearst, M., Oakes, J.M., Schmitz, K.H., 2008. Design and destinations:factors influencing walking and total physical activity. Urban Studies 45 (9),1973–1996.
Fotheringham, A.S., 1981. Spatial structure and distance-decay parameters. Annalsof the Association of American Geographers 71 (3), 425–436.
Frank, L.D., Engelke, P.O., 2001. The built environment and human activity patterns:exploring the impacts of urban form on public health. Journal of PlanningLiterature 16 (2), 202–218.
Frank, L.D., Pivo, G., 1994. Impacts of mixed use and density on utilization of threemodes of travel: single occupant vehicle, transit, and walking. TransportationResearch Record 1466, 44–52.
Frank, L.D., Schmid, T.L., Sallis, J.F., Chapman, J., Saelens, B.E., 2005. Linkingobjectively measured physical activity with objectively measured urban form –findings from Smartraq. American Journal of Preventive Medicine 28 (2), 117–125.
Frank, L.D., Sallis, J.F., Conway, T.L., Chapman, J.E., Saelens, B.E., Bachman, W., 2006.Many pathways from land use to health – associations between neighborhoodwalkability and active transportation, body mass index, and air quality. Journalof the American Planning Association 72 (1), 75–87.
Frank, L.D., Saelens, B.E., Powell, K.E., Chapman, J.E., 2007. Stepping towardscausation: do built environments or neighborhood and travel preferencesexplain physical activity, driving, and obesity? Social Science and Medicine 65(9), 1898–1914.
Frank, L.D., Kerr, J., Sallis, J.F., Miles, R., Chapman, J., 2008a. A hierarchy ofsociodemographic and environmental correlates of walking and obesity.Preventive Medicine 47 (2), 172–178.
Frank, L.D., Bradley, M., Kavage, S., Chapman, J., Lawton, T., 2008b. Urban form,travel time, and cost relationships with tour complexity and mode choice.Transportation 35 (1), 37–54.
Frank, L.D., Greenwald, M.J., Winkelman, S., Chapman, J., Kavage, S., 2010.Carbonless footprints: promoting health and climate stabilization throughactive transportation. Preventive Medicine 50 (supp. 1), S99–S105.
Gebel, K., Bauman, A.E., Petticrew, M., 2007. The physical environment and physicalactivity – a critical appraisal of review articles. American Journal of PreventiveMedicine 32 (5), 361–369.
Gershuny, J., 2000. Changing Times: Work and Leisure in Postindustrial Society.Oxford University Press, Oxford.
Gilmour, H., 2007. Physically active Canadians. Health Reports, 18(3), StatisticsCanada, catalogue 82-003.
Hamer, M., Chida, Y., 2008. Active commuting and cardiovascular risk: a meta-analytic review. Preventive Medicine 46 (1), 9–13.
Handy, S., Boarnet, M., Ewing, R., Killingsworth, R., 2002. How the built environmentaffects physical activity. American Journal of Preventive Medicine, 23(2S), 64–73.
Harvey, A.S., 1990. The measurement and analysis of time use. Social IndicatorsResearch 23 (4), 303–308.
Kelly, C.E., Tight, M.R., Hodgson, F.C., Page, M.W., 2011. A comparison of threemethods for assessing the walkability of the pedestrian environment. Journal ofTransport Geography 19 (6), 1500–1508.
Kitchen, P., Williams, A., Chowhan, J., 2011. Walking to work in Canada: healthbenefits, socio-economic characteristics and urban-regional variations. BMCPublic Health 11, 212.
Klesges, L, Baranowski, T., Beech, B., Cullen, K., Murray, D.M., Rochon, J., Pratt, C.,2003. Social desirability bias in self-reported dietary, physical activity andweight concerns measures in 8- to 10-year-old African-American girls: resultsfrom the Girls health Enrichment Multisite Studies (GEMS). PreventiveMedicine, 38(supp.), S78–S87.
LaMonte, M., Ainsworth, B., Tudor-Locke, C., 2003. Assessment of physical activityand energy expenditure. In: Andersen, R. (Ed.), Obesity: Etiology, Assessment,Treatment, Prevention. Human Kinetics Publishers, Champaign, IL, pp. 111–137.
Lee, C., Moudon, A.V., 2004. Physical activity and environmental research in thehealth field: implications for urban and transportation planning research andpractice. Journal of Planning Literature 19 (2), 147–181.
Lee, C., Moudon, A.V., 2006. The 3ds+r: quantifying land use and urban formcorrelates of walking. Transportation Research: Part D 11 (3), 204–215.
McGinn, A.P., Evenson, K.R., Herring, A.H., Huston, S.L., 2007. The relationshipbetween leisure, walking, and transportation activity with the naturalenvironment. Health and Place 13 (3), 588–602.
Meier, R.L., 1959. Human time allocation: a basis for social accounts. Journal of theAmerican Institute of Planners 25 (1), 27–34.
Merom, D., Tudor- Locke, C., Bauman, A., Rissel, C., 2006. Active commuting toschool among NSW primary school children: implications for public health.Health and Place 12 (4), 678–687.
Merom, D., Van Der Ploeg, H.P., Corpuz, G., Bauman, A.E., 2010. Public healthperspectives on household travel surveys: active travel between 1997 and 2007.American Journal of Preventive Medicine 39 (2), 113–121.
Millward, H., Spinney, J., 2011. Time use, travel behavior, and the rural–urbancontinuum: results from the Halifax STAR project. Journal of TransportGeography 19 (1), 51–58.
Mitra, R., Buliung, R.N., Faulkner, G.E.J., 2010. Spatial clustering and the temporalmobility of walking school trips in the greater Toronto area, Canada. Health andPlace 16 (4), 646–655.
Moudon, A.V., Lee, C., 2003. Walking and bicycling: an evaluation ofenvironmental audit instruments. American Journal of Health Promotion 18(1), 21–37.
Newbold, K.B., Scott, D.M., Spinney, J.E.L., Kanaroglou, P., Paez, A., 2005. Travelbehavior within Canada’s older population: a cohort analysis. Journal ofTransport Geography 13 (4), 340–351.
Pont, K., Ziviani, J., Wadley, D., Bennett, S., Abbott, R., 2009. Environmentalcorrelates of children’s active transportation: a systematic literature review.Health and Place 15 (3), 849–862.
Pucher, J., Dijkstra, L., 2003. Promoting safe walking and cycling to improve publichealth: lessons from the Netherlands and Germany. American Journal of PublicHealth 93 (9), 1509–1516.
Rafferty, A., Reeves, M., Mcghee, H., 2002. Physical activity patterns among walkersand compliance with public health recommendations. Medicine and Science inSports and Exercise 34 (8), 1255–1261.
Renalds, A., Smith, T.H., Hale, P.J., 2010. A systematic review of built environmentand health. Family & Community Health 33 (1), 68–78.
Rizzo, N., Ruiz, J., Ortega, F., Hurtig-Wennlöf, A., Sjöström, M., 2007. Relationshipbetween features of metabolic syndrome and physical activity, fitness andfatness in Swedish children and adolescents. Journal of Pediatrics 150 (4), 388–394.
Robinson, J., Godbey, G., 1999. Time for Life: The Surprising Ways Americans UseTheir Time, second ed. The Pennsylvania State University Press, University Park,PA.
Rodriguez, D.A., Joo, J., 2004. The relationship between non-motorized mode choiceand the local physical environment. Transportation Research Part D-Transportand Environment 9, 151–173.
110 H. Millward et al. / Journal of Transport Geography 28 (2013) 101–110
Saelens, B.E., Handy, S.L., 2008. Built environment correlates of walking: a review.Medicine and Science in Sports and Exercise 40 (7), S550–S566.
Saelens, B.E., Sallis, J.F., Frank, L.D., 2003. Environmental correlates of walking andcycling: findings from the transportation, urban design, and planningliteratures. Annals of Behavioral Medicine 25 (2), 80–91.
Sallis, J. F., 2009. Measuring physical activity environments: a brief history.American Journal of Preventive Medicine, 36(4 Supplement 1), S86–S92.
Sallis, J.F., Frank, L.D., Saelens, B.E., Kraft, M.K., 2004. Active transportation andphysical activity: opportunities for collaboration on transportation and publicopportunities health research. Transportation Research Part A-Policy andPractice 38, 249–268.
Scheiner, J., 2010. Interrelations between travel mode choice and trip distance.Trends in Germany 1976–2002. Journal of Transport Geography 18 (1), 75–84.
Schwanen, T., Mokhtarian, P., 2005. What affects commute mode choice?Neighborhood physical structure or preferences toward neighborhoods?Journal of Transport Geography 13 (1), 83–99.
Shephard, R.J., 2008. Is active commuting the answer to population health? SportsMedicine 38 (9), 751.
Spinney, J., Millward, H., 2011a. School travel mode choice and characteristics of thechildren, school and neighborhood. Children, Youth and Environments 21 (2),57–76.
Spinney, J., Millward, H., 2011b. Weather impacts on leisure activities in Halifax,Nova Scotia. International Journal of Biometeorology 55, 133–145.
Spinney, J., Millward, H., Scott, D., 2012. Walking for transport versus recreation: acomparison of participants, timing, and locations. Journal of Physical Activityand Health 9 (2), 153–162.
Timperio, A., Ball, K., Salmon, J., Roberts, R., Giles-Corti, B., Simmons, D., Baur, L.A.,Crawford, D., 2006. Personal, family, social, and environmental correlates ofactive commuting to school. American Journal of Preventive Medicine 30 (1),45–51.
Trost, S.G., Owen, N., Bauman, A.E., Sallis, J.F., Brown, W., 2002. Correlates of adults’participation in physical activity: review and update. Medicine & Science inSports & Exercise 34 (12), 1996–2001.
Tudor-Locke, C., Bittman, M., Merom, D., Bauman, A., 2005. Patterns of walking fortransport and exercise: a novel application of time use data. InternationalJournal of Behavioral Nutrition and Physical Activity 2 (5), 1–10.
Tudor-Locke, C., Van Der Ploeg, H.P., Bowles, H.R., Bittman, M., Fisher, K., Merom, D.,Gershuny, J., Bauman, A., Egerton, M., 2007. Walking behaviors from the 1965–2003 American heritage time use study (AHTUS). International Journal ofBehavioral Nutrition and Physical Activity 4 (45), 1–9.
TURP (Time Use Research Program), 2008a. Halifax regional space time activityresearch (STAR) survey: A GPS-assisted household time-use survey, stage 7.0:Retrieval interview manual. Halifax: Saint Mary’s University.
TURP (Time Use Research Program), 2008b. Halifax regional space time activityresearch (STAR) survey: A GPS-assisted household time-use survey, surveymethods. Halifax: Saint Mary’s University.
Van der Ploeg, H., Merom, D., Chau, J., Bittman, M., Trost, S., Bauman, A., 2010.Advances in population surveillance for physical activity and sedentarybehavior: reliability and validity of time use surveys. American Journal ofEpidemiology 172 (10), 1199–1206.
Walton, D., Sunseri, S., 2010. Factors influencing the decision to drive or walk shortdistances to public transport facilities. International Journal of SustainableTransportation 4, 212–226.
Williams, H.C.W.L., 1977. On the formation of travel demand models and economicevaluation measures of user benefit. Environment and Planning A 9 (3), 285–344.
Williams, D., Matthews, C., Rutt, C., Napolitano, M., Marcus, B., 2008. Interventionsto increase walking behavior. Medicine & Science in Sports & Exercise,40(supp.), S567–S573.
World Health Organization, 2002. The World Health Report 2002: reducing Risks,Promoting Healthy Life. Geneva: WHO.
Yang, Y., Diez-Roux, A.V., 2012. Walking distance by trip purpose and populationsubgroups. American Journal of Preventive Medicine 43 (1), 11–19.