Cenozoic environmental change in South America as indicated by mammalian body size distributions (cenograms)
DARIN A. CROFT
Department of Organismal Biology and Anatomy, University of Chicago,
E. 57th Street. Chicago, IL 60637-1508, U.S.A., E-mail: [email protected]
Abstract.
A cenogram is a rank-ordered bodysize distribution of non-predatory terrestrialmammal species within a community. Studies ofcenograms for modern faunas have shown thatcertain quantifiable attributes of cenograms arecorrelated with environmental variables such asrainfall and vegetation structure. Based on thesecorrelations, cenograms of fossil communitieshave been used to infer palaeoenvironments andpalaeoenvironmental variables. The present studyuses cenogram statistics to interpret palaeoenvir-onmental conditions for eight Cenozoic SouthAmerican mammal faunas, ranging from Eoceneto Pleistocene in age. Body sizes for fossil taxawere taken either from the literature or were estim-ated using regressions of body size on molarlength (or femoral bicondylar width) for modernmammals. Cenogram statistics are calculated forthe eight fossil faunas and compared to similarstatistics calculated for 16 modern South American
mammal faunas, allowing palaeoenvironmentalinterpretations to be made. The palaeoenviron-mental interpretations based on cenogram analysessometimes support and sometimes contradictinterpretations based on herbivore craniodentalmorphology (e.g. levels of hypsodonty). Simula-tions of expected errors in body size estimatesfor fossil taxa suggest that the discrepancies donot result primarily from erroneous body sizeestimates. It is possible that some of the incon-gruity in interpretations results from certainnon-analogue attributes of South Americanfaunas during much of the Cenozoic (e.g. therelatively depauperate mammalian predatordiversity prior to the Great American BioticInterchange).
Key words.
Body size distributions, palaeoenvir-onment, South America, island biogeography,predation.
≤
µ
INTRODUCTION
The word ‘cenogram’ was originally coined byValverde (1964) to signify a univariate plot ofvertebrate body sizes within a community,arranged in decreasing rank order. Using ceno-grams with the predator and prey species plottedseparately, Valverde (1964, 1967) examined predator–prey body size relationships within moderncommunities. After examining the structure ofthese cenograms across a wide variety of habitats,Valverde concluded that each class of terrestrialvertebrates constituted a separate subcommunitythat operated nearly independently of the others
and that they could be compared to equivalentsubcommunities from other habitats.
Legendre (1986) extended the use of mamma-lian cenograms (excluding bats and predatorymammals) into the fossil record. He demon-strated that cenogram shape tends to vary in apredictable way with certain environmental char-acteristics in modern communities and suggestedthat palaeocommunity cenograms should indic-ate palaeoenvironmental conditions. He illus-trated this by studying cenograms for asuccession of mammal faunas from the phos-phate mines of Quercy, France (Legendre, 1986).Legendre demonstrated that a shift in cenogram
DDI_117.fm Page 271 Thursday, October 25, 2001 9:02 PM
shape coincided with the major faunal turnoverevent at the ‘Grande Coupure’, suggesting thatthe global transition to cooler, drier conditionswas evident in the changing body size structureof the European mammalian palaeocommunities.
Since Legendre’s first application of cenogramsto the fossil record, other studies have used ceno-grams to interpret palaeohabitats throughoutthe Cenozoic (Gingerich, 1989; de Bonis
, 1998).Few of these studies have dealt with SouthernHemisphere localities, and none has includedpalaeocommunities from South America. Recentneontological studies have examined body sizefrequency distributions for both North and SouthAmerican mammals (Holling, 1992; Marquet &Cofré, 1999), but these have primarily beenconcerned with the shape of the distributionsthemselves rather than how certain attributes ofthe distributions vary consistently with environ-mental variables.
The present study uses cenograms to interpretpalaeoenvironmental conditions for some of thebest-known South American fossil mammalassemblages. These interpretations are then com-pared to more traditional interpretations (based onherbivore craniodental and postcranial adapta-tions) to judge congruence between the differentmethods of palaeoenvironmental reconstruction.
MATERIALS AND METHODS
Fossil faunal lists
Although constructing cenograms for moderncommunities is relatively straightforward, con-structing accurate cenograms for fossil localitiesis much more difficult. This is especially true inSouth America, owing to the lack of precisestratigraphic and geographical information formany classic fossil-bearing localities and the oftenexaggerated diversity of the many fossil groups inneed of taxonomic revision. Of the large numberof fossil faunas in South America, eight werechosen as most likely to be reliable based onthe following characteristics: (a) there should be arestricted time interval represented, (b) they shouldbe collected from a restricted geographical area,(c) there should be a high sampling intensity,and (d) there should be availability of up-to-date
taxonomic information. These represent assem-blages from seven fossil localities (one with twofaunal zones) ranging from ?middle/late Eoceneto late Pleistocene in age (Table 1). Where possible,only specific stratigraphic levels at each localitywere used (i.e. rather than all levels within afossiliferous unit) to minimize problems associatedwith time-averaging of deposits. Such time-averagingmay obscure or alter patterns in cenogram curves.In certain instances, published faunal lists wereupdated using data from more recent publicationsor from personal observations. A complete list ofthe included taxa can be found in Croft (2000) orcan be obtained electronically by request fromthe author.
Body mass data and estimations
An entire book (Damuth & MacFadden, 1990) hasbeen written on the challenges associated withestimating body masses from mammalian osteo-logical remains. Most studies using cenograms haveregressed body size on molar measurements inextant mammals to estimate body masses forfossil taxa. This method works reasonably wellfor most animals, especially when the reference database used to calculate the regressions includesspecies that are either closely related to or mor-phologically similar to the extinct animal in ques-tion (Legendre, 1986; Janis, 1990). With teeth beingthe most commonly fossilized and easily identifiablepart of a mammal, basing estimates on dentalremains has the added benefit of being widelyapplicable.
In South America, however, many fossil mammaltaxa are endemic to the continent and have eitherno living descendants or only morphologicallydissimilar ones (e.g. notoungulates, litopterns,ground sloths and glyptodonts; Patterson &Pascual, 1972; Simpson, 1980; Cifelli, 1985b; Flynn& Wyss, 1998). Accordingly, it is more difficult toaccurately estimate body masses for these taxausing only dental remains. Therefore, wheneverpossible (for approximately 40% of included spe-cies), mass estimates for specific fossil taxa weretaken directly from the literature; it was assumedthat these estimates would be more accurate thanthose calculated by single regressions since mostof these articles are authored by specialists onthe groups in question and incorporate data frompostcranial remains or complete skeletons. For
DDI_117.fm Page 272 Thursday, October 25, 2001 9:02 PM
most of the remaining taxa (approximately 55%of included species), masses were predicted usingregressions of body mass on molar length cal-culated for recent mammals (see Croft, 2000).Molar length was used instead of area becauselength values tend to be more highly correlatedwith body mass in living ungulates (Janis, 1990).Body masses for extant mammals were takenfrom Olrog & Lucero (1980), Mares
et al
. (1989),Hayssen (1993), Emmons (1997) and issues of
Mammalian Species
.For fossil ground sloths, some mass data were
taken from the literature, but in most casesmasses were estimated using a regression equa-tion of body mass on bicondylar width of thefemur. A postcranial measure was used for thisgroup instead of a dental measure because dentalregressions are not appropriate for estimatingbody size in xenarthrans; dental homologieswithin the group are unclear and many xenar-thrans have significantly reduced and/or homo-dont dentitions (Fariña
et al.
, 1998). Bicondylarwidth of the femur was chosen because femoraldimensions are usually highly correlated withbody mass (Scott, 1990; Fariña
et al.
, 1998) andbecause, among fossilized postcranial bones,distal femora are common. Additionally, thefemoral condyles in ground sloths do not showthe extreme enlargement evident in the shaft ofthe bone, which often leads to overestimates ofbody mass (Fariña
et al.
, 1998).Because there are no extant ground sloths, the
bicondylar regression was calculated using bodymass estimates for extinct ground sloths takenfrom the literature (Fariña
et al.
, 1998; personalcommunication with R. Fariña and S. Vizcaíno).Although this is mathematically tenuous — usingestimated masses to estimate other masses — theresulting ground sloth mass estimates are likelyto be much more accurate (see below) than thosewhich would have resulted using only extantmammals, such as tree sloths and/or bears (theextant mammals that are most closely related to,or probably most similar in proportion to, extinctground sloths, respectively). This is demonstratedin Table 2, which compares ground sloth massestimates collected from the literature to thosecalculated using various regressions of body masson bicondylar width of the femur in extant mam-mals. Although mass estimates from regressions forsome of the large ground sloths are close to those
Tab
le 1
Geo
grap
hic
and
stra
tigr
aphi
c da
ta f
or S
outh
Am
eric
an f
ossi
l m
amm
al l
ocal
itie
s us
ed i
n ce
nogr
am a
naly
ses.
SA
LM
A =
Sou
th A
mer
ican
Lan
dM
amm
al ‘A
ge’
Lis
tSA
LM
AA
geSt
rati
grap
hic
leve
lL
ocal
ity
Sour
ce
1C
asam
ayor
an?L
ate
Eoc
ene
Bar
ranc
anG
ran
Bar
ranc
a, A
rgen
tina
Cif
elli
(198
5a)
2T
ingu
irir
ican
?Lat
e E
ocen
e —
Ear
ly O
ligoc
ene
Not
app
licab
leT
erm
as d
el F
laco
, C
hile
Wys
s
et a
l.
, 19
94;
Fly
nn &
Wys
s (1
999)
; H
itz
et a
l
., 20
00;
J.J.
Fly
nn
et a
l
., un
publ
ishe
d3
Des
eada
nL
ate
Olig
ocen
eN
ot a
vaila
ble
Salla
, B
oliv
iaM
acF
adde
n
et a
l
. (1
985)
; Sh
ocke
y, 1
997
4Sa
ntac
ruci
anE
arly
to
mid
dle
Mio
cene
Pro
typo
ther
ium
att
enua
tum
Zon
eSa
nta
Cru
z, A
rgen
tina
Tau
ber,
199
7a5
Sant
acru
cian
Ear
ly t
o m
iddl
e M
ioce
ne
Pro
typo
ther
ium
aus
tral
e
Zon
eSa
nta
Cru
z, A
rgen
tina
Tau
ber,
199
7a6
Lav
enta
nL
ate
mid
dle
Mio
cene
Mon
key
Bed
sL
a V
enta
, C
olom
bia
Kay
& M
adde
n, 1
997b
7E
nsen
adan
Mid
dle
Ple
isto
cene
Not
app
licab
leT
arija
, B
oliv
iaH
offs
tett
er (
1963
);
Mac
Fad
den
& S
hock
ey (
1997
)8
Luj
ania
nL
ate
Ple
isto
cene
Not
app
licab
leL
uján
Loc
al F
auna
, A
rgen
tina
Ton
ni
et a
l
. (1
985)
DDI_117.fm Page 273 Thursday, October 25, 2001 9:02 PM
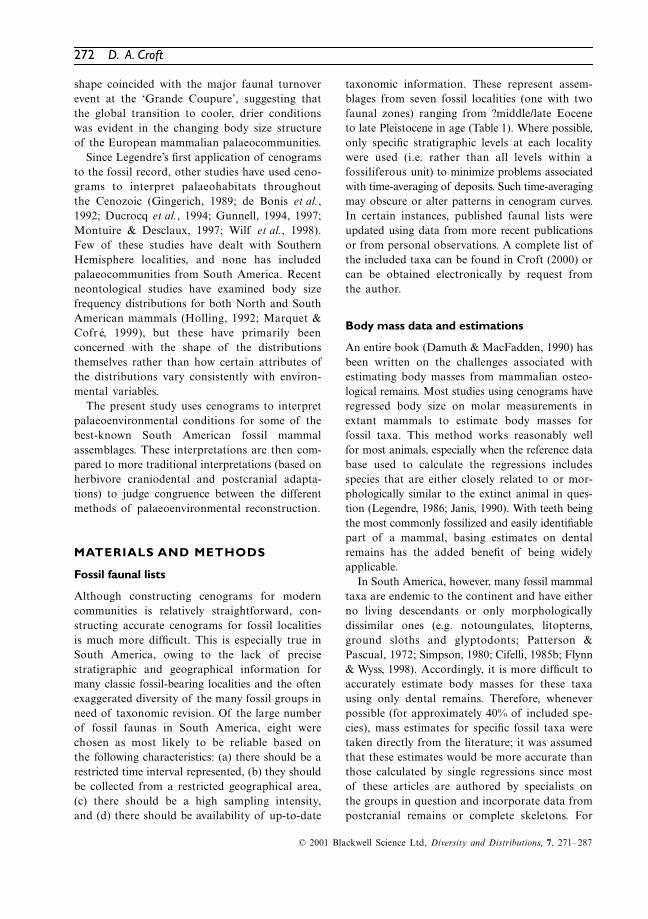
. (1998), other largeground sloth estimates are two to three times larger.Additionally, the mass estimates from regressionfor the smaller sloth taxon,
Hapalops
longiceps
, arefour to six times larger than estimates collectedfrom the literature. It is quite possible that thistendency to overestimate sloth body masses whenusing data from extant bears stems from peculi-arities of the ground sloth hindlimb and loco-motor patterns (Bargo & Vizcaíno, 1997).
Masses for cingulates (glyptodonts and arma-dillos) were either taken from the literature orestimated based on comparisons of carapace sizewith extant armadillos. Carapace size was usedfor the estimations rather than some other factorbecause: (a) cingulates are relatively uniform intheir overall morphology (i.e. there are noextreme deviations in the size of the head or thelimbs in proportion to the rest of the body, withthe exception of the large tail clubs present insome glyptodonts); (b) the carapace representsthe external limits of the majority of the body(all except the head and portions of the limbs),and therefore is approximately equal to thevolume of the animal (which is proportional tomass); (c) the relative proportion of carapacemass to non-carapace mass should be the samebetween animals of similar size (this attribute ofcingulates makes their mass difficult to estimatewhen compared to other animals without signi-ficant dermal armour); and (d) the carapace (ora portion of the carapace) is the most commonly
recovered element from cingulates. This methodalso was used by Kay & Madden (1997b) fortheir body mass estimates of cingulates.
Comparisons with recent faunas
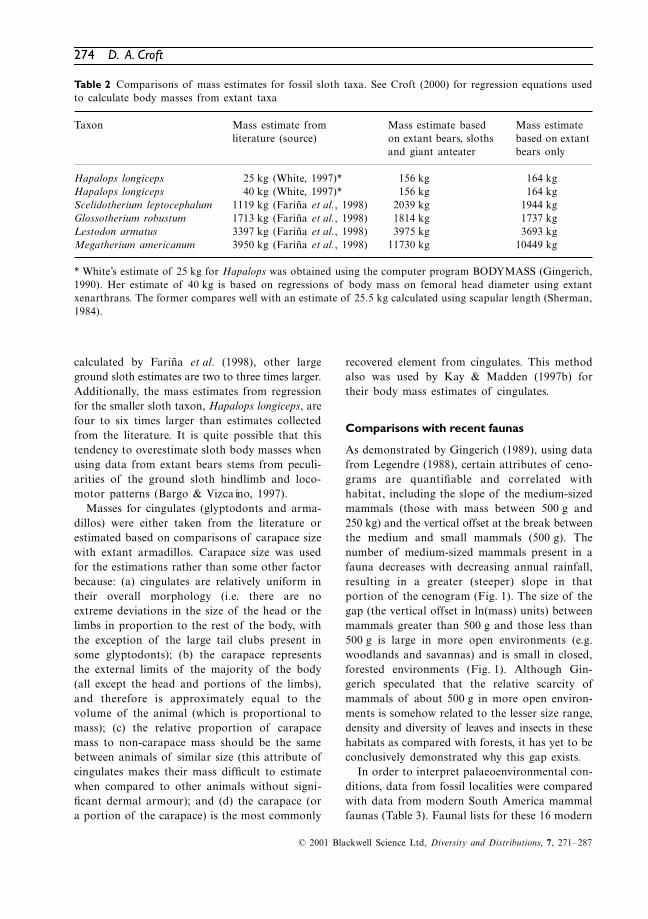
As demonstrated by Gingerich (1989), using datafrom Legendre (1988), certain attributes of ceno-grams are quantifiable and correlated withhabitat, including the slope of the medium-sizedmammals (those with mass between 500 g and250 kg) and the vertical offset at the break betweenthe medium and small mammals (500 g). Thenumber of medium-sized mammals present in afauna decreases with decreasing annual rainfall,resulting in a greater (steeper) slope in thatportion of the cenogram (Fig. 1). The size of thegap (the vertical offset in ln(mass) units) betweenmammals greater than 500 g and those less than500 g is large in more open environments (e.g.woodlands and savannas) and is small in closed,forested environments (Fig. 1). Although Gin-gerich speculated that the relative scarcity ofmammals of about 500 g in more open environ-ments is somehow related to the lesser size range,density and diversity of leaves and insects in thesehabitats as compared with forests, it has yet to beconclusively demonstrated why this gap exists.
In order to interpret palaeoenvironmental con-ditions, data from fossil localities were comparedwith data from modern South America mammalfaunas (Table 3). Faunal lists for these 16 modern
Table 2 Comparisons of mass estimates for fossil sloth taxa. See Croft (2000) for regression equations usedto calculate body masses from extant taxa
Taxon Mass estimate from literature (source)
Mass estimate based on extant bears, sloths and giant anteater
Mass estimate based on extant bears only
Hapalops longiceps 25 kg (White, 1997)* 156 kg 164 kgHapalops longiceps 40 kg (White, 1997)* 156 kg 164 kgScelidotherium leptocephalum 1119 kg (Fariña et al., 1998) 2039 kg 1944 kgGlossotherium robustum 1713 kg (Fariña et al., 1998) 1814 kg 1737 kgLestodon armatus 3397 kg (Fariña et al., 1998) 3975 kg 3693 kgMegatherium americanum 3950 kg (Fariña et al., 1998) 11730 kg 10449 kg
* White’s estimate of 25 kg for Hapalops was obtained using the computer program BODYMASS (Gingerich,1990). Her estimate of 40 kg is based on regressions of body mass on femoral head diameter using extantxenarthrans. The former compares well with an estimate of 25.5 kg calculated using scapular length (Sherman,1984).
DDI_117.fm Page 274 Thursday, October 25, 2001 9:02 PM
Fig. 1 Examples of cenogram plots for a moist forest (left) and an open desert (right). Note that high speciesdiversity results in a shallow slope (left) while low species diversity results in a steep slope (right). Also notethe lack of an obvious vertical offset at 500 g in the closed environment (left) and the presence of a markedvertical offset at 500 g in the open environment (right). Forest data are from Makokou, Gabon, and desertdata are from Monte Desert, Argentina (Legendre, 1988).
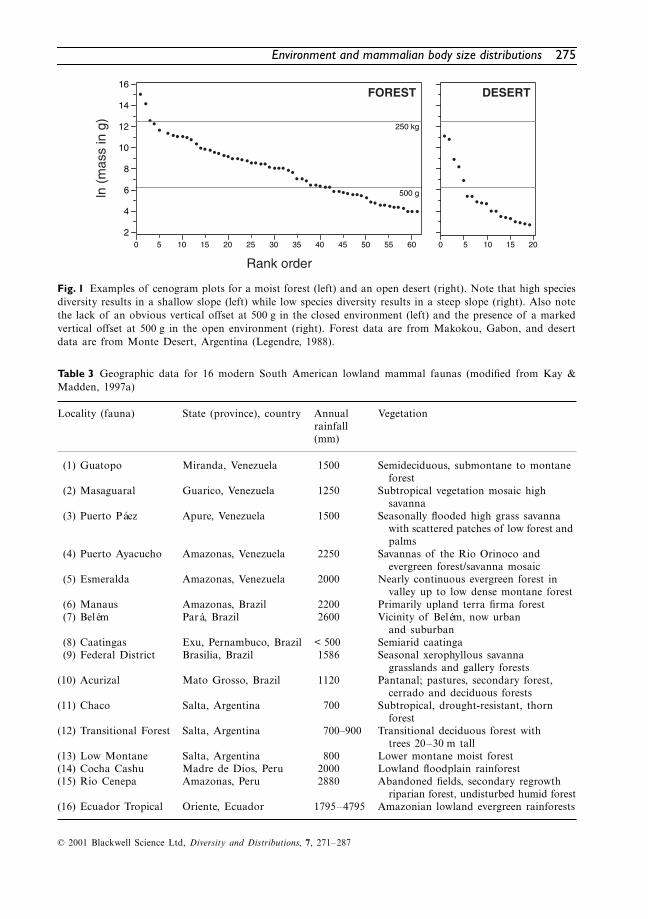
Table 3 Geographic data for 16 modern South American lowland mammal faunas (modified from Kay &Madden, 1997a)
Locality (fauna) State (province), country Annual rainfall (mm)
Vegetation
(1) Guatopo Miranda, Venezuela 1500 Semideciduous, submontane to montane forest
(2) Masaguaral Guarico, Venezuela 1250 Subtropical vegetation mosaic high savanna
(3) Puerto Páez Apure, Venezuela 1500 Seasonally flooded high grass savanna with scattered patches of low forest and palms
(4) Puerto Ayacucho Amazonas, Venezuela 2250 Savannas of the Rio Orinoco and evergreen forest/savanna mosaic
(5) Esmeralda Amazonas, Venezuela 2000 Nearly continuous evergreen forest in valley up to low dense montane forest
(6) Manaus Amazonas, Brazil 2200 Primarily upland terra firma forest(7) Belém Pará, Brazil 2600 Vicinity of Belém, now urban
and suburban(8) Caatingas Exu, Pernambuco, Brazil < 500 Semiarid caatinga(9) Federal District Brasilia, Brazil 1586 Seasonal xerophyllous savanna
grasslands and gallery forests(10) Acurizal Mato Grosso, Brazil 1120 Pantanal; pastures, secondary forest,
cerrado and deciduous forests(11) Chaco Salta, Argentina 700 Subtropical, drought-resistant, thorn
forest(12) Transitional Forest Salta, Argentina 700–900 Transitional deciduous forest with
trees 20–30 m tall(13) Low Montane Salta, Argentina 800 Lower montane moist forest(14) Cocha Cashu Madre de Dios, Peru 2000 Lowland floodplain rainforest(15) Rio Cenepa Amazonas, Peru 2880 Abandoned fields, secondary regrowth
localities were taken from Kay & Madden(1997a). Body masses for living taxa were takenfrom the literature or were based on data frommammal specimens in the Division of Mammals,Field Museum, Chicago, U.S.A. For those few taxafor which no mass data were found and whichwere not present in the mammal collections,masses were estimated based on the average massof other members of the genus. Complete faunallists with mass data can be found in Croft (2000).
RESULTS
The mass data from the 16 modern South Amer-ican mammal faunas were log-transformed andranked in decreasing order. The cenogram stat-istics discussed above were calculated and arepresented in Table 4 along with the same statisticscalculated for the fossil localities. Slopes were
calculated using least-squares regression inStatview 4.1 for the Macintosh computer.
Modern South American faunas
Significance tests support the assertion thatpredictable relationships exist between cenogramstatistics calculated for modern South Americanfaunas and environmental variables. Specifically,a positive relationship exists between the number(slope) of medium-sized mammals and total annualrainfall (
P
< 0.005, rho corrected for ties = 0.746,Spearman’s rank correlation; see Fig. 2) and alarge gap at 500 g tends to characterize openhabitats (
P
< 0.01, Scheffe’s
F
-test; see Fig. 2).This contrasts with the results of Gingerich forlocalities world-wide (1989) in which he was ableto discriminate combined savanna and woodlandfaunas from forest faunas but was unable to
Table 4 Cenogram statistics for modern and fossil South American mammal faunas
discriminate between savanna faunas and wood-land faunas. It should be noted in this study,however, that the size of the gaps in two forestlocalities (localities no. 12 and 13 with gaps of1.277 ln(g) and 0.802 ln(g), respectively) fall withinthe range of values exhibited by savanna habitats(0.788–1.299 ln(g)) and therefore savannas can-not be unequivocally discriminated from forestand woodland faunas based solely on gap size.
Fossil South American faunas
In order to examine palaeoenvironmental para-meters, the fossil faunas were plotted with themodern faunas, using the slope for the mediummammals (correlated with rainfall) and the gapat 500 g mass (correlated with vegetation struc-ture). These plots are presented in Fig. 3.
The oldest of the faunas, the late EoceneBarrancan (a sub-age of the Casamayoran SouthAmerican Land Mammal ‘Age’ (SALMA)) fromPatagonia, Argentina plots in the lower right-handcorner of Fig. 3. This suggests a closed, moisthabitat, and agrees well with traditional interpre-tations of Eocene environments (Kay
et al.
, 1999).The steep slope of the Tinguiririca Fauna of
Chile suggests abundant rainfall, although the large
gap at 500 g is typical of more open habitats. Thiscombination is unique relative to the modernSouth American faunas under consideration, butis similar to that postulated for the middle MioceneLa Venta Fauna (see below). A more thoroughstudy of the palaeoenvironment at Tinguiriricabased on several lines of evidence (J.J. Flynn
et al
.unpublished) suggests that an open habitat waspresent, but that rainfall was not nearly as greatas that suggested by cenogram analysis.
The late Oligocene Deseadan SALMA faunafrom Salla, Bolivia, plots in the lower right-handcorner of Fig. 3, near modern closed, moist hab-itats. The presence at Salla of the earliest SouthAmerican primate,
Branisella boliviana
, wouldseem to support the interpretation of at least amoderately moist environment with some trees.However, the faunal list (Shockey, 1997) used inthis study did not distinguish between differentstratigraphic levels at Salla, and MacFadden
et al
. (1985) note that faunal changes are presentin the Salla sequence. Therefore, if one were toanalyse the lower and upper beds at Salla separ-ately, it is possible that different environmentalinterpretations would result. However, the lack ofpublished faunal lists for these subdivisions pre-cluded such an analysis as part of this study. The
Fig. 2 Bivariate plots for modern South American faunas illustrating the relationship between mean annualrainfall and slope of the medium-sized mammals (left) and between vegetation structure and the gap in thebody size distribution at 500 g (right). For specific values for each fauna see Table 4.
DDI_117.fm Page 277 Thursday, October 25, 2001 9:02 PM
presence of hypsodont and presumably open-country adapted taxa at Salla implies that atleast some open areas were present (Shockey,1997). Perhaps Salla might better be described asa mixed habitat.
The results for the two faunas from the earlyto middle Miocene Santacrucian SALMA, the
Protypotherium
attenuatum
Zone and the
Proty-potherium
australe
Zone, are very similar, sug-gesting no environmental characteristics distinguishthem. Although usually interpreted as a mixedhabitat due to the presence of at least one primate
(
Homunculus
) in addition to many (presumably)savanna-adapted mammals, the cenogram stat-istics suggest the area was moister and less openthan previously thought. The lack of differentia-tion between the two faunas is notable because itcontrasts with Tauber’s (1997b) suggestion (basedon various lines of faunal evidence) that theclimate deteriorated and became less humid andmore open during this interval. If anything, thisanalysis suggests slightly greater rainfall in theupper (
P. australe
) zone, as indicated by the slopeof the medium-sized mammals.
The middle Miocene Monkey Beds fauna fromLa Venta, Colombia has been the subject of agreat deal of systematic and palaeobiologicalresearch (see Kay
et al.
, 1997 and referencestherein) and the results presented here agree withprevious palaeoenvironmental interpretations (Kay& Madden, 1997a, 1997b). The position of theMonkey Beds fauna is distant from modernfaunas in Fig. 3, suggesting a unique combinationof a moist yet partially open environment. It seemsbest described as a woodland habitat, as sug-gested by the diversity of primates (five species).
Finally, the two Pleistocene localities varysignificantly in their positions in Fig. 3. The olderEnsenadan SALMA fauna of Tarija, Bolivia,plots in the lower right-hand corner of the graph.The position of Tarija to the left of the otherfossil faunas suggests it received lower annualrainfall, but the 500 g gap is relatively small,suggestive of a forest or woodland habitat. Itsinterpretation as a woodland supports palaeoeco-logical studies of the feeding habits of Tarija’slarge mammals (MacFadden & Shockey, 1997),which found a fairly even distribution of herbi-vores mammals among grazing, browsing andmixed-feeding guilds.
In contrast, the cenogram statistics for Luján,Argentina, indicate a dry and open habitat. Thepresence of a large number of very large animals,many presumably adapted for grazing, supportsits interpretation as a mostly open, savanna-grassland habitat (Fariña, 1995).
DISCUSSION
The results for the South American palaeofaunasvary in their relationship to traditional palaeo-environmental interpretations. Some results areprimarily consistent (e.g. the late Eocene Barrancan
0
0.2
0.4
0.6
0.8
1.0
1.2
1.4
–0.7 –0.6 –0.5 –0.4 –0.3 –0.2 –0.1
Unknown (fossil)
Savanna
Forest or woodland
VEGETATIONSTRUCTURE
Gap
at 5
00g
2
1
6
8
74 5 3
Unknown (Fossil)
Medium (2000-2499 mm/yr)
Low (1000-1999 mm/yr)
Arid (<1000 mm/yr)
High (>2500 mm/yr)
ANNUAL RAINFALL
Slope of medium-sized mammals
Gap
at 5
00g
2
1
6
8
74 5 3
0
0.2
0.4
0.6
0.8
1.0
1.2
1.4
–0.7 –0.6 –0.5 –0.4 –0.3 –0.2 –0.1
Fig. 3 Bivariate plots of modern and fossil faunasusing slope for the medium-sized mammals andsize of gap in body size distribution at 500 g. Faunasare grouped by vegetation structure (above) andmean annual rainfall (below). Numbers refer tofossil faunas: 1 = Gran Barranca (CasamayoranSALMA); 2 = Tinguiririca (‘Tinguirirican’ SALMA);3 = Salla (Deseadan SALMA); 4 = Protypothe-rium attenuatum Zone (Santacrucian SALMA);5 = Protypotherium australe Zone (SantacrucianSALMA); 6 = Monkey Beds (Laventan SALMA);7 = Tarija (Ensenadan SALMA); 8 = Luján(Lujanian SALMA).
DDI_117.fm Page 278 Thursday, October 25, 2001 9:02 PM
level), others are primarily inconsistent (e.g. themiddle Miocene Santacrucian faunas), and yetothers seem partially consistent with availabledata (e.g. the late Oligocene Salla fauna). Beforeexploring potential biological explanations forsome of the discordance in these interpretations,certain potential methodological errors should beaddressed: specifically, the precision of the faunalassociations and the body mass estimates.
Faunal associations
As was discussed briefly above, a cenogram ana-lysis ideally includes all mammals known from asingle locality, from a restricted interval of time.When dealing with fossil assemblages, it is notpossible to know which mammals in the livingassemblage have not been preserved. Usuallythese animals tend to be smaller rather thanlarger ones, as the bones of smaller mammals areless likely to survive the fossilization process andbe recovered. For this reason, screen washing isusually necessary, a process that is not ubiqui-tous in fossil collecting. While some of the fossilfaunas examined above are likely to include mostof the mammals that were present at the time ofdeposition (e.g. Gran Barranca and La Venta) it isquite possible that some small mammals arelacking from some of the others. However, sincecenogram statistics primarily rely on the diversityof mammals 500 g or larger, an artificially smallsample of the smallest mammals (those less than500 g) should not have a significant effect onpalaeoenvironmental interpretations.
Similarly, the period of time represented byfossil-bearing strata is not always known. Detailedbiostratigraphy is necessary to determine if changesin faunal composition occur through a section,potentially signalling environmental change. Wheresuch changes do occur, different parts of thesection should be analysed separately in an effortto determine the environment at different pointsin time. If, for example, a forest fauna were grad-ually replaced by a woodland and then a savannafauna, all in the same location, lumping thesefaunas together would result in a single, errone-ous, palaeoenvironmental interpretation.
Although these sorts of effects cannot be ruledout for the Deseadan Salla Beds and, to someextent, the Barrancan (Casamayoran SALMA)of the Gran Barranca, these effects should be
minimal for the other faunas considered. Giventhe generally short lengths of the Ensenadan andLujanian SALMAs, time averaging should not besignificant at Tarija and Luján, respectively. BothSantacrucian faunal lists come from restrictedintervals in a detailed biostratigraphic study ofthese deposits (Tauber, 1997a) and therefore prob-ably represent the ideal stratigraphic precision fora cenogram study (although the sampling wascertainly not as extensive as that at some of theother localities). The same can be said for the LaVenta Fauna, which has excellent stratigraphiccontrol and sampling. The Tinguiririca Fauna hasbeen collected from a single fossil-bearing unit(Wyss
et al.
, 1994, 1996) of unknown temporallength. However, the geographically and strati-graphically restricted nature of the deposit andthe restricted taxonomic diversity of the fauna(as compared to the other fossil faunas) suggestthat time-averaging was not a significant problem.
Body mass estimates
Another potential source of error is body massestimates for fossil taxa. To investigate howerrors in regressions of body mass could affectcenogram statistics (and interpretations), a seriesof simulations were run using a C-based programfor the PC. Two modern faunas were chosen forthe simulations, Puerto Páez and Cocha Cashu,which represented a dry savanna and a relativelymoist forest, respectively. Since masses for fossiltaxa are most commonly estimated using thenatural log of body mass (as opposed to bodymass itself ) in living mammals, the mass datafor the modern faunas were log-transformed forthe simulations. Each simulation consisted of 100replicates. In each replicate, each original massestimate was recalculated by adding a positive ornegative error value, expressed as a percentage ofthe original mass, taken from a normal distributionwith a mean of one and an adjustable standarddeviation. The resulting masses were then re-sortedin descending order and cenogram statistics werecalculated.
For both of the modern faunas, simulationswere run using standard deviations ranging from0.01 to 0.50 (1% to 50% ‘error’ in natural logbody mass estimates; see Table 5). Arbitraryvalues were chosen because a variety of regressionequations were used to estimate fossil body
DDI_117.fm Page 279 Thursday, October 25, 2001 9:02 PM
masses and because the true error variance isunknown. It should be kept in mind that theapparent asymmetry of the estimated massesaround the true masses in Table 5 only resultsfrom the conversion of natural log values backinto standard mass units; this is analogous to thecurvature that results when a straight logarithmicplot is plotted in standard mass units. Thoughthe ranges presented in Table 5 may seem coun-terintuitive, they simulate the ranges of actualerrors expected when calculating body massesusing log-based regressions.
The mean, standard deviation, and range foreach cenogram statistic for the combined 100
replicates in each simulation are presented inTable 6. The data in Table 6 demonstrate howmuch confidence one can have regarding theaccuracy of cenogram statistics, given certainassumptions about the accuracy of mass estim-ates. The range of simulated slopes is large whenmoderate amounts of error are present in thesavanna fauna (10% or greater error), butremains small with greater amounts of error inthe forest fauna (up to 50% error). The range ingap size at 500 g follows a trend similar to thatfor the slopes; the range is large at only 5% errorfor the savanna fauna and at 25% error in theforest fauna.
Table 5 Examples of normally distributed errors (added to the natural log of body mass) converted back intostandard mass units. Range represents 95% confidence interval (masses calculated ± 2 standard deviations)
Table 6 Cenogram statistics for error simulations. Data presented include mean ± standard deviation (range).(a) Savanna (Puerto Páez, modern fauna no. 3); (b) Forest (Cocha Cashu, modern fauna no. 14)
Mass Error
1% 5% 10% 25% 50%
10 g 9.55–10.47 g 7.94–12.59 g 6.31–15.85 g 3.16–31.6 g 1–100 g100 g 91.2–110 g 63–158 g 39.8–251 g 10–1000 g 1–10000 g1000 g (1 kg) 871–1148 g 501–1995 g 251–3981 g 31.6–31622 g 1 g–1000 kg10 kg 8.3–12 kg 4–25.1 kg 1.6–63 kg 0.1–1000 kg 1–100000 kg100 kg 79.4–126 kg 31.6–316 kg 10–1000 kg 0.3–31622 kg 1–1 × 10⁷ kg1000 kg 759–1318 kg 251–3981 kg 63–15849 kg 1–1000000 kg 1–1 × 10⁹ kg
(a) Savanna (b) Forest
Error Medium slope 500-g gap Error Medium slope 500-g gap
These results indicate that cenogram accuracydepends considerably on the accuracy of massestimates. After looking over the examples pre-sented in Table 6, one might assume errorsbetween 5% and 25% to be reasonable. Althoughthis is probably reasonable for medium to largemammals, this may not be so for smaller ones.For example, given the skeleton of a 10-kg dog,one would likely be able to estimate its massbetween 4 kg and 25 kg (10% error range innatural log units). However, given the skeleton ofa 10-g marsupial, one might have difficulty estim-ating its mass between 3 g and 30 g (50% errorrange in natural log units). This is likely due toour own relatively large size and the tendency formeasurement errors to be larger when measuringsmaller objects.
It should be kept in mind, however, that somemass estimate problems are also encounteredwhen constructing cenograms for modern com-munities; accurate mean mass values for speciesare difficult to find, and even very accurate massestimates for species can obscure subspecific orgeographical variation in mass that may occur ata locality. Despite these and other problems, stat-istically significant correlations do exist betweenenvironmental attributes and cenogram statisticsfor modern communities, as demonstrated above.Additionally, cenograms for fossil localitiesthrough time do show predicted correlations withenvironmental change (Legendre, 1986), suggestingthat palaeocommunity cenograms also containuseful information and should not be dis-missed on the grounds of inaccuracy in bodymass estimates alone. A partial explanation maybe that the smallest mammals — for which massis perhaps the most difficult to estimate andwhich are most prone to be missed in palaeonto-logical sampling — should not have a significantaffect on cenogram statistics, which primarilyrely on mammals approximately 500 g and larger.
The simulations suggest that closed environ-ments with high rainfall (i.e. faunas with smallgap values and shallow slopes) are more likely tobe captured accurately by cenogram analysisthan open environments with little rainfall (i.e.faunas with large gap values and steep slopes).This results from the greater number of datapoints (mammal species) in wet forest habitats incomparison to dry savanna habitats (and a cor-responding lesser importance of any single species
on slope and gap values). Poor mass estimates havea greater effect on gap values than on slope values,so interpretations about vegetation should beconsidered more tenuous than estimates of rain-fall (which are relatively robust). A paradoxicalimplication is that because the odds of a fossilsavanna fauna being interpreted incorrectly (i.e.as a forest fauna) are greater than the odds of afossil forest fauna being interpreted incorrectly(i.e. as a savanna fauna), one should have greaterconfidence in a fossil assemblage interpreted as asavanna than in one interpreted as a forest. How-ever, this may not be entirely true. Since thepotential for fossilization tends to be lower inhumid forest environments, the faunal lists forthese palaeoenvironments may tend be lessexhaustive than those from environments withgreater potential for fossilization. Intensive sam-pling of fossiliferous localities should minimizeany such problems.
A potential explanation
Because it is unlikely that any of the systematicmethodological errors discussed above are creat-ing significant errors in cenogram analyses,potential biological factors must be considered.The basic premise of cenogram analysis is thatthe diversity of medium-sized mammals (as indic-ated by slope and gap values) depends primarilyon rainfall and vegetation structure. If thisassumption is violated (i.e. if other factors signi-ficantly affect the diversity of medium-sized mam-mals) then erroneous interpretations could result.I propose that one such confounding factorcould be the diversity of mammalian predators.
For the 16 modern South America faunasstudied here, the diversity of mammalian predatorscorrelates significantly (P = 0.0058, rho correctedfor ties = 0.713, Spearman’s rank correlation) withthe diversity of medium-sized mammals (500–8000 g, as originally defined by S. Legendre). Nosignificant relationship exists between predatordiversity and mammals smaller than 500 g norlarger than 8 kg. There also is no significant rela-tionship between predator diversity and totalannual rainfall (P = 0.125, Spearman’s rank cor-relation) nor vegetation (P-values = 0.148, 0.503and 0.772 (Sheffe’s F-test) for pairwisecomparisons between forests, mixed habitats andsavannas), suggesting that the relationship between
DDI_117.fm Page 281 Thursday, October 25, 2001 9:02 PM
predators and prey is not the result of predatordiversity and prey diversity being similarly influ-enced by one of the habitat variables.
The causal nature of this apparent relationshipbetween predators and prey is unknown (i.e.whether predator diversity directly depends onthe diversity of prey and/or whether prey divers-ity is partly limited by the diversity of pred-ators). On islands (where predators are oftenscarce or absent), small taxa tend to increase insize while large taxa tend to undergo dwarfism(Sondaar, 1977; Lomolino, 1985). In both cases,mammals move closer to what might be con-sidered an ‘optimal’ body mass. Based on a math-ematical model of fitness, Brown, et al. (1993)suggest this optimum is approximately 100 g.Body mass data from island taxa, however, sug-gest this optimum is closer to 500 g (Lomolino,1985). Regardless of the precise optimal bodymass, it is unclear what prevents species fromapproaching this optimum on the mainland(although several hypotheses have been put forth,including resource limitation, interspecific com-petition and predation (Melton, 1982; Lomolino,1985; Brown, 1995)). The fact that small andlarge mammals tend to converge toward mediumsize on islands (where predator diversity is oftenreduced) suggests that predation may be partlyresponsible for limiting the diversity of mediummammals in their continental habitats.
It seems reasonable that an animal would havea more difficult time avoiding predation in opencountry than in a more forested environment,especially if that animal is of medium size. If so,then the effects of predator diversity in limitingprey diversity might be expected to be more pro-nounced in open habitat faunas than in a closedones. In other words, for a given diversity ofpredators, one would expect a lower diversity ofmedium-sized mammals in an open (savanna)environment than in a more closed one (wood-land or forest). Perhaps such a relationship (i.e.greater predation pressure on medium-sizedmammals) might somehow help account for thelarger gap at 500 g typical of savanna faunas.Figure 4a presents predator diversity plottedagainst medium mammal diversity for the 16modern South American faunas. The figure sug-gests that for a given number of predators, theregenerally are fewer medium-sized mammals inopen habitats than in the closed ones. However,
since the difference is not statistically significantdue to small sample size, the relationship may ormay not be real.
Still, such a relationship between predatorsand prey, combined with the unique compositionof the mammal fauna present in South Americathroughout much of the Cenozoic (Patterson &Pascual, 1972; Simpson, 1980; Flynn & Wyss,1998), may account for some of the discrepanciesamong palaeoenvironmental interpretationsobserved in this study. Due to South America’srelative isolation for much of the Cenozoic, manymammal groups present on other continents wereabsent from South America until the earlieststages of the Great American Biotic Interchange(GABI) of the late Cenozoic (Anaya & MacFadden,1995). Among others, these groups includedthe diverse Carnivora (Marshall et al., 1982;
4
6
8
10
12
14
16
18
Savanna
Forest or woodland
Pre
dato
r di
vers
ity
4 7 10 13 16 19 22 25 28
Pre
dato
r di
vers
ity
4 7 10 13 16 19 22 25 28
Unknown (fossil)
Savanna
Forest or woodland
Medium mammal diversity
2
16
8
7
45
3
0
2
4
6
8
10
12
14
16
18
Fig. 4 Bivariate plots of predator diversity vs.diversity of medium-sized prey mammals (massbetween 500 g and 8000 g). (a) Modern faunas only;(b) Modern plus fossil faunas; solid line representsthe least-squares regression line (calculated for themodern faunas only); dashed lines represent 95%confidence intervals for the mean.
DDI_117.fm Page 282 Thursday, October 25, 2001 9:02 PM
Environment and mammalian body size distributions 283
Webb, 1991). In the absence of the carnivorans,the mammalian carnivore palaeoguild was filledprimarily by borhyaenoid marsupials. Addition-ally, large, terrestrial, phororhacoid birds andterrestrial crocodiles may also have been import-ant large predators (Marshall, 1977).
The depauperate nature of the carnivore pal-aeoguild in South America is evident in Table 7.While the number of mammalian predators inmodern South American faunas ranges from five(in Puerto Páez) to 17 (in Ecuador Tropical), thenumber of predators in pre-interchange faunas(the Monkey Beds and older) ranges from zero(none have yet been found at Tinguiririca) to amaximum of five. The two post-interchange faunas,Tarija and Luján, have predator numbers moretypical of modern faunas (13 and 9, respectively).Combining the data from fossil faunas with that
from modern faunas, it is evident that nearly allfossil faunas fall well outside the 95% confidenceintervals for the regression line calculated formodern faunas (Fig. 4b). Additionally, the pre-interchange and post-interchange faunas showquite different predator–prey distributions; whileall pre-interchange faunas plot below the lower95% confidence interval, the two post-interchangefaunas fall above the upper 95% confidence interval.
Given the observations regarding predatorand prey diversity in modern faunas, it can behypothesized that pre-interchange faunas couldhave had greater-than-expected numbers ofmedium-sized mammals due to the low diversity(and, perhaps, abundance) of mammalian pred-ators. Furthermore, we would expect this effect tobe more pronounced in open habitats than inclosed ones. Thus, cenogram statistics computed for
Table 7 Predatory (Pred.), medium-sized (Med.), and total non-predatory (Tot.) terrestrial mammal diversityfrom modern and fossil South American communities, the Great American Biotic Interchanges (GABI) areindicated
a pre-interchange fauna would suggest erroneouslyhigh amounts of rainfall (due to the greater thanexpected diversity of medium-sized mammals) anda possibly erroneous interpretation of a closedhabitat (due to the potential for a reduced gap at500 g). These predictions compare favourably withthe results obtained in this study; inconsistenciesin palaeoenvironmental interpretations are prim-arily restricted to pre-interchange faunas, andthese tend to err in a direction consistent withgreater-than-expected numbers of medium-sizedmammals (i.e. smaller-than-expected gaps andshallower-than-expected slopes).
The ‘greater-than-expected’ diversity of pred-ators (at least in comparison to modern SouthAmerican faunas) in the two post-interchangefossil faunas may result from the presence oflarge, placental carnivores preying on now-extinct large mammals (as has been hypothesizedfor animals like Smilodon; Akersten, 1985); thiswould account for the increased predator ‘carry-ing capacity’ of faunas at that time. Since mostlarge predators and large prey were extirpated inthe end-Pleistocene megafaunal extinction, suchrelationships would not be reflected in analysesof modern South American faunas.
Although the South American fossil recordsuggests that the hypothesized interaction amongpredator diversity, medium-sized mammal divers-ity and environment may be real, further studyis certainly warranted. In an expanded study ofmodern habitats, one would expect to find evid-ence for positive, but different, relationshipsbetween predators and medium-sized mammalsin open and closed habitats (i.e. fewer medium-sized mammals for a given diversity of predatorsin open habitats than in closed ones). Prelim-inary data suggest this may be the case. Totalpredator and medium-sized mammal diversitywere obtained for an additional 28 modern mam-mal faunas using sources cited in Legendre(1988). The data are presented graphically inFig. 5. Several trends can be discerned. First,medium-sized mammals are less diverse in mixedhabitats than in forests (P-value = 0.024, Sheffe’sF-test) and appear to be less diverse in savannasthan in mixed habitats (although this is notstatistically significant); nevertheless, average pred-ator diversity remains remarkably constant withrespect to vegetation structure (P-values = 0.449,0.999 and 0.427 (Sheffe’s F-test) for pairwise
comparisons between forests, mixed habitatsand savannas). This observation would tend tosupport the hypothesized relationship betweenpredator and medium mammal diversity becausemedium-sized mammals are less diverse in openhabitats than in closed ones for a given diversityof predators. However, predator diversity ishighly variable and shows no significant correla-tion with the diversity of medium-sized mammals(P = 0.345, rho corrected for ties = 0.189, Spear-man’s rank correlation); this contrasts with theresults obtained for South American faunas andwould seem to suggest that no special relation-ship exists. More conclusive results must awaitfurther data collection and analysis.
Additional research in progress involves exam-ining historical introductions of predators toislands with relatively low diversities of endemicmammalian predators (such as Australia). If thepredator hypothesis is correct, these introductionswould be expected to have the greatest detrimentaleffects on medium-sized mammals, especiallythose living in open habitats. Indeed, among nativeAustralian mammals, scientists have found thatextinctions and significant declines are virtuallyconfined to non-flying species weighing between35 g and 5500 g (the critical weight range orCWR; Burbidge & McKenzie, 1989). Moreover,they have noted that a species’ risk of extinctionis positively correlated with arid or semiaridhabitat preference, herbivorous or omnivorousdiet, and locomotor style that confines the animal
30
35
20
25
10
15
0
5
0 3 6 9 12 15 18 21 24
Medium mammal diversity
Pre
dato
r di
vers
ity
Forest
Savanna
Woodland
Fig. 5 Bivariate plot of predator diversity vs.diversity of medium-sized mammals (mass between500 g and 8000 g) for 28 modern faunas. Data andsources are from Legendre (1988).
DDI_117.fm Page 284 Thursday, October 25, 2001 9:02 PM
Environment and mammalian body size distributions 285
to the ground’s surface (Maxwell et al., 1996).All of these attributes are strongly suggestive ofthe predation hypothesis as a major factoraffecting medium mammal diversity. Preciselyhow such patterns might affect fossil cenogramanalyses, however, is not presently known. Con-tinued research in this area is underway.
One final aspect of this study warrants com-ment: that predatory birds and large, terrestrialcrocodiles were not included in the predatordiversity counts for the fossil faunas, even thoughthey could have played significant roles inpredator–prey dynamics. These taxa were notincluded for several reasons. First, this study wasrestricted to mammals, and it is difficult to justifyadding birds and/or reptiles to the predator sideof the equation while not adding them to theprey side of the equation. It is also difficult tojustify including predatory birds in the fossilfaunas, but not including them in modern faunas.If ‘terror birds’ (phororhacoids) were to be includedas predators in the fossil communities, whyshould not eagles also be included as predatorsin modern communities? (They certainly preyupon medium-sized mammals.) It may appear tobe an arbitrary decision, but at least it is consist-ent, and actually follows closely with the originalinterpretations of Valverde (the first to use ceno-grams): that mammal, bird and reptile commu-nities tend to generate patterns of interaction thatare relatively independent of each other. Addi-tionally, birds are much less likely to be preservedin fossil faunas, and including them wouldrequire unlikely assumptions about their prob-ability of preservation. Perhaps most importantly,including terror birds and terrestrial crocodileswould not have significantly changed the results.Using the sources of faunal lists cited earlier,adding these predators would add one predatorin the Deseadan Salla Beds and one in theMonkey Beds of La Venta.
Using an independent data set, this studygenerally corroborates the findings of Legendre(1986) that cenogram analysis is a useful methodfor inferring palaeoenvironmental characteristicsfrom fossil mammal assemblages. In general,cenogram rainfall estimates are more likely tobe accurate than interpretations about vegetation,but more accurate mass estimates for fossil taxacan improve confidence in both cases. Whenapplying modern methods of ecological investigation
to potentially non-analogue fossil communities(i.e. those with ecological associations or condi-tions not found in present-day communities),careful consideration of the faunas in question isrequired. In the case of cenogram analysis, incor-porating additional information from fossil mam-mals and taking into account the peculiarities ofSouth American palaeofaunas (i.e. the relativelydepauperate predator guild) provide a moreaccurate (and interesting) picture of fossil mam-mal communities. It is hoped that this study willincrease interest in cenograms and will stimulatenew investigations of how they can be appliedwith precision to fossil assemblages.
ACKNOWLEDGMENTS
This research was supported in part by theAmerican Society of Mammalogists, the HindsFund, the Palaeobiological Fund, and a NSFBiodiversity Training Grant to The Universityof Chicago (NSF GRT-9355032). M.S. Bargo,M. Bond, R. Fariña, J. Flynn, J. Hopson, C. Janis,R. Madden, B. Shockey, L. Van Valen, S. Vizcaíno,P. Wagner, and A. Wyss provided helpfulinput during the development of this project.Additionally, S. Vizcaíno generously permittedthe use of unpublished data for some extinctxenarthran body mass estimates. The manuscriptwas critically reviewed (and improved) by JohnFlynn and two anonymous reviewers. Guidancefrom C. Abraczinskas greatly contributed to thequality of the figures. Simulations of body masserrors would not have been possible without theexpertise of G. Hunt. The author thanks J. Flynn(Field Museum), R. Pascual (Museo de La Plata),M. Reguero (Museo de La Plata), W. Stanley(Field Museum), and S. D. Webb (Florida StateMuseum) for access to specimens in their care.
REFERENCES
Akersten, W.A. (1985) Canine function in Smilodon.Contributions in Science, Natural History Museum,Los Angeles County 356, 1–22.
Anaya, F. & MacFadden, B.J. (1995) Pliocene mam-mals from Inchasi, Bolivia: the endemic fauna justbefore the Great American Interchange. Bulletin ofthe Florida Museum of Natural History 39, 87–140.
Bargo, M.S. & Vizcaíno, S.F. (1997) Alometría yresistencia de los miembros de milodóntidos(Mammalia, Xenarthra) del Pleistoceno. Ameg-hiniana 33, 532.
DDI_117.fm Page 285 Thursday, October 25, 2001 9:02 PM
de Bonis, L., Bouvrain, G., Geraads, D. & Koufos, G.(1992) Diversity and paleoecology of Greek lateMiocene mammalian faunas. Palaeogeography,Palaeoclimatology, Palaeoecology 91, 99–121.
Brown, J.H. (1995) Macroecology. The University ofChicago Press, Chicago.
Brown, J.H., Marquet, P.A. & Taper, M.L. (1993)Evolution of body size: consequences of an ener-getic definition of fitness. American Naturalist142, 573–584.
Burbidge, A.A. & McKenzie, N.L. (1989) Patternsin the modern decline of Western Australia’svertebrate fauna: causes and conservation impli-cations. Biological Conservation 50, 143–198.
Cifelli, R.L. (1985a) Biostratigraphy of the Casa-mayoran, Early Eocene, of Patagonia. AmericanMuseum Novitates 2820, 1–26.
Cifelli, R.L. (1985b) South American ungulate evolu-tion and extinction. The Great American BioticInterchange (ed. by F.G. Stehli and S.D. Webb),pp. 249–266. Plenum Press, New York.
Croft, D.A. (1999) South American herbivore com-munities and the Eocene-Oligocene transition.Journal of Vertebrate Paleontology 19, 40A.
Croft, D.A. (2000) Archaeohyracidae (Mammalia:Notoungulata) from the Tinguiririca Fauna, centralChile, and the evolution and paleoecology of SouthAmerican mammalian herbivores. PhD Disserta-tion, The University of Chicago, Chicago.
Damuth, J. & MacFadden, B.J. (eds) (1990) Bodysize in mammalian paleobiology: estimation andbiological implications. Cambridge UniversityPress, Cambridge.
Ducrocq, S., Chaimanee, Y., Suteethorn, V. &Jaeger, J.-J. (1994) Ages and paleoenvironmentof Miocene mammalian faunas from Thailand.Palaeogeography, Palaeoclimatology, Palaeoecology108, 149–163.
Emmons, L.H. (1997) Neotropical rainforest mam-mals. The University of Chicago Press, Chicago.
Fariña, R.A. (1995) Trophic relationships among Lujanianmammals. Evolutionary Theory 11, 125–134.
Fariña, R.A., Vizcaíno, S.F. & Bargo, M.S. (1998)Body mass estimations in Lujanian (latePleistocene–early Holocene of South America)mammal megafauna. Mastozoología Neotropical5, 87–108.
Flynn, J.J. & Wyss, A.R. (1998) Recent advances inSouth American mammalian paleontology. Trendsin Ecology and Evolution 13, 449–454.
Flynn, J.J. & Wyss, A.R. (1999) New marsupialsfrom the Eocene–Oligocene Transition of theAndean Main Range, Chile. Journal of VertebratePaleontology 19, 533–549.
Gingerich, P.D. (1989) New earliest Wasatchianmammalian fauna from the Eocene of northwesternWyoming: composition and diversity in a rarelysampled high-floodplain assemblage. University ofMichigan Papers on Paleontology 28, 1–97.
Gingerich, P.D. (1990) Prediction of body mass inmammalian species from long bone lengths anddiameters. Contributions from the Museum ofPaleontology, University of Michigan 28, 79–92.
Gunnell, G.F. (1994) Paleocene mammals andfaunal analysis of the Chappo Type Locality(Tiffanian), Green River Basin, Wyoming. Journalof Vertebrate Paleontology 14, 81–104.
Gunnell, G.F. (1997) Wasatchian-Bridgerian (Eocene)paleoecology of the western interior of NorthAmerica: changing paleoenvironments and taxonomiccomposition of omomyid (Tarsiiformes) primates.Journal of Human Evolution 32, 105–132.
Hayssen, V.P. (1993) Asdell’s patterns of mammalianreproduction. Cornell University Press, Ithaca, NY.
Hitz, R., Reguero, M., Wyss, A.R. & Flynn, J.J.(2000) New interatheriines (Interatheriidae,Notoungulata) from the Paleogene of CentralChile and Southern Argentina. Fieldiana: Geology,New Series 42, 1–26.
Hoffstetter, R. (1963) La faune Pléistocène de Tarija(Bolivie). Bulletin du Muséum National d’HistoireNaturelle 35, 194–203.
Holling, C.S. (1992) Corss-scale morphology,geometry, and dynamics of ecosystems. EcologicalMonographs 62, 447–502.
Janis, C.M. (1990) Correlation of cranial and dentalvariables with body size in ungulates and macro-podids. Body size in mammalian paleobiology:estimation and biological implications (ed. byJ. Damuth and B.J. MacFadden), pp. 255–300.Cambridge University Press, Cambridge.
Kay, R.F. & Madden, R.H. (1997a) Mammals andrainfall: paleoecology of the middle Miocene atLa Venta (Colombia, South America). Journal ofHuman Evolution 32, 161–199.
Kay, R.F. & Madden, R.H. (1997b) Paleogeographyand paleoecology. Vertebrate paleontology in theneotropics: the Miocene fauna of La Venta, Colom-bia (ed. by R.F. Kay, R.H. Madden, R.L. Cifelliand J.J. Flynn), pp. 520–550. Smithsonian Institu-tion Press, Washington.
Kay, R.F., Madden, R.H., Cifelli, R.L. & Flynn, J.J.(eds) (1997) Vertebrate paleontology in the neotropics:the Miocene fauna of La Venta, Colombia. Smith-sonian Institution Press, Washington.
Kay, R.F., Madden, R.H., Vucetich, M.G., Carlini,A.A., Mazzoni, M.M., Re, G.H., Heizler, M. &Sandeman, H. (1999) Revised geochronology ofthe Casamayoran South American Land MammalAge: climatic and biotic implications. Proceedingsof the National Academy of Science (USA) 96,13235–13240.
Legendre, S. (1986) Analysis of mammalian commu-nities from the late Eocene and Oligocene ofsouthern France. Palaeovertebrata 16, 191–212.
Legendre, S. (1988) Les communautés de mam-mifères du Paléogène (Eocène supérieur etOligocène) d’Europe occidentale: structures, milieux,
DDI_117.fm Page 286 Thursday, October 25, 2001 9:02 PM
Environment and mammalian body size distributions 287
et évolution. Thèse de Doctorat d’Etat, Universitéde Montpellier, Montpellier, France.
Lomolino, M.V. (1985) Body size of mammals onislands: the island rule reexamined. AmericanNaturalist 125, 310–316.
MacFadden, B.J., Campbell, K.E. Jr, Cifelli, R.L.,Siles, O., Johnson, N.M., Naeser, C.W. &Zeitler, P.K. (1985) Magnetic polarity stratigraphyand mammalian fauna of the Deseadan (LateOligocene-Early Miocene) Salla Beds of northernBolivia. Journal of Geology 93, 223–250.
MacFadden, B.J. & Shockey, B.J. (1997) Ancientfeeding ecology and niche differentiation ofPleistocene mammalian herbivores from Tarija,Bolivia: morphological and isotopic evidence.Paleobiology 23, 77–100.
Mares, M.A., Ojeda, R.A. & Barquez, R.M. (1989)Guide to the mammals of Salta Province, Argen-tina. University of Oklahoma Press, Norman.
Marquet, P.A. & Cofré, H. (1999) Large temporaland spatial scales in the structure of mammalianassemblages in South America: a macroecologicalapproach. Oikos 85, 299–309.
Marshall, L.G. (1977) Evolution of the carnivorousadaptive zone in South America. Major patternsin vertebrate evolution (ed. by M.K. Hecht,P.C. Goody and B.M. Hecht), pp. 709–721. PlenumPress, New York.
Marshall, L.G., Webb, S.D., Sepkoski, J.J. Jr &Raup, D.M. (1982) Mammalian evolution and theGreat American Interchange. Science 215, 1351–1357.
Maxwell, S., Burbidge, A.A. & Morris, K. (1996)Action plan for Australian marsupials andmonotremes. Environment Australia, Canberra.
Melton, R.H. (1982) Body size and island Peromy-scus: a pattern and a hypothesis. EvolutionaryTheory 6, 113–126.
Montuire, S. & Desclaux, E. (1997) Palaeoecologicalanalysis of mammalian faunas and environmentalevolution in the South of France during the Pleis-tocene. Boreas 26, 355–365.
Olrog, C.C. & Lucero, M.M. (1980) Guía de losMamíferos Argentinos. Ministerior de Cultura yEducación, San Miguel de Tucumán, San Miguel.
Patterson, B. & Pascual, R. (1972) The fossil mam-mal fauna of South America. Evolution, mammals,and southern continents (ed. by A. Keast, F.C. Erkand B. Glass), pp. 247–309. State University ofNew York Press, Albany.
Scott, K.M. (1990) Postcranial dimensions of ungu-lates as predictors of body mass. Body size inmammalian paleobiology: estimation and biologicalimplications (ed. by J. Damuth and B.J. MacFadden),pp. 301–335. Cambridge University Press, Cambridge.
Sherman, J.A. (1984) Functional morphology of theforelimb in nothrotherine sloths (Mammalia:
Xenarthra = Edentata). PhD Dissertation, TheUniversity of Chicago, Chicago.
Shockey, B.J. (1997) Toxodontia of Salla, Bolivia(late Oligocene): taxonomy, systematics, and func-tional morphology. PhD Dissertation, Universityof Florida, Gainesville.
Simpson, G.G. (1980) Splendid isolation, the curioushistory of South American mammals. Yale Univer-sity Press, New Haven.
Sondaar, P.Y. (1977) Insularity and its effect onmammal evolution. Major patterns in vertebrateevolution (ed. by M.K. Hecht, P.C. Goody andB.M. Hecht), pp. 671–707. Plenum Press, NewYork.
Tauber, A.A. (1997a) Bioestratigrafía de la Forma-ción Santa Cruz (Mioceno Inferior) en el extremosudeste de la Patagonia. Ameghiniana 34, 413–426.
Tauber, A.A. (1997b) Paleoecología de la Forma-ción Santa Cruz (Mioceno Inferior) en el extremosudeste de la Patagonia. Ameghiniana 34, 517–529.
Tonni, E.P., Prado, J.L., Menegaz, A.N. & Salemme, M.C.(1985) La unidad mamifero (fauna) Lujanense.Proyección de la estratigrafía mamaliana alcuaternario de la Región Pampeana. Ameghiniana22, 255–261.
Valverde, J.A. (1964) Remarques sur la structure etl’évolution des communautés de vertébrés terres-tres. I. Structure d’une commumauté. II. Rapportsentre prédateurs et proies. La Terre et la Vie 111,121–154.
Valverde, J.A. (1967) Estructura de una communi-dad de vertabrados terrestres. Monographias de laEstacion Biologica de Doñana 1, 1–129.
Webb, S.D. (1991) Ecogeography and the GreatAmerican Interchange. Paleobiology 17, 266–280.
White, J.L. (1997) Locomotor adaptations inMiocene xenarthrans. Vertebrate paleontology inthe neotropics: the Miocene fauna of La Venta,Colombia (ed. by R.F. Kay, R.H. Madden,R.L. Cifelli and J.J. Flynn), pp. 246–264. SmithsonianInstitution Press, Washington.
Wilf, P.K., Beard, C., Davies-Vollum, K.S. &Norejko, J.W. (1998) Portrait of a late Paleocene(early Clarkforkian) terrestrial ecosystem: BigMulti Quarry and associated strata, Washakie Basin,southwestern Wyoming. Palaios 13, 514–532.
Wyss, A.R., Charrier, R. & Flynn, J.J. (1996) Fossilmammals as a tool in Andean stratigraphy:dwindling evidence of Late Cretaceous volcanismin the South Central Main Range. Paleobios 17,13–27.
Wyss, A.R., Flynn, J.J., Norell, M.A., Swisher, C.C.III, Novacek, M.J., McKenna, M.C. & Charrier, R.(1994) Paleogene mammals from the Andes ofcentral Chile: a preliminary taxonomic, biostrati-graphic, and geochronologic assessment. Ameri-can Museum Novitates 3098, 1–31.
DDI_117.fm Page 287 Thursday, October 25, 2001 9:02 PM