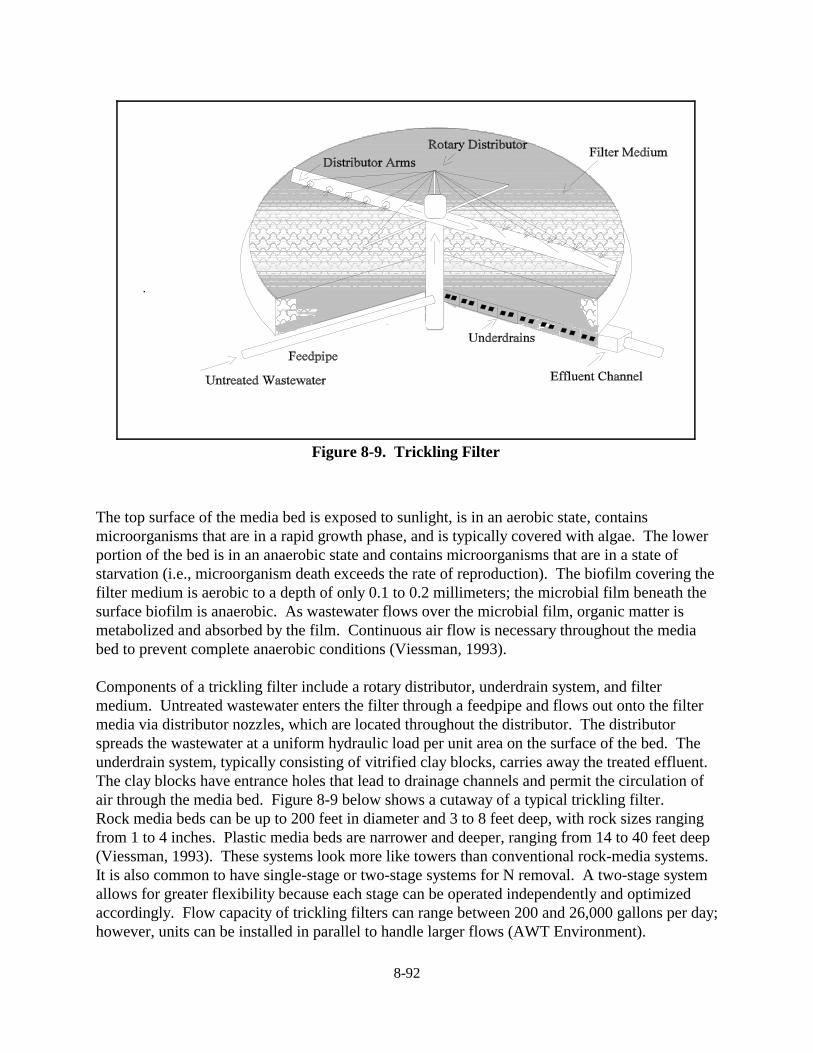
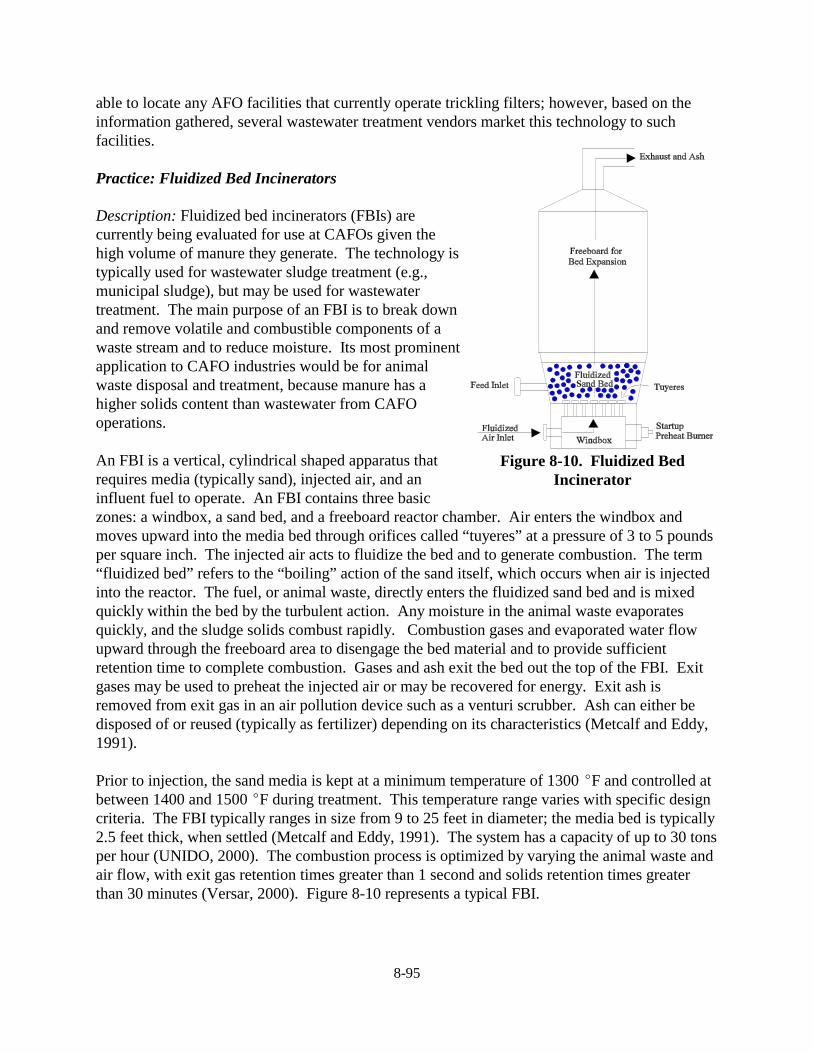
8-1 CHAPTER 8 TREATMENT TECHNOLOGIES AND BEST MANAGEMENT PRACTICES 8.0 INTRODUCTION This chapter provides an overview of treatment technologies and best management practices (BMPs) for pollution prevention at animal feeding operations (AFOs), as well as for the handling, storage, treatment, and land application of wastes. The discussion focuses on technologies and BMPs currently implemented at domestic AFOs, but it also describes technologies and BMPs that are under research and development, are undergoing laboratory or field testing, or are used in other countries. Many waste management technologies and BMPs are used by more than one animal sector, and information on them is presented in a general discussion form. However, the manner in which a particular technology or BMP is used or its degree of acceptance can vary among sectors. These differences are presented by animal sector where necessary. 8.1 Pollution Prevention Practices Pollution prevention practices can be divided into feeding strategies that reduce the concentration of pollutants in waste and practices that reduce the amount of water used in the handling of wastes. Reduced water use or handling of wastes in a dry or drier form lowers the risk of pollutants entering surface waters. Reduced water use has the added benefit of making the waste less expensive to move from the facility site. 8.1.1 Feeding Strategies Feeding strategies designed to reduce nitrogen (N) and phosphorus (P) losses include more precise diet formulation, enhancing the digestibility of feed ingredients, genetic enhancement of cereal grains and other ingredients resulting in increased feed digestibility, and improved quality control. These strategies increase the efficiency with which the animals use the nutrients in their feed and decrease the amount of nutrients excreted in the waste. With a lower nutrient content, more manure can be applied to the land and less cost is incurred to transport excess manure from the farm. Strategies that focus on reducing P concentrations, thus reducing overapplication of P and associated runoff into surface waters, can turn manure into a more balanced fertilizer in terms of plant requirements.
Transcript
8-1
CHAPTER 8
TREATMENT TECHNOLOGIES AND
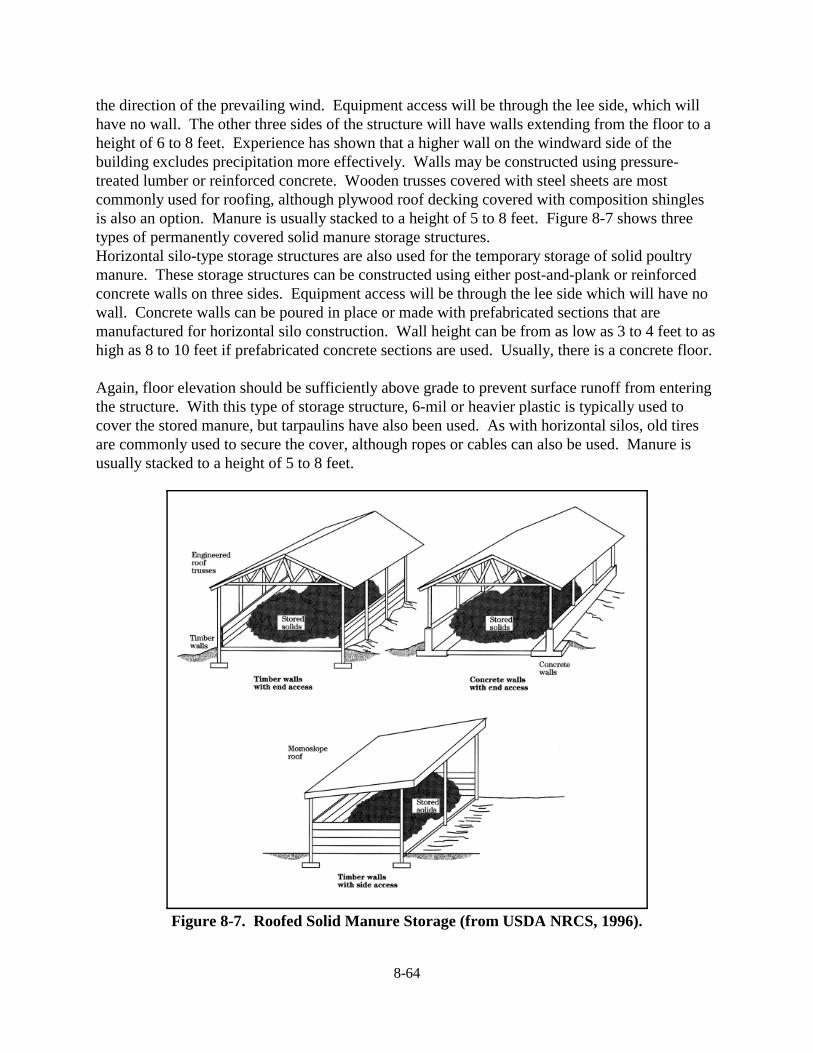
BEST MANAGEMENT PRACTICES
8.0 INTRODUCTION
This chapter provides an overview of treatment technologies and best management practices(BMPs) for pollution prevention at animal feeding operations (AFOs), as well as for thehandling, storage, treatment, and land application of wastes. The discussion focuses ontechnologies and BMPs currently implemented at domestic AFOs, but it also describestechnologies and BMPs that are under research and development, are undergoing laboratory orfield testing, or are used in other countries.
Many waste management technologies and BMPs are used by more than one animal sector, andinformation on them is presented in a general discussion form. However, the manner in which aparticular technology or BMP is used or its degree of acceptance can vary among sectors. Thesedifferences are presented by animal sector where necessary.
8.1 Pollution Prevention Practices
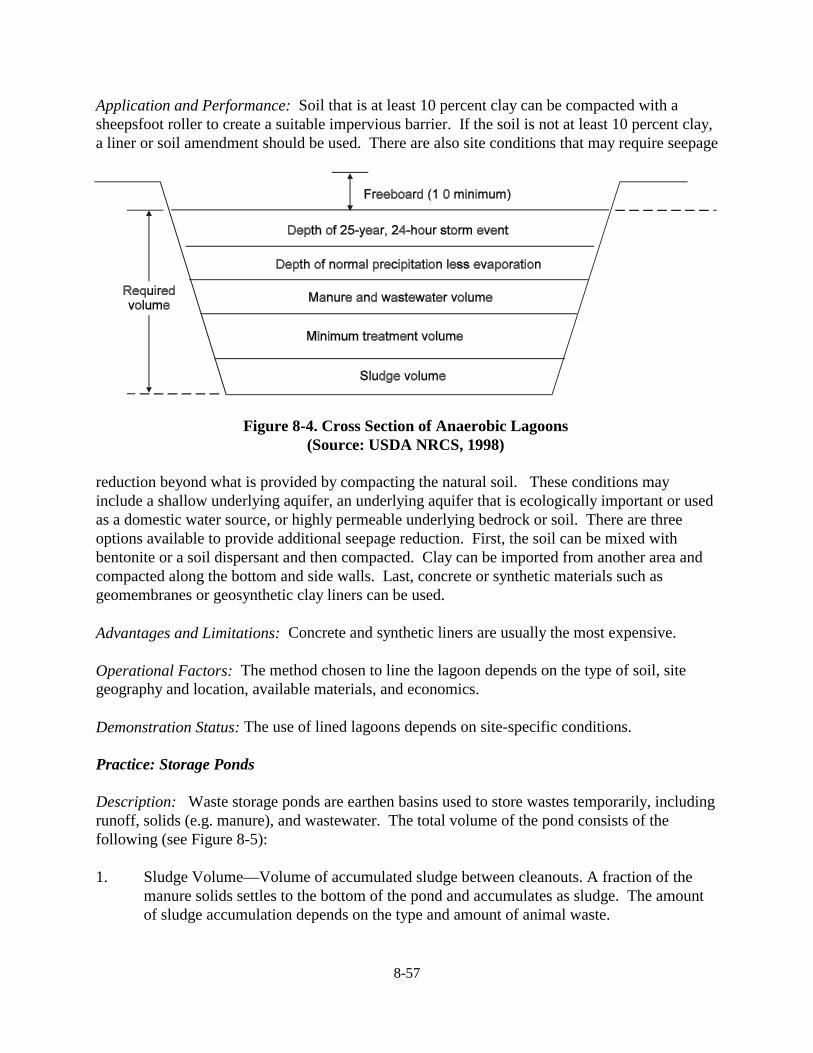
Pollution prevention practices can be divided into feeding strategies that reduce the concentrationof pollutants in waste and practices that reduce the amount of water used in the handling ofwastes. Reduced water use or handling of wastes in a dry or drier form lowers the risk ofpollutants entering surface waters. Reduced water use has the added benefit of making the wasteless expensive to move from the facility site.
8.1.1 Feeding Strategies
Feeding strategies designed to reduce nitrogen (N) and phosphorus (P) losses include moreprecise diet formulation, enhancing the digestibility of feed ingredients, genetic enhancement ofcereal grains and other ingredients resulting in increased feed digestibility, and improved qualitycontrol. These strategies increase the efficiency with which the animals use the nutrients in theirfeed and decrease the amount of nutrients excreted in the waste. With a lower nutrient content,more manure can be applied to the land and less cost is incurred to transport excess manure fromthe farm. Strategies that focus on reducing P concentrations, thus reducing overapplication of Pand associated runoff into surface waters, can turn manure into a more balanced fertilizer interms of plant requirements.
1Most plant P occurs in the form of phytate, which is P bonded to phytic acid.
8-2
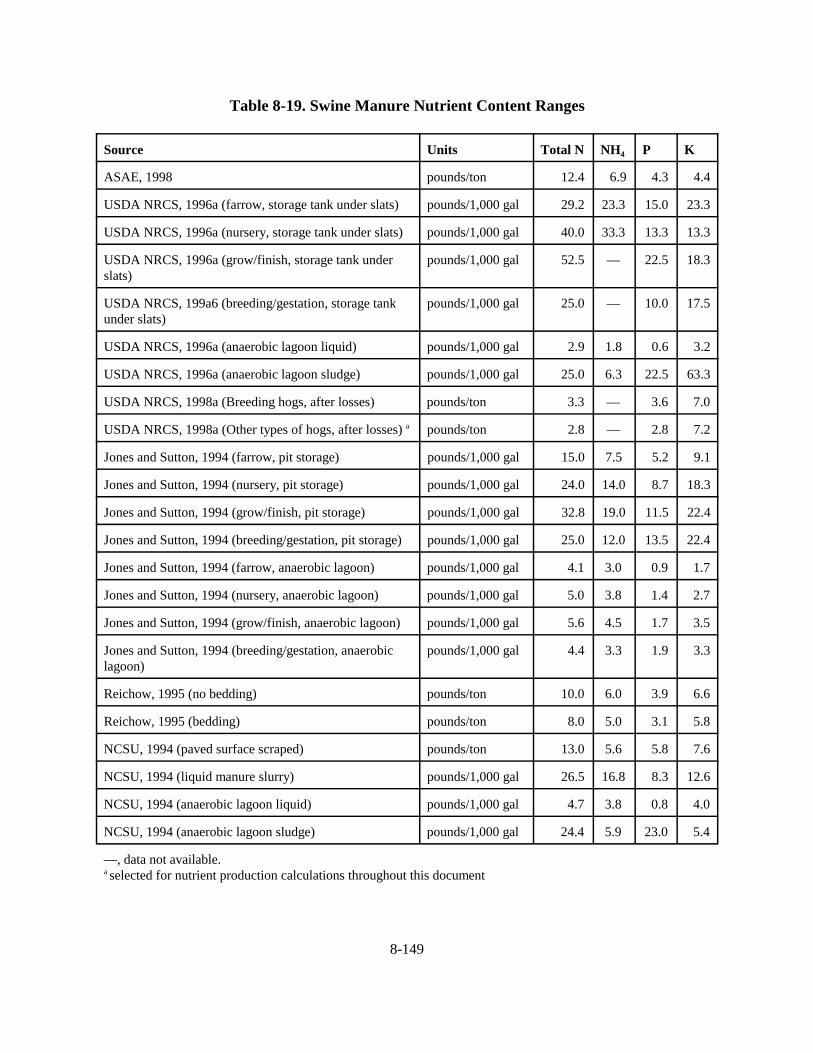
Feeding strategies that reduce nutrient concentrations in waste have been developed for specificanimal sectors, and those for the swine, poultry and dairy industries are presented separately inthe following discussion. The application of these types of feeding strategies to the beef industryhas lagged behind other livestock sectors and is not discussed here.
8.1.1.1 Swine Feeding Strategies
Practice: Precision Nutrition for Swine
Description: Current swine feed rations can result in overfeeding proteins and other nutrients toanimals because they are designed to ensure that nutritional requirements are met and growth ratemaintained. Precision nutrition entails formulating feed to meet more precisely the animals’nutritional requirements, causing more of the nutrients to be metabolized, thereby reducing theamount of nutrients excreted. For more precise feeding, it is imperative that both the nutritionalrequirements of the animal and the nutrient yield of the feed are fully understood.
When swine are fed typical diets, the P use efficiency is on the order of 10 to 25 percent, whilethe N use efficiency is on the order of 30 percent. These figures suggest that swine use thesenutrients very inefficiently. An excess of N in the diet, principally from protein in feed, leads toinefficient utilization of nutrients. Phytate-phosphorus1 (phytate-P), the most common form of Pin feedstuffs (56 to 81 percent), is not well utilized by pigs because they lack intestinal phytase,the enzyme needed to remove the phosphate groups from the phytate molecule. Therefore,supplemental P is added to the diet to meet the pig’s growth requirements, while phytate-P fromthe feed is excreted in the urine, thus increasing P concentrations in the manure. Because somefeedstuffs are high in phytase, and because there is some endogenous phytase in certain smallgrains (wheat, rye, triticate, barley), there is wide variation in the digestibility of P in feedingredients. For example, only 12 percent of the total P in corn is digestible whereas 50 percentof the total P in wheat is digestible. The P in dehulled soybean meal is more available than the Pin cottonseed meal (23 versus 1 percent), but neither source of P is as highly digestible as the P inmeat and bone meal (66 percent), fish meal (93 percent), or dicalcium phosphate (100 percent).
Application and Performance: Lenis and Schutte (1990) showed that the protein content of atypical Dutch swine ration could be reduced by 30 grams per kilogram without negative effectson animal performance. They calculated that a 1 percent reduction in feed N could result in a 10percent reduction in excreted N. Monge et al. (1998) confirmed these findings by concludingthat a 1 percent reduction in feed N yielded an 11 percent reduction in excreted N. According toVan Kempen and Simmins (1997), reducing the variation of nutrients in feed by using moreappropriate quality control measures would reduce N waste by 13 to 27 percent. Experts believethat N losses through excretion can be reduced by 15 to 30 percent in part by minimizingexcesses in diet with better quality control at the feed mill (NCSU, 1998).
8-3
Plant geneticists have produced strains of corn that contain less phytate-P (i.e., low-phytate corn)and are more easily digested than typical strains, resulting in less P excreted in manure. Alleeand Spencer (1998) found that hogs fed low-phytate corn excreted an average of 37 percent lessP in manure, with no adverse effects on animal growth. In a study by Bridges et al. (1995), twoweight classes of grower-finisher pigs (66.1 and 101.7 kg) were given maize-soybean meal dietslower in protein and P to determine the reduction in N and P in pig waste when compared withpigs fed a conventional diet. Total N waste was reduced by 32 percent and 25 percent for the twoweight classes, while total P excretion was reduced by 39 percent and 38 percent, respectively. The study also modeled the impact of reductions in dietary protein and P over the completegrower-finisher period using the NCPIG model developed by the North Central Regional SwineModeling Committee. Model results showed a reduction of approximately 44 percent in total Nand P excretion compared with the conventional diet, with little impact on the time ofproduction. In addition, the Fédération Européenne des Fabricants d’Adjuvants pour laNutrition Animale in Belgium (FEFANA,1992) calculated that the selection of highly digestiblefeedstuffs should result in a 5 percent reduction in total waste.
Advantages and Limitations: Precision feeding results in a higher feed efficiency (less feed usedper pound of pig produced); however, any cost savings are at least partially offset by the cost ofanalyzing the nutrient content of feedstuffs. Consumer reaction to use of genetically modifiedcrops to feed swine has not been determined yet.
Operational Factors: Precision feeding requires that feed manufacturers have the necessaryequipment and procedures to create precision feeds within specified quality control limits. Ingeneral, feed manufacturers have traditionally limited quality control to measuring N, whichcorrelates poorly with amino acid content in feedstuffs (van Kempen and Simmins, 1997). Precision feeding will also increase the costs and complexity of feed storage at the feedingoperation.
Demonstration Status: Data on the frequency of use of precision nutrition are not available. Much of the information available on precision nutrition is derived from small-scale researchexperiments at the USDA and universities.
Practice: Multiphase and Split-Sex Feeding for Swine
Description: Multiphase feeding involves changing diet composition weekly instead of feedingonly two different diets during the period from the 45-kg size to slaughter. Multiphase feeding isdesigned to better match the diet with the changing nutritional requirements of the growinganimals.
Application and Performance: Feeding three or four diets during the grow-finish period insteadof only two diets will reduce N excretion. According to models such as the Dutch Technical PigFeeding Model by van der Peet-Schwering et al. (1993), multiphase feeding reduces N and Pexcretion by 15 percent. The modeling results have been confirmed by animal trials that showed
8-4
a 12.7 percent reduction in N excretion in urine and a 17 percent reduction in P excretion.
Advantages and Limitations: Dividing the growth period into more phases with less spread inweight allows producers to meet more closely the pig’s protein requirements. Also, because gilts(females) require more protein than barrows (males), separating barrows from gilts allows lowerprotein levels to be fed to the barrows without compromising leanness and performanceefficiency in the gilts.
Operational Factors: Multiphase and split-sex feeding require separate feeding areas and pensfor the different types of animals. It is also more costly to produce a different feed every week.
Demonstration Status: The Swine �95 report (USDA APHIS, 1995) showed that 96.2 percent ofgrower/finisher operations fed two or more different diets. Of these operations, 63.4 percentprogressed to a different diet based on animal weight, 5.3 percent changed diets based on eitherage or the length of time on the feed, and 30.0 percent based diet changes on equal considerationof weight and time. Of the 96.2 percent of grower-finisher operations that feed more than onediet, 18.3 percent practiced split-sex feeding. Split-sex feeding is used much more frequently inmedium (2,000-9,999 head) and large operations (10,000+ head) than in small operations (lessthan 2,000 head).
Practice: Improved Feed Preparation for Swine
Description: Milling, pelleting, and expanding are examples of technological treatments thatimprove the digestibility of feeds. By reducing the particle size, the surface area of the grainparticles is increased, allowing greater interaction with digestive enzymes. NCSU (1998)reported that the industry average particle size was approximately 1,100 microns and that therecommended size is between 650 and 750 microns. Expanders and extruders are used mainly toprovide flexibility in ingredient selection and to improve pellet quality rather than to improvenutrient digestion.
Application and Performance: As particle size is reduced from 1,000 microns to 700 microns,excretion of N is reduced by 24 percent. Vanschoubroek et al. (1971) reviewed many articlesregarding the effect of pelleting on performance and found that not only did animals preferpelleted feed over mash feed, but feed efficiency improved by 8.5 percent and proteindigestibility improved by 3.7 percent with pelleted feed.
Advantages and Limitations: Although reducing particle size less than 650 to 750 microns canincrease feed digestibility, it also increases greatly the costs of grinding and reduces thethroughput of the feed mill. Smaller-sized particles can also result in an increased incidence ofstomach ulcers in animals. In some cases, chemical changes resulting from the high temperaturescreated in grinding machines may decrease feed digestibility.
8-5
Operational Factors: A reduction in the particle size of the feed might result in manure withfiner solids particles. This may affect the performance of manure management practices,including possible effects on the efficiency of manure solid-liquid separators.
Demonstration Status: Data on the frequency of use of feed preparation techniques are notavailable.
Practice: Feed Additives for Swine
Description: Enzymes are commonly used in feed to improve the digestibility of nutrients. Forexample, plant P is often present in the form of phytate, which is digested poorly in swine,resulting in most of the P in feedstuffs being excreted in the manure. To prevent P deficiency,digestible P is added to swine rations, resulting in even more P in the manure. The enzymeadditive phytase has been shown to improve P digestibility dramatically, and can be used toreduce the need for digestible P additives.
Other enzyme additives facilitate the retention of amino acids and digestive fluids, decreasing theamount of N excreted. Enzymes such as xylanases, beta-glucanases, and proteases upgrade thenutritional value of feedstuffs. Xylanases and beta-glucanases are enzymes used to degradenonstarch polysaccharides (NSP) present in cereals such as wheat and barley. Swine do notsecrete these enzymes and therefore do not have the capability to digest and use NSP. Becausethe NSP fraction traps nutrients that are released only upon partial degradation of the NSPfraction, addition of xylanase or beta-glucanase or both to cereal-containing diets can result inimprovements in both digestibility and feed efficiency. In addition, supplementing the diet withsynthetic lysine to meet a portion of the dietary lysine requirement is an effective means ofreducing N excretion by pigs. This process reduces N excretion because lower-protein diets canbe fed when lysine is supplemented. The use of other amino acid feed supplements is beingtested.
Application and Performance: Mroz et al. (1994) showed that phytase increases P digestibilityin a typical swine diet from 29.4 percent to 53.5 percent. They also demonstrated that phytaseaddition improved the digestibility of other nutrients in the feed such as calcium, zinc, and aminoacids that are bound by phytase. For example, the addition of phytase to a commercial dietincreased the digestibility of lysine by 2 percent while the digestibility of protein improved from83.3 to 85.6 percent. Van der Peet-Schwering (1993) demonstrated that the use of phytasereduced P excretion by 32 percent in nursery pigs (a finding similar to the FEFANA [1992]predictions). Lei et al. (1993) found that feeding pigs 750 phytase units per gram of basal dietyielded a decrease in fecal P excretion of 42 percent without adverse health effects. Thisaddition resulted in a linear improvement in phytate-P utilization. Graham and Inborr (1993)reported that enzyme additions improved the digestibility of protein in a wheat/rye diet by 9percent.
Beal et al. (1998) used proteases on raw soybeans and observed a significant improvement indaily gain (+14.8 percent); feed efficiency, however, was improved by only 4.3 percent. Dierick
8-6
and Decuypere (1994) saw a substantial improvement in feed efficiency when using proteases incombination with amylases and beta-glucanases, an improvement larger than that achieved witheach enzyme individually. Studies have shown that protein levels can be reduced by 2 percentwhen the diet is supplemented with 0.15 percent lysine (3 pounds lysine-HC1 per ton of feed)without harming the performance of grower-finisher pigs.
Advantages and Limitations: Feed additives, especially synthetic amino acids and enzymes,increase the cost of feeding. Phytase, for example, was once too expensive to use as a feedadditive. This enzyme can now be produced at lower cost with recombinant DNA techniques. As technology improves, it is likely that the costs associated with other feed additives willdecrease similarly.
Operational Factors: The level of phytase required in swine feed varies with the age of theanimal. These different levels are likely determined by the development of digestive enzymesand intestines of the pig, with the younger pig being less developed. Lysine supplements can beused to achieve even greater reductions in the level of protein in diets, but only if threonine,tryptophan, and methionine are also supplemented.
Demonstration Status: The use of proteases in animal feeds is not widespread because ofconflicting results from trials. With the advancement of enzyme-producing technology, as wellas a better understanding of the role of enzymes in animal nutrition, proteases and other enzymes(e.g., pentosanases, cellulase, and hemicellulases, as tested by Dierick, 1989) are likely to play agreater role in animal nutrition. As their costs come down, the Amino Acid Council foresees anincreased use of synthetic amino acids as a method of reducing N excretion as well as improvinganimal performance and decreasing feeding costs.
8.1.1.2 Poultry Feeding Strategies
Poultry operators have traditionally employed feeding strategies that focus on promoting animalgrowth rates or maximizing egg production. Feed additives have also been used to preventdisease and enhance bone and tissue development. As noted in Chapter 4, productivity hasincreased dramatically over the past several decades. The decrease in the average whole-herdfeed conversion ratio (pounds of feed per pound of live weight produced) has translated intoreduced feed input per bird produced. Smaller feed requirements can mean decreased manureoutput, but, until recently, development of better feeding strategies and advances in genetics havenot focused on manure quality or quantity generated. Environmental issues associated withanimal waste runoff have compelled the poultry industry to look for improved methods of wasteprevention and management, including feeding regimes that can reduce the nutrient content ofmanure.
Dietary strategies to reduce the amount of N and P in manure include developing more precisediets and improving the digestibility of feed ingredients through the use of enzyme additives andgenetic enhancement of cereal grains.
2As noted in Chapter 4, some experts believe phytase should not be provided to poults because of theenzyme’s adverse effect on bone development in turkeys, while other experts believe it will enhance growth.
8-7
Practice: Precision Nutrition for Poultry
Description: Precision nutrition entails formulating feed to meet more precisely the animals’nutritional requirements, causing more of the nutrients to be metabolized, thereby reducing theamount of nutrients excreted. For more precise feeding, it is imperative that both the nutritionalrequirements of the animal and the nutrient yield of the feed are fully understood. Greaterunderstanding of poultry physiology has led to the development of computer growth models thattake into account a variety of factors, including strain, sex, and age of bird, for use inimplementing a nutritional program. By optimizing feeding regimes using simulation results,poultry operations can increase growth rates while reducing nutrient losses in manure.
Application and Performance: The use of improved feeds tailored to each phase of poultrygrowth has improved productivity significantly. Feed conversion ratios for broilers and turkeyshave decreased steadily over the past several decades. Egg production productivity has also beenboosted as operators have introduced improved nutrient-fortified feed.
Advantages and Limitations: Improved precision in feeding strategies offers numerousadvantages, including reduction of nutrients in animal manure and better feed conversion rates. Improved formulations are also cost-effective and reduce the probability of wasteful overfeedingof poultry.
Operational Factors: Precision nutrition requires detailed knowledge of poultry nutritionalrequirements and maintenance of detailed records to ensure that dietary adjustments areperformed in a timely manner to maximize growth potential.
Demonstration Status: The use of precise nutrient formulations has already generated largeincreases in productivity in the poultry sector. Many of the poultry operations are under contractand receive feedstuffs with precise formulations from the integrator. Ongoing research willlikely continue to result in productivity improvements.
Practice: Use of Phytase as a Feed Supplement for Poultry
Description: Phosphorus, an essential element for poultry growth and health, is typically addedto poultry feed mixes. However, because poultry are deficient in the enzyme phytase and cannotbreak down the protein phytate, much of the P contained in feed cannot be digested (Sohail andRoland, 1999). Because poultry cannot produce phytase, up to 75 percent of the P contained infeed grains is excreted in manure (NCSU, 1999).
One feeding strategy used by poultry operators to reduce P levels in manure is to add microbialphytase to the feed mix.2 This enzyme is produced by a genetically modified fungus, Aspergillus
8-8
niger. The final enzyme product is usually available in two forms, a powder or a liquid (Miller,1998). The phytase enzyme reduces P excretion by releasing the phytate-P contained in the cellwalls of feed grains. The released P can then be absorbed by the bird’s intestine and used for itsnutrient value. A secondary beneficial effect of using phytase is that manure P content is furtherreduced because less inorganic P needs to be added to poultry diets (Edens and Simons, 1998).
Application and Performance: Phytase can be used to feed all poultry. Phosphorus reductions of30 to 50 percent have been achieved by adding phytase to the feed mix while simultaneouslydecreasing the amount of inorganic P normally added (NCSU, 1999).
Advantages and Limitations: Addition of phytase to feed significantly reduces P levels in poultrymanure. The high cost of phytase application equipment has discouraged more widespread use.
Operational Factors: Because phytase is heat-sensitive, it must be added to broiler and turkeyfeeds after the pelleting process (NCSU, 1999). The phytase is added by spraying it on the feed.This can result in uneven distribution and variable doses. Studies have shown that phytaseefficacy is related to calcium, protein, and vitamin B levels in a complex manner. Further,phytase efficacy can be degraded by excess moisture, which can be a problem if mash (wet) feedis used for broilers (Miller, 1998). The shelf life of phytase is usually not a problem, becausefeed is typically consumed within 2 weeks or less at most operations.
Demonstration Status: Phytase is in use at many poultry operations. Application equipment foradding phytase to large volumes of feed is undergoing field testing.
Practice: Genetically Modified Feed for Poultry
Description: Using genetically modified animal feed offers poultry operators another way toreduce P levels in bird manure. In 1992, a research scientist at the USDA Agricultural ResearchService developed a nonlethal corn mutant that stored most of its seed P as P rather than asphytate. The total P content in the mutant corn was the same as that found in conventional corn,except that there was a 60 percent reduction in phytic acid. The P released by the reduction inphytic acid P becomes available to the consuming animal as inorganic P (Iragavarapu, 1999).
Application and Performance: Genetically modified feed can be used for all poultry types. Thepotential for reducing P levels is quite large. One variety of corn with a high available P contenthas 35 percent of the P bound in the phytate form compared with 75 percent for normal corn(NCSU, 1999). Recent tests of a new hybrid corn, developed by USDA and the University ofDelaware, demonstrated a 41 percent decrease in P levels in manure. Soluble P levels in wastedecreased by 82 percent, compared with the amount produced by poultry fed a standardcommercial diet (UD, 1999).
Advantages and Limitations: New hybrid varieties of grain can increase poultry utilization ofplant P. Adding phytase to the modified feed further reduces manure P levels and can eliminate
8-9
the need for nutrient supplements. The increased cost of feed and phytase additives might limittheir use.
Operational Factors: The use of genetically modified feed would not differ from the use ofconventional feed, although the increase in available nutrients in the feed would diminish theneed for supplements.
Demonstration Status: Since its discovery in 1992, the mutant corn has been made available tocommercial companies for further research, development, and commercialization of hybridgrains. Some hybrid varieties are currently used; others are in the research or demonstrationstage. As more of these products are developed and prices are lowered, the use of hybrid grainscombined with enzyme additives will likely increase.
Practice: Other Feeding Strategies to Reduce Nutrient Excretion for Poultry
Poultry operators use additives other than phytase to reduce manure nutrient content. Theseadditives include synthetic amino acids and protease, and they are designed to facilitate moreefficient digestion of N compounds and allow the use of smaller proportions of nutrients in feedwhile not adversely affecting animal growth rates and health. Researchers have alsodemonstrated that feed enzymes other than phytase can boost poultry performance and reducemanure production (Wyatt, 1995). Enzymes currently added to barley and wheat-based poultryfeed in Britain and Europe include xylanases and proteases. Currently, the use of additives suchas synthetic amino acids and enzymes could significantly increase feed costs. These costs,however could be expected to decrease over time as the technology matures and is more widelyused by animal feed operators.
8.1.1.3 Dairy Feeding Strategies
Feeding strategies to reduce nutrient losses from dairy operations, primarily N and P, are focusedon improving the efficiency with which dairy cows use feed nutrients. A more efficient use ofnutrients for milk production and growth means that a smaller portion of feed nutrients ends upin manure. Elimination of dietary excesses reduces the amount of nutrients in manure and isperhaps the easiest way to reduce on-farm nutrient surpluses (Van Horn et al., 1996). Reducingdietary P is the primary practice being used; however, a number of related management strategiesalso reduce nutrient levels in the manure by increasing the efficiency with which dairy cows usefeed nutrients. These strategies include measuring the urea content of milk, optimizing feed cropselection, and exposing cows to light for a longer period of the day.
Practice: Reducing Dietary Phosphorus (P) for Dairy Cattle
Description: Reducing the level of P in the diets of dairy cows is the primary and most importantfeeding strategy for reducing excess nutrients given (1) P’s central role as a limiting nutrient inmany soils, (2) evidence indicating that dairy operators, as a whole, are oversupplying P in dairydiets, and (3) the N-P imbalance in cow manure, which favors reductions of P to produce a more
8-10
balanced fertilizer. Reducing the amount of P in dairy diets has also been shown to reduceproduction costs and increase overall profitability.
The latest edition of the National Research Council’s (NRC) nutrient requirements for dairy cowsrecommends dietary P levels of 0.36 to 0.40 percent of dry matter for high-producing dairy cowsin lactation (NRC, 1989). Dietary P in excess of these requirements has been shown to have nobeneficial effect on animal health or production. Most excess P passes through the cows’systems and is excreted as manure, which is later applied to land. Rations, however, typicallyaverage 0.50 percent P or more (Knowlton and Kohn, 1999). Supplemental feeding of dicalciumphosphate–often the second most expensive component in dairy cow diets–is the usual practiceby which a dairy cow’s rations achieve this level. A number of studies have addressed theadequacy of current dietary P recommendations. These studies include Steevens et al., 1971;Tamminga, 1992; McClure, 1994; and Chase, 1998.
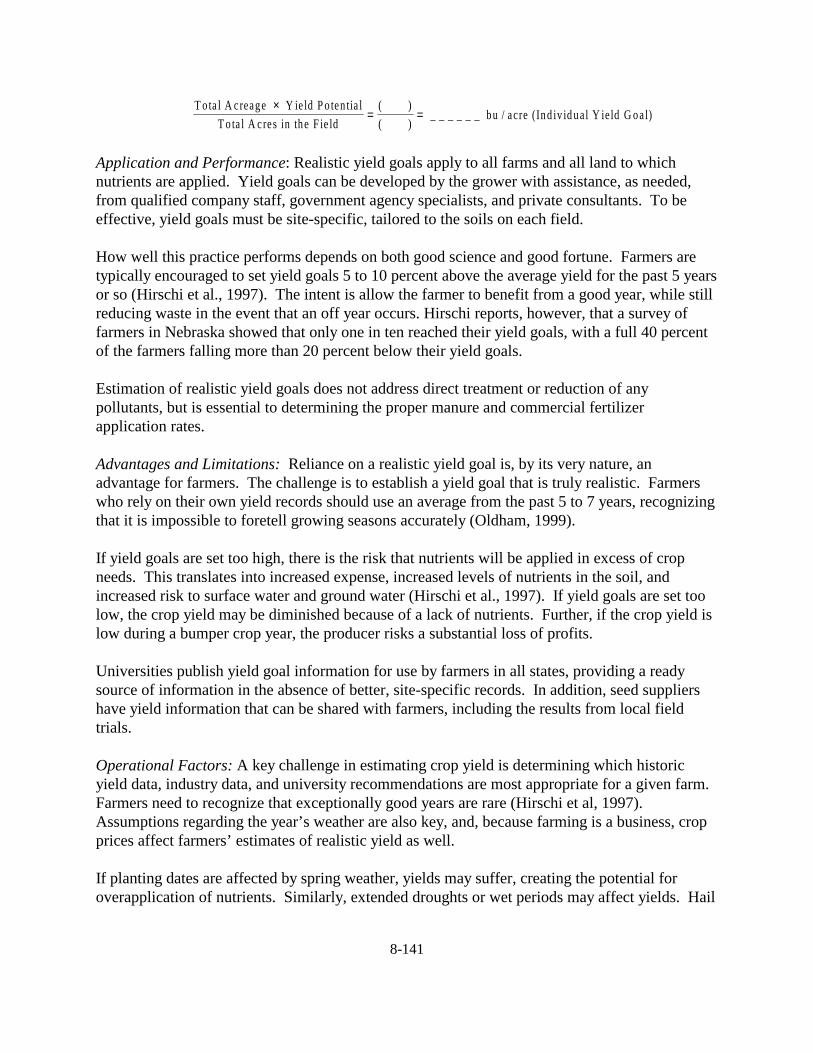
Application and Performance: This practice should be applicable to all dairy operations. Theamount of manure P resulting from a given level of dietary P is estimated using the followingequation (Van Horn, 1991):
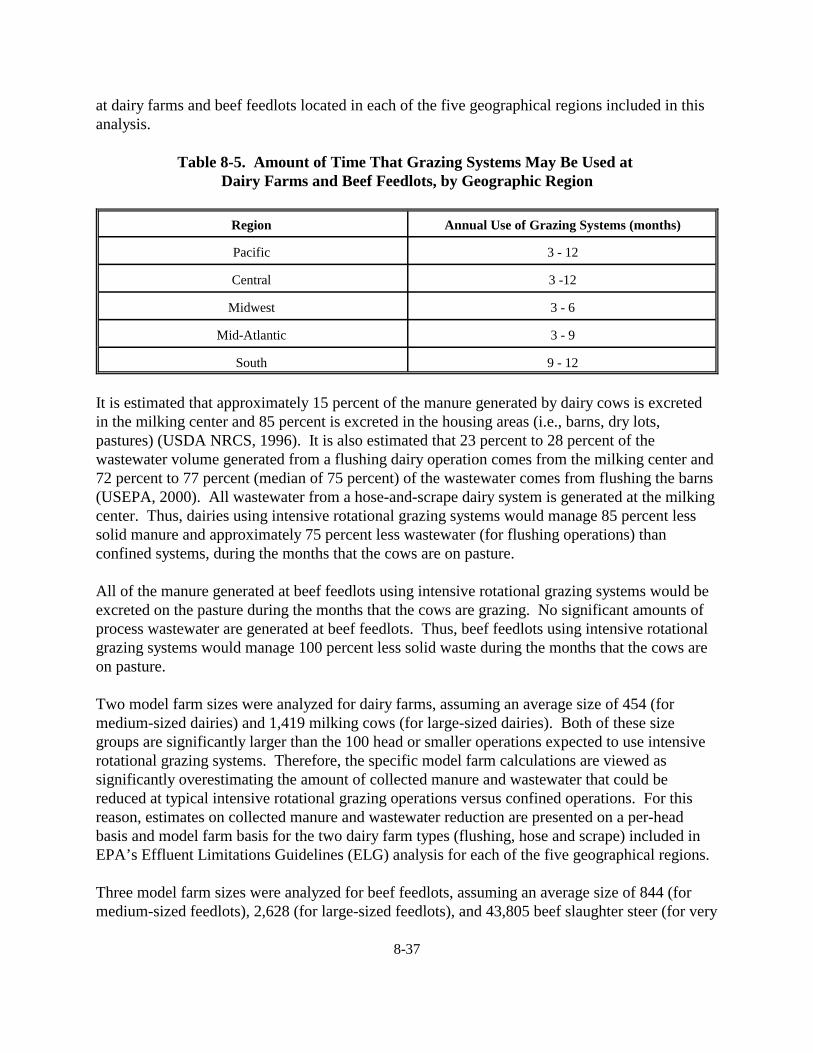
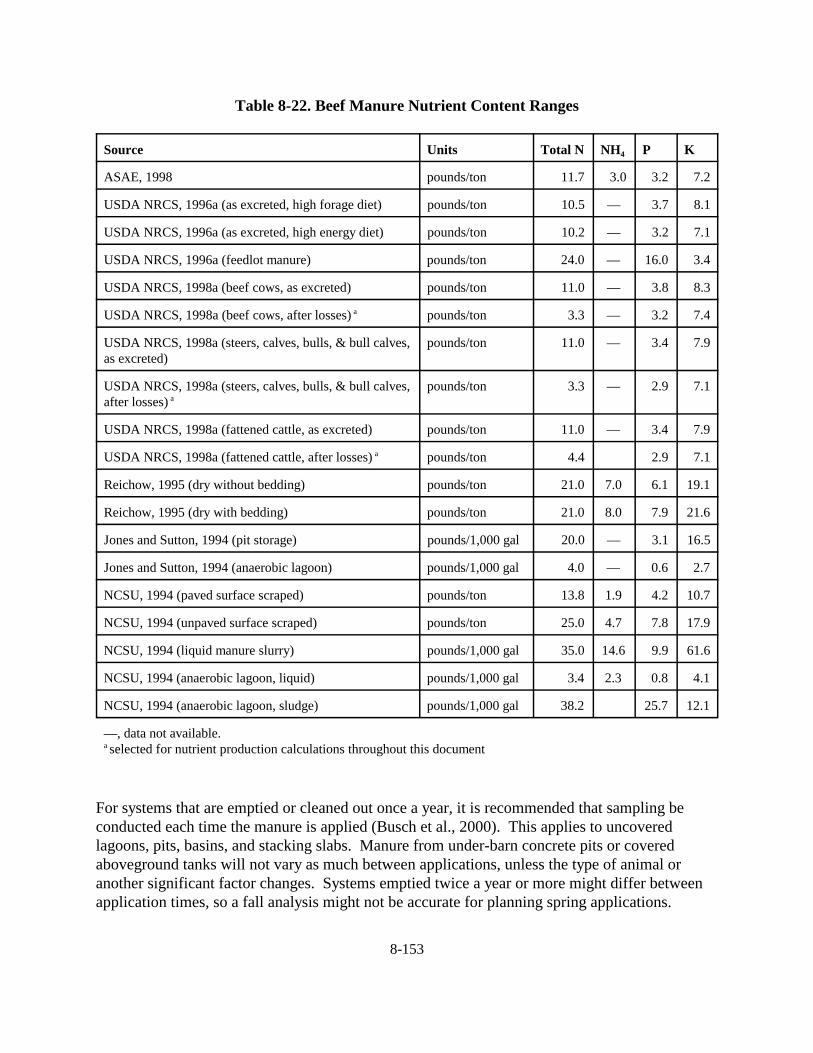
Manure and intake P are measured in grams, and milk production is measured in kilograms. Based on this formulation, assuming that each lactating cow produces 65 pounds of milk a day,Table 8-1 quantifies reductions in manure P resulting from reduced P intake (Keplinger, 1998). Four scenarios are considered: a 0.53 percent P diet, which is considered the baseline, and threereduced P diet scenarios. Comparing the 0.40 percent scenario against the baseline, P intakeduring lactation is reduced by 25 percent, while manure P is reduced by 29 percent. During theentire lactation period, manure P is reduced by 14.63 pounds per cow from the baseline level of50.45 pounds per cow. For the entire year (lactation and nonlactation periods), manure P percow is reduced by 27 percent.
Table 8-1. Per Cow Reductions in Manure P Resulting from Reduced P Intake During Lactation
Percentage of Pin Diet
Daily Manure P (lb) Reduction from Baseline (0.53%)
Advantages and Limitations: Supplemental feeding of dicalcium phosphate to dairy cowsrepresents a substantial expense to dairy farmers–the second most expensive nutrient in a herd’smixed ration (Stokes, 1999). The economic advantages of reducing supplemental P, based on astudy on the Bosque River watershed of Texas (Keplinger, 1998), suggest that a dairy operatorwho adopts a 0.40 percent P diet compared with the baseline 0.53 percent diet would save $20.81per cow annually. A survey of scientific literature on the subject reveals no adverse impact oneither milk production or breeding from reducing dietary P to NRC-recommended levels.
Another advantage to producers is the impact of reduced manure P on land application practices. Many states incorporate a P trigger in manure application requirements. For example, in Texas,state regulation requires waste application at a P rate (versus an N rate) when extractable P in thesoil of an application field reaches 200 parts per million (ppm). Applying manure with a lower Pconcentration would slow and possibly eliminate the buildup of P in application fields, therebydelaying or eliminating the need to acquire or transform more land into waste application fields. When manure is applied at a P rate, greater quantities can be applied if it contains a lower Pconcentration. Thus, application fields would require less chemical N, because manure withlower P concentrations is a more balanced fertilizer. In addition, reduced land requirements forwaste application fields would represent substantial savings to dairy producers in cases in whicha P application rate is followed.
Operational Factors: It is possible that factors such as climate, temperature, and humidity, aswell as operation-specific factors, influence the effectiveness of steps taken to reduce dietary P;however, there are no published studies that address this issue. Dairy cows, for instance, aremore prone to disease in moist climates and suffer heat stress in hot climates. Average milkproduction per cow varies greatly across geographic regions of the United States–averaging21,476 pounds in Washington state versus only 11,921 pounds in Louisiana (USDA, 1999). Because dairy cow productivity and health are influenced by climate, it is likely that climate mayalso influence the effectiveness of nutrient reducing feeding strategies, particularly those whichdepend on productivity gains. The magnitude and even the direction of the influence of factorssuch as temperature, humidity, and the like on nutrient-reducing feeding strategies, however,have not been established.
Demonstration Status: Dairy rations typically average 0.50 percent P or more (Knowlton andKohn, 1999), much higher than the NRC recommendation of 0.40 percent. A survey of milkproducers in north Texas by a milk producers’ organization indicated dietary P averaged 0.53percent. A 1997 survey of professional animal nutritionists in the mid-south region (Sansinena etal., 1999), indicates nutritionists’ recommendations of dietary P averaged 0.52 percent, or 30percent higher than the high end of NRC’s current recommendation. Survey respondents citedseveral reasons for recommending final ration P in excess of NRC standards: “Almost half of therespondents (15 of 31) expressed a belief that lactating cows require more P than suggested bythe NRC” (Sansinena et al., 1999). The next most prevalent reason given was that a safetymargin was required. Justifications for the safety margin included a lack of confidence inpublished ingredient P values and concern for variable P bioavailability in feed ingredients. Professional opinion also suggests that dietary P in dairy cow diets averages around 0.52 percent
8-12
throughout the nation, although this percentage may be declining. Because of the heightenedawareness of both the environmental benefits and the cost savings attainable by reducing P indairy cow diets, some operators have adopted the NRC recommendation. Recent articles in dairytrade magazines have recommended adoption of the NRC standard for both environmental andeconomic benefits.
Practice: Milk Urea N Testing for Dairy Cattle
Description: There have been significant developments recently in the use of milk urea N (MUN)as a method for testing and fine-tuning dairy cow diets for protein feeding. Measured MUNconcentrations are used as a proxy for the nutritional well-being of the cow.
Research has shown that mean MUN concentration levels from a group of cows should fall intospecific ranges. By comparing the results of MUN tests with these ranges, the tests can be usedas a monitoring tool to evaluate a herd’s protein nutritional status. For cows fed at optimal drymatter intake, expected mean values of MUN concentrations range from 10 to 14 milligrams perdeciliter (mg/dL) (Ferguson, 1999; Jonker et al., 1998). Field studies of MUN levels of dairyherds in Pennsylvania (using a very large sample–312,005 samples) have reported average MUNconcentrations of 14 mg/dL (Ferguson, 1999). Implicit in this level is that even allowing for theinherent large variability of MUN testing, the diets of some herds contain excess MUN levelsthat have no economic value; this also suggests that N in manure can be reduced by reducingexcess N in dairy diets. The importance of reducing dietary protein levels is highlighted in astudy (Van Horn, 1999) that estimates that for every 1 percent reduction in dietary protein,excretion of N may be reduced by 8 percent.
Application and Performance: This practice should be applicable to all dairy operations. Theelimination of excess dietary protein with the use of the MUN test to evaluate protein levels indairy cow feeds could reduce N levels in manure by 6 percent (Kohn, 1999). In addition, furthermethods to improve N utilization in dairy cows and raise the efficiency of feed delivery may berevealed by MUN testing.
Advantages and Limitations: Through MUN testing and the evaluation of other variables,farmers can identify which cows are eating too much protein, and fine-tune diets, therebyreducing N output in manure. Advantages of MUN testing are the possibilities of reducing rationcosts by eliminating excess protein and improving the efficiency of feed delivery (Kohn, 1999). A disadvantage of animal group feeding strategies is that they become more difficult to set upand manage as group size decreases. The cost-effectiveness of custom feeding individual cows isas yet unproven.
Operational Factors: The large variability within and between herds and breeds of cows limitsthe usefulness of MUN testing, but it does not reduce the test’s important role as a monitor ofration formulation.
8-13
Demonstration Status: This practice is primarily at the research stage and has not becomewidespread.
Practice: Diet Formulation Strategies for Dairy Cows
Description: Diet formulation strategies have received new examination. Alternative dietformulations to the NRC recommendations–notably the Cornell Net Carbohydrate and Proteinmodel (CNCPS) (Sniffen et al., 1992)–that are more complicated than the NRCrecommendations have been developed and they suggest feeding about 15 percent less protein toa herd at the same level of production for certain conditions (Kohn, 1996). Evaluations of theCNSPS model’s performance have been mixed, and further research is needed. Thus, theCNCPS is not currently recommended for routine diet formulation.
Theoretically, protected amino acid supplements have the potential to be part of an importantstrategy in increasing the efficiency of protein use by dairy cows, thereby reducing N losses. Ifamino acid supplements can be made effectively for dairy cows (avoiding rumen-associatedproblems), they could replace large portions of a dairy cow’s protein intake. In theory, protectedamino acid supplements could significantly reduce N intake and hence N levels in manure. Inpractice, the benefits of using protected amino acid supplements may not be as dramatic becausethe need to balance diet formulations may create limitations.
Application and Performance: This practice should be applicable to all dairy operations. Someevaluation of the alternative diet formulation suggested by the CNCPS implies a significantincrease in milk production (from 24,100 pounds/cow per year to more than 26,000 pounds/cowper year) and a large reduction in N excretion (of about one-third) (Fox et al., 1995). More recentevaluations using two different large data sets (Kalscheur et al., 1997; Kohn et al., 1998) presentmixed results, with the CNCPS performing better in some aspects and the NRCrecommendations in others. Thus, results of the CNCPS evaluation should be consideredpreliminary. In theory, the use of protected amino acid supplements has great potential toimprove nutrient efficiency. A typical lactating cow is assumed to require 1.1 pounds per day ofN intake; by successfully substituting protected methionine and lysine for feed protein, this Nintake and resulting manure N could be dramatically reduced (Dinn et al., 1996), but this researchis preliminary.
Advantages and Limitations: Alternative diet formulations could improve nutrient efficiency. Information on limitations is unknown at this time, and EPA is continuing research in this area.
Operational Factors: The cost of preparing and storing multiple feed stuffs limits the use of thispractice to the number of diets that the operator feels justifies the additional expense. Additionalresearch on this practice is needed.
Demonstration Status: This practice is primarily at the research stage and has not becomewidespread.
8-14
Practice: Animal Feed Grouping for Dairy Cows
Description: Grouping strategies offer another method of realizing gains in nutrient efficiency. When grouping does not occur and the whole herd receives the same diet, cows may receivesuboptimal diets and nutrient export to manure may be greater. Using grouping strategies to theirgreatest effect to improve nutrient efficiency would entail individualized diets. Feedingstrategies already reviewed, such as the MUN concentration test, can be used in conjunction withgrouping strategies or individual diets.
Application and Performance: This practice should be applicable to all dairy operations.Grouping strategies have been shown to reduce nutrient intakes and manure nutrients. When allthe lactating cows are fed together according to current recommendations, they consume 7percent more N and P, and 10 percent more nutrients are excreted in manure, compared with theindividualized feeding strategy. Half of the gains of individualized diets could be achieved withtwo groups (Dunlap et al., 1997).
Advantages and Limitations: This practice could improve nutrient efficiency. Information onlimitations is unknown at this time, and EPA is continuing research in this area.
Operational Factors: As noted under diet formulation strategies, the cost of preparing andstoring multiple feedstuffs limits the use of this practice to the number of diets that the operatorfeels justifies the additional expense. Additional management input is also required in separatingthe animals into groups.
Demonstration Status: Dairy operations currently employ a range of grouping strategies (fromno grouping to individual diets) to improve the efficiency of feed nutrients.
Practice: Optimizing Crop Selection
Description: Optimizing crop selection is another potential strategy for reducing nutrient lossesin combination with dairy diets to meet annualized herd feed requirements with minimal nutrientlosses. In whole-farm simulation of various crop strategies (corn silage, alfalfa hay, and a 50:50mixture) the 50:50 mixture was judged to have performed best (when evaluated by N losses perunit of N in milk or meat) (Kohn et al., 1998). Converting dairy operations from confined topasture operations is also considered a strategy for reducing nutrient loss on a per cow oroperation basis. Kohn’s model, however, found that a strategy of grazing versus confinement forlactating cows produced higher N loss per unit of milk produced because the decline in milkproduction was greater than the decline in manure nutrients (Kohn et al., 1998).
Application and Performance: This practice should be possible at operations that have sufficientland. In simulation of crop selection strategies involving whole-farm effects, mixed alfalfa hayand corn silage (50:50) was judged the best strategy for minimizing nutrient flows from the farm. N losses were minimized to 2.9 units for every unit of N in meat or milk, compared with a loss of
8-15
3.5 units in the corn-based strategy, a 21 percent reduction (Kohn, 1999). Phosphorusaccumulations did not tend to vary among the different strategies.
Advantages and Limitations: Optimal crop selection based on whole-farm effects suggests thatthe strategy that was most nutrient efficient in terms of N loss per unit of N in meat and milk isalso the strategy that gains the most productivity from N; this strategy might, therefore, be themost cost-effective (Kohn et al., 1998). A grazing (versus confinement) strategy may or may notbe cost-effective depending on the structure of individual dairy operations.
Operational Factors: Unknown at this time.
Demonstration Status: This practice is primarily at the research stage and has not come intowidespread use.
Practice: Increasing Productivity
Description: The literature suggests that there are several feeding strategies that focus onincreasing productivity as a route to nutrient efficiency. While the focus is on increased milkproduction, an important associated benefit of these strategies is that they result in greater milkproduction per unit of nutrient excreted. One approach involves exposing dairy cows to light forlonger daily periods of the day through the use of artificial lighting. A longer daily photoperiod(18 hours light/6 hours dark) increases milk yields relative to those of cows exposed to thenatural photoperiod (Dahl et al., 1996).
Application and Performance: This practice should be applicable at all operations that confinetheir animals. The artificial lighting technology to extend the daily photoperiod of dairy cows to18 hours a day has been shown to be effective in increasing the nutrient efficiency of the farm. For an increase in milk production of 8 percent the herd’s feed nutrients would be required toincrease by only 4.1 percent, and N and P excretions would rise by only 2.8 percent whencompared versus a typical herd without artificial lighting (Dahl et al., 1996, 1998).
Advantages and Limitations: The artificial lighting technology is expected to be cost-effective. Itis estimated that the initial investment in lighting can be recouped within 6 months. Oneobserved advantage of milking three times a day rather than twice a day is that it reduces stresson the herd (Erdman and Varner, 1995). Because of the increased labor involved, the economicadvantage of milking three times a day is variable and dependent on the individual farm (Culottaand Schmidt, 1988).
Operational Factors: To use this practice many dairy operations would need to install andoperate additional lights.
Demonstration Status: This practice is primarily at the research stage and has not come intowidespread use.
8-16
8.1.2 Reduced Water Use and Water Content of Waste
This section presents practices that reduce the water content in the waste stream. The productionof a drier waste can be accomplished by three methods: (1) handling the waste in a dry form, (2)reducing the use of water at the AFO, or (3) separating the solid fraction of the waste from theliquid fraction. Most poultry operations currently handle their waste in a dry form, and thissection does not apply to them.
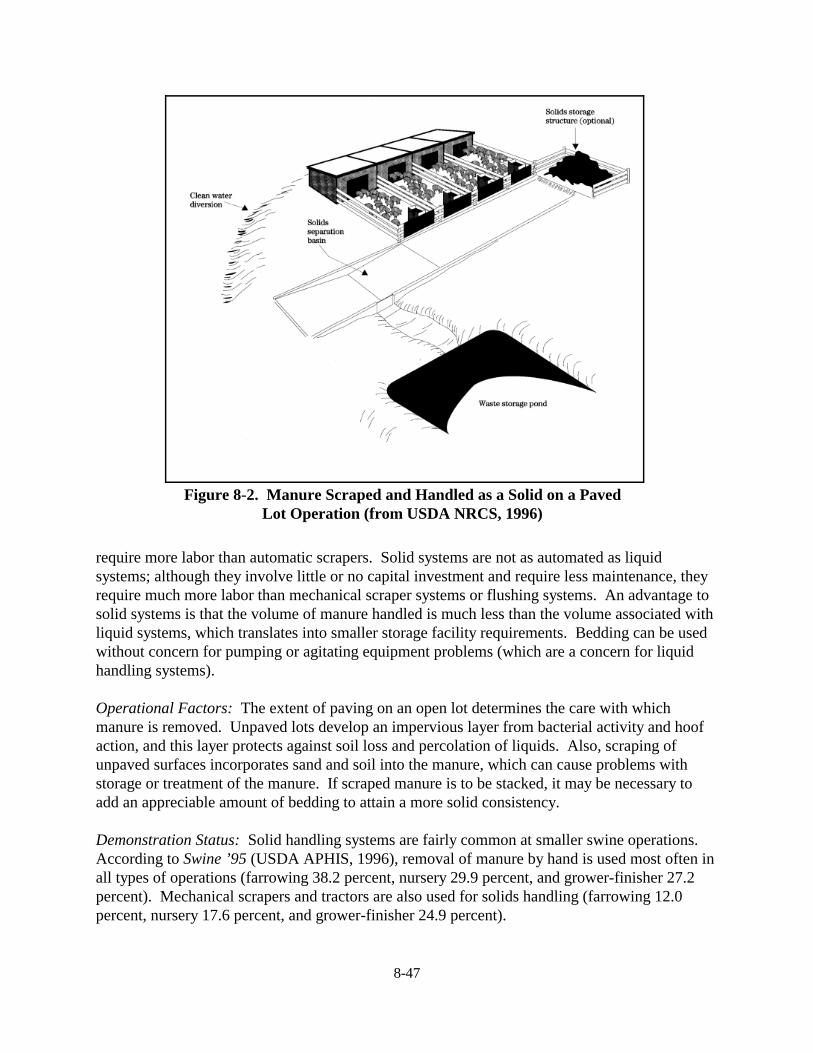
Practice: Dry Scrape Systems and the Retrofit of Wet Flush Systems
Description: Scraper systems are a means of mechanically removing manure, and they can beused to push manure through collection gutters and alleys similar to those used in flush systems. For best results, scrapers should have a minimum depth of 4 inches in open gutters and 12 to 24inches in underslat gutters (MWPS, 1993).
Retrofitting a wet flush system with a dry scrape system involves reconstructing the existingmanure handling equipment within a livestock housing structure. A scraper blade replacesflowing water as the mechanism for removing manure from the floor of the structure.
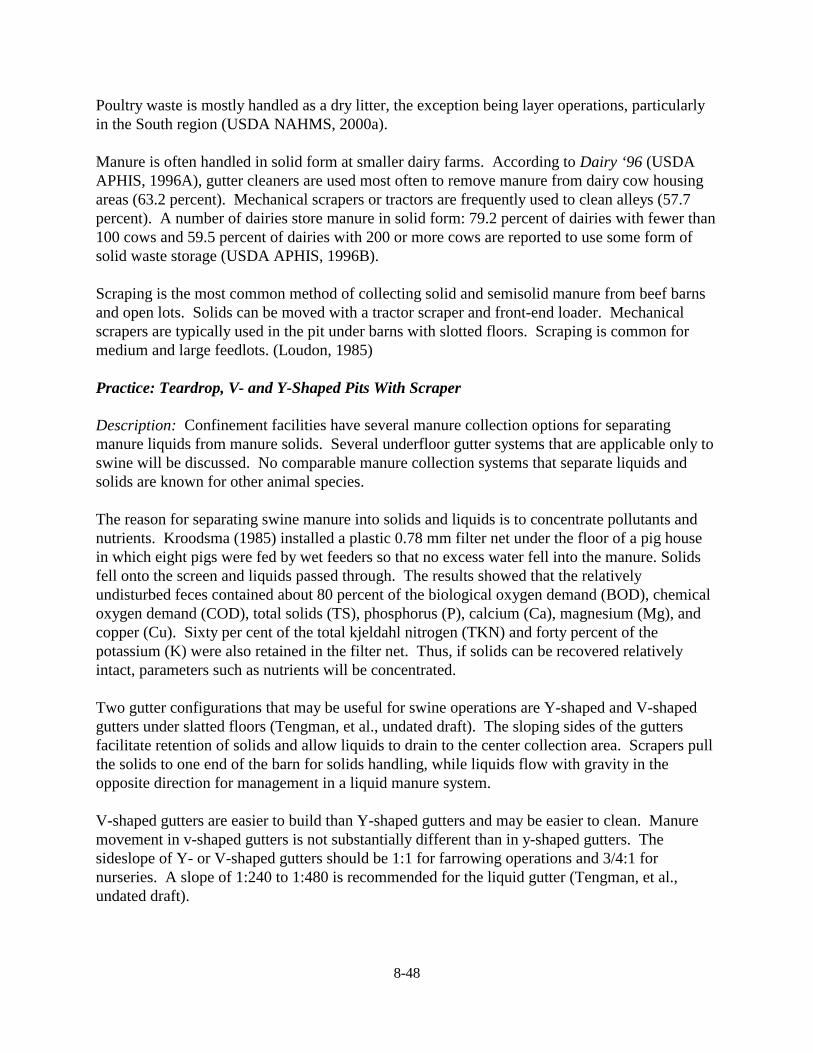
In flush systems, large volumes of water flow down a sloped surface, scour manure from theconcrete, and carry it to a manure storage facility. There are three basic types of flush systems:underslat gutters, narrow-open gutters, and wide-open gutters or alleys. Underslat gutters areused primarily in beef confinement buildings and swine facilities in which animals are housed onslats to prevent disease transmission as a result of animals coming into contact with feces. Narrow-open gutters are typically less than 4 feet wide and are used predominately in hogfinishing buildings. Wide-open gutters or alleys are most often seen in dairy freestall barns,holding pens, and milking parlors. The water used in a flush system can be either fresh orrecycled from a lagoon or holding basin (Fulhage et al., 1993; MWPS, 1993).
Application and Performance: Removing manure with a scraper is appropriate for semisolid andslurry manure, as well as drier solid manure. The flush system is an appropriate means ofremoval for both semisolid and slurry manure. Retrofitting a flush system to a scraper systemappears to be most feasible in underslat gutters and wide alleys. A major concern to be addressedis the discharge area of the scraper. Existing collection gutters, pumps, and pipes used in a flushsystem will likely be inadequate for handling the undiluted manure product.
Replacing a flush system with a dry scrape system dramatically reduces the amount of water usedin manure handling and also reduces the tonnage of manure by decreasing dilution with water. There are several options for storing manure from a scrape system, including prefabricated orformed storage tanks, from which contaminants are less likely to seep.
Retrofitting a flush system with a scrape system will not treat or reduce pathogens, nutrients,metals, solids, growth hormones, or antibiotics. The concentrations of these components willactually increase with the decrease in water dilution.
8-17
Advantages and Limitations: In a building with a scrape system, the manure removed from thelivestock housing area is in slurry or semisolid form (depending on species) and no water need beadded. Compared with a wet flush system, the resulting manure product has a greater nutrientdensity and increased potential for further treatment and transportation to an area where themanure product is needed as a fertilizer. A large lagoon is usually necessary for storing andtreating flush waste and water; handling manure in a drier form, on the other hand, significantlydecreases the volume and tonnage of the final organic product. Although this is an importantadvantage when it is necessary to transport manure to areas where there is an increase inavailable land base, it can be a disadvantage in that an irrigation system would not be able totransport the thicker slurry that results from the use of a scrape system.
The greater volume of contaminated water and waste created in a flush system generally dictatesthat storage in a large lagoon is required. There are more options for storing manure removedwith a scrape system. These storage alternatives may be more suited to practices that reduceodors (e.g., storage tank covers), more appropriate for areas with karst terrain or high watertables, and more aesthetically desirable.
The drawbacks of using a scrape system rather than a flush system include an increased laborrequirement because more mechanical components need maintenance, a higher capital outlay forinstallation, an increased requirement for ventilation, and less cleanliness. Using a flush systemto remove manure results in a cleaner and drier surface with less residual manure and less in-house odor, thus creating a better environment for livestock. Furthermore, alleys can be flushedwithout restricting animal access. As mentioned above, the discharge area of the scraper is aconcern. Existing pumps and pipes may be unable to handle the undiluted manure. Moreover, acompletely new manure storage structure might be needed (Vanderholm and Melvin, 1990).
Operational Factors: Both the scrape and flush systems have disadvantages when used in openbarns during winter months, but a scrape system is more likely to function properly at lowertemperatures.
If alleys are straight with continuous curbs, alley scrapers can usually be installed, but alleylengths of up to 400 feet in dairy freestall barns may make installation of scraping systemsimpractical. Scrapers work best when they can be installed in pairs of alleys so the chain or cablecan serve each and form a loop. It might be necessary to cut a grove into the concrete alley forthe chain or cable to travel in. The decision of whether to cut a channel or let the chain rest onthe pavement is best left to the manufacturer. It should be noted that maintenance requirementsassociated with the chain and cable will likely be high because of corrosion caused by continuouscontact with manure. Hydraulic scrape units that operate on a bar and ratcheting blade are alsoavailable (Graves, 2000).
Demonstration Status: The use of scrape systems and the practice of retrofitting a flush systemare not common in the livestock industry. Inquiries regarding the use of this practice have beenmade to manure management specialists, agricultural engineers, and manufacturers of scrapersystems. Very few professionals indicated that they had any experience in the area or were aware
8-18
of the practice being used. Those professionals willing to comment on the implications ofretrofitting seemed to believe that it would be most feasible and advantageous on dairies (Graves,2000; Jones, 2000; Lorimor, 2000; Shih, 2000).
Practice: Gravity Separation of Solids
Description: Gravity settling, separation, or sedimentation is a simple means of removing solidsfrom liquid or slurry manure by taking advantage of gravitational forces. The engineeringdefinition of a settling or sedimentation tank is any structure that is designed to retain processwastewater at a horizontal flow rate less than the vertical velocity (settling rate) of the targetparticles.
In agricultural applications, gravity settling is a primary clarification step to recover solids at adesired location where they can be managed easily, thereby preventing those solids fromaccumulating in a downstream structure where they would be difficult to manage. A wide rangeof gravity separation practices are used in agriculture, including sand and rock traps, picket dams,and gravity settling basins designed to retain 1 to 12 months’ accumulation of solids.
Settling tanks can be cylindrical, rectangular, or square. Agricultural settling tanks have beenmade with wood, metal, concrete, and combinations of materials. Some are earthen structures. In agriculture, gravity separation is sometimes accomplished without a recognizable structure,including techniques such as a change in slope that allows particles to settle when the liquidvelocity drops.
The critical design factor in sedimentation tanks is surface overflow rate, which is directly relatedto the settling velocity of particles in the wastewater (Loehr, 1977). Faster settling velocitiesallow for increased surface overflow rates, while slower settling velocities require decreasedoverflow rates to remove settleable particles. In “ideal” settling, the settling velocity (Vs) of aparticle is equal to that particle’s horizontal velocity (VH), where
VH = Q/DWQ is the flow through the tankD is the tank depthW is the tank width
The American Society of Agricultural Engineers (ASAE, 1998) has defined several types ofgravity separation techniques:
• Settling Channels: A continuous separation structure in which settling occurs over adefined distance in a relatively slow-moving manure flow. Baffles and porous dams maybe used to aid separation by further slowing manure flow rates. Solids are removedmechanically once liquids are fully drained away.
8-19
• Settling Tank: A relatively short-term separation structure, smaller in size than a settlingbasin. The liquid is allowed to fully drain away for solids removal by mechanical means.
• Settling Basin: A relatively long-term separation structure, larger in size than a settlingtank. Solids are collected by mechanical means once the liquids evaporate or have beendrained away.
Application and Performance: Gravity separation is relatively common in the United States. Separation is used to reduce clogging of downstream treatment or handling facilities. Reducedclogging means improved lagoon function and better wastewater treatment. Most beef feedlotsin the Midwest and Great Plains use gravity separation ponds to collect solids from rainfallrunoff, thus improving the function of runoff collection ponds. Gravity separation basins are usedacross the country on hog farms to reduce solids accumulation in tanks or lagoons they dischargeto. It is likely that more dairies with flush systems use gravity settling for solids recovery ratherthan mechanical separators to preserve lagoon capacity.
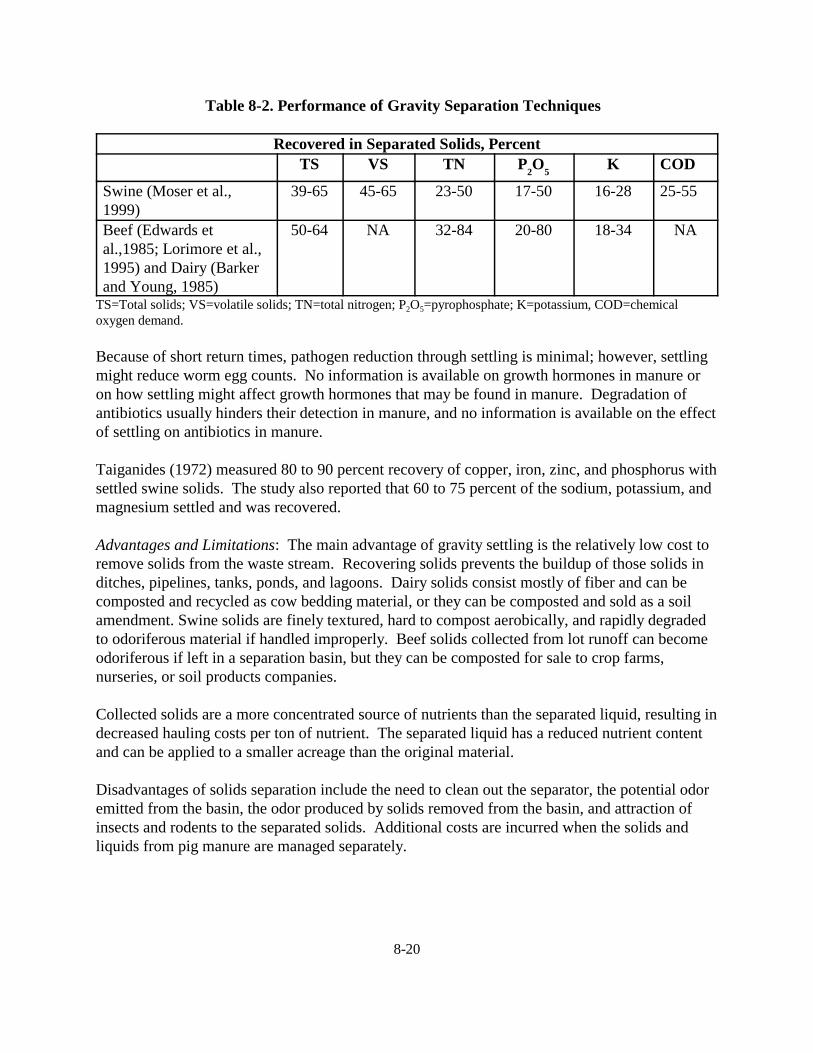
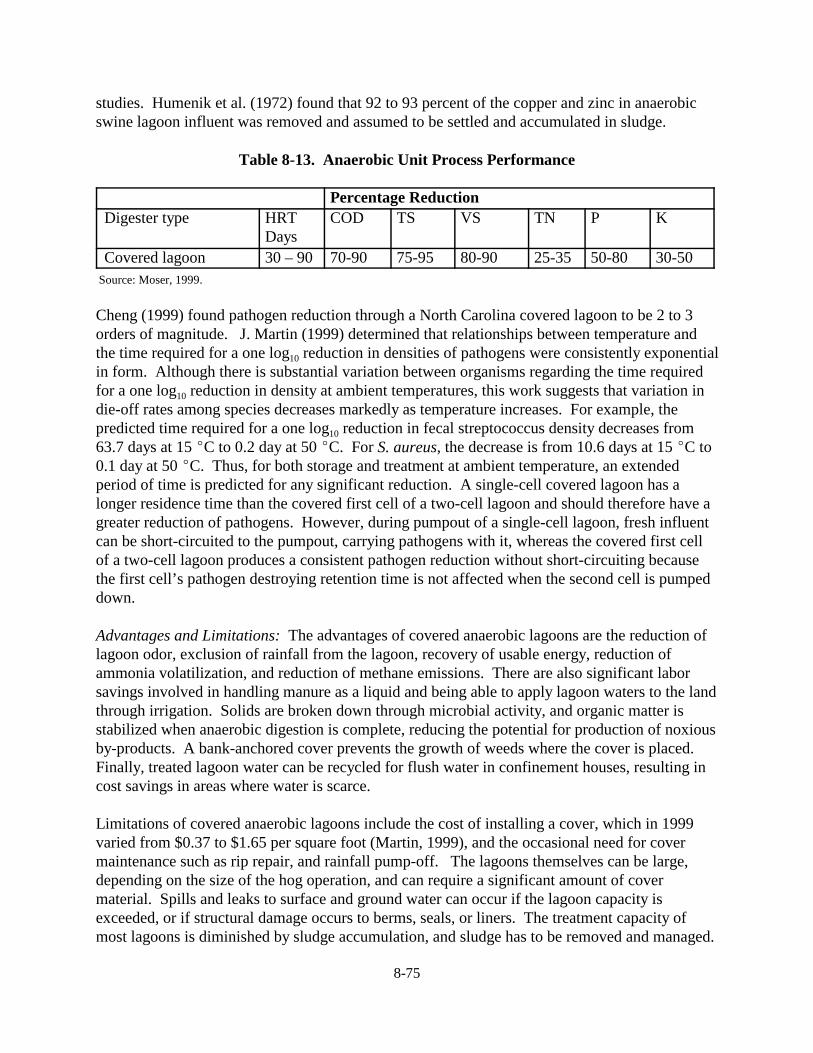
Table 8-2 shows the substantial range of treatment efficiencies for gravity settling of manure. The performance of a gravity separation basin depends on the design goal and ability of theoperator to maintain the system in design condition. Performance will vary with animal type,animal feed, dilution water, flow rate, percent of capacity already filled with solids, temperature,and biological activity. The data ranges in Table 8-2 may be explained in part by the time spanseparating the studies. More recent studies show reduced solids recovery from swine manure. This may be partly due to the fact that animal diets have changed over the years, with feed moredigestible and more finely ground these days. Further, feed is ground to different particle sizesthat have different settling characteristics, thus potentially affecting separation basinperformance. In addition, ruminants are fed materials that have different settling characteristicsthan those fed to nonruminants. Process variables such as overflow velocities are seldomreported in the literature, but they are important determinants of separation basin performance. Extra water from processing or precipitation and already settled material will increase the flowrate across a settling basin, reducing settling time and solids capture. In many agriculturalsettling basins, biological activity resuspends some settled materials which then pass through theseparator. At best, one can conclude from these data that gravity settling can recover in swinewastes a larger percentage of total solids (TS), volatile solids (VS), and total nitrogen (TN) thananother separation technique reviewed for the practice, mechanical solid-liquid separation, thatfollows in this chapter.
8-20
Table 8-2. Performance of Gravity Separation Techniques
Recovered in Separated Solids, PercentTS VS TN P
2O
5K COD
Swine (Moser et al.,1999)
39-65 45-65 23-50 17-50 16-28 25-55
Beef (Edwards etal.,1985; Lorimore et al.,1995) and Dairy (Barkerand Young, 1985)
Because of short return times, pathogen reduction through settling is minimal; however, settlingmight reduce worm egg counts. No information is available on growth hormones in manure oron how settling might affect growth hormones that may be found in manure. Degradation ofantibiotics usually hinders their detection in manure, and no information is available on the effectof settling on antibiotics in manure.
Taiganides (1972) measured 80 to 90 percent recovery of copper, iron, zinc, and phosphorus withsettled swine solids. The study also reported that 60 to 75 percent of the sodium, potassium, andmagnesium settled and was recovered.
Advantages and Limitations: The main advantage of gravity settling is the relatively low cost toremove solids from the waste stream. Recovering solids prevents the buildup of those solids inditches, pipelines, tanks, ponds, and lagoons. Dairy solids consist mostly of fiber and can becomposted and recycled as cow bedding material, or they can be composted and sold as a soilamendment. Swine solids are finely textured, hard to compost aerobically, and rapidly degradedto odoriferous material if handled improperly. Beef solids collected from lot runoff can becomeodoriferous if left in a separation basin, but they can be composted for sale to crop farms,nurseries, or soil products companies.
Collected solids are a more concentrated source of nutrients than the separated liquid, resulting indecreased hauling costs per ton of nutrient. The separated liquid has a reduced nutrient contentand can be applied to a smaller acreage than the original material.
Disadvantages of solids separation include the need to clean out the separator, the potential odoremitted from the basin, the odor produced by solids removed from the basin, and attraction ofinsects and rodents to the separated solids. Additional costs are incurred when the solids andliquids from pig manure are managed separately.
8-21
Operational Factors: Solids separators do not function if they are frozen or experiencehorizontal flow rates higher than the solids settling rate. Solids tend to separate better at warmertemperatures.
Demonstration Status: Gravity separation is the most common solids separation technique in usein the United States.
Practice: Mechanical Solid-Liquid Separation
Description: Solids-liquid separation is used to recover solids prior to their entry intodownstream liquid manure facilities. Solids recovery reduces organic loading and potentialaccumulation of solids and improves the pumping characteristics of animal manure. Mechanicalseparation equipment is used to reduce the space required for separation, to produce a consistentseparated solid product amenable to daily handling, to produce a liquid product that is easilypumped for spreading, or to recover specific particle sizes for other uses such as bedding.
Mechanical separation equipment is readily available for animal wastes. Mechanical separatorsinclude static and vibrating screens, screw press separators, rotary strainers, vacuum filters,centrifugal separators, belt filter presses, and brushed screen/roller presses. Static screens are themost popular mechanical separators because they are inexpensive to buy, install, and operate. All other mechanical separation techniques are less common.
Static screens are usually mounted above grade on a stand to allow solids accumulation beneath.Barn effluent is typically pumped up to the screen, where the liquids pass through while thesolids collect on the screen surface. Screens are typically inclined, causing accumulating solidsto slide down from the screen toward collection. There are multiple configurations with differentscreen designs, screen materials, screen opening spacing, influent distribution, post-usewashdown, and additional pressing of separated solids.
Vibrating screens are flat or funnel-shaped screens supported on springs and oscillated by aneccentric drive. The vibrations cause the solids to move from the screen for collection.
With screw presses, manure is pumped to the base of a turning open-flight auger that goesthrough a screen tube made of welded wire, wedge wire, perforated metal, or woven screenmaterial. Solids collect on the screen, forming a matrix as the auger advances them. Atensioned opening restricts the flow of materials up the auger and out from the tube. Theretained material is squeezed by the auger against the screen tube and tensioned opening until itovercomes the tension and exits. The matrix acts as a filter allowing the collection of finerparticles than are collected by other types of screens. The auger wrings liquid from the separatedsolids by forcing material against the plug of material held by the tensioned opening and screentube.
A rotary strainer is a slowly rotating, perforated cylinder mounted horizontally. Waste flows bygravity onto the cylinder at one end, where solids are scraped from the cylinder surface and
8-22
moved to the exit end. Liquids pass through the screen for collection and removal (ASAE,1998). Vacuum filters are horizontally mounted, rotating perforated cylinders with a cloth fibercover. A vacuum is used to draw liquids from the wastewater. Wastewater flows onto thecylinder surface, liquids pass through the screen, and solids are scraped from the cloth at aseparation point (ASAE, 1998).
A centrifugal separator, or centrifuge, is a rapidly rotating device that uses centrifugal force toseparate manure liquids from solids. One type, a relatively low-speed design, uses a cylindricalor conical screen that can be installed vertically or horizontally. Manure is fed into one end, andsolids are then contained by the screen, scraped from it, and then discharged from the oppositeend. The liquid passes through the screen. A second type, a higher-speed decanter, uses aconical bowl in which centrifugal force causes the denser solids to migrate to the bowl exteriorwhere they are collected. Less dense liquids are forced to the center for collection ASAE, 1998).
A belt press is a roller and belt device in which two concentrically running belts are used tosqueeze the manure as it is deposited between the belts. The belts pass over a series ofspring-loaded rollers where liquids are squeezed out or through the belt, and remaining solids arescraped off at a belt separation point (ASAE, 1998).
Brush screen presses are rectangular containers with four vertical sides and a bottom consistingof two half-cylindrical screens lying side by side to provide two stages of separation. Withineach screen rotates a multiple-brush and roller assembly that sweeps the manure across thescreen. Manure is pumped into one side of the separator. The liquids are forced through thescreen by the brush/roller while the solids are retained by the screen and pushed from theseparator on the opposite side (ASAE, 1998).
Application and Performance: Mechanical separation is used to reduce clogging of downstreamtreatment or handling facilities. The use of this practice to preserve lagoon capacity byseparating solids is relatively common among dairies using flush manure collection. Reducedclogging means improved lagoon function and better wastewater treatment. Mechanicalseparation of solids from manure, however, is relatively rare because of the added costs. Table 8-3 shows the range of treatment efficiencies for the mechanical separation of manure. These systems do not perform as well as gravity separation, but they produce a more consistentproduct delivered as a solid for easy collection. Most manufacturers and owners are lessconcerned about the percentage of recovery or the properties of the recovered material than theyare about the total solids concentration of the separated solids. Performance will vary withanimal type, animal feed, dilution water, flow rate, percent of capacity already full of solids,temperature, and biological activity. In general, pig manure has finer solids than cow manure,and recovery of pig manure constituents is in the low end of the ranges in Table 8-3, whereascow manure constituent recovery is in the upper portion of the range.
8-23
Table 8-3. Summary of Expected Performance of Mechanical Separation Equipment
Separation TechniqueRecovered in Separated Solids, PercentTS VS TN P2O5 COD
Pathogen reduction through mechanical separation is negligible. No information is available ongrowth hormones in manure or on the effect of mechanical separation on growth hormones thatmay be found in manure. Degradation of antibiotics usually hinders their detection in manure,and no information is available on the effect of mechanical separation on antibiotics in manure.
No significant information was found on the effect of mechanical separation on heavy metalcontent of either the solids or the liquids. Work in gravity separation suggests that metals areassociated with fine particle sizes that would pass with the liquids through mechanicalseparation.
Static (stationary) screens are most commonly used for separating solids from dilute solutionswith solids concentrations of 5 percent or less. The more dilute the solution, the more likely thatdiscrete particles will be collected on the screen because there is less particle-versus-particleinterference. The dilute solution also washes finer particles from larger, retained particles andthrough the screen.
Vibrating screens are used for separating solids from dilute solutions with solids concentrationsof 3 percent or less. Vibrating screens will generally process more flow per unit of surface areathan static screens because the vibrating motion moves the solids from the screen. Vibratingscreens are more sensitive than static screens to variations in solids content and wastewater flow(Loehr, 1977).
Static screens and vibrating screens usually collect 10 to 15 percent of the total solids frommanure. An owner generally selects a screen that will not easily clog, or blind (i.e. one withlarger screen spacing), instead of choosing an optimized screen and feed pump to avoid bothscreen blinding, when the slurry thickness changes, and the creation of a soggy solids pile.
8-24
Screw presses can handle thicker materials than most separators, and are used to separatemanures that have between 0.5 and 12 percent total solids. Chastain et al. (1998) noted,however, that a screw press did not separate well unless the total solids content of the waste wasabove 5 percent. Because screw presses first allow the solids to form a matrix and catch finesolids, the percent solids recovery is generally greater than for other solids separators. The screwpress is designed to produce drier solids (up to 35 percent). Solids recovery is dependent on thescreen tube openings and the setting of the retaining tension. The higher the tension is set, theharder the screw squeezes the separated material, and the more solids are forced out through thescreen. Tighter settings for drier solids may significantly affect the useful life of both auger andscreen.
Belt presses are expensive, require a trained operator, operate best with chemical addition, andcannot process rocks and barn parts found in manure. With or without chemical addition,however, they can do a good job of separating 40 percent or more of the total solids. Nevertheless, the cost of belt presses, plus the extremely high cost of maintenance and the needfor continuous operator presence, makes their use problematic.
The primary advantage of centrifugation over other separators appears to be in the reduction oftotal P, but centrifugation is also clearly more efficient than screening for removal of allconstituents. Managed by trained operators, centrifuges will recover over 60 percent of the totalsolids. Nevertheless, the large capital cost, the need for trained operators, and the highmaintenance costs have made this equipment impractical for farm use.
Advantages and Limitations: The main advantages of mechanical separation are the consistentlevel of solids removal from the waste stream and the delivery of separated solids at a recoverylocation. Recovering solids prevents the buildup of those solids in ditches, pipelines, tanks,ponds, and lagoons. Dairy solids, which consist mostly of fiber, can be composted and recycledas cow bedding material. Dairy solids have also been composted and sold as a soil amendment.Swine solids are finely textured, hard to compost aerobically, and rapidly degraded to odoriferousmaterial if handled improperly.
Collected solids are a more concentrated source of nutrients than the separated liquid, resulting indecreased hauling costs per ton of nutrient. The separated liquid has a reduced nutrient contentand can be applied to a smaller acreage than the original material.
Disadvantages of solids separation include operation and maintenance requirements, potentialodor production from collection basins and separated solids, and attraction of insects and rodentsto the separated solids. Additional costs are incurred when the solids and liquids in swinemanure are managed separately.
Operational Factors: Mechanical solids separators do not function if the manure or the face ofthe machine is frozen, but they can operate under a wide variety of other conditions.
8-25
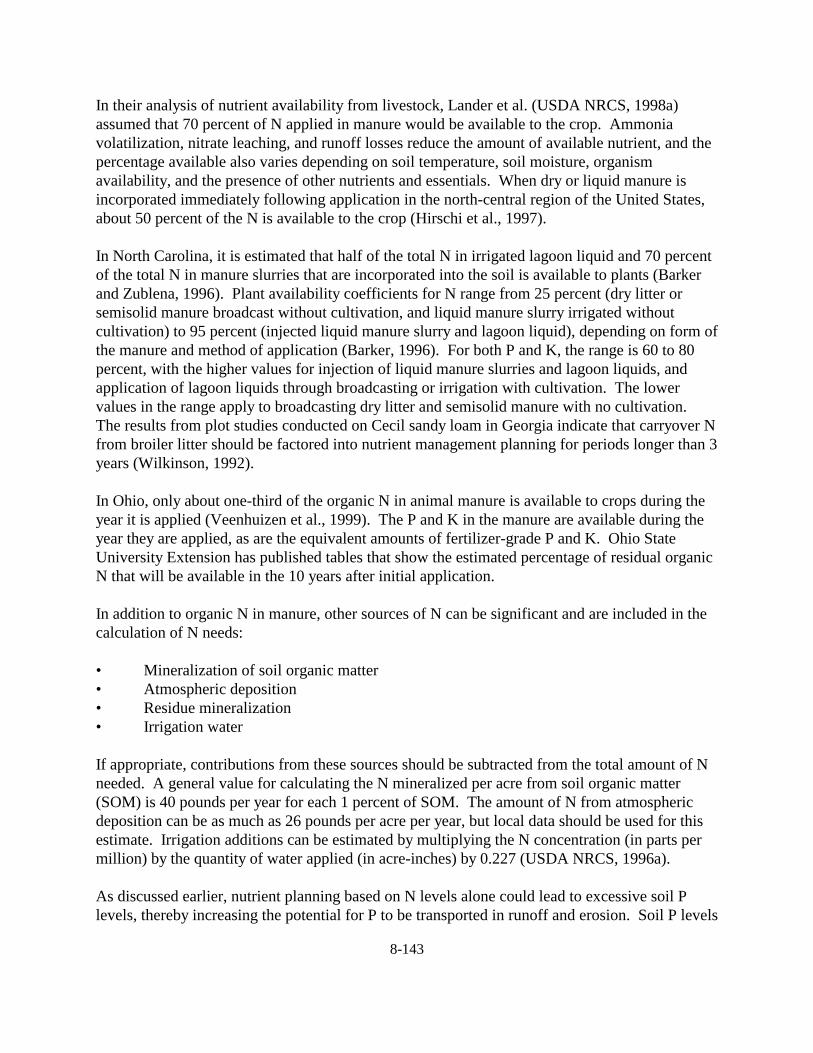
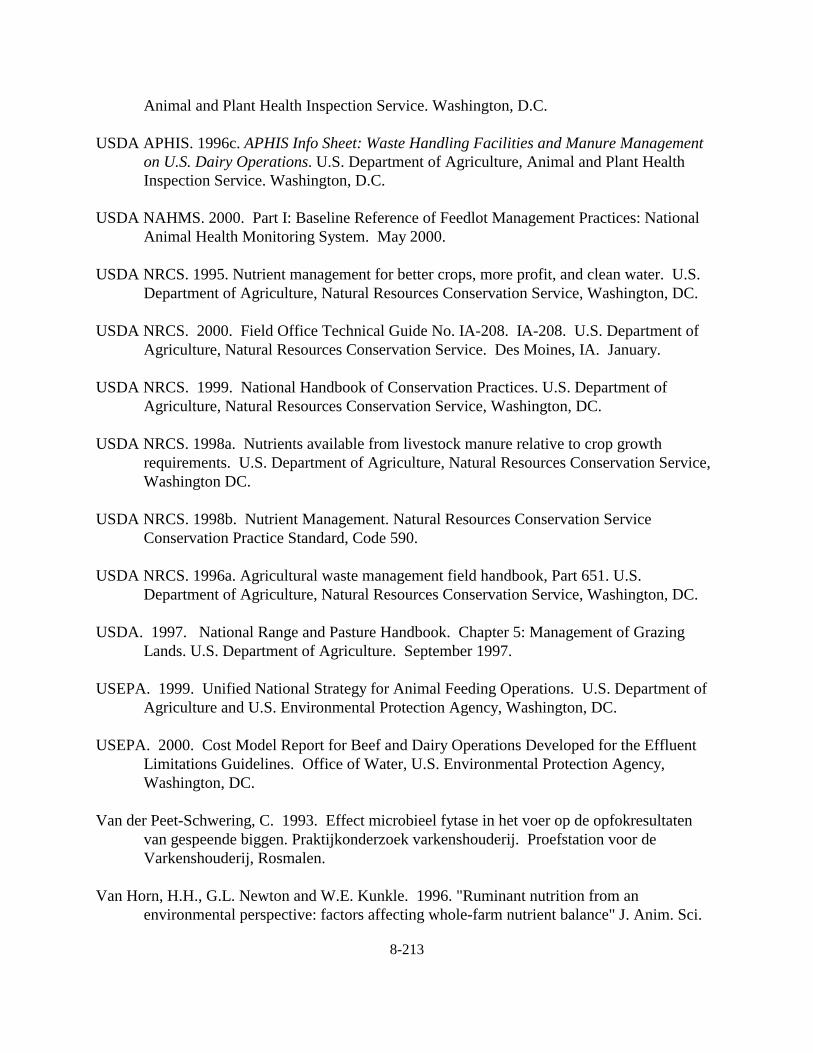
Figure 8-1. High-Rise Hog Building
Demonstration Status: Mechanical solids separation is being used at thousands of dairies andperhaps several hundred hog farms. Regarding specific technologies, static screens are mostcommonly used, whereas vibrating screens and rotary strainers are seldom used on farms today. Vacuum filters are infrequently used on farms because inorganic materials such as rocks andmetal bits tend to rip the filter fabric. High capital and operating costs have limited farm use ofcentrifugal separators. Brush screen presses may occasionally be found on farms, but the lowthroughput rate has limited its use. Screw presses are in use at a few hundred dairy farms, but ata very limited number of swine farms in the United States.
Practice: Two-Story Hog Buildings
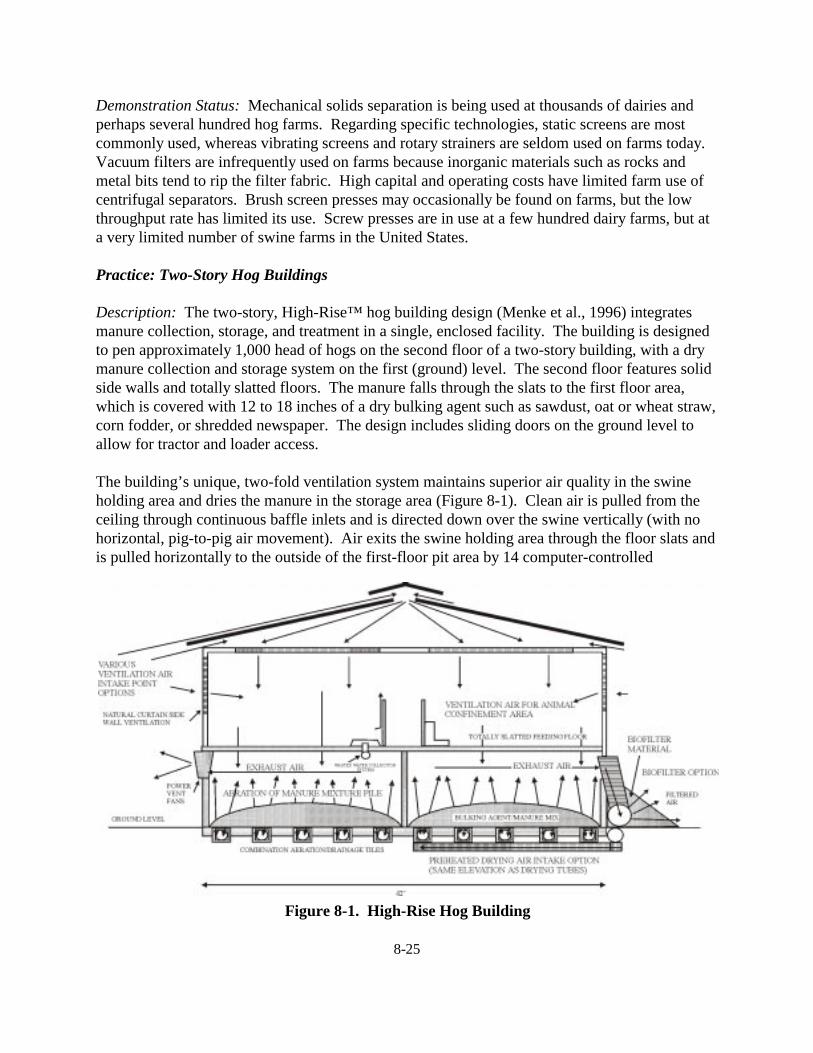
Description: The two-story, High-Rise™ hog building design (Menke et al., 1996) integratesmanure collection, storage, and treatment in a single, enclosed facility. The building is designedto pen approximately 1,000 head of hogs on the second floor of a two-story building, with a drymanure collection and storage system on the first (ground) level. The second floor features solidside walls and totally slatted floors. The manure falls through the slats to the first floor area,which is covered with 12 to 18 inches of a dry bulking agent such as sawdust, oat or wheat straw,corn fodder, or shredded newspaper. The design includes sliding doors on the ground level toallow for tractor and loader access.
The building’s unique, two-fold ventilation system maintains superior air quality in the swineholding area and dries the manure in the storage area (Figure 8-1). Clean air is pulled from theceiling through continuous baffle inlets and is directed down over the swine vertically (with nohorizontal, pig-to-pig air movement). Air exits the swine holding area through the floor slats andis pulled horizontally to the outside of the first-floor pit area by 14 computer-controlled
8-26
ventilation fans mounted on the pit walls. This system prevents air from the manure pit fromrising to the animal area. The second part of the ventilation system involves pumping air throughthe manure by floor aeration. PVC pipes with approximately 3,200 3/8-inch holes are installedbefore the concrete floor is poured. Two large fans on either end of the building force airthrough perforations in the concrete and into the composting mixture on the ground floor.
Application and Performance: Management practices, swine care, and feeding are much thesame as with conventional confinement. The High Rise facility is distinctive because itincorporates dry manure handling and storage into a traditional confinement production scenario. The system dries the manure mixture and maintains an aerobic environment to facilitate thecomposting process. Drying and homogeneity of the mixture are also facilitated by mixing witha tractor and loader or skid-steer loader. Frequency of mixing varies from once per productioncycle to biweekly, depending on the saturation of bedding. The semicomposted bedding mixtureis removed once per year and can be further composted, land applied, or sold. A typical 1,000-head unit produces 500 tons of semicomposted product per year.
The High Rise facility is best suited for areas where there is limited local land base for manureapplication; sandy, porous soils; limited water supply; or an existing market for compost orpartially composted material.
The aerobic decomposition that occurs within the pit results in a significant volume reduction inthe manure. In fact, initial trials have shown that loading the pit with 12 to 18 inches(approximately 11 tons) of bedding results in only 2.5 to 3 feet of manure to be removed at theend of 1 year. This is estimated as a 22 percent reduction in manure volume and a 66 percentreduction in manure tonnage (Envirologic, 1999; Mescher, 1999). These figures are based on afinal product with 63 percent moisture. When compared with liquid/slurry hog manure that isapproximately 90 percent moisture, this presents a great advantage in areas where there is a lackof local land base and manure must be transported more than 3 to 4 miles to alternative areas forapplication. Manure with 63 percent moisture is considered to be in dry form and can be hauledin a semi truck with an open trailer rather than in a liquid tanker pulled by a tractor.
The aerobic decomposition and drying that reduce the volume and tonnage of the final organicproduct do not result in a reduction of the overall nutrient content. In fact, with the exception ofN and sulfur (some of which volatilizes) nutrients will be more concentrated in the resultingsemicomposted product. The semicomposted manure is four times more concentrated than liquidmanure from treatment lagoons.
The High-Rise facility incorporates both manure treatment and storage in a completelyaboveground handling system. In addition, the ground-level manure storage area is enclosed inpoured concrete. This is especially advantageous in sites with porous soils or fragmentedbedrock. Such locations are unfit or, at the least, potentially dangerous areas for earthen basinand lagoon construction due to concerns regarding ground water contamination. Furthermore,belowground concrete pits have an increased potential for ground water pollution if leaking
8-27
occurs in a region with porous soils or fragmented bedrock. The aboveground concrete manurestorage of the High-Rise building allows visual monitoring for leakage.
Information is not currently available on the reduction of pathogens, heavy metals, growthhormones, or antibiotics in the manure product as it is removed from the High-Rise facility. However, research on some of these topics is currently underway. Based on the composition ofthe product, temperature readings within the manure pack, and knowledge of the compostingprocess, several speculations can be made. Destruction of pathogens in the composting processis a result of time and temperature. The higher the temperature within the manure pack, the lesstime it takes to eliminate pathogens. In general, the temperature within the manure pack needs toexceed the body temperature of the animal and pathogen destruction is most effective at 120 (For higher. Temperature readings taken in the manure pack in the High-Rise facility ranged fromonly 45 to 78 (F (Keener, 1999). The predominant reason for the manure packs not reaching ahigh enough temperature is the continuous aeration provided. It is unlikely that there is asignificant reduction of pathogens at this temperature. There may be some decrease in pathogennumbers due to the length of time (up to one year) the manure pack remains in the building. Further composting of the manure pack once it is removed from the High-Rise structure wouldallow the product to reach temperatures high enough for complete pathogen destruction.
The composting process has no effect on the quantity of heavy metals in the manure. Further,because of the decrease in volume and tonnage of the manure, heavy metals will be moreconcentrated. Composting does, however, influence the bioavailability of the metals, causingthem to be less mobile. The extent to which the mobility of heavy metals is decreased in thesemicomposted product removed from the High-Rise facility is unknown.
The degree to which growth hormones and antibiotics degrade during the composting process isunknown and is not widely studied.
Designers of the High-Rise facility claim a savings of 1.8 million gallons of water per 1,000 headof hogs annually when compared with a conventional pull-plug flush unit. This conservationresults from using wet-dry feeders and eliminating the addition of water for manure removal andhandling. A reduction in the amount of water used in the system results in less waste product tobe handled.
Advantages and Limitations: As explained above, the dry manure handling system used in theHigh-Rise facility significantly decreases the volume and tonnage of the final organic product. This is an important advantage when transportation to areas where there is an increased land basefor manure application is necessary. However, because the semicomposted product has greaterconcentrations of macronutrients, with the possible exception of N (which might volatilize), thenumber of acres needed to correctly apply the manure does not decrease. Nitrogen volatilizationduring the composting process creates the possibility of upsetting the nutrient balance in manure. For example, if manure was applied to land with the application rate based on the amount of N inthe manure, P and potassium could be applied at rates 10 times the recommended rate. This
8-28
problem is eliminated if application rates are based on the P content of manure. Additionalcommercial N application might be necessary depending on the crop being produced.
Data from an initial trial show that the manure product removed from the High-Rise facility has afertilizer value of about $19 per ton at 60.7 percent moisture, with an organic matter content of29.8 percent. Secondary studies show that the manure mixture is of adequate content for furthercomposting, which is necessary to sell manure commercially. These factors create an increasedopportunity to broker manure and possibly provide supplemental income to the swine productionenterprise (Envirologic, 2000).
Observations and data resulting from the first year of study in the High-Rise structure indicatethat there is a significant decrease in odor using the dry manure handling system. Ammoniameasurements on the swine housing level averaged from 0 to 8 parts per million (ppm), with anoverall mean of 4.3 ppm and spikes of up to 12 ppm in times of decreased ventilation (wintermonths). In a conventional confinement building with a deep, liquid pit, ammonia levels of 20to 30 ppm are commonplace. Ammonia levels on the ground level of the High-Rise buildingvary inversely with building ventilation and have exceeded a short-term exposure rate of 50 ppmin the winter. It must be realized, however, that the basement level is not occupied duringnormal conditions. Large sliding doors are opened when the facility is cleaned to let in fresh airand facilitate the entry of a tractor/loader. Ammonia levels external to the outside exhaust fansaveraged 23.3 ppm, but quickly dissipated (Keener et al., 1999).
No hydrogen sulfide gas was detected in the swine holding area. Levels on the first floor wereminimal (National Hog Farmer, 2000). Decreased levels of these potentially toxic gases improveair quality and prevent excessive corrosion in the building.
Producers who plan to build a High-Rise facility can expect a 15 percent increase in capitaloutlay compared to a 1,000-head, tunnel ventilation finisher with an 8-foot-deep pit. Costprojections prepared for the company that manufactures the High-Rise building indicate thatreduced cost for manure handling and transportation offsets the additional building cost(Envirologic, 2000). Solid manure handling is less automated than many liquid manure handlingsystems. Although solid systems have lower capital costs, labor costs are higher than thoseassociated with liquid systems. Labor costs are expected to be less than traditional scrape andhaul systems because the slatted floors eliminate the need to scrape animal areas frequently.
In addition to the increased capital requirement, the cost of utilities is also elevated. Additionalenergy is needed to power the many ventilation fans. Electricity usage averages roughly twicethat of a naturally ventilated confinement barn. Accounting for all of these factors, the cost ofproduction in a High-Rise facility is approximately $180 per pig. This is 28 to 30 percent greaterthan the cost of production in a confinement structure with a shallow pit, and 15 to 18 percentgreater than in a more conventional deep pit (Mescher et al., 1999).
The ventilation system that pumps air over the swine holding area keeps the swine and slats dry,resulting in cleaner swine and fewer injuries. Also, there is no flow of air from pig to pig, which
8-29
helps prevent airborne transmission of disease. The combination of decreased moisture andexceptional air quality leads to improved animal health and decreased medication costs.
Data from a single High-Rise facility show that animal performance was the same or better thanthat of conventional facilities with respect to average daily gain, days to market, feed conversion,mortality, and the number of culls. In fact, the decreased number of days to market translatesinto 0.2 to 0.3 more production cycles per year, creating potential to increase profits significantly. It is speculated that improvement in performance measures is due to better air quality(Envirologic, 2000).
Leachate from the manure mixture appears to be minimal if mixing is done on a regular basis. Rodents in the basement pit might become a problem if control measures are not taken.
Operational Factors: Artificial climate control and ventilation in the building make the High-Rise building appropriate in most climates . It is estimated that air in the building is exchangedevery 10 to 15 seconds, providing an environment of uniform temperature and humiditythroughout the building year-round. Over a 1-year span, the mean air temperature taken fromseveral test areas within the building varied only ± 2 (F from the desired temperature. Therewere, however, differences of up to 10 (F between testing areas on the swine floor (Stowell etal., 1999). The building is equipped with a standard sprinkling system for use in hot summermonths.
Demonstration Status: The High-Rise facility technology has been tested with finisher pigs since1998 at a single research facility in Darke County, Ohio. The vendor has built four commercialgrow-finish buildings since that time and they are currently in production in west central Ohio. The vendor is also developing prototypes for other phases of swine production using the samemanure handling system.
Practice: Hoop Structures
Description: Hoop structures are low-cost, Quonset-shaped swine shelters with no form ofartificial climate control. Wooden or concrete sidewalls 4 to 6 feet tall are covered with anultraviolet and moisture-resistant, polyethylene fabric tarp supported by 12- to 16-gauge tubularsteel hoops or steel truss arches placed 4 to 6 feet apart. Hoop structures with a diameter greaterthan 35 feet generally have trusses rather than the tubing used on narrower hoops. Somecompanies market hoops as wide as 75 feet. Tarps are affixed to the hoops using ropes orwinches and nylon straps.
Generally, the majority of the floor area is earthen, with approximately one-third of the south endof the building concreted and used as a feeding area. The feeding area is designed with a slightslope (1 to 2 percent) to the outside of the building in case of a waterline break and is raised 12 to19 inches above the earthen floor to keep the feeding area clear of bedding material. Approximately 150 to 200 finisher hogs or up to 60 head of sows are grouped together in one
8-30
large, deep-bedded pen. The building should be designed so that the group housing area provides approximately 12 square feet of space per finisher pig, or 27 square feet per sow.
Hoop structures are considered a new and viable alternative for housing gestational sows andgrow-finish pigs. Gestational housing systems being used in the United States are modeled afterconventional Swedish style, deep-bedded gestation and breeding housing. In Sweden today,deep-bedded housing systems with individual feeding stalls are the conventional method of drysow housing. There are feeding stalls for each sow, with connecting rear gates and individuallyopening front gates, a deep-bedded area for the group-housed sows, and bedded boar pens. Thestalls are raised approximately 16 inches above the ground to accommodate the deep-beddingpack in the center.
In each production scenario, plentiful amounts of high quality bedding are applied to the earthenportion of the structure, creating a bed approximately 12 to 18 inches deep. The heavy beddingabsorbs animal manure to produce a solid waste product. Additional bedding is addedcontinuously throughout the production cycle. Fresh bedding keeps the bed surface clean andfree of pathogens and sustains aerobic decomposition. Aerobic decomposition within the beddingpack generates heat and elevates the effective temperature in the unheated hoop structure,improving animal comfort in winter conditions.
Application and Performance: The hoop structure originated in the prairie provinces of Canada. Recently, interest in this type of structure has increased in Iowa and other states in the Midwest. Swine production in this type of facility is most prevalent for finishing operations, but is alsoused to house dry gestational sows. Other possible uses in swine production include giltdevelopment, isolation facilities, housing for light pigs, breeding barns, farrowing, andsegregated, early weaning swine development. A hoop structure is an appropriate alternative formoderately sized operations. An “all in, all out” production strategy must be used with finishingpigs.
The manure from hoop structures is removed as a solid with the bedding pack. The high volumeof bedding used creates an increased volume of waste to be removed. Typically, a front-wheelassist tractor with a grapple fork attachment on the front-end loader is required to clean out thebedding pack. In a finishing production system, the bedding pack is removed at market time,usually two to three times per year. In gestational sow housing, slightly less bedding is required,and the bedding pack is typically removed one to four times a year depending on the stockingdensity and quality of bedding.
A limited amount of information is available on the manure characteristics, both inside the hoopand during consequent manure management activities. The manure content within the pack ishighly variable. Dunging areas are quickly established when swine are introduced into the deep-bedded structure. These areas contain a majority of the nutrients within the pack. Results of anIowa State University study are shown in Table 8-4. Samples were taken on a grid system at nineareas throughout the bedding pack (three samples along the west side of the building, three alongthe center, three along the east).
8-31
Table 8-4. Examples of Bedding Nutrients Concentrations
Bedding Nutrients by Locationa
SiteTotal Moisture
(percent)Total Nitrogen
(lb/ton)Phosphorus
(lb/ton)Potassium
(lb/ton)
West1 73.7 20 21 12
West2 75.2 22 22 12
West3 68.5 22 31 16
Center1 67.4 14 20 26
Center2 22.9 11 21 37
Center3 27.6 22 17 26
East1 68.5 29 24 29
East2 30.6 36 40 51
East3 73.5 16 13 15
Mean 56.4 21.3 23.2 24.8
Standard Deviation 22.3 7.6 7.6 13.0a Adapted from Richard et al., 1997.
Temperatures throughout the bedding pack also varied greatly. Bedding temperature was highestin the sleeping/resting area where the moisture content is approximately 50 percent. Beddingtemperatures were lowest in the wet dunging areas that contain 60 to 70 percent moisture. Thelower temperatures were likely caused by anaerobic conditions that prevent oxidation of carbonand, therefore, reduce the amount of heat generated (Richard et al., 1997; and Richard and Smits,1998).
Richard et al. and Richard and Smits (1997, 1998) also examined the loss of N in the hoopstructure bedding pack. One-third of the N was lost while swine were housed in the structure. This loss was hypothesized to be caused largely by ammonia volatilization and possibly fromnitrate leaching. An additional 10 percent reduction in N occurred as the bedding pack wasremoved from the hoop. This loss was also hypothesized as being a result of ammoniavolatilization. Additional N was lost during the composting process, with the amount lostcorresponding to the specific composting process demonstrated. In general, the compostingprocess that resulted in the greatest reduction of volume also had the greatest N loss (Richard andSmits, 1998).
Nitrogen leaching potential was examined in yet another study at Iowa State University. Thehoop facility used in this trial was located on hard-packed soil with a high clay-content. Following one production cycle, the surface NO3-N was 5.5 times greater than the initial level. There was no significant change in NO3-N at other depths ranging to 5 feet. Following a secondproduction cycle, the NO3-N levels at all depths to 5 feet increased three times compared withthose taken following the initial production cycle (Richard et al., 1997). Nitrate was the onlyform of N tested.
8-32
The Medina Research Centre in Australia studied N and P accumulation in the soil beneath hoopstructures. The hoop structures were constructed on Swan Coastal Plain sandy soils. Two trialswere conducted in the same location approximately 6 weeks apart. In each trial there was noincrease in the concentration of extractable P in the soil profile when compared with baselinedata (Jeffery, 1996).
Advantages and Limitations: The quality of the work environment in a deep-bedded hoopstructure is generally good. There is no liquid manure and therefore less odor than withconventional systems. The building structure and recommended orientation provide for a largevolume of naturally ventilated air. Also, because the manure is solid, storage requirements areminimized.
The high degree of variability within the bedding pack makes it difficult to predict nutrientcontent. Some areas can have a high fertilizer value, whereas others have high carbon and lowN content. The latter can lead to N immobilization and result in crop stress if applied during orimmediately prior to the growing season. For these reasons, it is desirable to mix the beddingpack to achieve a higher degree of uniformity. Some mixing will occur during the removal andstorage of the manure. Treatments that allow for additional mixing, such as composting inwindrows, appear to offer considerable benefits. Initial studies at Iowa State University foundthat composting improved uniformity, and provided for a 14 to 23 percent reduction in moistureand a 24 to 45 percent reduction in volume (Richard and Smits, 1998). It should be noted thatbedding from gestational sow facilities is typically drier than that from finishing facilities. Thelack of moisture is likely to limit the extent of composting unless additional manure or moistureis added.
Trials comparing a conventional confinement system to hoop structures have been performed atIowa State University. The swine raised in the hoop structure experienced similar performance. Specifically, there was a low level of swine mortality (2.6 to 2.7 percent), comparable andacceptable average daily gain, and a slightly poorer feed efficiency (8 to 10 percent) for swineraised in the winter months (Honeyman et al., 1999). Poor feed efficiency in winter months isdue to an increased nutrient/energy requirement to maintain body heat. These findings supportedan earlier study by the University of Manitoba that found swine finished in hoop structures tohave excellent health, similar rates of gain, poorer feed efficiency in colder months (10 to 20percent), low swine mortality, and similar days to market (Conner, 1993). Moreover, similarresults were found in a South Dakota State University study. Several researchers have identifiedproper nutrition for swine raised in hoops as an area needing further research.
With respect to housing dry gestational sows, providing a lockable feeding area for each sowaffords similar advantages to those of traditional gestation crates. Producers have the ability tokeep feed intake even, eliminate competition for feed, administer treatments and medicationeffectively, lock sows in for cleaning and bedding, and sort and transfer sows for breeding orfarrowing through the front gates. Furthermore, group housing stimulates estrus (the period oftime within a female’s reproductive cycle in which she will stand to be bred), reduces stress tothe sow, and alleviates many foot and leg problems common in sows. Fighting is minimized by
8-33
the use of feeding stalls and introducing new sows at optimal times, such as farrowing. Concreting the deep-bedded section to prevent sows from rooting is an option, but it increasescapital outlay (Honeyman et al.,1997).
Iowa State University has conducted demonstration trials on gestating sows in deep-bedded hoopstructures. Conception rate, farrowing rate, number of swine born alive, and birth weight ongroups gestated in the hoop structure were all excellent. The sow performance results indicatethat hoop structures are an exceptional environment for gestating sows. It must be noted,however, that sow groups were not mixed and new sows were not introduced during the trial. With respect to breeding, hot weather is of greater concern than cold weather. Excessive hightemperatures can be detrimental to breeding performance. Boars exposed to elevated effectivetemperatures will experience poor semen quality for a 6- to 8-week period that begins 2 to 3weeks following exposure. Sows are more tolerant to high temperatures, except during the first 2to 3 weeks of gestation and the final 2 weeks prior to farrowing. Litter size and birth weight canbe severely altered during these periods (Honeyman et al., 1997).
Iowa State University has also conducted preliminary trials with farrow-to-finish production,early weaned pigs, and wean-to-finish production. These studies concluded that, although eachmay be a viable alternative, many details must still be worked out before they all becomesuccessful consistently.
The hoop system offers several benefits with respect to animal welfare and behavior. Honeymanet al. (1997) stated that one of the most extreme stresses in livestock production results when ananimal is prevented from controlling various aspects of its environment. This lack of control isapparent in many of today’s conventional production systems and is responsible for an undulyhigh level of stress that affects general health, reproduction, and welfare. Production in a deep-bedded hoop structure allows each animal to control its own microenvironment by burrowingdown into the bedding, huddling, or lying on top. Deep-bedded hoops also allow swine to rootthrough and ingest some bedding at will. This is especially advantageous in dry-sow gestationalhousing. The behavior serves two purposes. First, swine have an inherent drive to root. Beingable to do so prevents frustration, boredom, and, hence, aggression. Second, consumption ofbedding material quiets any hunger the pig may feel. Increased genetic evolution has led swineto have an increased drive to eat. Gestating sows are typically fed a limited amount of feed,satisfying what is estimated to be only 30 to 50 percent of their appetite. Stereotypic behavior isindicative of a suboptimal environment and will ultimately have implications on an animal’sgeneral health and production. No evidence of stereotypic behavior is cited in any of the deep-bedded system studies (Honeyman et al., 1997).
The initial capital outlay for hoop structures is about 30 percent less than the capital requirementassociated with a typical double-curtain swine finishing building (Harmon and Honeyman,1997). Additionally, hoop structures are highly versatile and have many alternative uses (e.g.,equipment storage) if production capacity is not needed. Production in hoop structures requires agreater amount of feed and large volumes of high quality bedding, however. Bedding is the key
8-34
to successful production in hoop structures. These differences make the cost of productioncomparable to that of a traditional confinement setting.
Hoop structures are easy to construct with on-farm labor. In Iowa State University trials, hoopstructures show no visible signs of deterioration after 4 years (Honeyman, 1995). The averageuseful life of a hoop structure is estimated to be 10 years (Brumm, 1997).
The amount of bedding used in the studies averages 200 pounds per finisher pig in eachproduction cycle, with a greater amount of bedding being used in the winter months. It isestimated that approximately 1,800 pounds of high quality bedding per gestational sow areneeded each year (Halverson, 1998). The amount of labor is directly proportional to the amountof bedding and ranges from 0.3 to 0.6 hours per pig (Richard et al., 1997). A survey distributedto producers of finishing pigs in hoop structures and compiled by Iowa State University foundactual labor requirements to average 0.25 hours per pig (Duffy and Honeyman, 1999). Laborrequirements rely on many factors, including farm size, level of automation, and experience withthe production system. Based on the trials conducted at each university, the labor requirementwas considered to be reasonable and competitive with other finishing systems (Conner, 1993;Richard et al., 1997).
The large amount of bedding required in hoop structure production can limit its feasibility forsome producers. Many types of bedding can be used. Corn stalks, oat straw, wheat straw, beanstalks, wood shavings, and shredded paper have all been used with some success, althoughshredded corn stalks are the most common. Selection of the appropriate bedding type is based onmany factors. First, the availability of bedding must be considered. This is specific togeographical area but may also be limited by climate. An early snow or a wet fall could preventstalk baling. Second, in several areas of the Midwest, federally mandated conservation plans onhighly erodible land require residue to be left on the land. In such cases, harvesting corn andbean stalks may not be appropriate. Finally, bedding storage is an important consideration. Generally, bedding baled in the fall and used by the spring can be stored outdoors. Beddingneeded for spring and summer use, however must be stored undercover in a well-drained area toavoid loss in quality and quantity.
Internal parasite control must be aggressive because swine are continually in contact with theirfeces. Several of the Iowa State University studies note that flies are a potential problem forhoop houses in warm months. Furthermore, rodent and bird problems may be difficult to control. Also, in the summer, incidental composting within the bedding pack can create unwelcome heatand may lessen the animals’ comfort. It has not been determined whether there is severepotential for disease and parasite buildup in the soil beneath the hoop structure.
Operational Factors: Production in a hoop structure relies on bedding, intensive management,and keen husbandry for success. Climate control is a major factor in determining the feasibility ofdeep-bedded hoop structures. The recommended orientation of the buildings is north to south(depending on geographical area), to take advantage of the prevailing summer winds. Air entersthe facility through spaces between the sidewall and the tarp and at the ends. Warm, moist air
8-35
moves toward the top of the arch and is carried out the north end by natural currents. Variousend structures are available that supply adjustable levels of ventilation. In the winter months, thenorth end is generally closed and the south is at least partially opened. If the ends are closed tootightly, high levels of humidity can become a problem. On average, the inside air temperature inthe winter is only 5( to 8( F warmer than outside temperatures. This is different from theeffective temperature which the swine can alter by burrowing into the deep bedding. In summermonths, both ends are left open. Ultraviolet resistant tarp and sprinklers inside the structure helpto control the temperature within the structure. Air temperature in the summer averages 2( to 4(F lower than outside temperature (Harmon and Xin, 1997). The length of the hoop structure alsohas an effect on air temperature because of the rate of air exchange. Wider and longer hoopstructures often have ridge vents to improve ventilation.
Demonstration Status: Hoop structures have been used successfully in the United States forhousing finishing pigs and dry gestational sows. Grow-finish production is the most commonuse for hoop structures in swine production. Recently, there has been an increased interest in thistype of production system in the Midwest, including the states of Iowa, Illinois, Minnesota,Nebraska, and South Dakota. It is estimated that more than 1,500 hoop structures have beenbuilt for swine production in Iowa since 1996 (Honeyman, 1999). Furthermore, initialdemonstrations have been conducted with early weaned pigs and in farrow-to-finish production. Hoop structures are being used to house swine in at least seven Canadian provinces. Currently,more than 400 hoop structures are used for swine finishing in Manitoba (Conner, 1994).
Practice: Rotational Grazing
Description: Intensive rotational grazing is known by many terms, including intensive grazingmanagement, short duration grazing, savory grazing, controlled grazing management, and voisingrazing management (Murphy, 1998). This practice involves rotating grazing cattle (both beefand dairy) among several pasture subunits or paddocks to obtain maximum efficiency of thepasture land. Dairy cows managed under this system spend all of their time not associated withmilking out on the paddocks during the grazing season and beef cattle spend all of their time outon the paddocks during the grazing season. Intensive rotational grazing is rarely if ever used atswine and poultry operations. Nonruminants such as swine and poultry are typically raised inconfinement because of the large number of animals produced and the need for supplementalfeed when they are raised on pastures.
Application and Performance: Rotational grazing is applicable to all beef and dairy operationsthat have sufficient land. During intensive rotational grazing, each paddock is grazed quickly (1or 2 days) and then allowed to regrow, ungrazed, until ready for another grazing. The recoveryperiod depends on the forage type, the forage growth rate, and the climate, and may vary from 10to 60 days (USDA, 1997). This practice is labor- and land-intensive as cows must be moveddaily to new paddocks. All paddocks used in this system require fencing and a sufficient watersupply. Many operations using intensive rotational grazing move their fencing from one paddockto another and have a water system (i.e., pump and tank) installed in each predefined paddockarea.
8-36
The number of required paddocks is determined by the grazing and recovery periods for theforage. For example, if a pasture-type paddock is grazed for 1 day and recovers for 21 days, 22paddocks are needed (USDA, 1997). The total amount of land required depends on a number offactors including the dry matter content of the pasture forage, use of supplemental feed, and thenumber of head requiring grazing. Generally, this averages out to one or two head per acre ofpasture land for both beef and dairy cattle (Hannawale, 2000). Successful intensive rotationalgrazing, however, requires thorough planning and constant monitoring. All paddocks should bemonitored once a week. High-producing milk cows (those producing over 80 lbs/day) need alarge forage allowance to maintain a high level of intake. Therefore, they need to graze inpastures that have sufficient available forage or be fed stored feed (USDA, 1997). It is alsoexpected that beef cattle would need sufficient forage or stored feed to achieve expected weightgains.
The climate in many regions is not suitable for year round rotational grazing. Operations in theseregions must maintain barns and/or dry lots for the cows when they are not being grazed oroutwinter their cows. Outwintering is the practice of managing cows outside during the wintermonths. This is not a common practice because farmers must provide additional feed as cowsexpend more energy outside in the winter, provide windbreaks for cattle, conduct more frequentand diligent health checks on the cows, and keep the cows clean and dry so that they can staywarm (CIAS, 2000).
There are two basic management approaches to outwintering: rotation through paddocks andsacrifice paddocks. Some farms use a combination of these practices to manage their cowsduring the winter. During winter months, farmers may rotate cattle, hay, and round bale feedersthroughout the paddocks. The main differences between this approach and standard rotationalgrazing practices are that the cows are not rotated as often and supplemental feed is provided tothe animals. Deep snow, however, can cause problems for farmers rotating their animals in thewinter because it limits the mobility of round bale feeders. The outwintering practice of“sacrifice paddocks” consists of managing animals in one pasture during the entire winter. Thereare several disadvantages and advantages associated with this practice. If the paddock surface isnot frozen during the entire winter, compaction, plugging (tearing up of the soil), and puddlingcan occur. Due to the large amounts of manure deposited in these paddocks during the winter,the sacrificial paddocks must be renovated in the spring. This spring renovation may consist ofdragging or scraping the paddocks to remove excess manure and then seeding to reestablish avegetative cover. Some farmers place sacrifice paddocks strategically in areas where anundesirable plant grows or where they plan to reseed the pasture or cultivate for a crop (CIAS,2000).
EPA conducted an analysis to estimate the manure reduction achievable with intensive rotationalgrazing at model beef and dairy operations (ERG, 2000a). Outwintering was not assumed tooccur in this analysis. During the months that the cows from the model dairies and feedlots wereassumed not to be on pasture, the amount of manure that must be managed is assumed to beequal to the amount produced at equal size confined dairy operations and beef feedlots. Table 8-5 presents the estimated range of months that intensive rotational grazing systems might be used
8-37
at dairy farms and beef feedlots located in each of the five geographical regions included in thisanalysis.
Table 8-5. Amount of Time That Grazing Systems May Be Used at Dairy Farms and Beef Feedlots, by Geographic Region
Region Annual Use of Grazing Systems (months)
Pacific 3 - 12
Central 3 -12
Midwest 3 - 6
Mid-Atlantic 3 - 9
South 9 - 12
It is estimated that approximately 15 percent of the manure generated by dairy cows is excretedin the milking center and 85 percent is excreted in the housing areas (i.e., barns, dry lots,pastures) (USDA NRCS, 1996). It is also estimated that 23 percent to 28 percent of thewastewater volume generated from a flushing dairy operation comes from the milking center and72 percent to 77 percent (median of 75 percent) of the wastewater comes from flushing the barns(USEPA, 2000). All wastewater from a hose-and-scrape dairy system is generated at the milkingcenter. Thus, dairies using intensive rotational grazing systems would manage 85 percent lesssolid manure and approximately 75 percent less wastewater (for flushing operations) thanconfined systems, during the months that the cows are on pasture.
All of the manure generated at beef feedlots using intensive rotational grazing systems would beexcreted on the pasture during the months that the cows are grazing. No significant amounts ofprocess wastewater are generated at beef feedlots. Thus, beef feedlots using intensive rotationalgrazing systems would manage 100 percent less solid waste during the months that the cows areon pasture.
Two model farm sizes were analyzed for dairy farms, assuming an average size of 454 (formedium-sized dairies) and 1,419 milking cows (for large-sized dairies). Both of these sizegroups are significantly larger than the 100 head or smaller operations expected to use intensiverotational grazing systems. Therefore, the specific model farm calculations are viewed assignificantly overestimating the amount of collected manure and wastewater that could bereduced at typical intensive rotational grazing operations versus confined operations. For thisreason, estimates on collected manure and wastewater reduction are presented on a per-headbasis and model farm basis for the two dairy farm types (flushing, hose and scrape) included inEPA’s Effluent Limitations Guidelines (ELG) analysis for each of the five geographical regions.
Three model farm sizes were analyzed for beef feedlots, assuming an average size of 844 (formedium-sized feedlots), 2,628 (for large-sized feedlots), and 43,805 beef slaughter steer (for very
8-38
large feedlots). Due to the slow weight gain associated with grazing operations for beef cattleand required number of pasture acres, beef feedlots of these sizes are not expected to useintensive rotational grazing systems. However, estimates on collected manure reductions arepresented on a per-head basis and model farm basis for the three sizes of beef feedlots includedin EPA’s ELG analysis for each of the five geographical regions.
Table 8-6 presents the expected reduction in collected manure and wastewater for flush and hose-and-scrape dairy operations, by head, and by region. Table 8-7 presents the expected reduction incollected manure and wastewater for dairy operations by model farm, and by region. Table 8-8presents the expected reduction in collected manure for beef feedlots, by head, and by region. Table 8-9 presents the expected reduction in collected manure for beef feedlots by model farm,and by region.
Table 8-6. Expected Reduction in Collected Solid Manure and Wastewater at DairiesUsing Intensive Rotational Grazing, per Head
Farm Type RegionManure Reduction
(lb/yr/head)Wastewater Reduction
(gal/yr/head)
Flush Pacific 10,200 - 41,500 9,000 - 36,500
Central 10,200 - 41,500 9,000 - 36,500
Midwest 10,200 - 20,500 9,000 - 18,000
Mid-Atlantic 10,200 - 30,700 9,000 - 27,000
South 30,700 - 41,500 27,000 - 36,500
Hose and Scrape Pacific 10,200 - 41,500 0
Central 10,200 - 41,500 0
Midwest 10,200 - 20,500 0
Mid-Atlantic 10,200 - 30,700 0
South 30,700 - 41,500 0
8-39
Table 8-7. Expected Reduction in Collected Solid Manure and Wastewater at DairiesUsing Intensive Rotational Grazing, per Model Farm
South 43,563,300 - 58,888,500 38,313,000 - 51,793,500
1,419 Hoseand
Scrape
Pacific 14,473,800 - 58,888,500 0
Central 14,473,800 - 58,888,500 0
Midwest 14,473,800 - 29,089,500 0
Mid-Atlantic 14,473,800 - 43,563,300 0
South 43,563,300 - 58,888,500 0
8-40
Table 8-8. Expected Reduction in Collected Solid Manure at Beef Feedlots Using Intensive Rotational Grazing, per Head
RegionManure Reduction
(lb/yr/head)
Pacific 5,040 - 20,167
Central 5,040 - 20,167
Midwest 5,040 - 10,080
Mid-Atlantic 5,040 - 15,120
South 15,120 - 20,167
Table 8-9. Expected Reduction in Collected Solid Manure at Beef Feedlots Using Intensive Rotational Grazing, per Model Farm
Farm Size (head) RegionManure Reduction
(lb/yr/farm)
844 Pacific 4,255,170 - 17,020,680
Central 4,255,170 - 17,020,680
Midwest 4,255,170 - 8,510,340
Mid-Atlantic 4,255,170 - 12,765,510
South 12,765,510 - 17,020,680
2,628 Pacific 13,249,500 - 52,998,000
Central 13,249,500 - 52,998,000
Midwest 13,249,500 - 26,499,000
Mid-Atlantic 13,249,500 - 39,748,500
South 39,748,500 - 52,998,000
43,805 Pacific 220,849,640 - 883,398,550
Central 220,849,640 - 883,398,550
Midwest 220,849,640 - 441,699,280
Mid-Atlantic 220,849,640 - 662,548,910
South 662,548,910 - 883,398,550
8-41
Advantages and Limitations: Compared with traditional grazing, intensive rotational grazing hasbeen identified as environmentally friendly and, when managed correctly, is often consideredbetter than conventional or continuous grazing. The benefits associated with intensive rotationalgrazing versus conventional grazing include:
• Higher live-weight gain per acre. Intensive rotational grazing systems result in highstocking density, which increases competition for feed between animals, forcing them tospend more time eating and less time wandering (AAC, 2000).
• Higher net economic return. Dairy farmers using pasture as a feed source will producemore feed value with intensive rotational grazing than with continuous grazing (CIAS,2000). Competition also forces animals to be less selective when grazing. They will eatspecies of plants that they would ignore in other grazing systems. This reduces lessdesirable plant species in the pasture and produces a better economic return (AAC, 2000).
• Better land. Pasture land used in rotational grazing is often better maintained than typicalpasture land. Intensive rotational grazing encourages grass growth and development ofhealthy sod, which in turn reduces erosion. Intensive rotational grazing in shoreline areasmay help stabilize stream banks and could be used to maintain and improve riparianhabitats (PPRC, 1996).
• Less manure handling. In continuous grazing systems, pastures require frequentmaintenance to break up large clumps of manure. In a good rotational system, however,manure is more evenly distributed and will break up and disappear faster. Rotationalgrazing systems may still require manure maintenance near watering areas and paths toand from the paddock areas (Emmicx, 2000).
Grazing systems are not directly comparable with confined feeding operations, as one system cannot readily switch to the other. However, assuming all things are equal, intensive rotationalgrazing systems might have some advantages over confined feeding operations:
• Reduced cost. Pasture stocking systems are typically less expensive to invest in thanlivestock facilities and farm equipment required to harvest crops. Feeding costs may alsobe lowered.
• Improved cow health. Dairy farmers practicing intensive rotational grazing typically havea lower cull rate than confined dairy farmers, because the cows have less hoof damage,and they are more closely observed by the farmer as they are moved from one paddock toanother (USDA, 1997).
• Less manure handling. Intensive rotational grazing operations have less recoverable solidmanure to manage than confined operations.
8-42
• Better rate of return. Research indicates that grazing systems are more economicallyflexible than the confinement systems. For example, farmers investing in a well-plannedgrazing operation will likely be able to recover most of their investment in assets if theyleave farming in a few years. But farmers investing from scratch in a confinementoperation would at best recover half their investments if they decide to leave farming(CIAS, 2000).
The disadvantages associated with intensive rotational grazing compared with eitherconventional grazing or confined dairy operations include:
• Limited applicability. Implementation of intensive rotational grazing systems isdependent upon available acreage, herd size, land resources (i.e., tillable versus steep orrocky), water availability, proximity of pasture area to milking center (for dairyoperations), and feed storage capabilities. Typical confined dairy systems and beeffeedlots are often not designed to allow cows easy access to the available cropland orpastureland. Large distances between the milking center and pastureland will increase thedairy cow’s expended energy and, therefore, increase forage demands.
In most of the country, limited growing seasons prevent many operations fromimplementing a year-round intensive rotational grazing system. Southern states such asFlorida can place cows on pasture 12 months of the year, but the extreme heat presentsother problems for cows exposed to the elements. Grazing operations in southern statestypically install shade structures and increase water availability to cows, which in turnincreases the costs and labor associated with intensive rotational grazing systems. Because most operations cannot provide year-round grazing, they still must maintainbarns and dry lot areas for their cows when they are not grazing, and operations oftenprefer not to have to maintain two management systems.
• Reduced milk production levels. Studies indicate that dairy farmers using intensiverotational grazing have a lower milk production average than confined dairy farms (CIAS,2000). Lower milk production can offset the benefit of lower feed costs, especially ifrations are not properly balanced once pasture becomes the primary feed source duringwarm months.
• Reduced weight gain. Beef cattle managed in an intensive rotational grazing systemwould gain less weight per day than beef cattle managed on a feedlot unless they weresupplied with extensive supplemental feed.
• Increased likelihood of infectious diseases. Some infectious diseases are more likely tooccur in pastured animals due to direct or indirect transmission from wild animals or thepresence of an infective organism in pasture soil or water (Hutchinson, 1998).
• Limited flexibility. Intensive rotational grazing systems have limited flexibility inplanning how many animals can be pastured in any one paddock. Available forage in a
8-43
paddock can vary from one cycle to another, because of weather and other conditions thataffect forage growth rates. As a result, a paddock that was sized for a certain number ofcows under adequate rainfall conditions will not be able to accommodate the samenumber of cows under drought conditions (USDA, 1997).
Operational Factors: As mentioned earlier, most dairy operations and beef feedlots cannotmaintain year-round intensive rotational grazing systems. These systems are typically operatedbetween 3 and 9 months of the year–with 12 months most likely in the southern states. Althoughoutwintering is a possibility for year round grazing in more northern states, it is not a commonpractice.
Demonstration Status: Due to the labor, fencing, water, and land requirements of intensiverotational grazing, typically only small dairy operations (those with less than 100 head) use thispractice (Hannawale, 2000; USDA NRCS, 2000; CIAS, 2000). Few beef feedlots practiceintensive rotational grazing. Climate and associated growing seasons make it very difficult foroperations to use an intensive rotational grazing system throughout the entire year.
Practice: Pasture-Based Systems at Swine Operations
Description: There are three main types of outdoor management systems at swine operations:pasture, open lots, and buildings with outside access. In pasture systems, crops are grown andthe animals are allowed to forage for their own food. Open lots are generally nonvegetative areaswhere the animals are allowed to roam. These open lots are typically available to animals thatare housed in buildings with outside access. The focus of this discussion is the pasture systems.
Application and Performance: This practice is applicable to any swine operation that hassufficient land. However, the practicality of the practice decreases with operation size. Wheaton and Rea (1999) found that the use of a good pasture containing such crops as alfalfa,clover, and grasses can support about 8 to 10 sows. Stocking rates, however, will depend uponsoil fertility, quality of pasture, and time of year. The recommended stocking rates are (Wheatonand Rea, 1999):
• Sows with litters 6 to 8 head per acre• Pigs from weaning to 100 pounds 15 to 30 head per acre• Pigs from 100 pounds to market 10 to 20 head per acre• Gestating sows 8 to 12 head per acre
Wheaton and Rea (1999) also found that pastured swine must receive two to three pounds ofgrain daily plus minerals and salt for proper weight gain. Adequate shade and water must also beprovided to pastured swine. Swine can be very tough on pastures and soil. Therefore, it isrecommended that producers rotate swine after each season and use the pasture for other animalsor harvest hay for about 2 years before using it again for swine (Wheaton and Rea, 1999). All thewaste produced by the animals while they are pastured is incorporated into the sod, and thereforerequires minimal waste disposal.
8-44
Advantages and Limitations: A pasture-based system offers a number of advantages anddisadvantages over confinement housing to swine producers. The advantages include (Wheatonand Rea, 1999):
• Lower feed costs on good pasture;• Exercise and nutrients for breeding sows;• Lower capital investment per production unit;• Good use of land not suitable for machine harvest;• Better isolation and disease control;• Decreased waste management handling; and• Decreased cannibalism.
The disadvantages include (Wheaton and Rea, 1999):
• Increased labor for animal handling, feeding, and watering;• Increased risk of internal parasites;• Increase labor for farrowing;• Increase animal production time to reach desired market weight; and• Lack of environmental controls.
Operational Factors: The increased labor costs associated with pasture-based swine operationsare partially offset by decreased waste handling costs and reduced feed costs.
Demonstration Status: Data from the USDA’s Animal and Plant Health Inspection Service -Veterinary Service indicate pasture-based systems are used at 7.6 percent of farrowingoperations, 1.5 percent of nurseries, and 6.7 percent of finishing operations (USDA APHIS,1995). The percentage of pigs raised on such operations is about five times less than the numberof operations, indicating these operations are generally smaller than other types of swineoperations. NAHMS confirmed this with additional analysis of the Swine ‘95 data, and indicated7 to 8 percent of swine farms with fewer than 750 total head use pasture systems, but less than 1percent of swine operations larger than 750 head use pasture systems (USDA NAHMS, 1999).
Practice: Pasture-Based Systems at Poultry Operations
Description: Pastured poultry refers to broilers, layers, and turkeys that are raised on pasture andfeed. There are three basic methods for raising poultry on pasture: pasture pens, free range, andday range (Lee, 2000). Pasture pens are bottomless pens that hold layers, broilers, or turkeys, andare moved daily or as needed to give the poultry fresh pasture. This is the most commonly usedpasture poultry method at present. To accommodate layers, nest boxes are fixed to the side of thepen. Approximately 30 to 40 hens can be housed in one typical pasture pen. Free rangegenerally means a fenced pasture surrounding the barn or poultry shelter, and day range is similarto free range except that the birds are sheltered at night from predators and weather.
8-45
Application and Performance: The use of pasture pens has been documented at operations with1,000 birds but is believed to be used most commonly at operations with fewer than 1,000 birds. Lee (2000) also indicates that pastured poultry operations require up to twice the amount of feedas confined poultry does to achieve the same weight gain and/or production goal. All wastesproduced while the birds are on pasture is incorporated into the sod, and therefore results inminimal waste requiring disposal.
Advantages and Limitations: Some of the advantages associated with pastured poultry versusconfinement housing are:
• Pasture pens are easy and inexpensive to build;• Controlled moves will harvest grass and help spread manure uniformly across the field;• Perimeter fencing is not required;• Diseases associated with confinement housing may be less likely to occur;• Waste management handling is reduced; and• Pasture-raised birds may have a higher market value (Lee, 2000).
The limitations associated with pastured poultry include the following:
• The small pens hold relatively few poultry, compared with their cost;• Pens can trap heat, leading to heat stress;• The roof height of the pens is too low for turkeys to stretch and raise their heads to full
height;• Pens may be difficult to move;• Pens offer only minimal protection from weather; and • Birds often have to bed down at night in manure-soaked grass (Lee, 2000).
Operational Factors: Pasture-based poultry operations require increased labor for animalhandling, feeding, and watering (Lee, 2000). This increased labor is partially offset by a decreasein waste management.
Demonstration Status: No data could be found to indicate the number of pasture-based poultryoperations. However, the use of pasture pens is rarely observed at operations with more than1,000 birds. Thus few if any pastured poultry operations confine sufficient numbers of birds tobe defined as CAFOs on the basis of operation size.
8-46
8.2 Manure/Waste Handling, Storage, and Treatment Technologies
Waste from animal feeding operations includes manure, bedding material, and animal carcasses. There are a variety of methods for handling, storing, and treating waste. Waste is handled in asolid form and through the use of water. As stated in earlier chapters, some facilities use water tomove the waste away from the animals and then separate the solids from the liquids prior tostorage, treatment, and disposal. Storage and treatment of waste is done in the both the solid andliquid/slurry forms.
8.2.1 Waste Handling Technologies and Practices
Different practices are used to handle or move liquid and solid wastes, and the choice of practicesdepends on the type of housing configuration. Housing configurations include total confinement,which is the most common and used almost exclusively in the poultry industry and at largerswine operations, open buildings with or without outside access, and lots or pastures with a hutor with no buildings.
Practice: Handling of Waste in Solid Form
Description: The use of hoop houses for swine and high-rise hog houses to handle manure in adry form was discussed in section 8.1. In facilities with open lots, manure accumulates on theground as a solid that can be diluted by rainfall (mostly for beef and dairy; swine and poultry aremostly totally confined) or by spillage from watering areas. Whether the lot is paved, partiallypaved, or unpaved, manure is typically handled as a solid or slurry and is scraped with tractorscrapers or front-end loaders and stored in a pile (see Figure 8-2). There are several options forseparating solid manure from the animals at confinement facilities. Solid, unslatted floors, bothpaved and unpaved, can be hand-scraped or scraped with a tractor or front-end loader into a pile,pit, or other storage facility. Sloped floors further aid in manure collection as animal trafficworks the manure downslope. Other facilities use uncovered alley or gutter systems combinedwith hand scraping, automatic scraping, or sloped floors to collect manure. Scraped manure fromunderslat gutters, alleys, or shallow pits can be held temporarily in a pit or a deep collectiongutter at one end of the building, from which it can be applied to the land or transferred to a morepermanent storage structure.
Application and Performance: Solid systems are best suited for open lot facilities, especially inareas that have a dry climate because exposed manure is less likely to be diluted by excessrainfall. The choice of solid or liquid handling systems, however, has been historically based onoperator preference with respect to capital investment, labor requirements, and availableequipment and facilities.
Advantages and Limitations: Solid handling systems offer both advantages and disadvantages tofacility operators. For instance, solid systems use equipment that is already present at the facility,such as tractors and front-end loaders. Tractors and front-end loaders are flexible, have fewermechanical problems, are less subject to corrosion, and work well on frozen manure, but they
8-47
Figure 8-2. Manure Scraped and Handled as a Solid on a Paved Lot Operation (from USDA NRCS, 1996)
require more labor than automatic scrapers. Solid systems are not as automated as liquidsystems; although they involve little or no capital investment and require less maintenance, theyrequire much more labor than mechanical scraper systems or flushing systems. An advantage tosolid systems is that the volume of manure handled is much less than the volume associated withliquid systems, which translates into smaller storage facility requirements. Bedding can be usedwithout concern for pumping or agitating equipment problems (which are a concern for liquidhandling systems).
Operational Factors: The extent of paving on an open lot determines the care with whichmanure is removed. Unpaved lots develop an impervious layer from bacterial activity and hoofaction, and this layer protects against soil loss and percolation of liquids. Also, scraping ofunpaved surfaces incorporates sand and soil into the manure, which can cause problems withstorage or treatment of the manure. If scraped manure is to be stacked, it may be necessary toadd an appreciable amount of bedding to attain a more solid consistency.
Demonstration Status: Solid handling systems are fairly common at smaller swine operations. According to Swine ’95 (USDA APHIS, 1996), removal of manure by hand is used most often inall types of operations (farrowing 38.2 percent, nursery 29.9 percent, and grower-finisher 27.2percent). Mechanical scrapers and tractors are also used for solids handling (farrowing 12.0percent, nursery 17.6 percent, and grower-finisher 24.9 percent).
8-48
Poultry waste is mostly handled as a dry litter, the exception being layer operations, particularlyin the South region (USDA NAHMS, 2000a).
Manure is often handled in solid form at smaller dairy farms. According to Dairy ‘96 (USDAAPHIS, 1996A), gutter cleaners are used most often to remove manure from dairy cow housingareas (63.2 percent). Mechanical scrapers or tractors are frequently used to clean alleys (57.7percent). A number of dairies store manure in solid form: 79.2 percent of dairies with fewer than100 cows and 59.5 percent of dairies with 200 or more cows are reported to use some form ofsolid waste storage (USDA APHIS, 1996B).
Scraping is the most common method of collecting solid and semisolid manure from beef barnsand open lots. Solids can be moved with a tractor scraper and front-end loader. Mechanicalscrapers are typically used in the pit under barns with slotted floors. Scraping is common formedium and large feedlots. (Loudon, 1985)
Practice: Teardrop, V- and Y-Shaped Pits With Scraper
Description: Confinement facilities have several manure collection options for separatingmanure liquids from manure solids. Several underfloor gutter systems that are applicable only toswine will be discussed. No comparable manure collection systems that separate liquids andsolids are known for other animal species.
The reason for separating swine manure into solids and liquids is to concentrate pollutants andnutrients. Kroodsma (1985) installed a plastic 0.78 mm filter net under the floor of a pig housein which eight pigs were fed by wet feeders so that no excess water fell into the manure. Solidsfell onto the screen and liquids passed through. The results showed that the relativelyundisturbed feces contained about 80 percent of the biological oxygen demand (BOD), chemicaloxygen demand (COD), total solids (TS), phosphorus (P), calcium (Ca), magnesium (Mg), andcopper (Cu). Sixty per cent of the total kjeldahl nitrogen (TKN) and forty percent of thepotassium (K) were also retained in the filter net. Thus, if solids can be recovered relativelyintact, parameters such as nutrients will be concentrated.
Two gutter configurations that may be useful for swine operations are Y-shaped and V-shapedgutters under slatted floors (Tengman, et al., undated draft). The sloping sides of the guttersfacilitate retention of solids and allow liquids to drain to the center collection area. Scrapers pullthe solids to one end of the barn for solids handling, while liquids flow with gravity in theopposite direction for management in a liquid manure system.
V-shaped gutters are easier to build than Y-shaped gutters and may be easier to clean. Manuremovement in v-shaped gutters is not substantially different than in y-shaped gutters. Thesideslope of Y- or V-shaped gutters should be 1:1 for farrowing operations and 3/4:1 fornurseries. A slope of 1:240 to 1:480 is recommended for the liquid gutter (Tengman, et al.,undated draft).
8-49
Manure that is scraped from underslat gutters, alleys, or shallow pits can be held temporarily in apit or a deep collection gutter at one end of the building, from which it can be applied to the landor transferred to a more permanent storage structure.
Application and Performance: The choice of a manure handling system is based primarily onoperator preference with respect to capital investment, labor requirements, and availableequipment and facilities. Demonstration of the economic viability or the value of concentratingnutrients using the Y-shaped gutter and V-shaped gutter is apparently lacking. No performancedata was found from full-scale demonstration of the segregation of constituents, includingpathogens, metals, growth hormones, and antibiotics.
Advantages and Limitations: The advantage in using a Y-shaped or V-shaped scrape collectionsystem would be the concentration of nutrients in the solids. Nutrients concentrated in solid formare cheaper to haul than in slurry form because water, which would increase the weight andvolume, is not added. Disadvantages include reduced air quality in hog buildings over manuresolids smeared on the collection slope, repair of cable scrapers in small spaces under slattedfloors with hogs present, the need for the operator to manage both a compost or solids stackingoperation with solids handling equipment and a liquid storage and application system with liquidhandling equipment.
Operational Factors: Climate, temperature, and rainfall generally do not affect scraper systemsin hog barns. If scraped manure solids are to be stacked or composted, it may be necessary to addan appreciable amount of bedding to attain a more solid consistency.
Demonstration Status: Underslat manure scrape and gutter systems to direct manure liquids andsolids to different handling systems have been developed, but they are not commonly used.
Practice: Handling of Waste in Liquid Form
Description: Liquid handling systems are the alternative to scraping and hauling manure. Theyare especially common in confinement housing operations because it is easier to installautomated systems inside new or existing structures and it is more difficult to maneuver tractorsor front-end loaders for scraping in small pens and tight corners. Excreted manure can becollected in shallow, narrow, open gutters or alleys, or it can collect under slats in gutters or pitsfor periodic flushing to a more permanent storage or treatment facility. The manure can also bedirectly applied to land without extended storage or treatment.
Slotted floors are an efficient method for removing manure from animal areas. Floors tend to betypically partially slotted over a pit or gutter. Feeding and resting areas are located on solidfloors, and watering areas are placed over slotted floors. Manure is worked through the slats byhoof action and is stored beneath the slats until it is pumped or flushed to a lagoon. Fresh watercan be used for flushing or water from a secondary lagoon can be recycled as flush water. Anexample of a slotted floor system is shown in Figure 8-3.
8-50
Figure 8-3. Fed hogs in confined area with concrete floor and tankstorage liquid manure handling (from USDA NRCS, 1996).
Application and Performance: Liquid manure systems are most frequently used for large animalfacilities, where the automation of waste management systems is very important. They may alsobe preferred where water is abundant or when rainfall on open lots causes considerable dilutionof manure solids. Liquid systems are especially appropriate when spray irrigation of nutrient-laden waters is the preferred method for fertilizing and watering crops.
Advantages and Limitations: Flushing systems with liquid manure handling are less labor-intensive and more automated than solid handling systems, but the volume of manure and waterto be stored, treated, and disposed of is greater. Flushing systems require large volumes of waterto be pumped and stored in a sump until discharged by gravity flow or pumped to a lagoon. Consequently, where water is a valuable commodity, liquid systems might not be economical. This limitation can be offset by recycling flush water from treatment lagoons. Equipment neededfor liquid systems, including sumps, pumps, agitators, choppers, and sprayers, brings with it highcapital, operating, and maintenance costs, although savings may be seen in decreased labor costs. Manure consistency is very important in liquid handling systems because the equipment can bedamaged by fibrous material (bedding), sand, or other foreign materials. Periodic cleanout ofsolids is necessary to maintain the capacity and proper functioning of storage structures andhandling equipment.
8-51
Operational Factors: Slats can be made of wood, concrete, steel, aluminum, or plastic. Concrete is the most sturdy material, is the least corrodible, and handles the weight of largeranimals, but it requires extra supports and the initial costs are higher than the costs of othermaterials. Wood is the least expensive material, but it can be chipped by the animals and needsto be replaced at least every 2 to 4 years. Plain steel and aluminum slats are subject to corrosion,but they can be galvanized or coated with paint or plastic to extend their life. Plastic slats, metalgrates, expanded metal mesh, and stainless steel slotted planks are appropriate for swinefarrowing and nursery operations that house smaller pigs. Openings between slats should begreater than 3/4 inch, up to 1 3/4 inches for swine operations.
Demonstration Status: The Swine ’95 report (USDA APHIS, 1996) demonstrates that liquidsystems, although not the most common type on a facility-by-facility basis, are still used fairlyfrequently. Flushing under slats accounts for 5.3 percent of farrowing, 9.4 percent of nursery,and 2.4 percent of grower-finisher operations, whereas flushing with open gutter systemsaccounts for 3.0, 2.1, and 3.4 percent of each operation type, respectively. Liquid handlingsystems are becoming increasingly popular as larger operations become more prevalent,necessitating automated systems for manure handling.
Poultry waste is mostly handled as a dry litter, the exception being layer operations, particularlythose in the South region. Approximately 40 percent of the laying operations in the South use aflush system with a lagoon (USDA NAHMS, 2000a).
Dairy ‘96 (USDA APHIS, 1996A) reports that a small number of dairy farms, 2.8 percent, usewater to remove manure from alleys. However, over 90 percent of operations with 200 or morecows are reported to use liquid manure storage systems (USDA APHIS, 1996B). According tothe NAHMS survey results (Garber, 1999), approximately 50% of all facilities with greater than500 mature dairy cows employ flushing as a means of cleaning the housing area.
A flushing system dilutes manure from beef feedlots with water to allow for automated handling. The system uses a large volume of water to flush manure down a sloped gutter to storage, wherethe liquid waste can be transferred to a storage lagoon or basin. This system is not common forlarge beef feedlots; however, this type of system is widely used at veal operations (Loudon,1985). Based on EPA site visits, about 67 percent of veal operations flush manure to liquidlagoon storage systems.
Practice: Berms and Storm Water Diversions
Description: “Clean” storm water runoff from land surrounding livestock facilities can bediverted from barns, open animal concentration areas, and waste storage or treatment facilities toprevent mixing with wastewater. This is accomplished through earthen perimeter controls androof runoff management techniques.
Earthen perimeter controls usually consist of a berm, dike, or channel constructed along theperimeter of a site. Simply defined, an earthen perimeter control is a ridge of compacted soil,often accompanied by a ditch or swale with a vegetated lining, located at the top or base of a
8-52
sloping area. Depending on their location and the topography of the landscape, earthen perimetercontrols can achieve one of three main goals: preventing surface runoff from entering a site,diverting manure-laden runoff created on site to off-site waste trapping devices, and intercepting“clean” storm water runoff and transporting it away from lagoons or belowground tanks. Therefore, diversions are used to protect areas from runoff and divert water from areas where it isin excess to locations where it can be stored, used, or released. Thus, it prevents the mixing of“clean” storm water with manure-laden wastewater, reducing the volume of wast water to betreated.
Roof runoff management techniques such as gutters and downspouts direct rainfall from roofsaway from areas with concentrated manure. Because these devices prevent storm water frommixing with contaminated water, they also reduce the volume of wastewater to be treated.
Application and Performance: Earthen perimeter controls or diversions are applicable where it isdesirable to divert flows away from barns, open animal concentration areas, and waste storage ortreatment facilities. They can be erected at the top of a sloping area or in the middle of a slope todivert storm water runoff around a feeding or manure storage site. However, unvegetated,earthen channels should not be used in regions of high precipitation because of potential erosionproblems.
The design capacity of a channel is calculated using Manning’s equation and is based onprecipitation, slope, wetted perimeter, water cross-sectional area, and surface roughness. Watervelocity is also a consideration in designing diversions to minimize erosion. Other types ofdiversions that can be used for runoff control include grassed waterways, which are natural orconstructed channels that provide stable runoff conveyance, and lined waterways or outlets,which are lined channels or outlets reinforced with erosion-resistant linings of concrete, stone, orother permanent materials to provide additional stability.
Advantages and Limitations: When properly placed and maintained, earthen perimeter controlsare effective for controlling the velocity and direction of storm water runoff. Used bythemselves, they do not have any ability to remove pollutants and thus must be used incombination with an appropriate sediment or waste trapping device at the outfall of the diversionchannel. With these diversion techniques, storm water runoff is prevented from mixing withcontaminated manure-laden wastewater and thus the volume of water for treatment isdecreased;.however, the concentrated runoff in the channel or ditch has increased erosionpotential. To such erosion, diversion dikes must be directed to sediment trapping devices whereerosion sediment can settle out of the runoff before being discharged. In addition, if a diversiondike crosses a vehicle roadway or entrance, its effectiveness may be reduced. Wherever possible,diversion dikes should be designed to avoid crossing vehicle pathways.
Operational Factors: The siting of earthen perimeter controls depends on the topography of thearea surrounding a specific site. When determining the appropriate size and design of thesediversion channels, the shape of the surrounding landscape and drainage patterns should beconsidered. Also, the amount of runoff to be diverted, the velocity of runoff in the diversion, and
8-53
the erodibility of soils on the slope and within the diversion channel or swale are essential designconsiderations.
Both diversion channels and roof management devices must be maintained to remain effective. If vegetation is allowed to grow in diversions, the roughness increases and the channel velocitydecreases which can cause channel overflow. Therefore, vegetation should be periodicallymowed. In addition, the dike should be maintained at the original height, and any decrease inheight due to settling or erosion should be remedied.
Roof management devices such as gutters and downspouts must be cleaned and inspectedregularly to prevent clogging and to ensure its effectiveness.
Demonstration Status: The use of earthen perimeter techniques such as berms, diversions, andchannels and the use of roof management techniques to divert storm water away from barns,open animal concentration areas, and waste storage or treatment facilities are well-acceptedpractices that prevent “clean” wastewater from mixing with manure-laden wastewater, thusreducing the volume of wastewater to be treated.
8.2.2 Waste Storage Technologies and Practices
The USDA NRCS recommends that storage structures be designed to handle the volume ofmanure produced between emptying events. The minimum storage period is based on the timingrequired for environmentally safe waste utilization considering climate, crops, soil, equipment,and local, state, and federal regulations. The design storage volume for liquid manure shouldaccount for manure, wastewater, precipitation and runoff (if uncovered), and other wastes thatwill accumulate during the storage period, such as residual solids that are not removed whenliquids are pumped. Other general considerations are inlet designs, outlets or pumping access,and safety (such as fencing, odor and gas control, reinforcement against earth movements andhydrostatic pressure, use of a cover, and amount of freeboard).
Practice: Anaerobic Lagoons
Description: Anaerobic lagoons are earthen basins that provide storage for animal wastes whiledecomposing and liquefying manure solids. Anaerobic processes degrade high biochemicaloxygen demand (BOD) wastes into stable end products without the use of free oxygen. Anaerobic lagoons are designed based on volatile solids loading rates (VSLR). Volatile solidsare the wastes that will decompose. The volume of the lagoon consists of the following (seeFigure 8-4):
1. Minimum Treatment Volume—The total daily volatile solids from all waste sourcesdivided by the volatile solids loading rate for a particular region. The minimum treatmentvolume is based on the volatile solids loading rate, which varies with temperature andtherefore with geographic location. Recommended volatile solids loading rates in theUnited States vary from 3 to 7 pounds per 1,000 ft3 per day.
8-54
2. Sludge Volume—Volume of accumulated sludge between cleanouts. A fraction of the manure solids settles to the bottom of the lagoon and accumulates as sludge. Theamount of sludge accumulation depends on the type and amount of animal waste.
3. Manure and Wastewater Volume—The volume of manure and wastewater transferredfrom feedlot operational facilities to the lagoon during the storage period. Lagoons aretypically designed to store from 90 to 365 days of manure and wastewater.
4. Net Precipitation—Precipitation minus the evaporation during the storage period.
5. Design Storm—Typically a 25-year, 24-hour storm event.
6. Freeboard—A minimum of 1 foot of freeboard. Freeboard is the extra depth added to thepond as a safety factor.
7. Runoff—The runoff volume from lagoon berms. In general, lagoons should not receiverunoff because runoff can shock the lagoon with an overload of volatile solids. Somerunoff will enter the lagoons from the berms surrounding them.
Anaerobic lagoons should be at least 6 to 10 feet deep, although 8- to 20-foot depths are typical. Deeper lagoons require a smaller surface area, and they more thoroughly mix lagoon contents asa result of rising gas bubbles and minimize odors. Lagoons are typically constructed byexcavating a pit and building berms around the perimeter. The berms are constructed with anextra 5 percent in height to allow for settling. The sides of the lagoon should be sloped with a2:1 or 3:1 (horizontal:vertical) ratio. Lagoons can be designed as single-stage or multiple-stage(usually two stages). Two-stage lagoons require greater total volume but produce a higherquality lagoon effluent.
Lagoon covers can be used to control odor and collect biogas produced from the naturaldecomposition of manure. Covers are usually made of a synthetic material, and are designed tofloat on the surface of the lagoon. Often, because of the large size of the lagoon, the cover isconstructed in multiple modules. Each module has flotation devices at the corners to help supportthe cover, and is tied down at the edge of the pond or lagoon. Covers typically have drainsconstructed in them to allow rainwater to drain through to the lagoon.
Lagoons are sometimes used in combination with a solids separator, typically for dairy waste. Solids separators help control the buildup of nondegradable material such as straw or otherbedding materials. These materials can form a crust on the surface of the lagoon, whichdecreases its activity.
Application and Performance: Anaerobic lagoons provide effective biological treatment ofanimal wastes. Anaerobic lagoons can handle high pollutant loads while minimizing manureodors. Nondegradable solids settle to the bottom as sludge, which is periodically removed. Theliquid is applied to cropland as fertilizer or irrigation water or is transported off site. Properlymanaged lagoons will have a musty odor. Anaerobic processes decompose faster than aerobic
8-55
processes, providing effective treatment of wastes with high BOD, such as animal waste. Anaerobic lagoons are larger than storage ponds because additional volume is needed to providebiological treatment; however, since a constant oxygen concentration is not required, anaerobiclagoons are generally smaller than aerobic lagoons.
Lagoons reduce the concentrations of both N and P in the liquid effluent. Phosphorus settles tothe bottom of the lagoon and is removed with the lagoon sludge. Approximately 60 percent ofthe influent N is lost through volatilization to ammonia (Fulhage, Van Horn). Microbial activityconverts the organic N to ammonia N. Ammonia N can be further reduced to elemental nitrogen(N2) and released into the atmosphere. Lagoon effluent can be used for land application orflushing of animal barns, or can be transported off site. The sludge can also be applied to landprovided the soil is not saturated with nutrients. Information on the reduction of BOD,pathogens, and metals in lagoons is not available. Reductions in chemical oxygen demand, totalsolids, volatile solids, total N, P, and potassium are presented in Table 8-10.
Advantages and Limitations: Anaerobic lagoons offer several advantages over other methods ofstorage and treatment. Anaerobic lagoons can handle high pollutant loads and provide a largevolume for long-term storage. They stabilize manure wastes and reduce N content throughbiological degradation. Lagoons allow manure to be handled as a liquid, which reduces laborcosts. If lagoons are located at a lower elevation than the animal barns, gravity can be used totransport the waste to the lagoon, which further reduces labor. Mild climates are most suitable
8-56
for lagoons; cold weather reduces the biological activity of the microorganisms that degrade thewastes. Lagoons can experience spring and fall turnover, in which the more odorous bottommaterial rises to the surface. Foul odors can also result if biological activity is reduced or if thereis a sudden change in temperature or pollutant loading rate.
Operational Factors: To avoid ground water and soil contamination, several factors must beconsidered. The lagoon should be located on soils with low to moderate permeability or on soilsthat can form a seal through sedimentation and biological action (NRCS). Impervious barriers orliners are used to reduce seepage through the lagoon bottom and sides and are described in thefollowing practice.
Lagoon inlets should be designed from materials that resist erosion, plugging, and freezing. Vegetation around the pond should be maintained to help stabilize embankments.
Lagoons must be properly maintained for effective treatment. The minimum treatment volumeof the lagoon must be maintained. Lagoons work best when the influent flow is a steady, gradualflow rather than a large slug flow. The pH of the lagoon should be monitored. The optimum pHfor lagoon treatment is about 6.5, which maximizes the activity level of the bacteria. Lime canbe added to the lagoon to increase pH to this level. Also, since the rate of volatile solidsdecomposition is a function of temperature, the acceptable volatile solids loading rate varies withclimate. The loading rate should be monitored to ensure that it is appropriate to the region inwhich the lagoon is located.
Demonstration Status: Anaerobic lagoons without covers are used at 20.9 percent of all grower-finisher swine operations. Of these, swine operations with 10,000 or more head use uncoveredlagoons most frequently (81.8 percent) (USDA APHIS, 1996). Lagoons are used on egg-layingfarms in warmer climates. Beef facilities typically use storage ponds rather than lagoons. NAHMS estimates that 1.1 percent of dairies with more than 200 head use anaerobic lagoonswith a cover and 46.7 percent use anaerobic lagoons without a cover (USDA APHIS, 1996b). The use of lined lagoons is dependent on site-specific conditions.
Practice: Lagoon Liners
Description: Lagoon liners are impervious barriers used to reduce seepage through the lagoonbottom and sides.
8-57
Figure 8-4. Cross Section of Anaerobic Lagoons(Source: USDA NRCS, 1998)
Application and Performance: Soil that is at least 10 percent clay can be compacted with asheepsfoot roller to create a suitable impervious barrier. If the soil is not at least 10 percent clay,a liner or soil amendment should be used. There are also site conditions that may require seepage
reduction beyond what is provided by compacting the natural soil. These conditions mayinclude a shallow underlying aquifer, an underlying aquifer that is ecologically important or usedas a domestic water source, or highly permeable underlying bedrock or soil. There are threeoptions available to provide additional seepage reduction. First, the soil can be mixed withbentonite or a soil dispersant and then compacted. Clay can be imported from another area andcompacted along the bottom and side walls. Last, concrete or synthetic materials such asgeomembranes or geosynthetic clay liners can be used.
Advantages and Limitations: Concrete and synthetic liners are usually the most expensive.
Operational Factors: The method chosen to line the lagoon depends on the type of soil, sitegeography and location, available materials, and economics.
Demonstration Status: The use of lined lagoons depends on site-specific conditions.
Practice: Storage Ponds
Description: Waste storage ponds are earthen basins used to store wastes temporarily, includingrunoff, solids (e.g. manure), and wastewater. The total volume of the pond consists of thefollowing (see Figure 8-5):
1. Sludge Volume—Volume of accumulated sludge between cleanouts. A fraction of themanure solids settles to the bottom of the pond and accumulates as sludge. The amountof sludge accumulation depends on the type and amount of animal waste.
8-58
D epth o f 25-year, 24 -hour storm even t
S ludge vo lum e
M anure and w astew ater vo lum e
D epth o f norm al precip ita tion less evaporation
2. Manure and Wastewater Volume—The volume of manure and wastewater from feedlotoperational facilities transferred to the pond during the storage period. Ponds aretypically designed to store from 90 to 270 days of manure and wastewater. Thepercentage of solids in the influent will depend on animal type and the waste managementsystem.
3. Runoff—The runoff from the sites (usually the drylot area at animal feeding operations).
4. Net Precipitation—Precipitation minus the evaporation for the storage period.
5. Design Storm—Typically a 25-year, 24-hour storm event.
6. Freeboard—A minimum of 1 foot of freeboard. Freeboard is the extra depth added to thepond as a safety factor.
Ponds are typically rectangular in shape and are constructed by excavating a pit and buildingberms around the perimeter. The berms are constructed with an extra 5 percent in height to allowfor settling. The sides of the pond are typically sloped with a 1.5:1 or 3:1 (horizontal:vertical)ratio.
Ponds are typically used in combination with a solids separator. Solids separators help controlbuildup of material such as straw or other bedding materials on the surface of the pond.
Pond covers can be used to control odor and collect biogas produced from the naturaldegradation of manure. Covers are usually made of a synthetic material, and are designed to floaton the surface of the impoundment. Often, because of the large size of the pond, the cover isconstructed in multiple modules. Each module has flotation devices at the corners to help supportthe cover, and is tied down at the edge of the pond. Covers typically have drains constructed inthem to allow rainwater to drain through to the pond.
Application and Performance: Waste storage ponds are frequently used at animal feedingoperations to contain wastewater and runoff from contaminated areas. Manure, process water,and runoff are routed to these storage ponds, where the mixture is held until it can be used for
8-59
irrigation or transported off site. Solids settle to the bottom as sludge, which is periodicallyremoved. The liquid is applied to cropland as fertilizer or irrigation water, or is transported offsite.
Storage ponds hold wastewater and manure and are not intended to actively treat the waste. Because they do not require additional volume for treatment, storage ponds are smaller in sizethan treatment lagoons.
Ponds reduce the concentrations of both N and P in the liquid effluent. Phosphorus settles to thebottom of the pond and is removed with the sludge. Influent N is reduced through volatilizationto ammonia. Pond effluent can be used for land application or flushing animal barns, or it can betransported off site. The sludge can also be applied to the land provided the soil is not saturatedwith P.
Advantages and Limitations: Storage ponds provide a large volume for long-term waste storageand allow manure to be handled as a liquid. If ponds are located at a lower elevation than theanimal barns, gravity can be used to transport the waste to the pond, which minimizes labor. Although ponds are an effective means of storing waste, no treatment is provided. Becauseponds are open to the air, odor can be a problem.
Operational Factors: To avoid ground water and soil contamination, several factors must betaken into consideration. Impervious barriers or liners are used to reduce seepage through thepond bottom and sides. Soil that is at least 10 percent clay can be compacted with a sheepsfootroller to create a suitable impervious barrier. If the soil is not at least 10 percent clay, a liner orsoil amendment should be used. There are also site conditions that may require seepagereduction beyond what is provided by compacting the natural soil. Conditions may include ashallow underlying aquifer, an underlying aquifer that is ecologically important or used as adomestic water source, or highly permeable underlying bedrock or soil. There are three optionsavailable to provide additional seepage reduction. First, the soil can be mixed with bentonite or asoil dispersant and then compacted. Clay can be imported from another area and compactedalong the bottom and side walls. Last, concrete or synthetic materials such as geomembranes orgeosynthetic clay liners can be used. Concrete and synthetic liners are usually the mostexpensive. The method chosen to line the pond depends on the type of soil, site geography andlocation, available materials, and economics.
Pond inlets should be designed from materials that resist erosion, plugging, and freezing. Vegetation around the pond should be maintained to help stabilize embankments.
Demonstration Status: Ponds are a common method of waste storage for swine, beef, and dairyfacilities and are used on poultry farms in warmer climates. Beef feedlots tend to use storageponds for collection of runoff from the drylots. EPA estimates that 50 percent of the medium-size(300-1000 head) beef feedlots in all regions and 100 percent of the large-size (>1,000 head) beeffeedlots in all regions have a storage pond for runoff. NAHMS estimates 27.8 percent of dairiesuse earthen storage basins (USDA APHIS, 1999). The use of lined ponds depends on site-specific conditions.
8-60
Practice: Pit Storage
Description: Manure pits are a common method for storing animal wastes. They can be locatedinside the building underneath slats or solid floors, or outside and separated from the building. Typical storage periods range from 5 to 12 months, after which manure is removed from the pitand transferred to a treatment system or applied to land. There are several design options for pitstorage. For example, shallow pits under slats provide temporary storage and require morefrequent manure removal to longer-term storage or for land application. Pit recharge systems,which are common in the Midwest, involve regularly draining the pit contents to a lagoon andrecharging the pit with fresh or recycled water. The regular dissolution of solids keeps the pitsfree of excessive buildup while providing temporary storage for manure. Pit recharge systemstypically have level floors with an average depth of 12 inches of recharge water, 12 inchesallowed for waste accumulation, and 12 inches of air space between the pit surface and theslatted floor.
Application and Performance: Because agitating and pumping equipment does not handle solidor fibrous materials well, manure with greater than 15 percent solids will require dilution. Chopper-type agitators may be needed to break up bedding or other fibrous materials that mightbe present in the pit.
Advantages and Limitations: Below-floor storage systems provide ease of collection andminimize volume while maximizing fertilizer value, but they may cause a buildup of odors andgases and can be difficult to agitate and pump out. Remote storage avoids odor and gas buildupin animal housing areas and provide options for methane production and solids separation, butentails additional costs for transfer from the housing facilities to storage.
Operational Factors: Pits must have access for pumping equipment, and outside pits must becovered or fenced to prevent accidental entry into the pit. They should be designed to withstandanticipated hydrostatic, earth, and live loads as well as uplifting in high-water-table areas. Beforethe pit is filled with manure, water is typically added to prevent solids from sticking to the pitfloor. Depths range from 3 to 4 inches under slatted floors and 6 to 12 inches if manure isscraped and hauled to the pit. Sand should not be used as a bedding material because it isincompatible with pumping systems. The pits should always be free of nails, lumber, or otherforeign material that can damage equipment.
Demonstration Status: Pit holding is mostly done at swine operations. Swine ’95 (USDA-APHIS, 1996) reports that pit holding accounts for 25.5, 33.7, and 23.2 percent of farrowing,nursery, and grower-finisher operations, respectively.
Below-floor slurry or deep pit storage is reported in Dairy ‘96 (USDA APHIS, 1996b) at 7.9percent of all dairy operations. Based on EPA site visits, about 33 percent of veal operations arebelieved to utilize pit storage systems. Beef feedlots do not typically utilize pit storage.
8-61
Practice: Belowground or Aboveground Storage Tanks
Description: Belowground and aboveground storage tanks are used as an alternative to under-building pit storage and earthen basins. Both aboveground and belowground tanks arecommonly constructed of concrete stave, reinforced monolithic concrete, lap or butt joint coatedsteel, or spiral wound coated steel with concrete floors. Current assembly practices foraboveground storage facilities are primarily circular silo types and round concrete designs, butthe structures may also be rectangular. Belowground storage can be located totally or partiallybelow grade. All storage tanks must be engineered to withstand operational constraints,including internal and external hydrostatic pressure, flotation and drainage, live loads fromequipment, and loads from covers and supports. Belowground tanks should be surrounded byfences or guardrails to prevent people, livestock, or equipment from accidently entering the tank.
When located directly adjacent to the animal housing facility, belowground tanks are easily filledby scraping directly into the tank. In those situations where the storage tank is not adjacent to theanimal housing facility, a collection pit or sump is necessary for loading. In these systems a largepiston or pneumatic manure pump forces waste through a large-diameter underground pipe. Aboveground tanks at a lower grade than the livestock housing facility can often be gravity-fedthrough a similar underground pipe. The tank can be loaded from the top or bottom. Bottomloading in aboveground tanks is most appropriate for manure that forms a surface crust, such ascattle manure. The inlet pipe is usually located 1 to 3 feet above the bottom of the tank toprevent blockages from solids. An advantage to bottom loading is that it pushes solids awayfrom the inlet pipe and distributes them more evenly. Top loading is suitable and most commonfor manures that do not crust (i.e., liquid swine manure); however, top loading in an abovegroundsystem requires that manure be pumped against gravity. Figure 8-6 shows a typical abovegroundstorage tank.
Application and Performance: Aboveground or belowground tanks are suitable for operationshandling slurry (semisolid) or liquid manure. This generally excludes open-lot waste which isinconsistent in composition and has a higher percentage of solids. Furthermore, because of thehigh cost of storage volume, prefabricated storage tanks are generally used to contain only waste,but not runoff, from the livestock facility.
Belowground and aboveground storage tanks are appropriate and preferred alternatives insituations where the production site has karst terrain, space constraints, or aesthetics issuesassociated with earthen basins. Storing manure in prefabricated or formed storage tanks isespecially advantageous on sites with porous soils or fragmented bedrock. Such locations maybe unfit for earthen basins and lagoons out of concern that seepage and ground watercontamination may occur. Construction of formed storage tanks often includes installation of aliner beneath the concrete to prevent seepage. Aboveground formed storage facilities allowvisual monitoring for leaking. Aboveground tanks may exhibit unsightly leaks at seams, boltholes, or joints, but these are usually quickly sealed with manure. In these storage systems thejoint between the foundation and sidewall is the greatest concern. Leaching and ground watercontamination can occur if the tank is not sealed properly.
8-62
Figure 8-6. Aboveground Waste Storage Tank (from USDA NRCS, 1996).
Proper operational practices to maintain adequate storage tank capacity between landapplications are critical. The holding volume of a storage tank consists of five fractions: residualvolume, manure/waste storage volume (bedding, wasted feed, water added for manure handling),wash water volume, net rainfall and evaporation change, and freeboard capacity.
In general, large amounts of water are not added during the handling of manure that is stored inan aboveground or belowground storage tank. Installation costs usually dictate that capacity belimited to manure storage requirements. Thus, water conservation is often practiced by facilitiesthat use aboveground or belowground storage tanks. For these facilities, recycling of wastewateris not an option because the manure is generally in slurry form with more than 4 percent solids.
Aboveground and belowground storage tanks are simply storage facilities, and they do notfacilitate treatment of the manure. Thus, there is little to no effect on the reduction of nutrients,pathogens, solids, heavy metals, growth hormones, or antibiotics. Nitrogen in liquid manure ispredominately in the inorganic form. This allows for some ammonia volatilization into theatmosphere and a reduction in the total amount of N.
Advantages and Limitations: When these systems are used, manure agitation is necessary beforethe contents of the storage structure are pumped into a tanker wagon for land application. Agitation ensures uniform consistency of manure and prevents the buildup of solids, thusmaintaining the storage capacity of the tank. Agitation results in a more even distribution ofnutrients in the manure prior to land application. It can be accomplished with high-horsepower,propeller-type agitators or by recirculating with a high-capacity pump. The length of time themanure needs to be agitated depends on the size of the storage tank, the volume of manure itcontains, the percent of solids in the manure, and the type of agitator. Manure with up to 15percent solids can be agitated and pumped. Because of the potential for agitation and pumpingproblems, only small amounts of chopped bedding are recommended for use in systems usingstorage tanks. Some types of agitators have choppers to reduce the particle size of bedding and
8-63
solids. Dilution with additional water may be necessary to reduce agitation problems. Onedesign variation places the pump in a sump outside the tank, using it for both agitation andpumpouts.
Manure in a storage tank undergoes some anaerobic decomposition, releasing odorous andpotentially toxic gases, such as ammonia and hydrogen sulfide. Methane is also produced. Covers can be installed to interrupt the flow of gases up from the liquid surface into theatmosphere. Types of covers range from polyethylene, concrete, or geotextile to biocovers suchas chopped straw. Various covers have been shown to reduce odors by up to 90 percent. Furthermore, particular types of covers can be used as methane reservoirs to collect and containgases from the digestion process for disposal by flaring or converting to electrical power. Moreover, certain covers can prevent rainwater dilution and accumulation of airborne silts anddebris. Finally, it is generally accepted that some types of covers control N volatilization into theatmosphere and maintain the N content of the manure.
The installation costs associated with prefabricated storage tanks are high when compared withother liquid manure-handling systems. Glass-lined steel tanks are typically associated with thehighest cost. The useful life of the tanks depends on the specific manufacturer and the operator’smaintenance practices. Once they have been installed, aboveground and belowground storagetanks have a low labor requirement, especially when designed as a gravity feed system (PurdueResearch Foundation, 1994).
Operational Factors: Specific storage structure designs will vary by state because of climate andregulatory requirements. Pumping manure during freezing conditions can be a problem unless allpipes are installed below the freezing level in the ground. Design considerations in these systemsinclude check valves if bottom loading is used, pumping power with respect to the maximumhead, and pipe friction from the pump to the storage.
Demonstration Status: Belowground and aboveground storage tanks are in use nationwide inswine, poultry, and dairy operations. They are appropriate for use in all slurry-based manurehandling systems, including those with shallow-pit flush systems, belt or scrape designs, or open-gutter flush systems.
Practice: Solid Poultry Manure Storage in Dedicated Structures
Description: In the broiler and turkey segments of the poultry industry, specially designedpole-type structures are typically used for the temporary storage of solid poultry manure;however, horizontal (bunker) silo-type structures are also used. Manure produced in “high-rise”houses for caged laying hens does not require a separate storage facility if handled as a solid.
A typical pole-type storage structure is 18 to 20 feet high and 40 feet wide. The length dependson the storage capacity desired but is usually a minimum of 40 feet. The structure will have afloor of either compacted soil or concrete, the latter being more desirable but much moreexpensive. The floor elevation should be at a height above grade that is adequate to prevent anysurface runoff from entering the structure. A properly sited structure will be oriented parallel to
the direction of the prevailing wind. Equipment access will be through the lee side, which willhave no wall. The other three sides of the structure will have walls extending from the floor to aheight of 6 to 8 feet. Experience has shown that a higher wall on the windward side of thebuilding excludes precipitation more effectively. Walls may be constructed using pressure-treated lumber or reinforced concrete. Wooden trusses covered with steel sheets are mostcommonly used for roofing, although plywood roof decking covered with composition shinglesis also an option. Manure is usually stacked to a height of 5 to 8 feet. Figure 8-7 shows threetypes of permanently covered solid manure storage structures. Horizontal silo-type storage structures are also used for the temporary storage of solid poultrymanure. These storage structures can be constructed using either post-and-plank or reinforcedconcrete walls on three sides. Equipment access will be through the lee side which will have nowall. Concrete walls can be poured in place or made with prefabricated sections that are manufactured for horizontal silo construction. Wall height can be from as low as 3 to 4 feet to ashigh as 8 to 10 feet if prefabricated concrete sections are used. Usually, there is a concrete floor.
Again, floor elevation should be sufficiently above grade to prevent surface runoff from enteringthe structure. With this type of storage structure, 6-mil or heavier plastic is typically used tocover the stored manure, but tarpaulins have also been used. As with horizontal silos, old tiresare commonly used to secure the cover, although ropes or cables can also be used. Manure isusually stacked to a height of 5 to 8 feet.
8-65
In the broiler industry, total cleanouts of production facilities occur only after a minimum of 1year of production. A total cleanout frequency of 2 to 3 years is not uncommon. Total cleanoutsmay be more frequent for brood chambers, but the frequency depends on the cost and availabilityof bedding material, the incidence of disease, the concentration of gaseous ammonia within theproduction facility, and the policy of the integrator. Caked manure, also known as crust, isremoved after every flock, typically a period of 49 days for 4- to 5-pound broilers. Usually,storage structures are designed only for the storage of this caked manure because most broilergrowers view the cost of a structure large enough to store manure and litter from a total cleanoutas prohibitively high. Because caked manure production varies with the type of beddingmaterial, type of watering system, and climatic conditions, storage requirements may vary fromfarm to farm. Also, cake production increases with bedding age. Local experience is usuallyrelied upon to estimate storage requirements.
In the turkey industry, total cleanouts of brooder facilities occur after every flock to controldisease, but grow-out facilities typically are totally cleaned out only once a year. Again, mostturkey growers consider the cost of storage of the manure and bedding from a total cleanout ofgrow- out facilities to be prohibitively high. Therefore, structures are typically sized only for thestorage of manure and bedding from brooder houses.
Application and Performance: The temporary storage of solid poultry manure in a dedicatedstructure is applicable to all poultry operations at which birds are maintained on a beddingmaterial. Thus, this practice is applicable to all broiler and turkey operations and the smallfraction of egg-producing operations that do not house birds in cages. The combination ofmanure and bedding generated in these operations has a moisture content of less than 50 percent,usually 25 to 35 percent, and is handled as a solid. This practice is not necessary for caged layinghens in high-rise housing because the production facility has a manure storage capacity of 1 ormore years.
When sized and managed correctly, storage of solid poultry manure in a dedicated structure willallow for the most efficient use of plant nutrients in the manure for crop production. Thiseliminates the potential for contamination of surface and ground waters resulting from openstacking of manure or spreading during the fall, winter, and early spring and after cropestablishment, when there is no potential for crop uptake. When the stored manure is effectivelyprotected from precipitation, odor and fly problems are minimal. Odor can be a problem,however, when the manure is removed from the storage structure and spread on cropland.
The storage of caked broiler litter and turkey brooder house manure and bedding reduces thepotential impact of these materials on surface and ground water quality; however, a substantialfraction of the manure and bedding produced by these segments of the poultry industry is notstored because the associated cost is viewed as prohibitive. The material resulting from the totalcleanout of broiler houses and turkey grow-out facilities is often stored temporarily in open pilesor spread at inappropriate times of the year. Thus, storage, as currently practiced, probably is notas effective in reducing water quality impacts as is presently thought.
8-66
Advantages and Limitations: A correctly sized and managed storage structure allows applicationto cropland when nutrients will be most efficiently used, thus minimizing negative impacts onsurface and ground waters as noted above. If application to cropland is not a disposal alternative,storage can facilitate off-site disposal other than application to cropland.
The principal disadvantage of storing solid poultry manure in a dedicated structure is the cost ofthe structure and additional material handling costs. Currently, sources of government assistanceare available (e.g., cost-share funds available from local soil and water conservation districts) topartially offset construction costs and encourage the adoption of this practice.
Operational Factors: Spontaneous combustion in stored poultry manure has been a problem andhas led to the recommendation that stacking height be limited to 5 to 8 feet to avoid excessivecompaction. Fires in solid poultry manure storage structures, like silo fires, are extremelydifficult to extinguish and often lead to the total loss of the structure.
Demonstration Status: Permanent covered structures for storage of solid manure are usedextensively in the broiler and turkey segments of the poultry industry. In a 1996 survey of broilergrowers on the Delmarva Peninsula, 232 of 562 respondents indicated that they used a permanentstorage structure (Michel et al., 1996).
Practice: Concrete Pads
Description: Concrete pads are used as semi-impermeable surfaces upon which to place waste. The waste pile is often open to the environment, but it can be covered with a roof or plasticsheeting to minimize exposure to the elements. Pads are often sloped to a central location toallow for drainage of rainwater and runoff.
The design for concrete pads varies according to the type of waste it receives (wet or dry) Wastethat includes settled solids from a settling basin or solids separator has a high moisture content.In this case, the concrete pad typically has at least two bucking walls to contain the waste and tofacilitate the loading and unloading of waste onto the pile. The design height of the waste piledoes not exceed about 4 feet, because of the semi-liquid state of the waste. For operations withdrier waste, the concrete pad typically does not have bucking walls, and the maximum height ofthe manure pile is 15 feet, because the manure is drier and can be stacked more easily.
Figure 8-8 illustrates the design of a concrete pad (MWPS,1993; USDA NRCS, 1996). Concretepads are between 4 and 6 inches thick and are made of reinforced concrete to support the weightof a loading truck. The concrete pad is underlain by 4 inches of sand and 6 inches of gravel. Thepad is sloped to divert storm water runoff from the pile to the on-site waste management facility,such as a lagoon or a pond. Bucking walls, made of reinforced concrete, are 8 inches thick and 3to 4 feet tall.
8-67
Figure 8-8 Concrete Pad Design
Application and Performance: Concrete pads are used at animal feeding operations to provide asurface on which to store solid and semi-solid wastes that would otherwise be stockpiled directlyon the feedlot surface. Manure scraped from dry lots and housing facilities and solids separatedfrom the waste stream in a solids separator can be stored on a concrete pad.
The pads provide a centralized location for the operation to accumulate excess manure for lateruse on site (e.g. bedding, land application) or transportation off site. A centralized location forstockpiling the waste also allows the operation to better control storm water runoff (andassociated pollutants). Rainwater that comes into contact with the waste is collected on the
8-68
concrete pad and is directed to a pond or lagoon and is thereby prevented from being released onthe feedlot. The pad also provides an impermeable base that minimizes or prohibits seepage ofrainfall, leaching pollutants or nutrients from the waste and infiltrating into the soil beneath it.The waste is not treated once it is on the concrete pad; the pad serves as a pollution preventionmeasure. However, with regular handling of the waste, the N loads in the waste will be releasedinto the atmosphere through volatilization, and both N and P may be contained in runoff from thepile after storm events. Pathogen content, metals, growth hormones, and antibiotics loads are notexpected to decrease significantly on the concrete pad unless the pile ages considerably.
Advantages and Limitations: An advantage to using a concrete pad for storage is to controlrunoff and prevent waste from contaminating the surrounding environment. When rainwater orprecipitation comes into contact with the pile, the water may percolate through the pile, carryingpollutants along the way. The water may exit the pile as runoff and carry pollutants to surfacewaters or seep into the ground. The concrete pad and bucking walls minimize this potentialseepage into and runoff onto the ground around the pile.
Depending on the duration of storage required, however, these pads can take up a very large area. An operation may not have sufficient area to install a concrete pad large enough to store waste inone place. It can also be expensive to construct a concrete pad large enough to accommodate theamount of waste that would accumulate over an appropriate storage time.
Waste stored on a concrete pad will still need to be further managed, either by land application orby transportation off site. There may be some odors from the pile on a concrete pad, but no morethan would be expected from any manure stored in a pile.
Operational Factors: Operations that frequently transport their waste will require less storagevolume than operations that have less frequent hauling schedules. Operations requiring lessstorage capacity will require a smaller pad area, resulting in lower capital costs.
Demonstration Status: Concrete pads are used relatively infrequently in the livestock industry.They are more commonly used in dairies than in poultry, beef or swine operations, because dairywaste is semi solid and bucking walls are needed to contain the waste effectively, given thehigher moisture content. Waste from swine operations is generally too wet to stack on a pad, andbeef and poultry waste is usually piled directly on the feedlot.
8.2.3 Waste Treatment Technologies and Practices
8.2.3.1 Treatment of Animal Wastes and Wastewater
Some treatment systems store waste as well as change the chemical or physical characteristics ofthe waste. Anaerobic lagoons are the most common form of treatment for animal feedingoperations. Other technologies use oxidation to break down organic matter. These includeaerated lagoons and oxidation ditches for liquids and composting for solids.
8-69
Practice: Anaerobic Digesters for Methane Production and Recovery
Description: An anaerobic digester is a vessel that is sized both to receive a daily volume oforganic waste and to grow and maintain a steady-state population of methane bacteria to degradethat waste. Methane bacteria are slow growing, environmentally sensitive bacteria that growwithout oxygen and require a pH greater than 6.5 to convert organic acids into biogas over time. Anaerobic digestion can be simplified and grouped into two steps. The first step is easy torecognize because the decomposition products are volatile organic acids that have disagreeableodors. During the second step, methane bacteria consume the products of the first step andproduce biogas—a mixture of carbon dioxide and methane—a usable fuel by-product. Aproperly operating digester will produce a gas with minimal odor because methane bacteria fromthe second step reach a population large enough to rapidly consume the products of the first step. There are three basic temperature regimes for anaerobic digestion: psychrophilic, mesophilic, andthermophilic. Psychrophilic, or low-temperature, digestion is the natural decomposition path formanures at temperatures found in lagoons. These temperatures vary from about 38 to 85 (F (3 to29 (C). The hydraulic retention time (HRT) required for stable operation varies from 90 days atlow temperatures to 30 days at higher temperatures. Methane production will vary seasonallywith the variation in lagoon temperature.
Maintaining a constant elevated temperature enhances methane production. Mesophilic digestioncultivates bacteria that have peak activity between 90 and 105 (F (32 to 40 (C). Mesophilicdigesters operate at a retention period of 12 to 20 days. Thermophilic digesters promote bacteriathat grow at between 135 to 155 (F (57 to 68 (C); these digesters operate with a retention time of6 to 12 days.
Although there are many types of anaerobic digesters, only covered lagoons operating at ambienttemperatures, complete-mix digesters, and plug-flow digesters can be considered commerciallyavailable, because they are the only ones that have been implemented successfully at 10 or moresites.
A cover can be floated on the surface of a properly sized anaerobic lagoon to recover methane.Ideally, the cover is floated on the primary lagoon of a two-cell lagoon system, with the primarylagoon maintained as a constant volume treatment lagoon and the second cell used to providestorage of treated effluent until the effluent can be properly applied to land. The lagoons are notheated, and the lagoon temperature and biogas production vary with ambient temperatures.Coarse solids, such as hay and silage fibers in cow manure, must be separated in a pretreatmentstep and kept from the lagoon. If dairy solids are not separated, they will float to the top andform a crust. The crust will thicken, reducing biogas production and eventually filling thelagoon.
A complete-mix digester is a biological treatment unit that anaerobically decomposes animalmanures using controlled temperature, constant volume, and mixing. These digesters canaccommodate the widest variety of wastes. Complete-mix digesters are usually aboveground,heated, insulated, round tanks; however, the complete-mix design has also been adapted tofunction in a heated, mixed, covered earthen basin. Mixing can be accomplished with gas
8-70
recirculation, mechanical propellers, or liquid circulation. In Europe, some mixed digesters areoperated at thermophilic temperatures; however, most of these are regional digesters that arebuilt and operated by digester professionals. A complete-mix digester can be designed tomaximize biogas production as an energy source or to optimize volatile solids (VS) reductionwith less regard for surplus energy. Either process is part of a manure management system, andsupplemental effluent storage is required.
Plug-flow digesters are heated, unmixed, rectangular tanks. New waste is pumped into one end ofthe digester, thereby displacing an equal portion of older material horizontally through thedigester and pushing the oldest material out through the opposite end. Lusk (1998) refers to aslurry-loop digester as a separate digester category, but this system, which is built in the shape ofa horseshoe, functions by displacement in the same manner as a plug-flow digester.
Biogas formed in a digester bubbles to the surface and may be collected by a fixed rigid top, aflexible inflatable top, or a floating cover, depending on the type of digester. Biogas from astable digester is saturated and contains 60 to 80 percent methane, with the balance as carbondioxide and trace amounts of hydrogen sulfide (1,800 to 5,000 ppm H2S). A collection systemdirects the virtually odorless biogas to gas handling components. Biogas may be filtered formercaptan and moisture removal before being pumped or compressed to operating pressure andthen metered to equipment for use. Biogas that is pressurized and metered can be used as fuel forheating, adsorption cooling, electrical generation, or cogeneration.
Application and Performance: Properly designed anaerobic lagoons are used to produce biogasfrom dilute wastes with less than 2 percent total solids (98 percent moisture), including flusheddairy manure, dairy parlor washwater, and flushed hog manure. Complete-mix digesters can beused to decompose animal manures with 3 to 10 percent total solids. Plug-flow digesters areused to digest thick wastes (11 to 13 percent total solids) from ruminant animals, including dairyand beef animals. The plug-flow system operates best with scrape-collected, fresh dairy manurethat contains low levels of dirt, gravel, stones, or straw.
Anaerobic digestion is one of the few manure treatment options that reduce the environmentalimpact of manure and produce a commodity—energy—that can be used or sold continuously. Digesters are used to stabilize manures to produce methane, while at the same time reducingodors.
Approximately 35 percent of the volatile solids from dairy manure and 60 percent of the volatilesolids from swine or beef manure can be converted to biogas and removed from the manureliquid.
Table 8-11 summarizes the performance expected from anaerobic digesters. Anaerobic digesterswill reduce biological oxygen demand (BOD) and total suspended solids (TSS) by 80 to 90percent, and virtually eliminates odor. The digester will have minimal effect on the nutrientcontent of the digested manure passing through plug-flow or complete-mix digesters. Half or
8-71
Table 8-11. Anaerobic Unit Process Performance
Digester typePercentage Reduction
HRT(days)
COD TS VS TN P K
Complete-mix 12-20 35-70 25-50 40-70 0 0 0Plug-flow 18-22 35-70 20-45 25-40 0 0 0Covered first cell of two-cell lagoon
30-90 70-90 75-95 80-90 25-35 50-80 30-50
Source: Moser and Martin, 1999.
more of the organic N (Org-N) is converted into ammonia (NH3-N). In lagoons, theconcentrations of nutrients are reduced through settling, volatilization, and precipitation. With acover in place, ammonia volatilization losses are eliminated, leaving only settling andprecipitation as pathways for N loss. A small amount of the P and K will settle as sludge in mostdigesters.
The reductions of P, K, or other nonvolatile elements reported in the literature for coveredlagoons are not really reductions at all. The material settles and accumulates in the lagoon,awaiting later management. Vanderholm (1975) reported P losses of up to 58 percent. Bortoneet al. (1992) suggest that P accumulation in anaerobic lagoons may be due to high pH drivingphosphate precipitation as Ca(PO4)2 and Mg(PO4)2. This is consistent with and supported by Pmass losses documented in most lagoon studies. Water-soluble cations, such as sodium,potassium, and ammonium N, tended to be distributed evenly throughout the lagoon. Humeniket al. (1972) found that 92 to 93 percent of the copper and zinc in anaerobic swine lagooninfluent was removed and assumed to be settled and accumulated in sludge.
Pathogen reduction is greater than 99 percent in mesophilic and thermophilic digesters with a20-day HRT. Digesters are also very effective in reducing weed seeds.
Advantages and Limitations: Some advantages of anaerobic digestion include the opportunity toreduce energy bills, produce a stabilized manure, recover a salable digested solid by-product,reduce odor and fly breeding, and produce a protein-rich feed from the digested slurry.
The energy from biogas can be used on site as a fuel or sold to a local utility company. On-siteuses include the heating of the digester itself, fuel for boilers or electric generators, hot waterproduction, and refrigeration. The equipment listed in Table 8-12 can use biogas in lieu oflow-pressure natural gas or propane.
8-72
Table 8-12. Biogas Use Options
Electrical generator electricity for use or sale, heat recovery optional
Hot water boiler for space heat, hot water for process and cleanup
Hot air furnace for space heat
Direct fire room heater for space heat
Adsorption chiller for cold water production, heat recovery optional
Dairy waste digesters partially decompose fibrous solids to a uniform particle size that is easilyseparated with a mechanical separator. The recovered solids are valuable for reuse as cowbedding or can be sold as a bagged or wholesale soil product.
Limitations include the costs associated with building and operating the digester. Furthermore,nutrient concentrations in the semisolid anaerobic digestion product are not reduced substantiallyunless they are then stored for several months. Therefore, the amount of land needed for landapplication of manure is greater than that needed for uncovered lagoons and other treatmentpractices.
Operational Factors: The successful operation of a properly designed digester is dependentupon two variables: feed rate and temperature. All other operational issues are related toancillary equipment maintenance. Once a properly designed digester is operating, it will usuallycontinue to function unless management oversight is lacking. Reactor capacity is maintainedthrough periodic removal of settled solids and grit.
A sudden drop in biogas production or pH (from accumulation of organic acids) will indicatedigester upset. Factors that decrease the efficiency of microbial processes and might result indigester upset include a change in temperature or feed rations, a change in manure loading rates,or the addition of large quantities of bacterial toxins. A normal ratio of alkalinity to volatile acidsduring a stable or steady-state anaerobic decomposition is 10:1. The known operating range is4:1 to 20:1. (Metcalf and Eddy, 1979). An increase in volatile acids resulting in an alkalinity tovolatile acid ratio of 5:1 indicates the onset of failure of methane-producing anaerobic digestion(unbalanced decomposition) (Chynoweth, 1998).
The level of hydrogen sulfide in the produced biogas can be controlled through either scrubbingor managed operation of equipment. Scrubbing is necessary for some gas uses but is generallyexpensive and maintenance intensive.
Demonstration Status: Anaerobic lagoons with covers were used at 1.8 percent ofgrower/finisher operations in 1995 (USDA APHIS, 1999). Approximately 30 pig lagoons have
8-73
been covered in the United States for odor control or methane recovery (RCM, 1999). The oldestcontinuously operating covered swine waste lagoon is at Roy Sharp’s Royal Farms in Tulare,California. This system, which was installed in 1981, has been producing electricity with therecovered methane since 1983. Not all covered lagoon projects have beneficial uses forrecovered methane; some farms either flare or release the gas.
The oldest complete-mix pig manure digester in the United States was built in 1972. Approximately 10 units are in operation today, 6 of which were built within the last 4 years. Many digesters are not operational, typically because the farm is no longer in the pig business. At least 16 operating plug-flow and slurry-loop digesters are currently operating in the UnitedStates (Lusk, 1998; RCM, 2000).
Practice: Single-Cell Lagoon With Biogas Generation
Description: In this practice, a cover is floated on the surface of a properly sized anaerobiclagoon to recover biogas (70 percent methane and 30 percent carbon dioxide). Anaerobiclagoons can produce biogas from any type of animal manure. The most successful arrangementconsists of two lagoons connected in series to separate biological treatment for biogas productionand storage for land application. A variable-volume, one-cell lagoon designed for both treatmentand storage can be covered for biogas recovery; however, a single-cell lagoon cover presentsdesign challenges due to the varying level of the lagoon surface.
In the early 1960s, the floating cover industry expanded beyond covering water reservoirs intofloating covers for industrial wastewater lagoons. Covering industrial organic wastewaterlagoons began as an odor control technique. Within the discovery that economic quantities ofbiogas could be recovered, cover systems were refined to collect and direct biogas back to thefactory producing the organic waste. Lagoon design was optimized to provide both goodBOD/COD reduction and a supply of usable biogas. Today, hundreds of industrial anaerobiclagoons have floating covers that optimize anaerobic digestion, control odor, and recover biogas. The industries that use such covers include pork processors and rendering plants in the UnitedStates. Lessons learned in the development of floating covers are incorporated into today’sdesigns for animal waste facilities.
Psychrophilic, or low-temperature, digestion is the natural decomposition path for manures at thetemperatures found in lagoons. These temperatures vary from about 38 to 85 (F (3 to 29 (C). The retention time required for stable operation varies from 120 days at low temperatures to 30days at the higher temperatures. Methane production varies seasonally with lagoon temperature. More methane is produced from warmer lagoons than from colder lagoons.
The Natural Resources Conservation Service (1998) developed NRCS Interim Practice Standard360, Covered Anaerobic Lagoon, to guide floating cover design, installation, and operation. Many types of materials have been used to cover agricultural lagoons. Floating covers are notlimited in dimension. A floating cover allows for some gas storage. Cover materials must havea bulk density near that of water and must be UV-resistant, hydrophobic, tear- and puncture-resistant, and nontoxic to aquatic aerobes and anaerobes.
8-74
Several types of material are used to construct floating covers, including high-densitypolyethylene, XR-5, polypropylene, and hypalon. Material is selected based on materialproperties (such as UV resistance), price, availability, installation, and service. Installation teamswith appropriate equipment travel and install covers.
Biogas formed in a digester bubbles to the surface and is collected and directed by the cover to agas use. Biogas from a stable covered lagoon is virtually odorless and saturated. It contains 70to 85 percent methane; the balance is carbon dioxide and trace amounts of hydrogen sulfide(1,000 to 3,000 ppm H2S). Biogas can be harmful if inhaled directly, corrosive to equipment, andpotentially explosive in a confined space when mixed with air. When properly managed, theoff-gas is as safe as any other fuel (e.g., propane) used on the farm. Safety concerns are morecompletely addressed in the Handbook of Biogas Utilization (Ross, 1996).
Biogas may be filtered for mercaptan and moisture removal. Biogas is usually pumped orcompressed to operating pressure and then metered to the gas use equipment. Biogas can be usedas fuel for heating, electrical generation, or cogeneration. Alternatively, it can simply be flaredfor odor control.
Application and Performance: Covered lagoons are used to recover biogas and control. Coverscan be installed to completely cover the lagoon and capture clean rainwater. The uncontaminatedrainwater can be safely pumped off, reducing the volume of lagoon liquid to be managed later.
Off-gases collected by an impermeable cover on an anaerobic manure facility are neitherexplosive nor combustible until mixed with air in proper proportions to support combustion. Noreports of any explosions of biogas systems at animal production facilities were found.
Table 8-13 summarizes the performance expected from covered lagoons. Anaerobic digestion ina covered lagoon will reduce BOD and TSS by 80 to 90 percent. Odor is virtually eliminated.The concentrations of nutrients are reduced through settling and precipitation in lagoons. Ammonia volatilization losses are virtually eliminated with a cover in place, leaving only settlingand precipitation as pathways for N loss.
During anaerobic digestion, microbial activity converts half or more of the organic N (Org-N) tosoluble ammonia (NH3-N). Cheng (1999) found that 30 percent of the total Kjeldahl N (TKN,which includes ammonia and organic N) entering the covered first cell of a two-cell lagoon wasretained in that cell, probably as organic N in slowly degradable organics in the sludge. A similarloss due to settling could be expected in a covered single-cell lagoon. A covered single-celllagoon will not lose NH3-N to the atmosphere; however NH3-N will be volatilized from theuncovered second cell of a two-cell lagoon. Cheng (1999) also reported that approximately 50percent of the influent TKN was subsequently lost from the uncovered second cell of the system.
Reported reductions of P, K, or other nonvolatile elements through a covered lagoon are notreally reductions at all. The material settles and accumulates in the lagoon awaiting latermanagement. This is consistent with and supported by P mass losses documented in most lagoon
8-75
studies. Humenik et al. (1972) found that 92 to 93 percent of the copper and zinc in anaerobicswine lagoon influent was removed and assumed to be settled and accumulated in sludge.
Cheng (1999) found pathogen reduction through a North Carolina covered lagoon to be 2 to 3orders of magnitude. J. Martin (1999) determined that relationships between temperature andthe time required for a one log10 reduction in densities of pathogens were consistently exponentialin form. Although there is substantial variation between organisms regarding the time requiredfor a one log10 reduction in density at ambient temperatures, this work suggests that variation indie-off rates among species decreases markedly as temperature increases. For example, thepredicted time required for a one log10 reduction in fecal streptococcus density decreases from63.7 days at 15 (C to 0.2 day at 50 (C. For S. aureus, the decrease is from 10.6 days at 15 (C to0.1 day at 50 (C. Thus, for both storage and treatment at ambient temperature, an extendedperiod of time is predicted for any significant reduction. A single-cell covered lagoon has alonger residence time than the covered first cell of a two-cell lagoon and should therefore have agreater reduction of pathogens. However, during pumpout of a single-cell lagoon, fresh influentcan be short-circuited to the pumpout, carrying pathogens with it, whereas the covered first cellof a two-cell lagoon produces a consistent pathogen reduction without short-circuiting becausethe first cell’s pathogen destroying retention time is not affected when the second cell is pumpeddown.
Advantages and Limitations: The advantages of covered anaerobic lagoons are the reduction oflagoon odor, exclusion of rainfall from the lagoon, recovery of usable energy, reduction ofammonia volatilization, and reduction of methane emissions. There are also significant laborsavings involved in handling manure as a liquid and being able to apply lagoon waters to the landthrough irrigation. Solids are broken down through microbial activity, and organic matter isstabilized when anaerobic digestion is complete, reducing the potential for production of noxiousby-products. A bank-anchored cover prevents the growth of weeds where the cover is placed. Finally, treated lagoon water can be recycled for flush water in confinement houses, resulting incost savings in areas where water is scarce.
Limitations of covered anaerobic lagoons include the cost of installing a cover, which in 1999varied from $0.37 to $1.65 per square foot (Martin, 1999), and the occasional need for covermaintenance such as rip repair, and rainfall pump-off. The lagoons themselves can be large,depending on the size of the hog operation, and can require a significant amount of covermaterial. Spills and leaks to surface and ground water can occur if the lagoon capacity isexceeded, or if structural damage occurs to berms, seals, or liners. The treatment capacity ofmost lagoons is diminished by sludge accumulation, and sludge has to be removed and managed.
8-76
Operational Factors: Lagoons should be located on soils of low permeability or soils that sealthrough biological action or sedimentation, and proper liners should be used to avoidcontamination of ground water. Proper sizing and management are necessary to effectivelyoperate a covered anaerobic lagoon and maintain biogas production. The minimum coveredlagoon capacity should include treatment volume, sludge storage, freeboard, and, if necessary,storage for seasonal rainfall and a 25-year, 24-hour rainfall event.
Temperature is a key factor in planning the treatment capacity of a covered lagoon. The lagoonsare not heated, and the lagoon temperature and biogas production vary with ambienttemperatures. Warm climates require smaller lagoons and have less variation in seasonal gasproduction. Colder temperatures will reduce winter methane production. To compensate forreduced temperatures, loading rates are decreased and hydraulic retention time is increased. Alarger lagoon requires a larger, more costly cover than a smaller lagoon in a warmer climate.
The floating cover must be designed and operated in such a way as to keep it from billowing inwindy conditions. Coarse solids, such as hay and silage fibers in cow manure, must be separatedin a pretreatment step and kept from the lagoon. If dairy solids are not separated, they float andform a crust. The crust will thicken, reducing biogas production and eventually filling thelagoon.
Proper lagoon inspection and maintenance are necessary to ensure that lagoon liners and coversare not harmed by agitating and pumping, berms and embankments are stable, and the requiredfreeboard and rainfall storage are provided. Sampling and analysis of the lagoon water aresuggested to determine its nutrient content and appropriate land application rates.
Anaerobic lagoons accumulate sludge over time, diminishing treatment capacity. Lagoons mustbe cleaned out once every 5 to 15 years, and the sludge can be applied to land other than thespray fields receiving the lagoon liquid. Because crop P requirements are less than those for N, ittakes more land to apply the sludge from lagoon cleanout than to apply liquid wastewater.
Demonstration Status: Floating-cover technology is well developed and readily available.Covering lagoons for odor control has been demonstrated in all sectors of the animal productionindustry. The installation of floating covers specifically for methane recovery is a less common,but well-known practice. There are at least 10 covered lagoon systems with biogas collectionand combustion in the pig and dairy industries (Lusk, 1998; RCM, 2000).
Practice: Aerobic Treatment of Liquids
Description: Conventional aerobic digestion is a process used frequently at small municipal andindustrial wastewater treatment plants for biosolids stabilization. It is a suspended growthprocess operating at ambient temperature in the stationary or endogenous respiration phase of themicrobial growth curve. In the stationary phase, the exogenous supply of energy is inadequate tosupport any net microbial growth. Endogenous respiration occurs when the exogenous supply ofenergy also is inadequate to satisfy cell maintenance requirements, and a net decrease inmicrobial mass occurs. Operating parameters include a relatively long period of aeration,
8-77
ranging from severa daysl to more than 30 days, depending on the degree of stabilization desired. Given the relatively long period of aeration, activated sludge recycling is not necessary andhydraulic detention and solids retention times are equal in continuous-flow systems. This is amajor difference between aerobic digestion and the various variants of the activated sludgeprocess, including extended aeration (see “Secondary Biological Treatment” below). Whenaerobic digestion is used for biosolids stabilization, either the fill-and-draw or the continuousmode of operation can be used. With the fill-and-draw mode of operation, an option is toperiodically cease aeration temporarily to allow settling and then decant the clarified liquidbefore resuming aeration. This approach also allows the reactor to be used as a biosolidsthickener.
With conventional aerobic digestion, substantial reductions in total and volatile solids,biochemical and chemical oxygen demand, and organic N can be realized. Total N reduction canalso be substantial, with either ammonia stripping or nitrification-denitrification serving as theprimary mechanism, depending on the dissolved oxygen concentration of the mixed liquor. Actual process performance depends on a number of variables, including solids retention time,temperature, and adequacy of oxygen transfer and mixing.
An aeration basin typically is used for the aerobic digestion of municipal and industrialwastewater biosolids. In contrast, several reactor types, including oxidation ditches andmechanically aerated lagoons, as well as aeration basins, have been used for the aerobic digestionof animal manures. Under commercial conditions, the oxidation ditch has been the mostcommonly used because it can be located in the animal housing unit under cages for laying hensor under slatted floors for swine. This eliminates the need for transport of manure to thetreatment system.
It should be noted that since the oxidation ditch was originally developed to employ the activatedsludge process used in municipal wastewater treatment, the term “activated sludge” has beenused incorrectly on occasion to describe the aerobic digestion of swine, poultry, and other animalwastes. Aerobic digestion, not the activated sludge process, is employed in oxidation ditches,mechanically aerated lagoons, and aeration basins. Table 8-14 presents technologies that useaerobic digestion or the activated sludge process.
Application and Performance: Conventional aerobic digestion is an option for all swine andpoultry operations where manure is handled as a liquid or slurry, and it can be used with flushingsystems using either mixed liquor or clarified effluent as flush water. With proper process designand operation, a 75 to 85 percent reduction in 5-day biochemical oxygen demand (BOD5) appearsachievable, with a concurrent 45 to 55 percent reduction in chemical oxygen demand (COD), anda 20 to 40 percent reduction in total solids (TS) (Martin, 1999). In addition, a 70 to 80 percentreduction of the N in both poultry and swine wastes via nitrification-denitrification also appearspossible. Total P is not reduced, but the soluble fraction may increase. As with aerobic digestion
8-78
Table 8-14. Operational Characteristics of Aerobic Digestion and Activated Sludge Processes
75-95 Use for small communities or wherelarge area of land is available. Process
is flexible.
Sequencingbatch reactor
Intermittent-flowstirred-tankreactor
Diffused air 85-95 Use for small communities where landis limited. Process is flexible and can
remove N and P.
Deep-shaftreactor
Plug flow Diffused air 85-95 Use for general application with high-strength wastes. Process is resistant to
slug loads.
Single-stagenitrification
Continuous-flowstirred-tankreactors or plugflow
Mechanical aerators,diffused-air
85-95 Use for general application for Ncontrol where inhibitory industrial
wastes are not present.
Separate stagenitrification
Continuous-flowstirred-tankreactors or plugflow
Mechanical aerators,diffused-air
85-95 Use for upgrading existing systems,where N standards are stringent, or
where inhibitory industrial wastes arepresent and can be removed in earlier
stages.
Source: Metcalf and Eddy, 1991.
8-79
of biosolids, some reduction in pathogen densities may also occur depending on processtemperature.
Advantages and Limitations: In addition to the potential for substantial reductions in oxygen-demanding organics and N, one of the principal advantages of aerobic digestion of poultry andswine manures is the potential for a high degree of odor control. Another advantage is theelimination of fly and other vermin problems.
Limitations include high energy requirements for aeration and mixing (e.g., pumps, blowers, ormixers for mechanical aeration). In addition, aerobic lagoons without mechanical aeration aregenerally shallow, requiring a very large land area to meet oxygen demands. The absence of areduction in the volume of waste requiring ultimate disposal is another limitation. In certainsituations, waste volume will be increased significantly. For example, use of an undercageoxidation ditch versus a high-rise type system to manage the waste from laying hens will increasesubstantially the waste volume requiring ultimate disposal. Also, management, maintenance, andrepair requirements for aerobic digestion systems can be significant. For example, liquids andsolids must be separated in a pretreatment step when aerated lagoons are used.
Operational Factors: Establishing and maintaining an adequate microbial population in aerobicdigestion reactors is critical to ensure optimal process performance. Failure to do so will lead toexcessive foam production, which has suffocated of animals on slatted floors above in-buildingoxidation ditches. Failure to remove slowly biodegradable solids on a regular basis to maintain amixed liquor total solids concentration of about 1 percent in fill-and-draw systems will lead to asubstantial reduction in oxygen transfer efficiency and mixing. This results in reduced treatmentefficiency and the potential for generation of noxious odors and release of poisonous gases,particularly hydrogen sulfide. Because ambient temperature determines process temperature,seasonal variation in process performance occurs.
Demonstration Status: Aerobic digestion has not been adapted to any significant degree by thepoultry, dairy, or swine industries, although a number of research and demonstration scale studieswere conducted in the late 1960s and early 1970s. Problems related to process and facilitiesdesign, together with the significant increase in electricity costs in the early to mid-1970s, led toa loss of interest in this animal waste treatment alternative. It is possible that no aerobicdigestion systems for animal wastes are currently in operation in the poultry and swine industries.
Lagoons are the most popular method of treatment for livestock manure. Aerobic lagoons arecommonly used for secondary treatment and storage of anaerobic lagoon wastes. Despite theadvantages, however, aerobic lagoons are considered uneconomical for livestock manuretreatment.
Practice: Autoheated Aerobic Digestion
Description: Autoheated aerobic digestion uses heat released during the microbial oxidation oforganic matter to raise process temperature above ambient levels. This is accomplished byminimizing both sensible and evaporative heat losses through the use of insulated reactors and
8-80
aeration systems with high-efficiency oxygen transfer. Mesophilic temperatures, 86 oF (30 oC) orhigher, typically can be maintained even in cold climates, and thermophilic temperatures as highas 131 to 149 oF (55 to 65 oC) can be attained. Both ammonia stripping andnitrification-denitrification can be mechanisms of N loss at mesophilic temperatures;nitrification-denitrification is typically the principal mechanism if the aeration rate is adequate tosupport nitrification. Because both Nitrosomas and Nitrobacter, the bacteria that convertammonium ions into nitrate, are mesophiles, N loss at thermophilic temperatures is limited toammonia stripping. Typically, autoheated digestion reactors are operated as draw-and-fillreactors to minimize influent short-circuiting, especially when maximizing pathogen reduction isa treatment objective.
Application and Performance: Autoheated aerobic digestion is appropriate for all livestock andpoultry operations where manure is handled as a slurry that has a minimum total solidsconcentration of at least 1 to 2 percent, wet basis. At lower influent total solids concentrations,such as those characteristic of flushing systems, achieving process temperatures significantlyabove ambient levels is problematic because of an insufficient biological heat productionpotential relative to sensible and evaporative heat losses. As influent total solids concentrationincreases, the potential for achieving thermophilic temperatures also increases. Influent totalsolids concentrations of between 3 and 5 percent are necessary to attain thermophilictemperatures.
With proper process design and operation, the previously discussed reductions in biochemicaloxygen demand (BOD5), chemical oxygen demand, total solids, and total N that can be realizedwith conventional aerobic digestion also can be realized with autoheated aerobic digestion(Martin, 1999a). Autoheated aerobic digestion can also provide significant reductions inpathogen densities in a relatively short 1- to 2-day period of treatment. Reductions realized are afunction of process temperature. At a process temperature of 122 (F (50 (C) or greater, aminimum of at least a one log10 reduction in the density of most pathogens is highly probable,with two to three log10 reductions likely (Martin, 1999b).
Advantages and Limitations: With respect to waste stabilization and odor control, the potentialbenefits of conventional and autoheated aerobic digestion are comparable. The principaladvantages of autoheated aerobic digestion relative to conventional aerobic digestion from aprocess performance perspective are (1) higher reaction rates that translate into shorter detentiontimes to attain a given degree of stabilization and (2) more rapid reduction in densities ofpathogens. The time required to achieve comparable reductions in BOD5, chemical oxygendemand, total solids, and total N is much shorter in autoheated than in conventional aerobicdigestion. With autoheated aerobic digestion, these reductions occur within 1 to 3 days atthermophilic temperatures, whereas 15 days or more are required with conventional aerobicdigestion at ambient temperatures. This translates directly into smaller reactor volumerequirements.
The ability to provide rapid and substantial (at least a one log10) reductions in pathogen densitiesis one of the more attractive characteristics of autoheated aerobic digestion. This ability has been
8-81
demonstrated in several studies of autoheated aerobic digestion of biosolids from municipalwastewater treatment, including a study by Martin et al. (1990).
The high energy requirements for aeration and mixing are limitations of autoheated aerobicdigestion. In addition, waste volume is not reduced through the treatment process. However, therequirement of a less dilute influent waste stream, as compared with conventional aerobicdigestion, for example, to provide the necessary biological heat production potential translatesinto reduced ultimate disposal requirements.
Operational Factors: A foam layer covering the mixed liquor in autoheated aerobic digestionreactors is a common characteristic and serves to reduce both sensible and evaporative heatlosses. It is necessary to control the depth of this foam layer to ensure that an overflow of foamfrom the reactor does not occur. Typically, mechanical foam cutters are used. Althoughautoheated aerobic digestion is less sensitive to fluctuations in ambient temperature than areother treatment processes, such as conventional aerobic digestion, some reduction in treatmentefficiency can occur, especially during extended periods of extremely cold weather.
Demonstration Status: The feasibility of using autoheated aerobic digestion to stabilize swinemanure has been demonstrated in several studies (Martin, 1999b). Feasibility also has beendemonstrated in several studies with cattle manure, including studies by Terwilliger and Crauer(1975) and Cummings and Jewell (1977); however, there does not appear to have been anycomparable demonstration of feasibility with poultry wastes. Given the similarities in thecomposition of swine and poultry wastes, it is highly probable that autoheated aerobic digestionof poultry wastes is also technically feasible. Although no data are available, it is probable thatthis waste treatment technology is not currently being used in any segment of animal agriculture,primarily because of the associated energy cost.
Practice: Secondary Biological Treatment
Description: The activated sludge process is a widely used technology for treating wastewaterthat has high organic content. The process was first used in the early 1900s and has since gainedpopularity for treatment of municipal and industrial wastewater. Many versions of this processare in use today, but the fundamental principles are similar. Basically, the activated sludgeprocess treats organic wastes by maintaining an activated mass of microorganisms thataerobically decomposes and stabilizes the waste.
Primary clarification or solids settling is the first step in the activated sludge process. Next, theorganic waste is introduced into a reactor. Maintained in suspension in the reactor is a biologicalculture that converts the waste through oxidation and synthesis. The aerobic environment in thereactor is achieved using diffused or mechanical aeration, which also maintains a completelymixed state. After a specified period, known as the hydraulic retention time (HRT), the mixturein the reactor is passed to a settling tank. A portion of the solids from the settling tank isrecycled to the reactor to maintain a balance of microorganisms. Periodically, solids from thesettling tank are “wasted” or discharged to maintain a specific concentration of microorganismsin the system. The solids are discharged according to a calculated solids retention time (SRT),
8-82
which is based on the influent characteristics and the desired effluent quality. The overflow fromthe settling tank is discharged from the system.
Application and Performance: The activated sludge process is very flexible and can be used totreat almost any type of biological waste. It can be adapted to provide high levels of treatmentunder a wide range of operating conditions. Properly designed, installed, and operated activatedsludge systems can reduce the potential pollution impact of feedlot waste because this technologyhas been shown to reduce carbon-, N-, and P-rich compounds.
In the activated sludge process, N is treated biologically through nitrification-denitrification. Thesupply of air facilitates nitrification, which is the oxidation of ammonia to nitrite and then nitrate. Denitrification takes place in an anoxic environment, in which the bacteria reduce the nitrate tonitrogen gas (N2), which is released into the atmosphere. The activated sludge process can nitrifyand denitrify in single- and double-stage systems.
Phosphorus is removed biologically when an anaerobic zone is followed by an aerobic zone,causing the microorganisms to absorb P at an above-normal rate. The activated sludgetechnology most effective for removing P is the sequencing batch reactor (see “Sequencing BatchReactors,” below).
N and P can both be removed in the same system. The SBR is also most effective for targetingremoval of both N and P because of its ability to alternate aerobic and anaerobic conditions tocontrol precisely the level of treatment.
Advantages and Limitations: An advantage of the activated sludge process is that it removespollutants, particularly nutrients, from the liquid portion of the waste. Nutrient removal canallow more feedlot wastewater to be applied to land without overloading it with N and P. Furthermore, concentrating the nutrients in a sludge portion can potentially reduce transportationvolumes and costs of shipping excess waste.
A disadvantage of an activated sludge system compared with an anaerobic lagoon is the relativelyhigh capital and operating costs and the complexity of the control system. In addition, becausepollutants will remain in the sludge, stabilization and pathogen reduction are necessary beforedisposing of it.
Because the activated sludge process does not reduce pathogens sufficiently, another way toreduce pathogens in both the liquid and solid portions of a waste may be appropriate prior todischarge or land application. The liquid effluent from an activated sludge system can bedisinfected by using chlorination, ultraviolet radiation, or ozonation, which are the final steps inmany municipal treatment systems.
Operational Factors: Many parameters can affect the performance of an activated sludgesystem. Organic loading must be monitored carefully to ensure that the microorganisms can besustained in proper concentrations to produce a desired effluent quality. The principal factors inthe control of the activated sludge process are:
8-83
& Maintaining dissolved oxygen levels in the aeration tank (reactor);
& Regulating the amount of recycled activated sludge from the settling tank to thereactor; and
& Controlling the waste-activated sludge concentration in the reactor.
Ambient temperature can also affect treatment efficiency of an activated sludge system. Temperature influences the metabolic activities of the microbial population, gas-transfer rates,and settling characteristics of biological solids. In cold climates, a larger reactor volume may benecessary to achieve treatment goals because nitrification rates decrease significantly at lowertemperatures.
Demonstration Status: Although activated sludge technologies have not been demonstrated on afull-scale basis in the animal feedlot industry, the process may treat such waste effectively. Studies have been performed on dairy and swine waste to determine the level of treatmentachievable in an SBR (see “Sequencing Batch Reactors,” below). The SBR is simpler, moreflexible, and perhaps more cost-effective than other activated sludge options for use in thefeedlots industry.
Practice: Sequencing Batch Reactors
Description: A sequencing batch reactor (SBR) is an activated sludge treatment system in whichthe processes are carried out sequentially in the same tank (reactor). The SBR system mayconsist of one reactor, or more than one reactor operated in parallel. The activated sludgeprocess treats organic wastes by maintaining an aerobic bacterial culture, which decomposes andstabilizes the waste. An SBR has five basic phases of operation, which are described below.
Fill Phase: During the fill phase, influent enters the reactor and mechanical mixing begins. Themixing action resuspends the settled biomass from the bottom of the reactor, creating acompletely mixed condition and an anoxic environment. As wastewater continues entering thereactor, oxygen may also be delivered, converting the environment from anoxic to aerobic. Depending on the desired effluent quality, the oxygen supply can be operated in an “on/off”cycle, thus alternating the aerobic and anoxic conditions and accomplishing nitrification anddenitrification.
React Phase: During the react phase, wastewater no longer enters the reactor. Influent to thesystem is instead either stored for later treatment in a single-reactor system or diverted to anotherreactor to begin treatment in a system with multiple reactors. Mechanical mixing continuesthroughout this phase. The oxygen supply may be operated in a cyclical manner, as described inthe fill phase, to accomplish additional denitrification if necessary. Activated sludge systems,such as SBRs, depend upon developing and sustaining a mixed culture of bacteria and othermicrobes (i.e., the biomass) to accomplish the treatment objectives.
8-84
Settle Phase: During the settle phase, the oxygen supply system and mechanical mixer do notoperate. This phase provides a quiescent environment in the reactor and allows gravity solidsseparation to occur, much like in a conventional clarifier.
Draw Phase: Following the treatment of a batch, it is necessary to remove from the reactor thesame volume of water that was added during the fill phase. After a sufficient settling phase, theliquid near the top of the reactor is decanted to a predetermined level and discharged or recycled.
Idle Phase: The idle phase is a time period between batches during which the system does notoperate. The duration of this unnecessary phase depends on the hydraulic aspects of the reactor.However, as a result of biological degradation and accumulation of inert materials from thewastewater, solids must be discharged from the reactor periodically to maintain a desirable levelof mixed liquor suspended solids. This “sludge wasting” is done during the idle phase, orimmediately following the draw phase.
Application and Performance: SBR technology could be applied to reduce the potentialpollution impact of liquid manure waste from dairies because this technology has been shown toreduce carbon-, N-, and P-rich compounds. Removing these pollutants from the liquid portion ofthe waste could allow for greater hydraulic application to lands without exceeding crop nutrientneeds. Concentrating the nutrients in the sludge portion could potentially reduce transportationvolumes and cost of shipping excess waste. Although a proven technology for treatment ofnutrients in municipal wastewater, available data does not exist showing SBRs to be effective inpathogen reduction.
Given the processes it employs, SBR treatment may allow treated dairy wastewater to be eitherapplied to land or discharged to a stream if a sufficient level of treatment can be achieved. Further, the sludge from the wasting procedure could be applied to land, composted, or sent offsite for disposal. Aqua-Aerobic Systems of Rockford, Illinois, (Aqua-Aerobics, 2000) estimatesa sludge production rate of approximately 1.3 pounds of waste activated sludge per pound ofBOD5 entering the system. The use of SBRs to treat dairy waste has been studied in thelaboratory at both Cornell University and the University of California at Davis. Both studieshave shown SBR technology to be effective in reducing pollutants in the liquid portion of dairywaste, although neither report included specific information on sludge characteristics or Premovals (Johnson and Montemagno, 1999; Zhang et al., 1999).
In the Cornell study, diluted dairy manure was treated in bench-scale reactors (Johnson andMontemagno, 1999). Experiments were conducted to determine the operating strategy bestsuited for the diluted dairy manure. The study resulted in removals of 98 percent of ammonia(NH3), 95 percent of chemical oxygen demand (COD), 40 percent of nitrate/nitrite (NO3/NO2),and 91 percent of inorganic N.
The University of California at Davis studied how SBR performance was affected by hydraulicretention time (HRT), solids retention time (SRT), organic loading, and influent characteristics ofdairy wastewater (Zhang et al., 1999). The highest removal efficiencies from the liquid portionof the waste were for an influent COD concentration of 20,000 milligrams per liter (a COD
8-85
concentration of 10,000 mg/L was also studied) and an HRT of 3 days (HRTs of 1 to 3 days werestudied). With these parameters, laboratory personnel observed removal efficiencies of 85.1percent for NH3 and 86.7 percent for COD.
In addition, studies on SBR treatment of swine waste in Canada and of veal waste in Europehavedemonstrated high removal rates of COD, N, and P (Reeves, 1999).
Advantages and Limitations: Technology currently used at dairies includes solids settling basinsfollowed by treatment and storage of waste in an anaerobic lagoon. Lagoon effluent and solidsare applied to cropland in accordance with their nutrient content, and excess water or solids arethen transported off site. The SBR could replace treatment in an anaerobic lagoon, but therewould still be a need for solids separation in advance of SBR treatment, as well as a pond or tankto equalize the wastewater flow. In fact, Aqua-Aerobics (2000) has indicated that solids removaland dilution of the raw slurry would be necessary to make treatment in the SBR. Following theSBR, it is possible that some type of effluent storage would be required for periods when directirrigation is not possible or necessary.
Use of an SBR is expected to be advantageous at dairies that apply a portion of their waste toland. The reduced level of nutrients in the liquid portion would allow for application of a greatervolume of liquid waste, thereby reducing the volume of waste that must be transported off siteand possibly eliminating liquid waste transport. An SBR is also beneficial in the handling of thesolids portion of the waste because no periodic dredging is required as is the case with anaerobiclagoons. Disadvantages of an SBR system are the relatively high capital and operating costs, aswell as the need to manage the nutrients that remain in the sludge.
Because the activated sludge process is not a generally accepted method of pathogen reduction,another means of reducing pathogens in both the liquid and solid portions of the dairy waste maybe appropriate. Disinfection of the liquid effluent from the SBR could be accomplished throughuse of chlorination, ultraviolet radiation, or ozonation which are used as the final step in manymunicipal treatment systems. Composting has also been demonstrated as a means of reducingpathogens in organic solid waste and could be implemented for use with the SBR sludge.
Operational Factors: The five phases of SBR operation may be used in a variety of combinationsin order to optimize treatment to address specific influent characteristics and effluent goals. N inthe activated sludge process is treated biologically through the nitrification-denitrificationprocess. The nitrification-denitrification process in the SBR is controlled through the timing andcyclical pattern of aeration during the react phase. The supply of air causes nitrification, which isthe oxidation of ammonia to nitrite and then nitrate. To accomplish denitrification, the air supplyis shut off, creating an anoxic environment in which the bacteria ultimately reduce the nitrate tonitrogen gas (N2), which is released to the atmosphere. The cycle can be repeated to achieveadditional levels of denitrification. Some portion of the N in the influent to the SBR may alsovolatilize prior to treatment, and a portion may also be taken up by microorganisms that arepresent in the waste activated sludge (Zhang et al., 1999).
8-86
P is removed when an anaerobic zone (or phase) is followed by an aerobic zone, causing themicroorganisms to take up P at an above-normal rate. The waste activated sludge containing themicroorganisms is periodically “wasted” as described above. As such, the bulk of the P will beconcentrated ultimately in the sludge portion with a minimal amount remaining in the liquideffluent.
N and P can both be removed in the same system. This dual removal is accomplished bybeginning the fill phase without aeration, which creates an anoxic condition allowing for somedenitrification as well as release of P from the cell mass to the liquid medium. there follows aperiod of aerated mixing, which will continue into the react phase, allowing for nitrification anduptake of P. The settle phase, in which no aeration occurs, is extended sufficiently to allow foradditional denitrification. Again, these phases can be repeated or executed for varying durationsin order to accomplish specific treatment goals.
Demonstration Status: Although the SBR technology has not been demonstrated on a full-scalebasis in the dairy industry, SBRs are currently being evaluated for use at dairies because theygenerate a high volume of wastewater. Dairy wastewater treated in the SBR includes acombination of parlor and barn flush/hose water and runoff.
Cornell University is currently studying two pilot-scale SBR systems to further investigate thetreatability of dairy waste (Johnson and Montemagno, 1999). No results from the pilot-scalestudy are yet available, although preliminary results for nutrient removal have been favorable anda full-scale system is being planned.
Practice: Solids Buildup in the Covered First Cell of a Two-Cell Lagoon
Description: This section addresses sludge accumulation, removal, and management in the firstcell of a two-cell lagoon. The first cell may or may not be covered for methane recovery. Somesludge will be carried from the first cell to the second cell; however, the quantity is notsignificant compared with potential accumulations in the first cell. No quantitative informationwas found regarding the differences in the rate of accumulation of sludge in the first cell versusaccumulation in a single-cell lagoon. The removal and management of sludge from the first cellof a two-cell lagoon will be the same as described for sludge cleaning from a single cell lagoon.
For the purpose of this section, sludge is material settled on the bottom of a lagoon receivingwaste from any animal; it has a total solids content greater than 10 percent, generally has a highangle of repose when dewatered, and will not readily flow to a pump. Sludge includes organicmaterial not decomposed by lagoon bacteria, and inorganic material such as sand andprecipitates. Sludge accumulation can eventually fill a lagoon.
Accumulated sludge is removed to restore lagoon treatment and storage capacities. Two generalmethods of sludge removal, slurry and solid, are described below. When managed as a slurry,sludge is resuspended with agitation and pumped to tankers or irrigation guns for landapplication. Slurry management is desirable when the sludge mixture can be pumped to an
8-87
irrigation gun or hauled a short distance. Sludge removed from covered lagoons is removed as aslurry.
Sludge managed as a solid is excavated from the lagoon or pumped from the bottom as slurry toa drying area. Solid sludge is cheaper to haul than slurry because water, which increases theweight and volume, is not added. Solid sludge can be spread with conventional manurespreaders or dumped on fields and spread out and disced into the soil. In drier areas of thecountry, a lagoon may be withdrawn from service as a parallel lagoon is restored to service. Thelagoon liquids are pumped off to field application and the sludge is allowed to dry. After 4 to 12months, excavators, backhoes or bulldozers scrape, push, pull, or lift the material into trucks orwagons for hauling and spreading. Some lagoons are designed to be desludged by draglinebucket excavators while still in operation. Draglines work along the banks of these long, narrowlagoons, excavating sludge and either dropping it into trucks for hauling or depositing it on thelagoon embankment to dry for later hauling.
Application and Performance: Lagoon cleanout is applicable to all two-cell lagoons, regardlessof location. Reported reductions of P, K, and other nonvolatile elements through a lagoon arenot really reductions at all because these materials settle. Nitrogen is considered volatile in theammonia form, but some organic N associated with heavier and nondegradable organics alsosettles into the lagoon sludge and stays, resulting in a high-organic N fraction of total Kjeldahl N(TKN) in settled solids. The settled materials accumulate in the lagoon awaiting later disposal. Compared with lagoon liquids, lagoon sludges have higher concentrations of all pollutants thatare not completely soluble. All reported data suggest that the sludge is more stable than rawmanure based on its reduced volatile solids/total solids ratio (VS/TS). Volatile solids are aportion of the total solids that can be biologically destroyed, and as they are destroyed, the VS/TSratio declines.
As anaerobic digestion of manure changes the solution chemistry in a lagoon, materials such asammonia and P form precipitates with Ca and Mg. Fulhage and Hoehne (1999) and Bicudo et al.(1999) both report concentrations of Ca, Mg, P, and K in lagoon sludge at 10 to 30 times thatfound in raw manure. Fulhage and Hoehne also reported that Cu and Zn settle and concentrate to40 to 100 times the concentration found in lagoon liquid.
Martin (1999), in a review and analysis of factors affecting pathogen destruction, found that timeand temperature controlled the die-off rate of pathogens. Sludge that has been in a lagoon for 10years is expected to have very low concentrations of pathogens, and those would be associatedwith the most recent 90 to 180 days of settling.
Advantages and Limitations: The advantage of lagoon cleanout is that removal of sludgerestores the volume of a first-cell lagoon that is necessary for design treatment capacity. One ofthe limitations is that sludge disposal is ignored in most nutrient management plans. Sludge is aconcentrated, nutrient-rich material. The nutrients in the sludge, if applied to the same croplandhistorically receiving lagoon liquids, could easily exceed the planned application rate ofnutrients. Phosphorus and other relatively insoluble nutrients are more concentrated than N insludge and become the basis of planning proper use of the sludge.
8-88
Ideally, sludge will be managed as a high-value fertilizer in the year it is applied. As the sludgehas a higher nutrient and, hence, cash value than liquid manure, hauling to remote farms andfields to replace commercial fertilizer application is possible and desirable. Proper managementof applied sludge will result in successful crops and minimal loss of nutrients to surface orground waters.
The cover is a limiting factor in covered lagoon cleanout. At least a portion of the cover isremoved to allow equipment access. Removing a complete cover is usually not practical. Lacking complete access, covered lagoon cleanouts will not remove all of the sludge present. Therefore, more frequent cleanouts would be expected. Most covered lagoons have beendeveloped with cleanout intervals of 10-15 years.
Operational Factors: The USDA allows for sludge accumulation by incorporating a sludgeaccumulation volume (SAV) in its lagoon design calculations. Table 8-15 shows USDA’s ratiosof sludge accumulated per pound of total solids (TS) added to the lagoon. The higher the rate ofsludge accumulation assumed in a design, the larger the lagoon volume required. There are nopublished data to compare sludge accumulation in the first cell of a two-cell lagoon versusaccumulation in a single-cell lagoon. Anecdotal observations suggest that a first cell does notaccumulate sludge faster than a single-cell lagoon as long as the first cell is sized to contain all ofthe treatment volume and sludge accumulation volume (SAV). In theory, a constant volumefirst cell should accumulate less sludge over time than a single-cell lagoon because the constantvolume lagoon has a consistently higher microbial concentration than a single-cell lagoon. Thehigher concentration should result in the ability to consume new manure organic solids beforethey can settle to become sludge. Also in theory, a covered first cell would accumulate lesssludge due to higher biological activity because a covered lagoon is a few degrees warmer thanan uncovered lagoon.
Information from various studies suggests that the USDA values may overestimate actual sludgeaccumulation rates. Table 8-16 shows a range of long-term sludge accumulation rates reportedby various researchers. Field studies by both Fulhage and Hoehne (1999) and Bicudo et al.(1999) show lower accumulation rates than developed by Barth and Kroes (1985) and USDANRCS (1996).
8-89
Table 8-16. Lagoon Sludge Accumulation Rates Estimated for Pig Manure
* LAW = live animal weight ** as calculated by Bicudo et al. (1999).
It is important to note that the accumulation rate of sludge is influenced by lagoon design,influent characteristics, site factors, and management factors. Lagoon design factors such aslagoon volume, surface fetch, and lagoon depth increase or decrease potential lagoon mixing. More lagoon mixing encourages greater solids destruction by increasing the opportunity forbacteria to encounter and degrade solids. Influent factors, including animal type and feed,determine the biodegradability of manure solids. Highly degradable manure solids are morecompletely destroyed, thus accumulating as sludge to a lesser degree. Site temperature andincident rainfall impact the biological performance of the lagoon. High temperature increasesbiological activity and solids destruction. High rainfall can fill the lagoon and reduce retentiontime, thus slowing biological destruction of solids. Management factors also affect sludgeaccumulation. Increasing animal population, adding materials such as straw or sand used foranimal bedding, or adding process water will reduce the ability of a lagoon to destroy solids and,therefore, increase the rate of sludge accumulation. Properly managed solids separators canreduce the quantity of solids reaching the lagoon, hence reducing sludge accumulation
Demonstration Status: First-cell cleanouts are common and have occurred since two-celllagoons have been used. In many areas of the country, there are companies that specialize inlagoon cleaning.
Practice: Solids Buildup in an Uncovered Lagoon
Description: For the purpose of this section, sludge is material settled on the bottom of a lagoonreceiving waste from any animal; it has a total solids content greater than 10 percent, generallyhas a high angle of repose when dewatered, and will not readily flow to a pump. This definitionis intended to distinguish sludge from a less concentrated layer of solids above the sludge surfacethat can be drawn off with conventional pumping. All lagoons accumulate settleable materials ina sludge layer on the bottom of the lagoon. Sludge includes organic material not decomposed bylagoon bacteria and inorganic material such as sand and precipitates. Over time the sludgeaccumulation decreases the active treatment volume of a lagoon and negatively impacts thelagoon performance. Reduced treatment performance increases the rate of sludge accumulation. Sludge accumulations can eventually fill a lagoon.
Accumulated sludge is removed to restore lagoon treatment and storage capacities. Two generalmethods of sludge removal, slurry and solid, are described below.
8-90
When managed as a slurry, sludge is resuspended with agitation and pumped to tankers orirrigation guns for land application. Slurry management is desirable when the sludge mixture canbe pumped to an irrigation gun or hauled a short distance.
Sludge managed as a solid is excavated from the lagoon. Solid sludge is cheaper to haul thanslurry because water, which increases the weight and volume, is not added. Solid sludge can bespread with conventional manure spreaders or dumped on fields and spread out and disced intothe soil. In drier areas of the country, a lagoon may be withdrawn from service when a parallellagoon is restored to service. The lagoon liquids are pumped off to field application, and thesludge is allowed to dry. After 4 to 12 months, excavators, backhoes, or bulldozers scrape, push,pull, or lift the material into trucks or wagons for hauling and spreading. Some lagoons aredesigned to be desludged by dragline bucket excavators while still in operation. Draglines workalong the banks of these long, narrow lagoons, excavating sludge and either dropping it intotrucks for hauling or depositing it on the lagoon embankment to dry for later hauling.
Application and Performance: Lagoon cleanout is applicable to all operations that have lagoons,regardless of location. Reported reductions of P, K, and other nonvolatile elements through alagoon are not really reductions at all. The material settles and accumulates in the lagoon,awaiting later disposal. Compared with lagoon liquids, lagoon sludges have higherconcentrations of all pollutants that are not completely soluble. All reported data suggest that thesludge is more stable than raw manure based on its reduced volatile solids to total solids ratio(VS/TS). Volatile solids are a portion of the total solids that can be biologically destroyed, andas they are destroyed, the VS/TS ratio declines. Some organic N associated with heavier andnondegradable organics also settles into the lagoon sludge and stays, resulting in a high-organicN fraction of total Kjeldahl N (TKN) in settled solids.
As anaerobic digestion of manure changes the solution chemistry in a lagoon, materials such asammonia and P form precipitates with Ca and Mg. Both Fulhage and Hoehne (1999) and Bicudoet al. (1999) report concentrations of Ca, Mg, P, and K in lagoon sludge at 10 to 30 times thatfound in raw manure. Fulhage and Hoehne also reported that Cu and Zn settle and concentrate to40 to 100 times the concentration found in lagoon liquid.
Martin (1999), in a review and analysis of factors affecting pathogen destruction, found that timeand temperature controlled the die-off rate of pathogens. Sludge that has been in a lagoon for 10years is expected to have very low concentrations of pathogens, and those would be associatedwith the most recent 90 to 180 days of settling.
Advantages and Limitations: The advantage of lagoon cleanout is that removal of sludgerestores the volume of a lagoon that is necessary for design treatment and storage capacities. One of the limitations is that sludge disposal is ignored in most nutrient management plans. Sludge is a concentrated, nutrient-rich material. The nutrients in the sludge, if applied to thesame cropland historically receiving lagoon liquids, could easily exceed the planned applicationrate of nutrients. Phosphorus and other relatively insoluble nutrients are more concentrated thanN in sludge and become the basis of planning proper use and disposal of the sludge.
8-91
Ideally, sludge will be managed as a high value fertilizer in the year it is applied. As the sludgehas a higher nutrient and, hence, cash value than liquid manure, hauling to remote farms andfields to replace commercial fertilizer application is possible and desirable. Proper managementof applied sludge will result in successful crops and minimal loss of nutrients to surface orground waters.
Operational Factors: The USDA allows for sludge accumulation by incorporating a sludgeaccumulation volume (SAV) in its lagoon design calculations. Table 8-15 shows USDA’s ratiosof sludge accumulated per pound of total solids (TS) added to the lagoon. The higher the rate ofsludge accumulation assumed in a design, the larger the lagoon volume required.
Information from various studies suggests that the USDA values may overestimate actual sludgeaccumulation rates. Table 8-16 shows a range of long-term sludge accumulation rates reportedby various researchers. Field studies by both Fulhage and Hoehne (1999) and Bicudo et al.(1999) show lower accumulation rates than were developed by Barth and Kroes (1985) andUSDA NRCS (1996).
It is important to note that the accumulation rate of sludge is influenced by lagoon design,influent characteristics, site factors, and management factors. Lagoon design factors such aslagoon volume, surface fetch, and lagoon depth increase or decrease potential lagoon mixing. More lagoon mixing encourages greater solids destruction by increasing the opportunity forbacteria to encounter and degrade solids. Influent factors, including animal type and feed,determine the biodegradability of manure solids. Highly degradable manure solids are morecompletely destroyed, thus accumulating as sludge to a lesser degree. Site temperature andincident rainfall impact the biological performance of the lagoon. High temperature increasesbiological activity and solids destruction. High rainfall can fill the lagoon and reduce retentiontime, thus slowing biological destruction of solids. Management factors also affect sludgeaccumulation. Increasing the animal population, the addition of materials such as straw or sandused for animal bedding, or the addition of process water will reduce the ability of a lagoon todestroy solids and increase the rate of sludge accumulation. Properly managed solids separatorscan reduce the quantity of solids reaching the lagoon, thereby reducing sludge accumulation. Mixing a lagoon before land application will suspend some of the sludge solids, causing them tobe pumped out sooner rather than later.
Demonstration Status: Lagoon cleanouts are common and have occurred since lagoons havebeen used. Companies that specialize in lagoon cleaning are found in many areas of the country.
Practice: Trickling Filters
Description: Trickling filters are currently being evaluated for use at animal feeding operations(AFOs) to address the high concentrations of organic pollutants in AFO wastewater. Thetechnology is a type of fixed-growth aerobic biological treatment process. Wastewater enters thecircular reactor and is spread over media that support biological growth. The media are typicallycrushed rock, plastic-sheet packing, or plastic packing of various shapes. Wastewatercontaminants are removed biologically.
8-92
Figure 8-9. Trickling Filter
The top surface of the media bed is exposed to sunlight, is in an aerobic state, containsmicroorganisms that are in a rapid growth phase, and is typically covered with algae. The lowerportion of the bed is in an anaerobic state and contains microorganisms that are in a state ofstarvation (i.e., microorganism death exceeds the rate of reproduction). The biofilm covering thefilter medium is aerobic to a depth of only 0.1 to 0.2 millimeters; the microbial film beneath thesurface biofilm is anaerobic. As wastewater flows over the microbial film, organic matter ismetabolized and absorbed by the film. Continuous air flow is necessary throughout the mediabed to prevent complete anaerobic conditions (Viessman, 1993).
Components of a trickling filter include a rotary distributor, underdrain system, and filtermedium. Untreated wastewater enters the filter through a feedpipe and flows out onto the filtermedia via distributor nozzles, which are located throughout the distributor. The distributorspreads the wastewater at a uniform hydraulic load per unit area on the surface of the bed. Theunderdrain system, typically consisting of vitrified clay blocks, carries away the treated effluent. The clay blocks have entrance holes that lead to drainage channels and permit the circulation ofair through the media bed. Figure 8-9 below shows a cutaway of a typical trickling filter.Rock media beds can be up to 200 feet in diameter and 3 to 8 feet deep, with rock sizes rangingfrom 1 to 4 inches. Plastic media beds are narrower and deeper, ranging from 14 to 40 feet deep(Viessman, 1993). These systems look more like towers than conventional rock-media systems. It is also common to have single-stage or two-stage systems for N removal. A two-stage systemallows for greater flexibility because each stage can be operated independently and optimizedaccordingly. Flow capacity of trickling filters can range between 200 and 26,000 gallons per day;however, units can be installed in parallel to handle larger flows (AWT Environment).
8-93
Application and Performance: Traditionally, the trickling filter medium has been crushed rock orstone; however, this type of media occupies most of the volume in a filter bed, reducing the voidspaces for air passage and limiting surface area for biological growth. Many trickling filters nowuse a chemical-resistant plastic medium because it has a greater surface area and a largepercentage of free space. These synthesized media forms offer several advantages over naturallyavailable materials, particularly in terms of surface contact area, void space, packing density, andconstruction flexibility (Viessman, 1993).
Although stone-media trickling filters are not as common, they are still used in shallow filters. BOD loads, expressed in terms of pounds of BOD applied per unit of volume per day, aretypically 25 to 45 pounds per 1,000 ft3 per day for single-stage stone filters and 45 to 65 poundsper 1,000 ft3 per day/day for two-stage stone filters (based on the total media volume of bothfilters). The recommended hydraulic load ranges from 0.16 gallons per minute per ft2 to 0.48gallons per minute per ft2 (Viessman, 1993).
Other shallow filters use random packing (e.g., small plastic cylinders, 3.5 x 3.5 inches), with aspecific surface area of 31 to 40 ft2/ft3 and a void space of 91 to 94 percent. Deep filters usecorrugated PVC plastic sheets that are 2 feet wide, 4 feet long, and 2 feet deep stacked on top ofeach other in a crisscross pattern. The specific surface area ranges from 26 to 43 ft2/ft3 and a voidspace of approximately 95 percent. The BOD loads for plastic media towers are usually 50pounds per 1,000 ft3 per day or greater with surface hydraulic loadings of 1 gpm/ft2 or greater(Viessman, 1993).
A single or two-stage trickling filter can remove N through biological nitrification. Thenitrification process uses oxygen and microorganisms to convert ammonia to nitrite nitrogen,which is then converted to nitrate nitrogen by other microorganisms. Nitrate nitrogen is lesstoxic to fish and can be converted to nitrogen gas, which can be released to the atmospherethrough denitrification, a separate anaerobic process following nitrification. Note that tricklingfilters are not capable of denitrifying.
A single-stage trickling filter removes BOD in the upper portion of the unit while nitrificationoccurs in the lower portion. A two-stage system removes BOD in the first stage whilenitrification occurs in the second stage. Trickling filters do not typically remove P, but can beadapted to remove P from the wastewater effluent by chemical precipitation following BODremoval and nitrification (AWT Environment, ETI, 1998).
It is critical to have a properly designed trickling filter system. An improperly designed systemcan impact treatment performance and effluent quality. Media configuration, bed depth,hydraulic loading, and residence time all need to be carefully considered when designing atrickling filter system (Viessman, 1993).
In a study using municipal wastewater, the average BOD removal was greater than 90 percentand TSS removal was greater than 87 percent using a trickling filter. The average effluent BODconcentration was 13 mg/L, while the average effluent TSS concentration was 17 mg/L (AWT
8-94
Environment). In another similar study that included municipal and dairy waste, BOD and TSSconcentrations were slightly greater, but never exceeded 100 mg/L (Bio-Systems, 1999).
In another study using municipal wastewater and an anaerobic upflow filter prior to the tricklingfilter, the average effluent BOD and TSS concentrations both ranged from 5 to 10 mg/L, and thetotal N removal ranged from 80 to 95 percent. Pathogen reduction for this particular system isexpected to be good, due to the upflow filter component. The estimated cost for this system isapproximately $18,000 in annualized present day (Year 2000) costs (annualized over 20 yearsand not including design and permitting) (City of Austin, 2000).
Information on the reduction of pathogens, antibiotics, and metals in trickling filters is notavailable, but it is expected to be minimal based on engineering judgment.
Advantages and Limitations: An advantage of operating a trickling filter is that it is a relativelysimple and reliable technology that can be installed in areas that do not have a lot of space for atreatment system. This technology is also effective in treating high concentrations of organicsand nutrients. It can be cost-effective because it entails lower operating and maintenance coststhan other biological processes, including less energy and fewer skilled operators. The wastedbiomass, or sludge, can be processed and disposed of, although it contains high concentrations ofnutrients. Finally, it also effectively handles and recovers from nutrient shock loads (ETI, 1998).
Disadvantages of operating a trickling filter are that additional treatment may be needed to meetstringent effluent limitations, the operation generates sludge that needs to be properly disposedof, poor effluent quality results if the system is not properly operated, and regular operatorattention is needed. The system is susceptible to clogging from the biomass as well as odors andflies. The high solids content of CAFO waste would most likely require solids separation priorto treatment to also prevent clogging. Only the liquid waste may be treated in this system. Inaddition, a high investment cost may also prevent certain farms from installing this technology(ETI, 1998).
Operational Factors: Trickling filters are typically preceded by primary clarification for solidsseparation and are followed by final clarification for collection of microbiological growths thatslough from the media bed. They can also be preceded by other treatment units such as septictanks or anaerobic filters. Trickling filters effectively degrade organic pollutants, but can also bedesigned to remove N and P from the wastewater.
Trickling filters are relatively simple to operate, are lower in cost than other biological treatmentprocesses, and typically operate at the temperature of the wastewater as modified by that of theair, generally within the 15-25(C range. A high wastewater temperature increases biologicalactivity, but may result in odor problems. Cold wastewater (e.g., 5-10(C) can significantlyreduce the BOD removal efficiency (Viessman, 1993).
Demonstration Status: Trickling filters are most commonly used to treat municipal wastewater,although the technology is applicable to agricultural wastewater treatment. They are best used totreat wastewaters with high organic concentrations that can be easily biodegraded. EPA was not
8-95
Figure 8-10. Fluidized BedIncinerator
able to locate any AFO facilities that currently operate trickling filters; however, based on theinformation gathered, several wastewater treatment vendors market this technology to suchfacilities.
Practice: Fluidized Bed Incinerators
Description: Fluidized bed incinerators (FBIs) arecurrently being evaluated for use at CAFOs given thehigh volume of manure they generate. The technology istypically used for wastewater sludge treatment (e.g.,municipal sludge), but may be used for wastewatertreatment. The main purpose of an FBI is to break downand remove volatile and combustible components of awaste stream and to reduce moisture. Its most prominentapplication to CAFO industries would be for animalwaste disposal and treatment, because manure has ahigher solids content than wastewater from CAFOoperations.
An FBI is a vertical, cylindrical shaped apparatus thatrequires media (typically sand), injected air, and aninfluent fuel to operate. An FBI contains three basiczones: a windbox, a sand bed, and a freeboard reactor chamber. Air enters the windbox andmoves upward into the media bed through orifices called “tuyeres” at a pressure of 3 to 5 poundsper square inch. The injected air acts to fluidize the bed and to generate combustion. The term“fluidized bed” refers to the “boiling” action of the sand itself, which occurs when air is injectedinto the reactor. The fuel, or animal waste, directly enters the fluidized sand bed and is mixedquickly within the bed by the turbulent action. Any moisture in the animal waste evaporatesquickly, and the sludge solids combust rapidly. Combustion gases and evaporated water flowupward through the freeboard area to disengage the bed material and to provide sufficientretention time to complete combustion. Gases and ash exit the bed out the top of the FBI. Exitgases may be used to preheat the injected air or may be recovered for energy. Exit ash isremoved from exit gas in an air pollution device such as a venturi scrubber. Ash can either bedisposed of or reused (typically as fertilizer) depending on its characteristics (Metcalf and Eddy,1991).
Prior to injection, the sand media is kept at a minimum temperature of 1300 (F and controlled atbetween 1400 and 1500 (F during treatment. This temperature range varies with specific designcriteria. The FBI typically ranges in size from 9 to 25 feet in diameter; the media bed is typically2.5 feet thick, when settled (Metcalf and Eddy, 1991). The system has a capacity of up to 30 tonsper hour (UNIDO, 2000). The combustion process is optimized by varying the animal waste andair flow, with exit gas retention times greater than 1 second and solids retention times greaterthan 30 minutes (Versar, 2000). Figure 8-10 represents a typical FBI.
8-96
Application and Performance: Animal waste enters the FBI and quickly combusts in the mediabed. Organic constituents of the waste are burned to produce carbon dioxide and water, whilevolatile pollutants are evaporated and captured in the air control device. Solid material may berecycled through the system for further treatment. The ash contains many of the pollutants in theanimal waste itself, although waste volume is reduced and most of the N in the waste isevaporated. The ash will still contain high levels of metals, P, and K.
The high temperature of the system typically eliminates the spread of pathogens, reducingbiosecurity concerns. Similarly, any antibiotics or hormones remaining in the waste will also bebroken down and reduced. Although FBIs operate at very high temperatures, they typicallyoperate at lower temperatures than other types of incinerators, which results in lower airemissions, particularly of NOx compounds and volatile organic compounds (VOCs).
Advantages and Limitations: Fluidized bed incineration is an effective and proven technology forreducing waste volume and for converting the waste to useful products (e.g., energy). Resultingash may be used as an end- product fertilizer, or as an intermediate product used inmanufacturing commercial fertilizers. Animal waste incineration eliminates aesthetic concerns(e.g., odors) as well as nuisance concerns (e.g., pest attraction) (Versar, 2000).
Although fluidized bed incineration is viewed as an efficient system, it is very sensitive tomoisture content and fuel particle size. The higher the moisture content, the less efficient thesystem is because the moisture acts to depress the reactor temperature, thereby reducingcombustion capabilities. Moisture can be reduced in animal waste by combining the waste withother biomass such as wood chips or straw. Air drying or dewatering the animal waste alsoreduces moisture content before treatment in the FBI. Blockages may often occur in input andoutput pipes triggering shut-down and maintenance (Versar, 2000).
Air emissions must also be considered when operating any type of incinerator. Organic and Ncompounds are easily removed from the waste; however, they are then emitted to the air,potentially creating a cross-media impact if not properly controlled. Furthermore, nutrients suchas P, K, and metals typically remain in the ash and are not treated. Finally, FBIs entail highoperating and maintenance costs, especially compared with other types of incinerators (Versar,2000).
Operational Factors: As discussed above, FBIs are most sensitive to moisture content and fuelparticle size. The less moist the influent fuel, the more efficient the system is. Acceptableinfluent moisture levels range from 15 to 20 percent moisture. Fuel particle size should also beminimized to avoid clogging the system. Another consideration is that depending on the metalsconcentrations and local regulations, the ash, if intended for disposal, may need to be handled ashazardous waste (Versar, 2000).
FBI costs depend on size and capacity. Capital costs can range from approximately $5 to 25million for a 5-ton-per-hour and a 30-ton-per-hour FBI, respectively (UNIDO, 2000). FBIs arecomplex technologies and require operation by trained personnel. Because of this, FBIs are moreeconomical for medium to large facilities, or when operated in cooperation with several
8-97
businesses that are able to provide fuel sources. Therefore, FBIs may not be a cost-effectivewaste management technique for an individual farm, but, when operated on a larger scale, theymay prove to be cost-effective. Capital and annual operating costs are generally higher for FBIsthan for other types of incinerators because of the sensitive design parameters (e.g., moisturecontent and solid particle size). On the other hand, the system operates efficiently, and energycan usually be recovered from the process and may be sold to another party or used to reduce on-site operating costs.
Demonstration Status: ERG is not aware of any U.S. feedlots currently operating FBIs orsending animal waste to larger-scale municipal or private FBIs. According to informationgathered for this program, FBIs are more commonly used in Europe and in Japan to treat animalwaste, although some U.S. companies using waste-to-energy technology may be operating FBIsusing animal waste with other fuel sources. FBIs are most commonly used in the United Statesto manage municipal sludge.
In a study done to assess the engineering and economic feasibility of using poultry litter as a fuelto generate electric power, researchers found that combusting poultry litter (combined with woodchips) can be an effective waste-to-energy technology (Versar, 2000). Although the study did notspecifically evaluate fluidized bed incineration, the application and results are expected to besimilar. The study found litter samples to have a heat content between 4,500 and 6,400 BTU perpound at approximately 16 percent moisture, which is a slightly higher content than the woodchips alone. The ash content of the litter was reported to be between 9 and 20 percent, which issignificantly higher than the wood chips alone. However, although the air emissions data in thisstudy were considered preliminary, they showed that the facility could trigger air permittingrequirements. The study also found that poultry litter ash may be classified as hazardous wasteunder individual state regulations (Versar, 2000).
Practice: Constructed Wetlands
Description: Constructed wetlands (CWs) can be an important tool in the management of animalwaste by providing effective wastewater treatment in terms of substantial removal of suspendedsolids, 5-day biochemical oxygen demand (BOD5), fecal coliform, and nutrients such as N and P(CH2M Hill, 1997). The treatment process in CWs generates an effluent of better quality thatcan be applied on agricultural land or discharged to surface waters (CH2M Hill, 1997).Wastewater treatment in CWs occurs by a combination of mechanisms, including biochemicalconversions, settling/filtration, litter accumulation, and volatilization. Removal of pollutants inCWs is facilitated by shallow water depth (which maximizes the sediment-water interface), slowflow rate (which enhances settling), high productivity, and the presence of aerobic and anaerobicenvironments (Cronk, 1996). Wetland media (soil, gravel) and vegetation provide a large surface area that promotes microbialgrowth. Biochemical conversion of various chemical compounds through microbial activity isthe main factor in the wetland treatment process. Through microbial activities, organic N isconverted to ammonia (ammonification), which is used by plants as a nutrient; ammonia isconverted to nitrate and nitrite (nitrification), which is used by microbes and some plants for
8-98
growth; and N is volatilized (denitrification) and is lost to the atmosphere (CH2M Hill, 1997).Ammonia may be removed through volatilization, uptake by plants and microbes, or oxidized tonitrate. Volatilization of ammonia in CWs appears to be the most significant mechanism for Nremoval for animal waste treatment (Payne Engineering and CH2M Hill, 1997).
Phosphorus removal is achieved mainly by fixation by algae and bacteria, plant uptake, andadsorption onto sediments (Cronk, 1996) when oxidizing conditions promote the complexing ofnutrients with iron and aluminum hydroxides (Richardson, 1985). Plant uptake of P is only ashort-term sink because plant P is rapidly released after the death of plant tissues (PayneEngineering and CH2M Hill, 1997). Fixation of P by microbes ultimately results in the storage ofP in the bottom sediments (Corbitt and Bowen, 1994), yet they may become saturated with P,resulting in an export of excess P (Richardson, 1985).
Rooted emergent aquatic plants are the dominant life form in wetlands (Brix, 1993) and are theonly aquatic plants recommended for planting in CWs used for animal waste treatment (PayneEngineering and CH2M Hill, 1997). These aquatic plants have specialized structures that allowair to move in and out as well as through the length of the plant, have roots that allow adsorptionof gases and nutrients directly from the water column, and are physiologically tolerant tochemical products of an anaerobic environment (Brix, 1993). For these reasons, emergent aquaticplants can survive and thrive in wetland environments. The most common emergent aquaticplants used in CWs for animal waste treatment are cattail (Typha spp.), bulrush (Scirpus spp.),and common reed (Phragmites spp.) (CH2M Hill and Payne Engineering, 1997).
Roles of emergent aquatic plants in the wastewater treatment process include the following: (1) providing a medium for microbial growth and a source of reduced carbon for microbialgrowth; (2) facilitating nitrification-denitrification reactions; (3) assimilating nutrients into theirtissue; (4) facilitating entrapment of solids and breakdown of organic solids; and (5) regulatingwater temperature by shading the water (Payne Engineering and CH2M Hill, 1997). The vasculartissues of these plants move oxygen from overlying water to the rhizosphere and thus provideaerobic microsites (within the anaerobic zone) in the rhizosphere for the degradation of organicmatter and growth of nitrifying bacteria (Brix, 1993). Dissolved nitrates, from nitrification, canthen diffuse into the surrounding anaerobic zone where denitrification occurs. Furthermore,wetland macrophytes remove small amounts (<5 percent, Hammer, 1992) of nutrients, fornutritional purposes, by direct assimilation into their tissue. Removal of nutrients, however,increases slightly in CW systems that incorporate periodic harvesting of plants (Hammer, 1992)or may be considerably higher (67 percent) in specially designed systems that maximize influent-root zone contact (Breen, 1990).
The two principal types of CWs for treating wastewater are surface flow (SF) and subsurfaceflow (SSF) systems. The SF systems are shallow basins or channels, carefully graded to ensureuniform flow, planted with emergent vegetation, and through which water flows over the surfaceat relatively shallow (~30 cm) depths. The SSF systems consist of a trench or bed with, a barrierto prevent seepage, planted emergent vegetation growing in a permeable media (soil, gravel)designed such that the wastewater flows horizontally through the media, with no open surfaceflow. The base media and plant roots provide large surface areas for biofilm growth and thus,
8-99
functions somewhat like a rock trickling filter at a municipal wastewater treatment plant (PayneEngineering and CH2M Hill, 1997).
Some authors also refer to the SF system as the free water surface system, while the SSF type isalso referred to as the vegetated rock-reed filter, vegetated submerged bed system, gravel-bedsystem, and root-zone system. Compared with SSF systems, the SF wetlands are capable ofreceiving a wider range of wastewater loads, have lower construction costs, and are relativelyeasy to manage (Payne Engineering and CH2M Hill, 1997). Additionally, mass removal ofammonia-N, the major form of N in animal wastewater (CH2M Hill and Payne Engineering,1997), in SSF wetlands is significantly less compared with the SF type because there is less timeand oxygen to support necessary nitrification reactions (USEPA, 1993). For these reasons, the SFsystem is the most commonly used wetland type for treating animal waste (Payne Engineeringand CH2M Hill, 1997) and is the only one recommended for animal waste treatment by theUSDA Natural Resources Conservation Service (USDA NRCS, 1991).
Application and Performance: A database, developed by CH2M Hill and Payne Engineering(1997), containing design, operational, and monitoring information from 48 livestock CWsystems (in the United States and Canada), indicates that CWs have been and continue to be usedsuccessfully to treat animal waste, including wastewater from dairy, cattle, swine, and poultryoperations. The majority of CW sites included in the database have begun operations since 1992.SF systems constitute 84 percent of cells in the database, and the remainder consists of SSF orother wetland systems. Cattail, bulrush, and reed, in that order, dominate the aquatic vegetationplanted in the surveyed CWs.
Typically, effluent from a CW treating animal waste is stored in a waste storage lagoon. Finaldispersal occurs through irrigation to cropland and pastureland, though the potential for directdischarge of effluent exists. Direct discharge may, however, require a permit under the EPA’sNational Pollutant Discharge Elimination System.
A performance summary of CWs used for treating animal waste indicates a substantial reductionof suspended solids (53 to 81 percent), fecal coliform (92 percent), BOD5 (59 to 80 percent),ammonia-N (46 to 60 percent), and N (44 to 63 percent) for wastewater from cattle feeding,dairy, and swine operations (CH2M Hill and Payne Engineering, 1997). In a study by Hammer etal. (1993), swine effluent was treated in five CW cells, located below lagoons, that wereequipped with piping that provided a control for variable application rates and water level controlwithin each cell. Performance data indicate notable (70 to 90 percent) pollutant removal rates andreliable treatment of swine lagoon effluent to acceptable wastewater treatment standards forBOD5, suspended solids, N, and P during the first year of the reported study.
Removal efficiency of N is variable depending on the system design, retention time, and oxygensupply (Bastian and Hammer, 1993). Low availability of oxygen can limit nitrification, whereas alack of a readily available carbon source may limit denitrification (Corbitt and Bowen, 1994).Fecal coliform levels are significantly reduced (>90 percent) by sedimentation, filtration,exposure to sunlight, and burial within sediments (Gersberg et al., 1990). Compared with dairy
8-100
Figure 8-11. Schematic of Typical Treatment Sequence Involving a Constructed Wetland
systems, higher reduction of pollutants have been reported for swine wastewater treatment inCWs, probably because loading rates have tended to be lower at swine operations (Cronk, 1996).
Advantages and Limitations: In addition to treating wastewater and generating water of betterquality, CWs provide ancillary benefits such as serving as wildlife habitat, enhancing theaesthetic value of an area, and providing operational benefits to farm operators and theirneighbors (CH2M Hill, 1997). CWs, in contrast to natural wetlands, can be built with a defined(desired) composition of substrate (soil, gravel) and type of vegetation and, above all, offer adegree of control over the hydraulic pathways and retention times (Brix, 1993). An SF system isless expensive to construct than an SSF system, the major cost difference being the expense ofprocuring and transporting the rock or gravel media (USEPA, 1993). An SSF system, however,has the advantage of presenting an odor- and insect-free environment to local residents.
Major limitations include a need for relatively large, flat land areas for operation (Hammer,1993), a possible decrease in SF system performance during winter in temperate regions (Brix,1993), and a reduction in functional sustainability of the SSF systems if the pore spaces becomeclogged (Tanner et al., 1998). Other limitations include (1) an inadequacy of current designs ofSF systems to store flood waters and use stored water to supplement low stream flows in dryconditions and (2) potential pest problems and consequent human health problems fromimproperly designed or operated SF systems (Hammer, 1993). Moreover, because CWtechnology for animal waste treatment is not well established, long-term status and effects,including accumulation of elemental concentrations to toxic levels, are poorly documented.Further research is needed to better understand the nutrient removal mechanisms in CWs so thatimproved designs and operating criteria can be developed.
Operational Factors: Because untreated wastewater from AFOs has high concentrations ofsolids, organics, and nutrients that would kill most wetland vegetation, wastewater from AFOs istypically pretreated in a waste treatment lagoon or settling pond prior to discharge to a CW(Payne Engineering and CH2M Hill, 1997). Incorporating a waste treatment lagoon in thetreatment process reduces concentrations of BOD5 and solids considerably (>50 percent) andprovides storage capacity for seasonal application to the wetlands (Hammer, 1993).
Figure 8-11 shows the typical components and a typical treatment sequence of a CW. Constructed wetlands may be built with cells that are parallel or in a series. Construction of cellsneeds to be determined by the overall topography as well as by the drainage slope of individualcells to maintain shallow water depth for the wetland plants (CH2M Hill and Payne Engineering,1997). The land slope should be small (<0.5 percent), and the length-to-width ratios should bebetween 1:1 and 10:1, with an ideal ratio being 4:1 (USDA NRCS, 1991). Data for the surveyedCWs, reported by CH2M Hill and Payne Engineering (1997), indicate the following average
8-101
design conditions: water depth of 38 cm; bottom slope of 0.7 percent; length-to-width ratio of6.5:1; hydraulic loading rate of 4.7 cm/day; and a size of 0.03 hectare.
Design criteria for CWs for animal waste treatment are described in USDA NRCS (1991),including methods to determine the surface area of a proposed wetland. The NRCS PresumptiveMethod is based on an estimate of BOD5 loss in the pretreatment process, which is used tocalculate BOD5 concentration in the pretreatment effluent. Size of the wetland is thendetermined based on a loading rate of 73 kg BOD5/ha/day that would achieve a target effluent of<30 mg/L of BOD5, <30 mg/L total suspended solids, and <10 mg/L ammonia-N. The NRCSField Test Method is based on laboratory data for average influent BOD5 concentration to theCW. The influent BOD5 concentration, together with average temperature data, is used todetermine the hydraulic residence time needed to obtain a desired effluent BOD5 concentration.
Advances in research and technology of CW during the 1990s have provided additionalinformation to allow modification of the USDA NRCS (1991) methods. CH2M Hill and PayneEngineering (1997) developed the Modified Presumptive USDA-NRCS Method, which takes intoaccount pollutant mass loading and volume of water applied, and relates the results to a datatable developed from existing CWs for animal waste treatment. The Field Test Method #2 wasalso proposed by CH2M Hill and Payne Engineering (1997) based on the areal loading equationdeveloped by Kadlec and Knight (1996), which includes rate constants specific to concentratedanimal waste.
Operation and maintenance requirements for CWs include maintenance of water level in thewetland cells, monitoring water quality of influent and effluent, regular inspection of waterconveyance and control structures to ensure proper flow, and maintenance of the embankments toavoid damage from rodents.
Demonstration Status: CWs have been demonstrated successfully as a management technologytreatment for swine waste (Maddox and Kinglsey, 1990; Hammer et al., 1993) and dairy waste(Chen et al., 1995; Tanner et al., 1995; Schaafsma et al., 2000), and have been relatively lesssuccessful in the treatment of poultry waste (Hill and Rogers, 1997). Results of several othersuccessful case studies, performed in several regions of North America, are reported in DuBowyand Reaves (1994), DuBowy (1996), and Payne Engineering and CH2M Hill (1997).
Practice: Vegetated Filter Strips
Description: Vegetated filter strips are an overland wastewater treatment system. They consist ofstrips of land located along a carefully graded and densely vegetated slope that is not used forcrops or pasture. The purpose of a vegetated filter strip is to reduce the nutrient and solidscontent of wastewater and runoff from animal feeding operations. The filters are designed withadequate length and limited flow velocity to promote filtration, deposition, infiltration,absorption, adsorption, decomposition, and volatilization of contaminants.
The wastewater is distributed evenly along the width of a slope in alternating application anddrying periods. The wastewater may be applied to the slope by means of sprinklers, sprays, or
8-102
Figure 8-12. Schematic of a Vegetated Filter Strip Used to Treat AFO Wastes
gated, slotted, or perforated pipe. As the wastewater flows down the slope, suspended solids aredeposited and some nutrients are absorbed into the vegetation. The effluent from the system iscollected in a channel at the bottom of the slope and then discharged (see Figure 8-12).
Application and Performance: The design of a vegetated filter strip is typically based on theBOD concentration of the wastewater (Metcalf and Eddy, 1991). The total treatment arearequired is calculated from the hydraulic loading rate, assumed length of slope (generally 100 to150 feet), and an operating cycle. The operating cycle and application rate can be varied tooptimize the system. An operating cycle of 1 day is typical, with 8 to 12 hours of application and12 to 16 hours of drying. Ammonia removal from primary effluent can be expected to varyinversely with the ratio of application period to drying period. A properly designed system canremove up to 95 percent of ammonia. The application rate is critical for considering BODremoval because it is important to maintain aerobic conditions that are required for microbialdecomposition. Too high an application rate can create anaerobic conditions because the oxygentransfer through natural aeration from the atmosphere will be insufficient.
The vegetative cover should be dense in growth, such as a grass, and well suited to the climaticconditions. The vegetation must be dense enough to slow the wastewater flow to allow adequatetreatment and prevent erosion. Consideration should also be given to the nutrient uptakepotential of the vegetation to maximize nutrient removal rates.
Proper grading is also critical to the design of a vegetated filter strip to prevent the channeling ofwastewater and allow for efficient treatment. Sites with an existing slope of 2 to 6 percent are
8-103
best suited for vegetated filter strips to keep regrading costs to a minimum without causing waterto pond.
Vegetated filter strips are also best suited to sites that have low permeability soils to preventwastewater from infiltrating the subsurface. In areas where soils are relatively permeable, it maybe necessary to amend the existing soils or install an impermeable barrier.
A study conducted to determine the effectiveness of milkhouse wastewater treatment using avegetative filter strip at a dairy farm in Vermont (Clausen and Schwer, 1989) found thatremovals of total suspended solids, total P, and total Kjeldahl N were 92 percent, 86 percent, and83 percent, respectively. However, the total P concentration in the effluent was more than 100times greater than the average P concentration of streams draining agricultural areas in thenortheast. Moreover, only 2.5 percent of the total input of P and 15 percent of the input of Nwere removed in the vegetation.
The EPA Chesapeake Bay Program studied the use of vegetative filter strips to reduceagricultural nonpoint source pollutant inputs to the bay (Dillaha et al., 1988). A series of nineexperimental field plots were constructed, each containing a simulated feedlot source area and avegetated filter strip of known length. A rainfall simulator was used to produce runoff, whichwas collected from the base of each vegetated filter strip. Analysis indicated that 81 to 91percent of incoming sediment, 58 to 69 percent of the applied P, and 64 to 74 percent of theapplied N were removed.
Advantages and Limitations: Compared with many treatment technologies, vegetated filter stripseffectively reduce the nutrient and solids concentration of wastewater with relatively lowconstruction and maintenance costs. This is particularly true for sites where available land iswell suited for such a system.
However, to effectively treat high volumes of wastewater, such as from a milking parlor,excessive acreage may be required. In addition, because overland flow systems such as vegetatedfilter strips depend on microbiological activity at or near the surface of the soil, cold weatheradversely affects their performance. Winter use of this in colder climates will therefore belimited and an appropriate amount of wastewater storage will be required. Storage isrecommended when the average daily temperature is below 32(F.
Operational Factors: Maintenance of a vegetated filter strip consists of periodic removal of thevegetative growth, which contains many of the nutrients. The biomass has various potentialuses—as forage, fiber, or mulch, for example. In addition, the slope needs to be periodicallyinspected and regraded to ensure a level flow surface and prevent channeling and erosion.
Demonstration Status: Vegetated filter strips have been used to treat milkhouse wastewater inNew York and North Carolina. They have also been used to treat a variety of other wastes,including feedlot runoff.
8-104
Practice: Composting—Aerobic Treatment of Solids
Description: Composting is the aerobic biological decomposition of organic matter. It is anatural process that is enhanced and accelerated by the mixing of organic waste with otheringredients in a prescribed manner for optimum microbial growth. Composting converts anorganic waste material into a stable organic product by converting N from the unstable ammoniaform to a more stable organic form. The end product is safer to use than raw organic materialand one that improves soil fertility, tilth, and water holding capacity. In addition, compostingreduces the bulk of organic material to be spread, improves its handling properties, reduces odor,reduces fly and other vector problems, and can destroy weed seeds and pathogens. There arethree basic methods of composting: windrow, static pile, and in-vessel.
Windrow composting consists of placing a mixture of raw organic materials in long, narrowpiles or windrows, which are agitated or turned on a regular basis to facilitate biologicalstabilization. Windrows aerate primarily by natural or passive air movement (convection andgaseous diffusion). Windrow composting is suitable for large quantities of organic material. Forcomposting dense materials like manure mixtures, windrows are usually no more than 3 feet highand 10 to 20 feet wide. The equipment used for turning, ranging from a front-end loader to anautomatic mechanical turner, determines the size, shape, and spacing of the windrows.
The static pile method consists of mixing the compost material and then stacking the mix onperforated plastic pipe or tubing through which air is drawn or forced. Forcing air (by suction or positive pressure) through the compost pile may not be necessary with small compost piles thatare highly porous or with a mix that is stacked in layers with highly porous material. If layeringis not practiced, the materials to be composted must be thoroughly blended before they are placedin a pile. The exterior of the pile is typically insulated with finished compost or other material. The dimensions of the static pile are limited by the amount of aeration that can be supplied by theblowers and by the stacking characteristics of the waste. The pile height generally ranges from 8to 15 feet, and the width is usually twice the height. The spacing between individual piles isusually equal to about half the height.
The in-vessel method involves the mixing of manure or other organic waste with a bulking agentin a reactor, building, container, or vessel, and may involve the addition of a controlled amountof air over a specific detention time. This method has the potential to provide a high level ofprocess control because moisture, aeration, and temperature can be maintained in some of themore sophisticated units (USDA, 1999).
Application and Performance: Composting is an accepted process for the biological stabilizationof the organic material in waste, providing an alternative to long-term liquid and semisolidmanure storage. It turns waste organic material (dead poultry, manure, garbage, and so forth)into a resource that can be used as a soil amendment and fertilizer substitute. Proper compostingminimizes nutrient loss while killing pathogenic organisms by process generated heat. Forexample, two waste products from a municipal and a dairy source were composted in the labunder controlled temperature and air flow rates (Hall and Aneshansley, 1997). Researchers
8-105
found that maintaining high and constant temperatures destroys pathogens and acceleratesdecomposition.
In general, only manure from confined animals is available for composting. Usually, manuremust be dewatered or mixed with sawdust or wood chips to lower the moisture content, whichmay range from 60 to 85 percent. The presence of plant nutrients such as N, P, and K; theorganic content; and the absence of significant levels of heavy metals makes animal manure avery attractive raw material for producing compost. In-vessel composting has been conductedsuccessfully with dairy cattle manure, swine manure, horse manure, and poultry and turkey litter.
Advantages and Limitations: Compost and manure are both good soil conditioners that containsome fertilizer value. On a growing number of farms, however, manure is considered more of aliability than an asset. Animal waste generators may find themselves with surpluses of manure inthe winter, yet lacking manure by spring planting. Odor complaints associated with manure arecommon in populated areas. Other concerns include polluted runoff from manure spread onfrozen ground and nitrate contamination of wells.
Composting converts the nutrients in manure into forms that are less likely to leach into groundwater or be carried away by surface runoff. Compost releases its nutrients more slowly thancommercial fertilizers, so it does not burn crops and can feed them over a longer period of time. The nutrient value of manure was demonstrated in a study in which five combinations ofcomposted cattle feedyard manure and liquid phosphate were applied to provide 100 percent ofthe P requirement for corn (Auvermann and Marek, 1998). Five replicates were tested for eachtreatment. No significant difference was determined between corn yields in treatment-by-treatment comparisons, indicating that composted feedlot manure may be an adequate substitutefor chemical fertilizers.
A well-managed composting operation generates few odors and flies, and the heat generated bythe composting process reduces the number of weed seeds contained in the manure. Compostingalso reduces the weight, moisture content, and volatility of manure, making it easier to handleand store. Because of its storage qualities, compost can be held for application at convenienttimes of the year. Composted manure and composted manure solids can also be used as beddingmaterial for livestock.
Different types of in-house, deep litter manure management systems were tested at a 100,000-chicken high-rise layer operation in Georgia (Thompson et al., 1998). Composting wasconducted using raw manure, a manure and leaf mixture, and manure and wood chip mixture. The in-house composting was found to reduce the weight and volume of wastes more efficientlythan conventional methods of stacking manure under the house. Wood chip and leaf manureboth had lower moisture content and more concentrated nutrients compared with the raw manure.
Disposal is less of a problem for compost than for manure because there is usually someonewilling to take the compost. One of the strongest incentives for composting is that a marketexists for the product, especially in populated areas. Potential buyers include home gardeners,
8-106
landscapers, vegetable farmers, garden centers, turf growers, golf courses, and ornamental cropproducers. Bulk compost prices range from $7 to $50 per cubic yard, depending on the localmarket, compost quality, and the raw materials used.
Countering these advantages are several limitations. Managing and maintaining a compostingoperation takes time and money, and compost windrows and storage facilities for raw materialscan take land, and possibly building space, away from other farming activities. When processingonly small volumes of farm wastes, the equipment needed is probably already available on thefarm, but composting may become a very capital- and labor-intensive task for larger operations. Farmers might need to invest in special composting equipment, which can cost anywhere from$7,000 to more than $100,000. The main equipment needed for composting on a moderate tolarge scale is machinery to construct, mix, and move material in a compost pile or windrow. Afront-end loader and truck may be all that is required. Other equipment, such as chipping orshredding equipment, a windrow turner, screening equipment, aeration equipment, and acomposting thermometer or temperature probe, might be needed as well.
Although the end product of composting is odor-free, the raw materials used to make compostmay not be. Even the compost piles themselves, if not maintained properly, can becomemalodorous. Cold weather slows the composting process by lowering the temperature of thecomposting material. Heavy precipitation adds water to the composting mix, and snow and mudcan limit access to windrows.
There is also some ambiguity as to whether manure or compost provides crops with more N. Compost can contain less than half the N of fresh manure; however, the N in manure is lessstable than that in compost. Farmers must apply more compost than manure to farmland toachieve the same results because compost nutrients are released very slowly. Generally, less than15 percent of the N in compost is released in the first year.
Last, although compost is a salable product, selling compost involves marketing. This meanssearching out potential buyers, advertising, packaging, managing inventory, matching the productto the customer’s desires, and maintaining consistent product quality.
In addition to these general limitations, there are specific limitations associated with compostingdifferent types of animal manure. Wastes containing excessively high water content, such aspoultry manure from egg laying operations and wet manure from free-stall dairy CAFOs, mayrequire additional processing prior to composting. The conditions for optimal composting (seeOperational Factors below for greater detail) are not always met with these wastes; for example,the water content is too high (usually greater than 70 percent), the biomass is poorly aerated, andthe C:N ratio is often less than 15:1. In these cases, bulking agents such as wood chips or similarwood products are added to make the mix more suitable for efficient composting, but bulkingagents must be purchased if not readily available on the farm. Table 8-17 summarizes some ofthe key advantages and disadvantages of composting.
Operational Factors: Because composting is a biological process, environmental factorsinfluence organism activity, thus determining the speed of decomposition and the length of the
8-107
composting cycle. The composting period typically lasts from 3 to 8 weeks for conventionalcomposting methods under normal operating conditions. Users of some highly controlledmechanical systems claim to produce compost in as little as 1 week. The length of time dependsupon many factors, including the materials used, temperature, moisture, frequency of aeration,and ultimate use of the material. Conditions that slow the process include lack of moisture, ahigh C:N ratio, cold weather, infrequent or insufficient aeration, and large or woody materials. Amonth-long “curing” period usually follows the active composting stage. Curing continues tostabilize the compost but at a much slower pace. At this stage, the compost can be stockpiledwithout turning or aeration and without the fear of odor problems (Rynk, 2000).
Table 8-17. Advantages and Disadvantages of CompostingAdvantages of Composting Disadvantages of Composting
Compost is an excellent soil conditioner. Composting is labor and management intensive.
Compost is a salable product. Selling compost involves marketing costs (advertising,packaging, management, customer service, and so forth).
Compost reduces the weight, moisture content, and activityof manure, making it easier to handle and store.
The composting site, raw materials storage, and compoststorage require a large land area.
Composting converts the N content of manure into a morestable organic form. Manure that has been compostedprovides a better carbon/nitrogen ratio (C:N) in the soil,contains fewer weed seeds, and poses a lower risk ofpollution and nuisance complaints (due to less odor andfewer flies).
Nutrients in compost are in complex form and, therefore,need to be mineralized for plant intake; thus a greater volumeof compost is needed to meet crop demands.
Composting kills pathogens. Effectiveness is weather dependent.
Compost is a suitable bedding substitute. Large operations require expensive equipment
Land-applied compost has proven to suppress soil-borneplant diseases without the use of chemical controls.
Odors can be a recurring problem.
Some farmers have begun accepting payment (referred to as“tipping fees”) to compost off-site wastes.
Acceptance of off-site organic wastes may result in theoperation being classified as commercial and increasecompliance costs under zoning and environmentalregulations.
The characteristics of the raw organic material are the most important factors determining thequality of compost, including moisture content, C:N ratio, aeration, material particle size, andtemperature. Acceptable and preferred ranges for nutrient balance (C:N ratio), moisture content,pH, and bulk density are provided in Table 8-18 (NREAS, 1992). Additional factors consideredwhen formulating a raw organic material recipe are degradability, odor potential, and cleanness. For example, swine manure is very odorous and should not be composted on locations prone toodor complaints. Cleanness refers to the degree of contamination from unwanted materials(glass and heavy metals), chemicals (pesticides), and organisms (human pathogens). If thecompost is to be sold offsite, the raw material content will greatly affect its market value.
The optimum moisture content for composting varies with particle size and aeration. At highmoisture content, voids fill with liquids and aeration is hindered. Low moisture levels, on theother hand, retard or stop microbial activity, although some composting occurs with moisture aslow as 25 percent. Depending on the raw materials, there is ultimately a 30 to 60 percentreduction in volume of the compost material, much of it due to water loss. If the water content
8-108
falls below 40 to 50 percent, water should be added and mixed into the composting feedstocks. Warm weather enhances water loss from compost windrows by surface evaporation. Increasedturning also results in a higher evaporation rate. This can be an advantage if a drier compost isdesired, but if the evaporation rate becomes too high, water should be added to reduce potentialfire hazards.
Periods of high rainfall can also be a problem for windrow composting. Windrows usuallyabsorb water from normal rainfall or snow without saturating the materials. If the windrowsbecome wetter than desired, more turnings are required to evaporate the added moisture. Raincan also produce muddy conditions, making it difficult to operate turning equipment. Snow canhalt operation altogether until plowed from equipment paths. In addition, puddles and standingwater can lead to anaerobic conditions at the base of a windrow. It is important that thecomposting site has adequate drainage to compensate for periods of high rainfall.
Table 8-18. Desired Characteristics of Raw Material MixesCharacteristic Reasonable Range Preferred Range
Carbon to Nitrogen (C:N) Ratio 20:1-40:1 25:1-30:1
Moisture Content 40-65 percent 50-60 percent
pH 5.5-9 6.5-8.5
Bulk Density (lbs/y3) Less than 1,100 No preferred range
Source: NREAS, 1992.
Carbon and nitrogen serve as nutrients for the microorganisms, and for efficient composting theyshould be available in the right balance. A good C:N ratio falls between 25:1 and 35:1, althoughrecommendations vary based upon site-specific conditions. For example, a study by VirginiaPolytechnic Institute and State University concluded that the best combination of straw and rawswine manure for composting has a C:N ratio of 16:1 and a moisture level of 50 to 70 percent(Collins and Parson, 1993). Above the optimum range of C:N ratio, the materials break down at aslower rate, while a lower ratio results in excess nitrogen loss. For example, a study of poultrylitter composting as a function of the C:N ratio and the pH of the starting materials showed thatammonia emissions decreased substantially as the C:N ratio increased through addition of shortpaper fiber (C:N ratio(> 200:1) to broiler litter (Ekinci et al., 1998). As composting progresses,the C:N ratio will fall gradually because the readily compostable carbon is metabolized bymicroorganisms and the nitrogen is converted to nitrate and organic forms.
In animal manure, the C:N ratio is usually 10:1 to 15:1. The C:N ratios for different manuresvary: poultry litter 10:1, layer manure 5:1, cattle feedlot manure 13:1, dairy manure 18:1, swinefeedlot manure 3:1, and horse stable manure 25:1. Bulking materials can be added to increasethe C:N ratio in the compost pile. Typical bulking materials include grass clippings (C:N ratio of12:1 to 25:1); hay (15:1 to 32:1); oak leaves (50:1); shrub and tree trimmings (50:1 to 70:1);straw, cornhusks, and cobs (50:1 to 100:1); pine needles (60:1 to 100:1); sawdust (150:1 to700:1); wood chips (500:1 to 600:1); or newspaper (400:1 to 850:1). For example, dairy manureis a good substrate for composting because it breaks down quickly and supplies the
8-109
microorganisms with most of the required nutrients, but it is also nitrogen-rich, excessively wet,and has a carbon-to-nitrogen ratio ranging from 12:1 to 18:1. Moisture content varies from about75 percent for manure collected from stanchion barns to about 85 percent from free-stalloperations, with the variability determined primarily by the amount of bedding used. To makedairy manure more suitable for composting, it must be mixed with bulking agents that can beeasily incorporated into the composting mix by using them as bedding.
The feasibility of using sawdust and chopped fescue hay as a low-cost waste carbon source tocompost with separated swine manure solids was investigated using 21-liter vessels and bincomposting units (Hoehne et al., 1998). Manure and fescue hay produced the lowest C:N ratio inboth small and large composting units. Temperature trends were used to indicate biologicalactivity. Composting manure with a carbon source was recommended because the product waseasy to transport, appropriate for transport through residential areas, and odor-stable, even thoughcomposting is labor intensive.
The rate of air exchange and effectiveness of aeration of windrows depends on the porosity ofthe windrow. For example, a wet, dense windrow containing manure is less porous than awindrow of leaves. Windrows that are too large may result in anaerobic zones occurring near thecenter and causing odors when the windrow is turned. Periodic turning of window compost pilesexposes the decomposing material to the air and keeps temperatures from getting too high(exceeding 170 oF). The most important effect of turning is rebuilding the windrow’s porosity. Turning fluffs up the windrow and restores pore spaces lost from decomposition and settling,thereby restoring oxygen within the pore spaces for microorganisms and improving passive airexchange. Turning also exchanges the material at the surface with material in the interior. Thematerials compost evenly and, as a result, more weed seeds, pathogens, and fly larvae aredestroyed by the high temperatures. The minimum turning frequency varies from 2 to 10 days,depending on the type of mix, volume, and ambient air temperature. As the compost ages, thefrequency of turning can be reduced.
A study in Ohio measured ammonia concentrations from dairy manure and rice hulls compostedwith various aeration rates (Hong et al., 1997). Temperature and ammonia concentrationspeaked 48 days after aeration begins and then declined steadily, leveling off after 150 hours. Theeffect of intermittent aeration on composting swine waste was studied to determine changes inammonia emissions and dry matter loss (Hong et al., 1998). Continuous and intermittentaeration treatments were tested on composting hog manure amended with sawdust in pilot-scale200-liter vessels. Ammonia emissions were 39 percent lower from the intermittent aerationtreatments, and nitrogen losses as NH3-N were 26 percent lower for continuous aeration and 14percent lower for intermittent aeration. Dry solids loss and other physicochemical propertieswere similar between the two treatments. It was concluded that intermittent aeration may be apractical method of reducing nitrogen loss and ammonia emissions when composting swinemanure with sawdust.
Smaller particle size provides greater surface area and more access for the degrading organisms. It may be necessary to reduce by grinding the particle size of some material such as corn stalks.
8-110
Windrow turning blends raw materials and breaks up particles into smaller pieces, thusaccelerating biodegredation through increased surface area.
Heat produced during the composting process raises the temperature of the compostingmaterials. Because the heat produced is directly related to the biological activity, temperature isthe primary gauge of the composting process. During the first few days of composting, piletemperatures increase to between 104 and 158 o F. This range enhances the growth and activityof the microorganisms. In addition, temperatures above 131 o F kill most pathogens, fly larvae,and weed seeds. The high temperature might be maintained for several days, until themicroorganisms begin to deplete their food source or until moisture conditions become less thanoptimal. Mixing the composting feedstock brings more undecomposed food into contact withthe microorganisms, replenishing their energy supply. Once the optimum moisture level isrestored and the feedstocks have been remixed, the temperature increases again. After the readilydecomposable material is depleted, the compost pile no longer heats upon remixing. Thetemperature continues to drop to ambient, and only very slow decomposition continues.
Although composting can be accomplished year-round, seasonal and weather variations oftenrequire operational adjustments. This is especially true for windrow composting. Cold weathercan slow the composting process by increasing the heat loss from piles and windrows. The lowertemperatures reduce the microbial activity, which decreases the amount of heat generated. To compensate for cold weather, windrows should be large enough to generate more heat than theylose to the environment, but not so large that the materials become excessively compacted. Windrows that are too small can lose heat quickly and may not achieve temperatures high enoughto cause moisture to evaporate and kill pathogens and weed seeds. Demonstration Status: Agricultural composting is experiencing a resurgence of activity,particularly in the northeastern United States. A growing number of farmers are now compostingsignificant quantities of organic materials. These farmers have incorporated composting of awide variety of organic wastes generated on and off farm into their normal operations. Someown large commercial enterprises; others are small “hobby” farms. A number operate otherwisetraditional dairy enterprises, and several are organic vegetable growers. Some use all or most ofthe finished compost on the farm, and some produce compost and soil mixes as a primaryagricultural product. Many use existing on-farm technology to manage the compost piles, andothers have invested in specialized compost production equipment.
Several Massachusetts dairy farms have adopted composting as a manure management technique. In a study of five farms practicing composting in that state, it was found that three used thewindrow method of composting, one used the passive method, and one experimented withseveral composting methods, finding the windrow method the most successful (Rynk, 2000). The Rosenholm-Wolfe Dairy farm in Buffalo County, Wisconsin, has successfully producedcompost for the commercial market using organic solids separated from manure that had beenflushed from a 250-head free-stall barn (Rosenow and Tiry, _____). The raw compostingmaterial has a C:N ratio of 30:1 and a moisture content of 60 percent, which is ideal for rapidproduction of a high-quality product using windrow composting.
8-111
A pilot project conducted at the Purdue Animal Science Research Center has shown thatcomposting can be an efficient way to manage waste from dairy farms, hog farms, beef feedlots,and poultry operations at a lower cost than that associated with other waste management methods(Purdue News, August 1998). The composting site has 13 rows of compost material, of themeach 5 feet tall, 10 feet wide, and 250 feet long. The rows are turned using a specializedwindrow turner.
Three fundamental factors driving this renewed interest in composting are environmental andcommunity constraints on traditional manure management options, increased understanding ofthe agronomic benefits of compost use, and rising disposal costs for such materials as municipalyard waste and food processing wastes, which might be managed for a profit in an agriculturalsetting. Despite growing interest, however, the environmental and possible economical benefitsof composting are challenged by a variety of constraints. An agricultural composting studyconducted by Cornell University (Fabian, 1993) concluded that governmental agencies need totake a number of steps to further encourage agricultural composting, including minimizingregulatory constraints on farm-composted materials, encouraging local zoning to allow compostfacilities as a normal agricultural operation, providing governmental assistance for compostingequipment and site preparation, developing procurement guidelines for state agencies to usecompost in preference to peat and topsoil, and supporting research and demonstration programsthat explore new applications for compost in the agricultural sector.
Practice: Dehydration and Pelleting
Description: Dehydration is the process by which the moisture content of manure is reduced to alevel that allows the waste to be used as a commercial product, such as fertilizer for horticulture.
Applicability and Performance: Dehydration has been used on a variety of animal wasteproducts, including poultry manure and litter. The output material (dried to about 10 percentmoisture content) is an odorless, fine, granular material. With a moisture content of from 10percent to 15 percent, a slight odor may be noted. Crude protein levels of from 17 percent to 50percent have been reported in dried poultry waste (USEPA, 1974). The material can also beformed into pellets prior to drying. Pelleting can make the material easier to package and use asa commercial fertilizer.
Operational Factors: Manure is collected and dried from an initial moisture content of about 75percent to a moisture content of from 10 percent to 15 percent. The drying process is usuallyaccomplished using a commercial drier. The input requirement for most commercial driers isthat the raw material be mixed with previously dried material to reduce the average moisturecontent of the input mixture to less than 40 percent water.
The mixture is fed into a hammer mill, where it is pulverized and injected into the drier. Anafterburner is generally incorporated to control offensive odors. The resultant dried material iseither stockpiled or bagged, depending on the ultimate method of disposal selected. Unitsreported range in size from small portable units to systems capable of processing 150,000 tonsper year (USEPA, 1974).
8-112
Advantages and Limitations: The drying of animal waste is a practiced, commercial technologywith the dehydrated product sold as fertilizer, primarily to the garden trade. It is an expensiveprocess that can be economical only where the market for the product exists at the price levelnecessary to support the process.
Development Status: The status of dehydrating animal manure is well established. Full-scaledrying operations have been established with animal manure, in some cases since the late 1960s. A number of manufacturers offer a line of dehydration equipment specifically designed for thispurpose. At least one large-scale facility, currently under construction on the DelmarvaPennisula, will be used to treat broiler manure.
Practice: Centralized Incineration of Poultry Waste
Description: Centralized incineration is an alternative method of disposing of excess poultrylitter. Most poultry litter has energy content and combustion qualities similar to those of otherbiomass and commercially used alternative fuels (e.g., wood and refuse-derived fuels frommunicipal trash). Under a centralized incineration approach, poultry litter that is removed fromthe houses is collected and transported to a centralized facility that has been designed orretrofitted to burn poultry litter. The concentration of the poultry industry in several areas of thecountry and the dry composition of the manure facilitates litter transport, which is critical to thesuccess of this alternative treatment technology. The centralized incineration unit could belocated at a processing plant to provide power to the plant or at a stand-alone facility that wouldgenerate power for public use.
Application and Performance: Most of the nutrients in the litter would not be destroyed bycombustion, but would be captured in the combustion ash and could be managed safely andeconomically. Consequently, the most immediate environmental benefit from burning litter isthat its nutrients would not be applied to cropland and therefore would not run off intowaterways.
Advantages and Limitations: The incineration of poultry litter to generate energy offers severalclear advantages over current practices. The energy recovered by burning poultry litter woulddisplace conventional fossil fuels and thereby avoid greenhouse gas emissions. The pollutioncontrol equipment required for major fuel burning units would likely minimize other combustionemissions when the manure is burned.
Limitations of using poultry litter as fuel include variability in litter composition, litterproduction rates, and litter caloric content. One of the most important determinants of thesuitability of any substance as a fuel is its moisture content, and there is no guarantee that litterwould undergo any sort of drying process prior to combustion. Moisture in a fuel represents areduction in its heating value because some of its energy content must be used to vaporize themoisture, reducing the fuel’s effective energy output. Poultry litter has a much lower Britishthermal unit (Btu) content, higher moisture content, and higher ash content than conventionalfuels. It can pose greater operational problems (such as corrosion) and would probably beconvertible to steam at a lower efficiency than conventional fuels. Moreover, because of its
8-113
much higher ash content, litter will yield far more unburned residuals than other fuels. Metals, P,and K from the litter will concentrate in the residual ash; however, bottom ash and fly ash can besold as fertilizer, contributing to the profitability of the technology.
Metals (e.g., copper, arsenic, zinc) may be present in litter because they are added to poultry feedas a dietary supplement. Other metals may be unintentionally present in feed and bedding, ormay be scraped from the floor of a poultry house when the litter is removed. Aluminum may befound in litter because alum is added to limit ammonia volatilization, and aluminum sulfate isadded to bind the P in litter, reducing P in runoff when applied to land. Metals in poultry littercan affect its suitability for combustion in several ways. First, the concentration of metals couldaffect the nature of air emissions from a poultry-fired boiler. Second, metals might pose aproblem in the ash created from litter combustion. Most toxic metals concentrate significantly incombustion ash relative to the unburned litter.
Although litter combustion has significant environmental advantages, adverse environmentalimpacts might result from using poultry litter as a fuel source. Air emissions and treatmentresiduals result from the incineration of any fuel, however, and the chemical and physicalproperties of litter as a fuel do not suggest that burning litter would result in significantly worsepollution emissions than would burning conventional fuels. When compared with thecombustion of conventional fuels, combustion of poultry litter produces fewer tons of nitrogenoxides (NOx), sulfur oxides (SOx), and filterable particulate matter (PM) emissions at the boilerthan coal or residual (No. 6) oil. In comparison with distillate fuel oil, litter has a less desirableemissions profile. A comparison with wood is mixed; litter shows lower emissions of carbonmonoxide (CO), filterable PM, and methane, whereas wood shows lower emissions of NOx, SOx,and carbon dioxide (CO2). Despite the high N content of poultry litter, burning litter should notincrease NOx emissions. NOx emissions from combustion primarily depend on the nature of thecombustion process itself (affecting the degree to which atmospheric nitrogen is oxidized) andonly secondarily on the amount of N in the fuel. In fact, the high ammonia levels in poultry littermay act to reduce much of the NOx that is formed during combustion back into elemental N. This is the reaction that underlies most of the modern NOx control technologies (selectivecatalytic and noncatalytic reduction) used in utility boilers.
SOx formation in combustion processes depends directly on the sulfur content of the fuel. Therefore, SOx emissions from burning poultry litter should be lower than those from high-sulfurfuels (residual oil or higher-sulfur coal) and higher than those from low-sulfur fuels (distillate oil,low-sulfur coal, wood, natural gas). The relatively high alkali (potassium and sodium) content oflitter and litter combustion ash may cause problems in the combustion system: a low ash meltingpoint, which can lead to slagging and deposition of “sticky” ash on combustion surfaces, andhigh particulate emissions in the form of volatile alkali compounds. However, this high alkaliash content also has the likely benefit of reducing SOx in the flue gas through a “scrubbing”effect. If the uncontrolled emissions from burning poultry litter appear likely to exceed emissionstandards, an appropriate air pollution control device would be installed at the unit, just as itwould be at a conventional fuel-burning unit.
8-114
Costs for this technology include cleanout and storage/drying costs, as well as the cost oftransporting the litter to the incineration facility. A fuel user might hire a contractor to removelitter from a poultry house and load it onto a truck for delivery, hire a contractor to load the litterand pay a grower for the litter and cleanout, or hire a contractor to get the litter from the shed andload it onto a truck, paying the grower for the litter, cleanout, and storage. In addition, fuel usersmay also need to install new fuel-handling and management equipment and perform someredesign of the combustion process. Burning litter effectively might entail new plantconstruction, such as construction of a direct-fired biomass facility, retrofitting of an existingplant for direct firing poultry litter, or retrofitting of an existing cogeneration facility or boiler toco-fire poultry litter with conventional fuels (such as oil or coal). Most operations would alsorequire a storage structure and litter supply system. The costs of retrofitting a processing plantboiler or feed mill boiler to co-fire litter do not appear excessive. The cost savings from burninglitter would continue indefinitely and would increase as fuel users find more effective andefficient ways of burning litter.
Operational Factors: One of the first steps in using poultry litter as a fuel is to estimate theamount of litter produced by a feedlot. This amount is then compared with the quantity of litterthat could be spread appropriately on local cropland to meet agricultural nutrient needs. Theamount by which litter production exceeds the litter needed for crop nutrient purposes is themeasure of the amount available for fuel. Several approaches are in use to project the volume oflitter that a poultry operation will generate. The differing results of these approaches are mostly afunction of the wide range of variables that affect poultry litter production—type of bird, feedand watering programs, bird target weight, type of bedding, litter treatment for ammonia control,house type, crusting procedures, and cleanout schedules. One method uses a calculation of 10.8lb of manure produced per broiler per year, another assumes an average of 35 lb of manure per1,000 birds per day, and another assumes an average of 2.2 lb of litter per bird. Other moresophisticated methods apply a rate of litter produced per unit of bird weight produced. However,the most straightforward and commonly used calculation relies on an assumption of 1 ton of litterper 1,000 birds. It should be noted that since a significant portion of the weight of litter is water,having drier litter means fewer tons per bird. Therefore, the 1 ton of litter per 1,000 birdsassumption should be treated strictly as a rough estimate.
The most important characteristic of litter with regard to its value as a fuel is its caloric content. Although the energy content of litter varies significantly, there is less variation after it is air-driedor oven-dried. For example, research conducted on the Btu content of several litter samplesunder varying moisture conditions showed that litter with a moisture content ranging from 0percent to 30 percent having a caloric content ranging from 7,600 Btu per pound to 4,700 Btu perpound, respectively. Litter has a much lower caloric value than conventional fuels, but it has anenergy content similar to that of several other commonly used alternative fuels. In addition,when litter is used as a fuel, its density affects the nature of the fuel feed systems and boilerconfigurations required. The density of litter also affects how the litter can be stored, handled,transported, and land-applied. Estimates of litter density vary widely, depending largely on themoisture content of the litter. Estimates range from 19 to 40 pounds per ft3, with the averagebeing roughly 30 pounds per ft3.
8-115
Because poultry litter is quite variable with respect to several characteristics important to its useas a fuel, the fuel user must develop quality control and quality assurance guidelines to ensurethat the litter is of consistent quality and well suited for combustion. Criteria for accepting littermay include acquiring only litter that has been covered in storage for some period of time toavoid excessive moisture and increase Btu content per ton, or mixing a large quantity of litter onsite prior to burning to reduce fluctuations in quality across individual loads of litter. One plantin operation in the United Kingdom employs the following measures: (1) litter shipments areexamined for moisture content with infrared equipment, and shipments with excessive moistureare rejected; (2) core samples are taken and analyzed for moisture, ash, and Btu content; (3)based on the results of the analysis, the load is sorted into one of several storage pits; and (4) anoverhead crane draws from the different storage pits in a manner providing an appropriate blendof wet and dry material, giving a reasonably constant caloric value when fed to the furnace.
Demonstration Status: This technology is not currently used in the United States for poultrywaste; however, existing boilers could be retrofitted to co-fire litter with conventional fuels suchas oil or coal, or litter could be burned in a direct-fired biomass facility to generate electricity,steam, or heat at power plants or in boilers at poultry processing plants to supplement energyneeds. Other agricultural and silvicultural wastes such as bagasse, almond shells, rice hulls, andwood wastes are burned for energy recovery in scattered utility and industrial plants in the UnitedStates. In the United Kingdom, several medium-sized, profitable electric power plants are fueledby poultry litter. This indicates that centralized incineration of poultry waste has the potential todevelop into a commercially viable alternative treatment technology for poultry growers. A British company, Fibrowatt, conceived of, developed, and operates the electricity plants in theUnited Kingdom that use poultry litter as fuel. Fibrowatt’s three plants (two operating, one underconstruction) are all new and are all electricity-generating plants rather than industrial boilers forsteam heat or cogeneration facilities. Fibrowatt’s litter storage and handling system isproprietary. The Fibrowatt plant at Eye in Suffolk, the first plant fueled by poultry litter, came online in July 1992. The second plant, in Glanford at Humberside, came on line in November1993. The third and largest plant is at Thetford in Norfolk, which was scheduled to beginoperations in 1998.
The basic operations at the three plants are similar. Each plant is situated in the heart of apoultry-producing region. Trucks designed to minimize odor and the risk of biocontaminationtransport the litter from farms to the power plants. The trucks enter an “antechamber” to thelitter storage structure, and the doors of the antechamber are closed before the truck unloads. Upon arrival, the litter is sampled for nearly 40 different traits, including Btu content andmoisture. The litter is stored and conditioned in a way that homogenizes the fuel. It is keptunder negative pressure to control odor, and the air from the fans in the storage structure isdirected to the boilers and used in combustion. The Glanford plant uses Detroit Air-jet spreader-stokers (reciprocating grate, solid-fuel combustors) to burn fuel. The Eye plant employs astepped grate stoker. The boilers are Aalborg Ciserv three-pass, natural-circulation, single-drumwater tube boilers. There are modifications to the ash removal process because the high alkalicontent of the litter can cause corrosion in the boiler. The steam from the boiler is passed to aturbo-alternator, and electricity is sold to the grid. The Fibrowatt plants are commercially viable
8-116
in the United Kingdom because the prices Fibrowatt can charge for the electricity delivered to thegrid are far higher than the prices charged in the United States. In addition, farmers are charged adisposal fee for their litter, and Fibrowatt is able to earn money on the ash produced bycombustion, which the plants collect and sell as concentrated fertilizer with a guarantee analysis. Theoretically, the process could be replicated in the United States, but a full-market study wouldbe needed.
Poultry litter is not currently used as fuel in the United States; however, research into thefeasibility of burning litter for electricity, steam, or heat is under way. Maryland EnvironmentalServices (MES) has asked the Power Plant Research Program (PPRP), an arm of the MarylandDepartment of Natural Resources, to help investigate the possibility of burning poultry litter atthe cogeneration plant at the Eastern Correctional Institute. In February 1998, Exeter Associatespublished a report for MES projecting the costs of various scenarios for using poultry litter at theplant. One of the recommendations in the report was that a full engineering study be done toobtain a better estimate of the costs involved. MES submitted a request for proposals on thisbasis in April 1998 and received bids from several companies. Among the companies that bidwere Fibrowatt and two companies that build gasifiers. As of July 1998, the gasifier companybids had been rejected and the remaining bids were still under consideration. MES is determinedto turn the cogeneration plant at the Eastern Correctional Institute into a working facility and isinterested in a Fibrowatt-style system, the technology of which is proven and currentlyoperational.
Other Technologies for the Treatment of Animal Wastes
Practice: Aquatic Plant Covered Lagoons
Aquatic plant covered lagoons provide low cost wastewater treatment by removing suspendedsolids, BOD, N, and P in structures that are mechanically simple, relatively inexpensive to build,and low in energy and maintenance requirements (WPCF-TPCTF, 1990). Wastewater treatmentoccurs through a combination of mechanisms including biochemical conversion through plant-microbial reactions, plant uptake, settling, volatilization, and adsorption onto sediments. Free-floating aquatic plants such as duckweed (Lemnaceae) and water hyacinth (Eichhornia crassipes)grow rapidly (in a matter of days) and take up large amounts of nutrients from wastewaters(Reddy and De Busk, 1985). In addition, the extensive root system of water hyacinth provides alarge surface area for microbial growth, which promotes degradation of organic matter andmicrobial transformation of N (Brix, 1993). Greater than 70 percent removal of pollutants byaquatic plant covered lagoons has been reported for domestic wastewater treatment (Orth andSapkota, 1988; Alaerts et al., 1995; Vermaat and Hanif, 1998). Depending on the lagoon design,water depth, and retention time, effluent from hyacinth and duckweed covered lagoons canpotentially meet secondary and sometimes advanced wastewater discharge standards for BOD,suspended solids, N, and P (Buddhavarapu and Hancock, 1991; Bedell and Westbrook, 1997).
In addition to providing wastewater treatment, nutrient uptake by water hyacinth and duckweedproduces a protein rich biomass (Reddy and Sutton, 1984; Oron et al., 1988) that can beharvested and used as an agricultural fertilizer or a feed supplement (Oron, 1990). Furthermore,
8-117
duckweed and hyacinths provide a dense cover that restricts algal growth by impeding sunlight atthe water surface (Brix, 1993), reduces odor by preventing gaseous exchange, and acts as aphysical barrier to reduce the breeding of mosquitoes (Buddhavarapu and Hancock, 1991).Limitations of aquatic plant covered lagoons include a need for large treatment areas,pretreatment of wastewater in settling ponds, and floating grid barriers to keep plants fromdrifting (Brix, 1993). Cold temperature reduces the growth rate of floating plants (Brix, 1993).Although duckweed removes fewer nutrients than do water hyacinths (Reddy and De Busk,1985), duckweed has higher protein and lower fiber, a faster growth rate, and lower harvestingcosts (Oron, 1990), and can grow at temperatures as low as 1 to 3(C (Brix, 1993). Duckweedprefers ammonia over nitrate (Monselise and Kost, 1993), transforms nutrients to a protein-rich(25-30 percent) biomass (Oron, 1990), and selected duckweed species (Lemna gibba, Lemnaminor) have been demonstrated to grow on undiluted swine lagoon effluent (Bergmann et al.,2000). For these reasons, duckweed is potentially effective in the treatment of animal waste. Further studies are needed to understand better the application and performance of aquatic plantcovered lagoons for animal waste treatment.
Description: Nitrification-denitrification refers to the biological conversion of ammonium firstto nitrate, then to nitrogen gas. Many schemes for nitrification-denitrification have beenresearched, including the use of nitrifying bacteria encapsulated in polymer resin pellets to speedup the reaction (Vanotti and Hunt, 1998). The theory is that elevated populations of nitrifyingbacteria immobilized on resin pellets that are retained in a treatment system will convert moreammonia to nitrate faster than free swimming bacteria. There is ample evidence that attachedmedia systems that retain bacteria on their surface remove the target pollutants more effectivelythan bacteria that have to swim to their food and can be washed from the system.
Vanotti and Hunt demonstrated in the lab that an enriched solution of encapsulated nitrifiers inan oxygen-saturated solution at 30 oC, with 150 ppm BOD and 250 ppm TKN, could nitrify 90percent of the ammonia in a batch if sufficient alkalinity was added. The research alsodocumented that a solution with encapsulated nitrifiers had more and faster nitrification than anaerated equivalent volume of anaerobic lagoon effluent with no nitrifiers added.
A pilot plant using imported pellets operating on anaerobic lagoon effluent followed thelaboratory work. The effluent was first screened, and then introduced into a contact aerationtreatment to reduce BOD. The aeration sludge was settled next, and then treated effluent wasintroduced into a nitrification tank in which another aeration blower was used to maintain adissolved oxygen concentration of 3 milligrams per liter. The pH was maintained at 7.8 orgreater with sodium hydroxide as necessary. The results of 3 months of operation were that,given adequate pretreatment, high nitrification rates of swine wastewater could be attained usingenriched nitrifying populations immobilized on polymer resins.
Application and Performance: The technology specifically targets nitrification of ammonia, andcould reduce the loss of ammonia-N to the atmosphere. When set up and operated properly, thetreatment can convert 90 percent of the ammonia-N remaining in pretreated lagoon effluent to
8-118
nitrate. A nitrified farm effluent can be denitrified easily by either returning it to an anaerobicenvironment resulting in release of nitrogen gas (N2). This technology will have little if anyeffect on pathogens, metals, growth hormones, or antibiotics. It can be assumed that most ofthese constituents were removed in the process of aerating the manure to reach oxygen-saturatedconditions, which would enable the encapsulated nitrifiers to function.
Advantages and Limitations: A facility to support this process would be expensive to build,operate, and maintain. It is difficult to imagine this process being used on a farm. One area notconsidered is the sludge generated by aerobic pretreatment. Another limitation is the anaerobiclagoon pretreatment step used to reduce initial BOD and limit sludge production.
Operational Factors: Nitrifying bacteria are temperature sensitive, but the effect of temperaturewas not discussed by Vanotti. Rainfall and varying concentration should not affect performance;however, seasonal temperature variation may reduce nitrification.
Demonstration Status: North Carolina State University has operated a pilot plant in DuplinCounty, North Carolina.
Disinfection—Ozonation and UV Radiation
Ozonation is commonly used to disinfect wastewater after biological treatment. Ozone is ahighly effective germicide against a wide range of pathogenic organisms, including bacteria,protozoa, and viruses. It oxidizes a wide range of organics, can destroy cyanide wastes andphenolic compounds, and is faster-acting than most disinfectants. Moreover, unlike chlorine,ozone does not generate toxic ions in the oxidation process.
UV radiation is used primarily as a disinfectant. It inactivates organisms by causing aphotochemical reaction that alters molecular components essential to cell function. It is veryeffective against bacteria and viruses at low dosages and produces minimal disinfection by-products. To enhance the inactivation of larger protozoa, UV radiation is often considered inconjunction with ozone.
Disinfection measures such as ozonation and UV radiation are not commonly practiced in theUnited States for treatment of animal wastes. Animal wastewater would require primary and/orbiological treatment prior to disinfection . Ozone is generally effective for aqueous waste streamswith less then 1 percent organic content. Both processes are costly and require higher levels ofmaintenance and operator skill. Wastewater with high concentrations or iron, calcium, turbidity,and phenols may not be appropriate for UV disinfection. The effectiveness of UV disinfection isgreatly hindered by high levels of suspended solids.
Vermicomposting
Composting is the controlled decomposition of organic materials and involves both physical andchemical processes (see Composting—Aerobic Treatment of Solids). During decomposition,organic materials are broken down through the activities of various invertebrates that naturally
8-119
appear in compost, such as mites, millipedes, beetles, sowbugs, earwigs, earthworms, slugs, andsnails. Vermicomposting is accomplished by adding worms to enhance the decompositionprocess.
Vermicomposting uses “redworms” (Eisenia foetida), which perform best at temperaturesbetween 50 and 70 oF. Bones, meats, fish, or oily fats should not be added to a worm compostbox because of odors and rodent problems they could create. Successful operation requires agreat amount of maintenance because the worms are highly sensitive to alterations in oxygenlevels, temperature, moisture, pH, nutrients, and feed composition and volume. Heavy metals arenot treated by any means of composting and can be toxic to the microorganisms and invertebratepopulation.
Farm-scale systems for vermicomposting have been developed. They tend to be simple systemsusing conventional material-handling equipment. Labor and equipment are required to addmaterial to the bed, remove composted material, separate the compost from the worms byscreening, and process the compost and worms for their respective markets (the compost as aprotein additive to animal feed; the worms as fish bait). Flies are a potential problem since thisprocess occurs at a lower temperature than the general composting process. Pathogen destructionand drying are also reduced. A drying or heating step may be required to produce the desiredcompost.
Chemical Amendments
Chemical amendments to poultry litter have been proven to enhance nutrient removal and odorelimination. Ammonia volatilization from poultry litter often causes high levels of atmosphericammonia in poultry houses, which is detrimental to both farm workers and birds. Ammoniaemissions from houses can also result in a loss of fertilizer nitrogen and aggravate environmentalproblems such as acid rain. Litter amendments, such as aluminum sulfate (alum), ferrous sulfate,and phosphoric acid, have been proven to reduce ammonia volatilization from litter dramatically. Alum has also been shown to reduce water-soluble P concentrations in litter (whereas phosphoricacid greatly increases water-soluble P levels) and alum has the ability to reduce the solubility ofmetals (arsenic, copper, iron, and zinc), thereby reducing metal concentrations in rainwaterrunoff. Ferrous sulfate is also effective in reducing soluble P in the runoff from land-appliedpoultry litter, but is not favored as an option for use inside poultry houses because chickensmight ingest the toxic substance.
Odor control is a major concern at many CAFOs. Chemical additives such as potassiumpermanganate have been used to reduce levels of sulfides, mercaptans, and other odor-causingagents in manure storage structures, particularly lagoons. Large amounts of lime are often addedto wastewaters (raising the pH>10) to eliminate odor by reducing microbial activity. Hydrogenperoxide is applied to liquid manure to control sulfides during waste removal and land spreading. Zeolite (a volcanic mineral), cement kiln, and power-plant alkaline by-products are frequentlyused to reduce volatilization and odors.
8-120
Gasification
The fuel produced by gasification is viewed today as an alternative to conventional fuel. Agasification system consists of a gasifier unit, purification system, and energy converters (burnersor internal combustion engine). The gasification process thermochemically converts biomassmaterials (e.g., wood, crop residues, solid waste, animal waste, sewage, food processing waste)into a producer gas containing carbon dioxide, hydrogen, methane and some other inert gases. Mixed with air, the producer gas can be used in gasoline and diesel engines with littlemodification.
Gasification is a complex process best described in stages: drying, pyrolysis, oxidation, andreduction. Biomass fuels have moisture contents ranging from 5 to 35 percent. For efficientoperation of a gasification system, the biomass moisture content must be reduced to less than 1percent. The second stage of the process, pyrolysis, involves the thermal decomposition of thedried biomass fuels in the absence of oxygen. The next stage, oxidation, produces carbondioxide and steam. The last stage, reduction, produces methane and residual ash and unburnedcarbon (char).
Gasification is one of the cleanest, most efficient combustion methods known. It eliminatesdependence on fossil fuel and reduces waste dumping. It extracts many substances, such assulfur and heavy metals, in elemental form. Factors limiting the use of this process includestringent feed size and materials handling requirements. Process efficiency is strongly influencedby the physical properties of the biomass (surface, size, and shape), as well as by moisturecontent, volatile matter, and carbon content (see Pyrolysis below for additional limitations).
Gasification of animal wastes is still in the developmental stages. It is currently considered abetter alternative to incineration for its lower NOx emissions. However, this treatment option islimited to the animal feed operations that have a market in which to sell the excess power or heatgenerated by the gasification unit. Without this advantage, such facilities would be inclined toresort to less expensive waste treatment technologies.
Pyrolysis
Pyrolysis is a major part of the gasification process described above. It is formally defined aschemical decomposition induced in organic material by heat in the absence of oxygen. Pyrolysistransforms organic materials into gaseous components, small quantities of liquid, and a solidresidue (coke or char) containing fixed carbon and ash. Pyrolysis of organic materials producescombustible gases, including carbon monoxide, hydrogen and methane, and other hydrocarbons. If the off-gases are cooled, liquids condense, producing an oil/tar residue and contaminatedwater.
Target contaminant groups for pyrolysis are volatile organic compounds and pesticides. Theprocess is applicable for the separation of organics from refinery wastes, coal tar wastes,wood-treating wastes, creosote-contaminated soils, hydrocarbon-contaminated soils, mixed(radioactive and hazardous) wastes, synthetic rubber processing wastes, and paint waste.
8-121
Economic factors have limited the applicability of pyrolysis to the animal waste managementfield. There are also a number of handling factors that limit applicability. Pyrolysis involvesspecific feed size and materials handling requirements. The technology requires that the biomassbe dried to low moisture content (<1 percent). Slight inconsistencies in moisture content andbiomass properties (both physical and chemical) greatly increase operational costs. Theseconsiderations make it difficult to apply this technology to animal waste. Pyrolysis is noteffective in either destroying or physically separating inorganics from the contaminated medium. Volatile metals may be removed as a result of the higher temperatures associated with theprocess but are not destroyed. Biomass containing heavy metals may require stabilization.
Pyrolysis is still an emerging technology. Although the basic concepts of the process have beenvalidated, the performance data for this technology have not been validated according to methodsapproved by EPA and adhering to EPA quality assurance/quality control standards. Sitecharacterization and treatability studies are essential for further refining and screening of thisprocess. Pyrolysis has been considered for animal waste treatment as part of the gasificationtechnology, but is currently not in high demand because of operation and maintenance costs.
Freeze Drying and Freeze Crystallization or Snowmaking
Freeze drying involves freezing the waste, which causes the solids and liquids to separate. Whenthe frozen sludge melts, the liquid is easily drained away for reprocessing. The remaining sludgeis high in solids, completely stabilized, and capable of being spread on land with conventionalagricultural equipment. The process has proven to lower waste management costs by reducingwaste volume.
Freeze crystallization, or snowmaking, is a treatment process in which wastewater is turned tosnow, thus readily stripping volatile gases from water. Other contaminants are precipitated fromthe water in a process called atomizing freeze-crystallization. Meltwaters may have a nutrientreduction of up to 60 percent, with almost 100 percent of pathogens killed (MacAlpine, 1997).
Both processes are scarcely utilized due to applicability limitations. These processes are suitedonly to colder climates. The freeze drying process requires significant storage capacity, andfacilities must be capable of storing up to 1 year's production of sludge on site.
Practice: Photosynthetic Purification
A proprietary new animal waste treatment technology, Photosynthetic Purification, uses thenutrients in concentrated animal waste to grow algae and photosynthetic bacteria that yield aharvestable crop (Biotechna, 1998). Photosynthetic Purification technology is reported to treathigh-strength, high-moisture waste streams with minimal loss of manure nutrients and generate aclean effluent that can be recycled or safely discharged. The resultant biomass can be used as ahigh protein animal feed supplement. Nutritional value of the biomass is at least equivalent tothat of soy protein. Along with producing a valuable biomass, the main advantage of thistechnology is that it reduces the potential environmental impact of land application or discharge
8-122
of animal waste in regions with concentrated animal feeding operations. A possible disadvantageis that animal waste will need to be transported to a processing facility.
The technology has been under development by Biotechna Environmental (2000) Corporation(BE2000) since the early 1990s. Successful tests are reported to have been carried out at pilotscale in Ireland (1994-95) and Connecticut, USA (1998). A laboratory-scale system and a full-scale commercial demonstration plant are planned. Photosynthetic Purification produces high-protein feed supplements and a range of other value added products for the feed and nonfoodmarkets. Because of proprietary information and patent pending status, little information on thistechnology is currently available to the public.
Deep Stacking of Poultry Litter
Research dating back to the 1960s (Bhattacharya and Fontenot, 1965) has shown that poultrylitter has significant nutritive value as a feedstuff for ruminants. Subsequently, concerns aboutthe potential public health impacts of using poultry litter as well as other animal manures asfeedstuffs emerged. The presence and impact of pathogens, such as species of Salmonella andClostridium, in manures being used as feedstuffs was one of these concerns. There have been anumber of reports from foreign countries of botulism in animals fed diets containing animalwastes (Fontenot et al., 1996).
For poultry litter, the response to this concern about potential pathogen transmission was thedevelopment of the practice known as deep or dry stacking (McCaskey, 1995). It consists simplyof piling litter in a conical pile or stack after it is removed from a poultry house and raises intemperature to a maximum of 140 (F (60 (C) by microbes. Litter with a moisture contentexceeding 25 percent may reach temperatures above 140 (F if not covered to exclude air.
McCaskey et al. (1990) have shown that higher temperatures produce a material with a “charred”appearance and reduced nutritive value. They reported that excessively heated litter has about 50percent of the dry matter digestibility of litter that has not been excessively heated. This estimatewas based on the percentage of litter dry matter solubilized in rumen fluid after 48 hours. Also,it was observed that the amount of N bound to acid detergent fiber and considered not availableapproximately tripled in overheated litter.
The practice of deep stacking of poultry litter enhances its value as a feedstuff for ruminants byreducing concern about possible pathogen transmission. However, deep stacked poultry littercannot be considered pathogen-free because the stacked litter is not mixed out of concern thatreaeration will create the potential for excessive heating. Thus, outer regions of the deep stackedlitter might not reach the temperatures necessary for pathogen destruction. In reality, deepstacking is composting in which oxygen availability limits the temperature and the degree towhich dry matter (volatile solids) are destroyed.
When deep stacking is done in a roofed structure such as a litter storage shed or in covered piles,the potential water quality impacts are essentially nil; however, deep stacking in uncovered pilescreates the potential for leaching and runoff losses of nutrients, oxygen-demanding organics, and
8-123
pathogens, as well as producing a feedstuff with reduced nutritive value. Because of the heatgenerated, some ammonia volatilization is unavoidable, but is probably no greater than the lossesassociated with land application. With proper management, odor is not a significant problem.
The impact of deep stacking on land application for litter disposal is a direct function of theability to market poultry litter as a feedstuff. If such a market exists, on-site land applicationrequirements are reduced or become unnecessary; however, the impact on a larger scale is lessclear. Although the utilization of litter N by ruminants can be relatively high, much of the litter Pconsumed will probably be excreted. Thus, typical values for the P content of beef cattle manuremight not be appropriate for developing nutrient management plans for beef operations that feedsignificant quantities of broiler litter. Also, total manure production by the beef cattle fed poultrylitter-amended rations may increase, depending on the dry matter digestibility and the ash contentof the litter fed (Martin et al., 1983).
As with the temporary storage of solid poultry manure in a dedicated structure, fire due tospontaneous combustion is a risk associated with deep stacking of poultry litter. Thus, structuredesign to exclude precipitation and routine monitoring of litter temperature are importantoperational factors.
Although reliable data regarding the extent of the use of deep stacking are unavailable, anecdotalevidence indicates that the use of poultry litter as a feedstuff for beef cattle is fairly extensive inregions with significant broiler or turkey and beef cattle production. Thus, it appears reasonableto assume that the use of deep stacking is also fairly extensive.
Practice: The Thermo Master™ process
Thermo Tech™ Technologies, Inc., is a Canadian corporation in the business of converting foodwastes into a high-energy and high-protein animal feed supplement, and converting municipalwastewater treatment sludges into a fertilizer material. The company has constructed severalorganic waste conversion facilities, known as “Thermo Master™ Plants,” that employ thecompany’s proprietary microbial organic waste digestion technology. The technology isprotected by U.S. and Canadian patents with patent applications pending in several othercountries.
The Thermo Master™ process was originally developed to create an animal feed supplementfrom relatively high solids content food wastes such as fruit and vegetable processing wastes andwastes of animal origin including meat, dairy, and fish processing wastes. Animal manures andwastewater treatment sludges also were considered for conversion into a fertilizer material. Theprocess has been modified to enable processing of materials with a lower solids content.
In the Thermo Master™ process, autoheated aerobic digestion is operated at the relatively shortresidence time of 30 hours to maximize single-cell protein production using the influent wastematerial as substrate. The effluent from the digestion process is then dried and pelletized.
8-124
The Thermo Master™ process could, in theory, be a viable method for poultry and swine carcassdisposal. In addition to recovering nutrients for use as an animal feed supplement, the absence ofany pollutant discharges is an attractive characteristic of this process. Given that the processoperates at thermophilic temperatures, at least a two- to three-log 10 reduction in pathogendensities should be realized (Martin, 1999). The process, however, has never been used foranimal carcass disposal.
As with rendering, the problems of preserving, collecting, and transporting carcasses could limituse of this disposal alternative. A more significant limitation is the lack of any operating ThermoMaster™ plants in the United States. Only two plants are in operation as of April, 2000, andthey are both located in Canada near Toronto, Ontario. A third, located near Vancouver, BritishColumbia, is being rebuilt following a fire. Even if new plants were to be constructed in theUnited States, it is likely that they would be located in or near major metropolitan areas given thenature of the primary sources of process feedstocks. This would exacerbate the problem ofcarcass transportation.
8.2.3.2 Mortality Management
Improper disposal of dead animals at AFOs can result in ground water contamination and healthrisks. Most mortality management is accomplished through rendering of the dead animals.Rendering involves heating carcass material to extract proteins, fats, and other animalcomponents to be used for meat, bone, and meal. Beef and dairy operations handle mortalitymanagement almost exclusively through rendering operations. In most instances the renderingoperation will pick up the dead animals, resulting in no environmental impact on the operation. For this reason, the remainder of this section focuses on swine and poultry mortalitymanagement, and it will cover rendering, composting, and incineration.
Mortality Management: Swine
Large swine operations must dispose of significant numbers of dead pigs on a daily basis. Forexample, a 1,000 sow farrow-to-wean operation with an average of 22 piglets per litter and apre-wean mortality rate of 12 percent will generate almost 16 tons of piglet carcasses per year,assuming an average weight of 6 pounds per carcass. Assuming an average sow weight of 425pounds and a sow mortality rate of 7 percent per year, the total carcass disposal requirement increases to over 30 tons per year.
Improper disposal of swine carcasses can lead to surface or ground water contamination, or both,as well as noxious odors and the potential for disease transmission by scavengers and vermin. Historically, burial was the most common method of carcass disposal. Burial has beenprohibited in many states, largely because of concerns regarding ground water contamination. The following subsections briefly describe and discuss the principal alternatives to burial forswine carcass disposal: composting, incineration, and rendering.
8-125
Practice: Composting
Description: Composting is the controlled decomposition or stabilization of organic matter(Gotaas, 1956). The process may be aerobic or anaerobic. If the composting mass is aerobicand suitably insulated, the energy released in the oxidation of organic carbon to carbon dioxideand water will produce a fairly rapid increase in the temperature of the composting mass. Withsuitable insulation, thermophilic temperature levels will be reached. The higher temperatureincreases the rate of microbial activity and results in quicker stabilization. Under anaerobicconditions, the rate of biological heat production is lower because fermentation generates lessheat than oxidation, so the temperature increase in the composting mass is less rapid.Thermophilic temperature levels can still be attained with suitable insulation; however, the ratewill be slower.
Application and Performance: Composting is a suitable method of carcass disposal for all swineoperations. The compost produced can be spread on site if adequate land is available. Anotherrecently cited disposal option for the compost is distribution or marketing as an organic fertilizermaterial or soil amendment. Thorough curing to preclude development of odor or verminproblems and screening to remove bones are necessary to make marketing a viable option. Another requirement for composting as a method of swine carcass disposal is the availability of areadily biodegradable source of organic carbon, such as sawdust, wood shavings, or straw. When carcass composting is managed correctly, potential negative impacts on water and airquality are essentially nonexistent, assuming proper disposal of the finished compost.Mismanagement, however, can lead to seepage from the composting mass. This seepage hashigh concentrations of oxygen-demanding organics, N, and P; is a source of noxious odors; andattracts vermin.
Advantages and Limitations: One of the advantages of swine carcass composting is therelatively low capital cost of the necessary infrastructure. Depending on the volume of carcassesgenerated daily, one or more of a series of two composting bins are required. These bins shouldbe located on a concrete pad in an open or partially enclosed shed-like structure. Critical to thiscapital cost advantage is the availability of a skid-steer or tractor-mounted front-end loader forhandling materials. Federal and, in some instances, state cost sharing has been used to encouragethe construction and use of swine mortality composting facilities.
A recent comparison of carcass composting and incineration for disposal of poultry mortalitiessuggests that the lower capital cost of carcass composting is offset by higher labor costs(Wineland et al., 1998). The development of more fuel-efficient incinerators has madeincineration more cost competitive in recent years.
While the temperatures that can be attained in a mass of composting carcasses (130 to 150 (F)will result in significant reductions in pathogen densities, finished swine mortality compostcannot be considered pathogen-free. Therefore, appropriate biosecurity measures are necessaryin the handling and ultimate disposal of the finished compost. Collection of carcasses by
8-126
renderers presents a higher biosecurity risk, especially the risk of introducing disease from otheroperations. In contrast, the ash from carcass incineration is sterile.
Carcass composting in the swine industry appears to be best suited for the disposal of pre-weanand nursery mortalities because of the relatively small size of these carcasses. For larger animals(sows, gilts, boars, and feeder pigs), at least partial carcass dismemberment, an unpleasant task,is necessary.
Operational Factors: In the composting of swine mortalities, a single layer of carcasses orcarcass parts is placed on a layer of the carbon source and finished compost or manure, followedby another layer of the carbon source and finished compost, and then carcasses. The pattern isrepeated until a height of about 5 feet is reached. The pile is capped with a carbon source. Inadequate moisture will retard decomposition, whereas too much moisture will result inanaerobic conditions and process failure.
A proper facility is critical to the success of composting swine carcasses. As noted above, one ormore of a series of two composting bins are required depending on the daily volume of carcassesgenerated. To maximize the rate of carcass decomposition and also to ensure completedecomposition of soft tissue, the composting mass should be transferred to a second bin afterabout 2 weeks of decomposition. This transfer process results in both mixing and aeration of thecomposting mass. Following an additional 2 weeks, the compost should be ready for storage andcuring or ultimate disposal. While satisfactory decomposition can be realized without transferand mixing, the time required is significantly longer.
Also critical to the success of composting swine carcasses is the initial combination of carcasses,a source of biodegradable carbon such as sawdust or chopped straw, a source of adaptedmicroorganisms, and moisture. Although some cooperative extension publications recommendusing manure as the source of an adapted microbial population, finished compost is equallysuitable (Martin and Barczewski, 1996). The ratio, on a volume basis, of these ingredientsshould be 1 part carcasses, 1.5 parts of the carbon source, 0.5 to 0.75 part finished compost, and0 to 0.5 part water. The objective is to create an initial C to N ratio of 20:1 to 30:1.
Demonstration Status: The first use of composting for animal carcass disposal occurred in thepoultry industry during the 1980s (Murphy, 1988; Murphy and Handwerker, 1988). Since thattime, this method of carcass disposal has also been adopted by the swine industry. It wasestimated that 10.5 percent of swine operations use composting for mortality disposal (USDAAPHIS, 1995).
Practice: Incineration
Description: Incineration or cremation is the reduction of swine carcasses to ash by burning at ahigh temperature under controlled conditions using specially designed equipment. Incinerationtemperatures can be as high as 3,500 (F, depending on equipment design. Incinerators usingnatural gas, propane, or No. 2 distillate fuel oil as a fuel are available.
8-127
Application and Performance: Incineration of swine carcasses is applicable to all operationswhere the cost of the equipment required can be justified by the volume of carcasses generated.
The potential for surface or ground water contamination associated with incineration is minimal,provided that liquid fuel tanks are contained properly and residual ash is disposed of properly. The P, K, and other elements contained in the carcasses are concentrated in the ash. Because ofthe high temperature of incineration, this ash is pathogen-free if cross-contamination withcarcasses is avoided.
Odors and other air quality concerns led to a significant decline in carcass incineration in thepast. Newly designed equipment, however, incorporates secondary combustion of stack gases,essentially eliminating these problems. Yet the emission of low levels of some air pollutants isunavoidable, as with any combustion process. Improper operation of the incinerator (e.g.,reducing process temperature by overloading) can result in unacceptably high air pollutantemissions.
Advantages and Limitations: One of the more attractive aspects of incineration relative to otherswine carcass disposal options, such as composting and rendering, is the complete destruction ofpathogens. Another advantage is the relatively small mass of residual material (ash) requiringsome form of ultimate disposal, especially in comparison with composting. Moreover,incineration has a relatively low labor requirement.
The principal perceived limitation of incineration is cost. The initial investment required isrelatively high. A recent comparison of incineration and composting costs for poultry carcassdisposal, however, suggests that the former has become cost competitive with the latter becauseof lower labor costs and improvements in incinerator fuel efficiency (Wineland et al., 1998).
Another limitation of incineration for swine carcass disposal is fixed capacity. This can beproblematic when disease or other factors such as heat stresses cause a sizable increase in the rateof mortality.
Operational Factors: Because of the fixed capacity of incineration equipment, incineration ofswine carcasses must occur on a regular basis. Ideally, carcass incineration should occur at leaston a daily basis to minimize the potential for disease transmission. Routine maintenance ofincineration equipment is also important to ensure reliability and minimize emission of airpollutants. An air pollutant emissions permit, a siting permit, or both, may be required for an incinerator.
Demonstration Status: Incineration has been used in the swine industry as a method of carcassdisposal for many years. With recent technological advances in incinerator fuel efficiency andodor control, a reversal in the shift away from incineration and to other carcass disposal options,such as composting, may occur. It was estimated that 12.5 percent of swine operations useincineration, described as burning, for mortality disposal (USDA APHIS, 1995).
8-128
Practice: Rendering
Description: Rendering is the process of separating animal fats and proteins, usually by cooking. The recovered proteins are used almost exclusively as animal feedstuffs, while the recovered fatsare used both industrially and in animal feeds.
There are two principal methods of rendering (Ensminger and Olentine, 1978). The first andolder method uses steam under pressure in large closed tanks. A newer and more efficientmethod is dry rendering, in which all of the material is cooked in its own fat by dry heat in opensteam-jacketed drums until the moisture has been evaporated. One advantage of dry rendering isthe elimination of a separate step to evaporate the moisture in the material being rendered. Cooking temperatures range from 240 to 290 (F. Rendering can be a batch or a continuous flowprocess.
The two basic protein feedstuffs derived from rendering are meat meal and meat and bone meal. The basis for this differentiation is P content (National Academy of Sciences, 1971). Meat mealcontains a maximum of 4.4 percent P on an as-fed basis. Meat and bone meal contains aminimum of 4.4 percent P.
Application and Performance: Most of the animal fat and protein recovered by rendering isderived from meat and poultry processing, but rendering can also be used to recover theseproducts from swine carcasses. The ability to use rendering as a method of swine carcassdisposal depends on the presence of a rendering facility servicing the area. Rendering plants arenot widely distributed and are generally located near meatpacking and poultry processing plants. As the meatpacking and poultry processing industries have consolidated into fewer but largeroperations, a similar pattern of consolidation in the rendering industry has also occurred. Because swine carcasses have minimal monetary value as a raw material for rendering,transportation only over limited distances can be justified economically.
Rendering is a capital-intensive process and requires careful process control to generateacceptable products. In addition, product volume has to be substantial to facilitate marketing. Because on-farm rendering is unlikely to be a viable option for swine carcasses, performancemeasures are not included.
Advantages and Limitations: For swine producers, disposal of mortalities by rendering hasseveral advantages. One is that capital, managerial, and labor requirements are minimal incomparison with other carcass disposal options. A second advantage is the absence of anyresidual material requiring disposal, as is the case with both composting and incineration, albeitto a lesser degree. If carcass volume is adequate to justify daily pickup by the renderer, capital investment for storage is also minimal.
As discussed above, rendering is a feasible option for swine carcass disposal only if the swineproduction operation is located in an area serviced by a rendering plant. Also, not all renderingoperations will accept mortalities, largely because of concerns about pathogens in the finishedproducts.
8-129
Well-managed rendering operations will not accept mortalities more than 24 hours after deathbecause of the onset of decomposition of fats and proteins, adversely affecting the quality of thefinal products. For swine operations that do not generate an adequate volume of carcasses tojustify daily pickup by the renderer, carcass preservation by freezing, for example, is a necessity. While preservation of piglet carcasses by freezing may be justifiable economically, the cost ofpreserving larger animals is probably not justifiable because payment by renderers for carcassesis usually nominal at best. Typically, payment is no more than one to two cents per pound. Payment can be less, or there may even be a charge for removal, depending on transport distance.
Operational Factors: Since renderers usually pick up carcasses, stringent biosecurityprecautions are essential to prevent disease transmission by vehicles and personnel servingseveral swine operations. Ideally, trucks should be disinfected before entering individual farms,and collection personnel should use disposable shoe coverings. Also, necessary carcasspreservation measures should be employed to ensure that the renderer will continue to acceptcarcasses.
Demonstration Status: It was estimated that 32 percent of swine operations use rendering formortality disposal, with 25.1 percent allowing the renderer to enter the operation and 6.9 percentplacing carcasses at the perimeter of the operation for pickup (USDA APHIS, 1995).
Mortality Management: Poultry
Large poultry operations generate significant numbers of dead birds on a daily basis. Forexample, a flock of 50,000 broilers with an average daily mortality of 0.1 percent (4.9 percenttotal mortality) will result in approximately 2.4 tons of carcasses over a 49-day grow-out cycle(Blake et al., 1990). A flock of 100,000 laying hens averaging a 0.5 percent monthly mortality (6percent annual mortality) will generate 11.25 tons of carcasses per year (Wineland et al., 1998). For a flock of 30,000 turkeys averaging 0.5 percent weekly mortality (9 percent total mortality),approximately 13.9 tons of carcasses will require disposal (Blake et al., 1990).
Improper disposal of poultry mortalities can lead to surface or ground water contamination, orboth, as well as noxious odors and the potential for disease transmission by scavengers andvermin. The following subsections briefly describe and discuss the principal alternatives toburial used for dead bird disposal: composting, incineration, and rendering. Burial of dead birdshas been prohibited in many states, principally because of concerns regarding ground water contamination. These alternatives for carcass disposal are also used in the swine industry andhave been described in the previous section. Differences between the two sectors, however, arebriefly noted.
Practice: Composting
Description: The general description of composting presented in the preceding section on swinemortality management also applies to poultry.
8-130
Application and Performance: As with swine, composting as a method of carcass disposal issuitable for all poultry operations. The compost produced can be spread on site if adequate landis available. Another disposal option for the compost is distribution or marketing as an organicfertilizer material or soil amendment. Thorough curing to preclude development of any odor orvermin problems and screening to remove bones are necessary to make marketing of carcasscompost disposal a viable option. Another requirement for composting as a method of poultrycarcass disposal is the availability of a readily biodegradable source of organic carbon such assawdust, wood shavings, or straw.
When poultry carcass composting is managed correctly, potentially negative impacts on waterand air quality are essentially nonexistent, assuming proper disposal of the finished compost. Mismanagement, however, can lead to seepage from the composting mass. This seepage hashigh concentrations of oxygen-demanding organics, N, and P; is a source of noxious odors; andattracts vermin.
Advantages and Limitations: As with swine carcass disposal, one of the advantages of poultrycarcass composting is the relatively low capital cost of the necessary infrastructure, especiallywhen compared with incineration. Depending on the volume of carcasses generated daily, one ormore of a series of two composting bins are required. These bins should be located on a concretepad in an open or partially enclosed shed-like structure. Critical to this capital cost advantage isthe availability of a skid-steer or tractor-mounted front-end loader for handling materials. Federal and, in some instances, state and integrator cost sharing has been used to encourage theconstruction and use of poultry mortality composting facilities.
A recent comparison of carcass composting and incineration for disposal of poultry mortalitiessuggests, however, that the lower capital cost of carcass composting is offset by higher laborcosts (Wineland et al., 1998). The development of more fuel-efficient incinerators has madeincineration more cost competitive in recent years.
While the temperatures that can be attained in a mass of composting carcasses (130 to 150 (F)will result in significant reductions in pathogen densities, finished poultry mortality compostcannot be considered pathogen-free. Therefore, appropriate biosecurity measures are necessaryin the handling and ultimate disposal of the finished compost. Collection of carcasses byrenderers presents a higher biosecurity risk, especially the risk of introducing disease from otheroperations. In contrast, the ash from carcass incineration is sterile.
Operational Factors: In the composting of poultry mortalities, a single layer of carcasses isplaced on a layer of the carbon source and finished compost or litter, followed by another layer ofthe carbon source and finished compost, and then carcasses. The pattern is repeated until aheight of about 5 feet is reached. The pile is capped with a carbon source. Inadequate moisturewill retard decomposition, while too much moisture will result in anaerobic conditions andprocess failure.
A proper facility is critical to the success of composting poultry carcasses. As noted above, oneor more of a series of two composting bins are required depending on the daily volume of
8-131
carcasses generated. To maximize the rate of carcass decomposition and also to ensure completedecomposition of soft tissue, the composting mass should be transferred to a second bin afterabout 2 weeks of decomposition. This transfer process results in both mixing and aeration of thecomposting mass. Following an additional 2 weeks, the compost should be ready for storage andcuring or ultimate disposal. While satisfactory decomposition can be realized without transferand mixing, the time required increases significantly.
Also critical to the success of composting poultry carcasses is the initial combination ofcarcasses, a source of biodegradable carbon such as sawdust, wood shaving, or chopped straw, asource of adapted microorganisms, and moisture. Although some cooperative extensionpublications recommend using litter or cake as the source of an adapted microbial population,finished compost is equally suitable (Martin and Barczewski, 1996). Martin et al. (1996) have suggested that use of cake be avoided. One recommendation, on a volume basis, is 1 part deadbirds, 1.5 parts straw, 0.5 to 0.75 part litter, and 0 to 0.5 part water (Poultry Water QualityHandbook, 1998). Sawdust or shavings have been used successfully in place of straw. Basically,this same combination of materials is used for swine carcass composting. Again, the objective isto create an initial C to N ratio of 20:1 to 30:1.
Demonstration Status: The first use of composting for animal carcass disposal occurred in thepoultry industry during the 1980s (Murphy, 1988; Murphy and Handwerker, 1988). Currently,composting for disposal of poultry mortalities is readily accepted by producers and usedextensively. In a recent survey of broiler producers on the Delmarva Peninsula, 52.7 percent of562 respondents reported using composting for dead bird disposal (Michel et al., 1996).
Practice: Incineration
Description: The general description of incineration presented in the precedingsection on swinemortality management also applies to poultry. Application and Performance: As with swine, the use of incineration for poultry carcass disposal is applicable to all operations where the cost of the equipment required can be justifiedby the volume of carcasses generated. As with swine carcass incineration, the potential for surface or ground water contaminationassociated with incineration is minimal, provided that liquid fuel tanks are properly containedand residual ash is disposed of properly. The P, potassium, and other elements contained in thecarcasses are concentrated in the ash. Because of the high temperature of incineration, this ash ispathogen-free if cross-contamination with carcasses is avoided.
Odors and other air quality concerns led to a significant decline in carcass incineration in thepast. Newly designed equipment, however, incorporates secondary combustion of stack gases,essentially eliminating these problems. Yet the emission of low levels of some air pollutants isunavoidable, as with any combustion process. Improper operation of the incinerator (e.g.,reducing process temperature by overloading) can result in unacceptably high air pollutantemissions.
8-132
Advantages and Limitations: One of the more attractive aspects of incineration relative to otherpoultry carcass disposal options, such as composting and rendering, is the complete destructionof pathogens. Another advantage is the relatively small mass of residual material (ash) requiringsome form of ultimate disposal, especially in comparison with composting. Moreover,incineration has a relatively low labor requirement.
The principal perceived limitation of incineration is cost. The initial investment required isrelatively high. A recent comparison of incineration and composting costs for poultry carcassdisposal, however, suggests that the former has become cost competitive with the latter becauseof lower labor costs and improvements in incinerator fuel efficiency (Wineland, et al., 1998).
Another limitation of incineration for poultry carcass disposal is fixed capacity. This can beproblematic when disease or other factors such as heat stresses cause a sizable increase in the rateof mortality.
Operational Factors: Because of the fixed capacity of incineration equipment, incineration ofpoultry carcasses must occur on a regular basis. Ideally, carcass incineration should occur atleast on a daily basis to minimize the potential for disease transmission. Routine maintenance ofincineration equipment is also important to ensure reliability and minimize emissions of airpollutants. An air pollutant emissions permit, a siting permit, or both, may be required for anincinerator.
Demonstration Status: Incineration has been used to a limited degree in the poultry industry forcarcass disposal for many years. In recent years, cost and odor problems resulted in a shift awayfrom incineration to more seemingly attractive options such as composting. In a recent survey ofbroiler producers on the Delmarva Peninsula, only 3.3 percent of 562 respondents reported usingincineration for dead bird disposal (Michel et al., 1996). Improvements in fuel efficiency andodor control, however, have renewed interest in this option for carcass disposal.
Practice: Rendering
Description: The general description of rendering presented in the previous section on swinemortality management also applies to poultry.
Application and Performance: As with swine, the ability to use rendering as a method of poultrycarcass disposal depends on the presence of a rendering facility servicing the area. Becauseon-farm rendering is unlikely to be a viable option, performance measures are not included.
Advantages and Limitations: Rendering has the same advantages for poultry producers that it hasfor swine producers: (1) minimal managerial and labor requirements; and (2) the absence of anyresidual material requiring disposal.
Limitations include the need to preserve carcasses, because many operations will not generate asufficient volume of carcasses to justify daily collection by a renderer. Several options havebeen demonstrated to be technically feasible for poultry carcass preservation. They include
8-133
freezing, preservation using organic or mineral acids (Malone et al., 1998; Middleton and Ferket,1998), preservation using sodium hydroxide (Carey et al., 1997), and lactic acid fermentation (Dobbins, 1988; Murphy and Silbert, 1990). All of these preservation strategies increase the costof carcass disposal, and all but freezing increase labor requirements.
Another factor limiting the use of rendering for poultry carcass disposal is the problems thatfeathers create in the rendering process. Feathers absorb the fat separated by rendering and makethe product difficult to handle and market. Feathers also dilute the nutritional and resultingmarket value of poultry by-products meal, especially when used as a feedstuff for nonruminantanimals which cannot digest feathers.
Although feathers can be removed by hydrolysis, cooking at high temperature under pressure,protein quality is degraded. It has been shown, however, that feathers can be removedsuccessfully up to 24 hours postmortem, using a batch scalding and picking system (Webster andFletcher, 1998). Thus, renderers with feather picking equipment can accept significant quantitiesof poultry mortalities without compromising product quality.
Operational Factors: As with swine, stringent biosecurity precautions are essential to preventdisease transmission by vehicles and personnel serving several poultry operations. Moreover,carcass preservation measures are generally necessary.
Demonstration Status: Overall, the use of rendering for disposal of poultry mortalities isminimal because of the necessity of carcass preservation and the problem of feathers describedabove. In a recent survey of broiler producers on the Delmarva Peninsula, none of the 562respondents reported using rendering for dead bird disposal (Michel et al., 1996). One of themajor broiler integrators, however, is currently evaluating the use of rendering after the growerpreserves the carcasses by freezing. The integrator supplies the freezer and the grower pays forthe electricity. Preliminary indications are that the growers are pleased with this approach.
8-134
8.3 Nutrient Management Planning
Nutrient management is a planning tool farmers use to control the amount, source, placement,form, and timing of the application of nutrients and soil amendments (USDA NRCS, 1999). Planning is conducted at the farm level because nutrient requirements vary with such factors asthe type of crop being planted, soil type, climate, and planting season. The primary objective of anutrient management plan is to balance crop nutrient requirements with nutrient availability overthe course of the growing season. By accurately determining crop nutrient requirements, farmersare able to increase crop growth rates and yields while reducing nutrient losses to theenvironment.
Proper land application of manure is dependent on soil chemistry, timing of application, andrecommended guidelines for applying at agronomic rates (the amount of manure or commercialfertilizers needed to provide only the amount of a particular nutrient that will be used by aspecific crop or crop rotation). Manure is an excellent organic fertilizer source and is a soilamendment that benefits a soil’s chemical, physical, and biological properties. The predominantchemical benefit of manure to the soil is the supply of the major plant nutrients—N, P, and K. Inaddition, livestock manure supplies micronutrients and non-nutrient benefits such as organicmatter, which are advantageous to plant growth. The organic matter increases the nutrient- andwater-holding capacity of the soil and improves the physical structure. Finally, manure is asource of food and energy for soil microorganisms, which can directly and indirectly benefit thephysical, chemical, and biological properties of the soil. The combination of these non-nutrientbenefits to soil health has been found to boost corn yields by 7 percent, soybean yields by 8percent, and alfalfa yields by 9 percent (Vetsch, 1999).
In spite of the benefits listed above, repeated applications of manure can cause high levels of N,P, K, and other micronutrients, as well as acidify soils and increase salinity. Excessiveapplication of these nutrients can lead to surface runoff or leaching. Therefore, land applicationof manure, if improperly managed, can contribute to the degradation of surface water and groundwater (Liskey et al., 1992). Excessive amounts of some nutrients in soils can also reduce cropyields (Brown, 1995).
More efficient use of fertilizer, animal manure, and process wastewater can result in higheryields, reduced input requirements, greater profits, and improved environmental protection. It ispossible to further reduce fertilizer expenses and diminish water pollution by employing specificfarming practices that help to reduce nutrient losses from manured fields. The best ways toconserve manure P and K are to apply only the amount of manure needed to meet the crop’snutrient needs and use conservation practices that reduce erosion and runoff from fields. Thisapproach also aids in preventing N losses, but N management must also include proper handling,storage, treatment, and timing of manure application and incorporation into the soil.
8-135
CNMPs and PNPs:
When the sources of nutrients used on a farm include animal manure and process wastewater,manure management planning is incorporated within what is referred to by USDA (and describedin Section 8.3.1) as a comprehensive nutrient management plan or CNMP (USEPA, 1999b). EPA is proposing to require all CAFO operators to develop and implement a Permit NutrientPlan, or PNP. A PNP is a site-specific plan that describes how the operator intends to meet theeffluent discharge limitations and other requirements of the NPDES permit. EPA’s PNP andUSDA’s voluntary CNMP are very similar, and EPA used USDA’s Technical Guidance forDeveloping Comprehensive Nutrient Management Plans as the template for developing the PNP. The PNP, however, establishes specific regulatory requirements that must be followed by CAFOoperators to ensure adequate protection of surface water. The PNP is also narrower in scope thana CNMP since the CNMP guidance addresses certain aspects of CAFO operations that are notincluded as part of EPA’s effluent guidelines and standards. For example, the CNMP guidanceindicates that a CNMP should include insect control activities, disposal of animal medicalwastes, and visual improvement considerations, but EPA’s proposed regulations and PNP do notinclude such requirements.
The proposed PNPs are intended to be living documents that must be updated as circumstanceschange. As the primary planning document for determining appropriate practices at the CAFO,the PNP must be developed and modified by a certified nutrient management specialist. ThePNP is intended to establish the allowable manure application rate for land applying manure andwastewater and to document how the rate was derived. The PNP would also describe other site-specific conditions that could affect manure and wastewater application, sampling techniques tobe used in sampling manure and soils, the calibration of manure application equipment, andoperational procedures for equipment used in the animal production areas.
As discussed in the USDA-EPA Unified National Strategy for Animal Feeding Operations(USEPA, 1999b), site-specific CNMPs may include some or all of the six components describedbelow, based on the operational needs of the facility. Many of the CNMP components describedin the strategy have been addressed in other parts of this document and are cross-referencedbelow. This section focuses on parts of component 2 (Land Application of Manure andWastewater) and component 4 (Record Keeping), however, all six of the CNMP components, asdescribed in the strategy, are presented here to illustrate what a CNMP may contain.
Component 1: Manure and Wastewater Handling and Storage: This portion of a CNMP,addressed more fully in Section 8.2, identifies practices for handling and storing manure toprevent water pollution. Manure and wastewater handling and storage practices should alsoconsider odor and other environmental and public health concerns. Handling and storageconsiderations include the following:
8-136
& Clean water diversion. Siting and management practices should divert clean water fromcontact with feedlots and holding pens, animal manure, or manure storage systems. Clean water can include rain falling on the roofs of facilities, runoff from adjacent land,and other sources.
& Leakage prevention. Construction and maintenance of buildings, collection systems,conveyance systems, and permanent and temporary storage facilities should preventleakage of organic matter, nutrients, and pathogens to ground or surface water.
& Adequate storage. Liquid manure storage systems should safely store the quantity andcontents of animal manure and wastewater produced, contaminated runoff from thefacility, and rainfall. Dry manure, such as that produced in broiler and turkey operations,should be stored in production buildings or storage facilities or otherwise stored in such away as to prevent polluted runoff. The location of manure storage systems shouldconsider proximity to water bodies, floodplains, and other environmentally sensitiveareas.
& Manure treatments. Manure should be handled and treated to reduce the loss of nutrientsto the atmosphere during storage; make the material a more stable fertilizer when appliedto the land; or reduce pathogens, vector attraction, and odors, as appropriate.
& Management of dead animals. Dead animals should be disposed of in a way that does notadversely affect ground or surface water or create public health concerns. Compostingand rendering are common methods used to dispose of dead animals.
Component 2: Land Application of Manure and Wastewater: Land application is the mostcommon, and usually the most desirable, method of using manure and wastewater because of thevalue of the nutrients and organic matter they contain. Land application should be planned toensure that the proper amount of nutrients are applied in a manner that does not adversely affectthe environment or endanger public health. Land application in accordance with the CNMPshould minimize the risk of adverse impacts on water quality and public health. Considerationsfor appropriate land application should include the following:
& Nutrient balance. The primary purpose of nutrient management is to achieve the level ofnutrients (e.g., N and P) required to grow the planned crop by balancing the nutrientsalready in the soil and provided by other sources with those which will be applied inmanure, biosolids, and commercial fertilizer. At a minimum, nutrient management shouldprevent the application of nutrients at rates that will exceed the capacity of the soil andthe planned crops to assimilate nutrients and prevent pollution. Soils, manure, andwastewater should be tested to determine nutrient content.
& Timing and methods of application. Care must be taken when applying manure andwastewater to the land to prevent them from entering streams, other water bodies, orenvironmentally sensitive areas. The timing and methods of application should minimize
8-137
the loss of nutrients to ground or surface water and the loss of N to the atmosphere. Manure and wastewater application equipment should be calibrated to ensure that thequantity of material being applied is what was planned. These topics are discussed inSection 8.4.
Component 3: Site Management: Tillage, crop residue management, grazing management, andother conservation practices should be used to minimize movement to ground and surface waterof soil, organic material, nutrients, and pathogens from lands to which manure and wastewaterare applied. Forest riparian buffers, filter strips, field borders, contour buffer strips, and otherconservation practices should be installed to intercept, store, and use nutrients or other pollutantsthat might migrate from fields to which manure and wastewater are applied. Site management isaddressed in Section 8.4.
Component 4: Record Keeping: CAFO operators should keep records that indicate the quantityof manure produced and how the manure was used, including where, when, and the amount ofnutrients applied. Soil and manure testing should be incorporated into the record keepingsystem. The records should be kept after manure leaves the operation.
Component 5: Other Utilization Options: Where the potential for environmentally sound landapplication is limited, alternative uses of manure, such as sale of manure to other farmers,centralized treatment, composting, sale of compost to other users, and using manure for powergeneration may also be appropriate. Several of these options are described in Section 8.2. Allmanure use options should be designed and implemented in such a way as to reduce risks tohuman health and the environment, and they must comply with all relevant regulations.
Component 6: Feed Management: Animal diets and feed may be modified to reduce the amountsof nutrients in manure. Use of feed management activities, such as phase feeding, amino acid-supplemented low-protein diets, use of low-phytate-phosphorus grain, and enzymes such asphytase or other additives, can reduce the nutrient content of manure, as described in Section 8.1.Reduced inputs and greater assimilation of P by the animal reduce the amount of P excreted andproduce a manure that has a nitrogen-phosphorus ratio closer to that required by crop and forageplants.
Other information that should be part of a nutrient management plan is provided in the USDA-NRCS Nutrient Management Conservation Practice Standard Code 590 (USDA NRCS, 1999); itincludes aerial photographs or site maps; crop rotation information; realistic crop yield goals;sampling results for soil, manure, and so forth; quantification of all nutrient sources; and thecomplete nutrient budget for the crop rotation.
Practice: Developing a Comprehensive Nutrient Management Plan
Description: Effective nutrient management requires a thorough analysis of all the major factorsaffecting field nutrient levels. In general, a CNMP addresses, as necessary and appropriate,manure and wastewater handling and storage, land application of manure and other nutrient
8-138
sources, site management, record keeping, and feed management. CNMPs also address otheroptions for manure use when the potential for environmentally sound land application of manureis limited at the point where the manure is generated.
Nutrient management planning typically involves the use of farm and field maps showingacreage, crops and crop rotations, soils, water bodies, and other field limitations (e.g., sinkholes,shallow soils over fractured bedrock, shallow aquifers). Realistic yield expectations for the cropsto be grown, soil and manure testing results, nutrient analysis of irrigation water and atmosphericdeposition, crop nutrient requirements, timing and application methods for nutrients, andprovisions for the proper calibration and operation of nutrient application equipment are all keyelements of a nutrient management plan.
Application and Performance: CNMPs apply to all farms and all land to which nutrients areapplied. Plans are developed by the grower with assistance, as needed, from qualified companystaff, government agency specialists, and private consultants. To be effective, nutrientmanagement plans must be site-specific and tailored to the soils, landscapes, and management ofthe particular farm (Oldham, 1999).
A wide range of studies has found that implementation of nutrient management plans result inimproved nutrient use efficiency. In some cases, producers increased nutrient applications basedon nutrient budget analyses, but reduced applications of N and P are more common. Forexample, average annual nutrient application rates were reduced by 14 to 129 pounds per acre forN and 0 to 106 pounds per acre for P in 19 USDA projects from 1991 to 1995 (Meals et al.,1996). The introduction of improved fertilizer recommendations in Pennsylvania resulted in a 40percent reduction in N use statewide (Berry and Hargett, 1984). A pilot program on 48 farms inIowa resulted in an average reduction of 9.6 pounds per acre N because of improved nutrientmanagement (Hallberg et al., 1991).
Reductions in field losses of N and P due to implementation of nutrient management plans varyconsiderably, but a comprehensive review of field and modeling studies concluded that loadreductions averaged 15 percent for N and 35 percent for P (Pennsylvania State University, 1992).
In a 6-year study of nutrient management in Pennsylvania, baseflow loads of N and P formsdecreased, but stormflow discharges of total N and total P increased by 14 and 44 percent,respectively (Langland and Fishel, 1996).
Advantages and Limitations: A good nutrient management plan should help growers minimizeadverse environmental impacts and maximize the benefits of using litter and manure. In anational survey of growers of corn, soybeans, wheat, and cotton, more than 80 percent of thosewho had used manure in the Northeast, southern plains, Southeast, and Corn Belt reported thatthey had reduced the amount of fertilizer applied to land receiving manure (MarketingDirections, 1998). Approximately 30 percent of the respondents reported that they had savedmoney through crop nutrient management, while more than 20 percent reported increased yields,about 18 percent claimed reduced fertilizer costs, and approximately 10 percent reported that
8-139
profits had increased and the soil quality had improved. Despite the potential savings, somefarmers are reluctant to develop nutrient management plans because of the cost. Only 4 to 22percent of respondents indicated that they have a nutrient management plan.
Proper crediting and application of hog manure has been reported to save $40 to $50 per acre infertilizer expenses in Iowa (CTIC, 1998a). Similarly, injecting hog manure has resulted insavings of $60 to $80 per acre in Minnesota. Although savings vary from farm to farm, propercrediting and application of manure under a good nutrient management plan can result inconsiderable cost savings for producers.
When animal manure and litter are used as nutrient sources, those activities which affect theavailability and characteristics of such sources need to be factored into the nutrient managementplan. For example, a nutrient management plan in which poultry litter is used as a nutrientsource should take into account the amount of litter to be removed and the time of removal sothat sufficient land is available for proper land application shortly after removal. Alternatively,the plan would need to consider whether storage facilities are available for the quantity ofmaterial that must be handled prior to land application. Whenever possible, litter removal shouldbe planned so that fresh litter, containing the maximum amount of nutrients, can be appliedimmediately to meet crop or forage plant needs.
The CNMP will need to be revisited and possibly revised if the livestock facility increases insize, or if there are changes in animal types, animal waste management, processes, crops, or othersignificant areas.
Nutrient management services are available in the major farming regions, and both low-tech andhigh-tech options, such as precision agriculture, are available to producers. A CNMP is only asgood as the information provided; the extent to which assumptions regarding yield, weather, andsimilar factors prove true; and the extent to which the plan is followed precisely.
Operational Factors: Climate, temperature, and rainfall are all critical factors to be consideredin the development of a nutrient management plan. Since CNMPs are site-specific, therequirements of each CNMP will vary depending on the conditions at each facility.
Demonstration Status: A report on state programs related to AFOs indicates that 27 statesalready require the development and use of waste management plans (USEPA, 1999a). Thecomplexity and details of these plans vary among states, but the plans typically address wastegenerated, application rate, timing, location, nutrient testing, and reporting provisions. Further,industry data and site visits conducted by EPA indicate that practically all CAFOs have someform of management plan in place.
8.3.2 Nutrient Budget Analysis
For animal operations at which land application is the primary method of final disposal, a well-designed nutrient management plan determines the land area required to accept manure at a set
8-140
rate that provides adequate nutrients for plants and avoids overloading soils and endangering theenvironment. The four major steps of this process are as follows:
1. Determine crop yield goals based on site-specific conditions (e.g., soil characteristics).
2. Determine crop nutrient needs based on individual yield goals.
3. Determine nutrients available in manure and from other potential sources (e.g., irrigationwater).
4. Determine nutrients already available in the soil.
These four steps constitute a nutrient budget analysis, which provides the operator with anestimate of how much animal waste can be efficiently applied to agricultural crops so thatnutrient losses are minimized. Various organizations, including Iowa State University (ISU,1995), USDA NRCS (1998b), and USEPA (1999b), have developed guidance on performingnutrient budget analysis. The Iowa State University guidance includes detailed worksheets forestimating nutrient needs versus supply from animal manure and other sources.
8.3.2.1 Crop Yield Goals
Practice: Establishing Crop Yield Goals
Description: Establishing realistic yield goals should be the first step of a nutrient managementplan. The yield goal is the realistic estimate of crop that will be harvested based on the soil andclimate in the area (USDA NRCS, 1995). Realistic yield goals can be determined through thefollowing:
• Historical yield information (Consolidated Farm Service Agency-USDA)
• Soil-based estimates of yield potential (county soil survey books and current soil nutrientcontent reports)
• Farmer’s or owner’s records of past yields
• Yield records from a previous owner
Yield potential is based on soil characteristics and productivity. The soil’s yield potential can beobtained from Soil Survey Reports, county extension agencies, or Natural ResourcesConservation Service (NRCS) offices. As the equation below shows, individual yield goals arecalculated by multiplying the total acreage of a certain soil type by the yield potential of that soil,then dividing that sum by the total acres in the field:
8-141
T ota l A creage Y ie ld P o ten tia l
T o ta l A cres in the F ie ld
( )
( ) _ _ _ _ _ _ bu / acre (Ind iv id ual Y ie ld G oa l)
×= =
Application and Performance: Realistic yield goals apply to all farms and all land to whichnutrients are applied. Yield goals can be developed by the grower with assistance, as needed,from qualified company staff, government agency specialists, and private consultants. To beeffective, yield goals must be site-specific, tailored to the soils on each field.
How well this practice performs depends on both good science and good fortune. Farmers aretypically encouraged to set yield goals 5 to 10 percent above the average yield for the past 5 yearsor so (Hirschi et al., 1997). The intent is allow the farmer to benefit from a good year, while stillreducing waste in the event that an off year occurs. Hirschi reports, however, that a survey offarmers in Nebraska showed that only one in ten reached their yield goals, with a full 40 percentof the farmers falling more than 20 percent below their yield goals.
Estimation of realistic yield goals does not address direct treatment or reduction of anypollutants, but is essential to determining the proper manure and commercial fertilizerapplication rates.
Advantages and Limitations: Reliance on a realistic yield goal is, by its very nature, anadvantage for farmers. The challenge is to establish a yield goal that is truly realistic. Farmerswho rely on their own yield records should use an average from the past 5 to 7 years, recognizingthat it is impossible to foretell growing seasons accurately (Oldham, 1999).
If yield goals are set too high, there is the risk that nutrients will be applied in excess of cropneeds. This translates into increased expense, increased levels of nutrients in the soil, andincreased risk to surface water and ground water (Hirschi et al., 1997). If yield goals are set toolow, the crop yield may be diminished because of a lack of nutrients. Further, if the crop yield islow during a bumper crop year, the producer risks a substantial loss of profits.
Universities publish yield goal information for use by farmers in all states, providing a readysource of information in the absence of better, site-specific records. In addition, seed suppliershave yield information that can be shared with farmers, including the results from local fieldtrials.
Operational Factors: A key challenge in estimating crop yield is determining which historicyield data, industry data, and university recommendations are most appropriate for a given farm. Farmers need to recognize that exceptionally good years are rare (Hirschi et al, 1997). Assumptions regarding the year’s weather are also key, and, because farming is a business, cropprices affect farmers’ estimates of realistic yield as well.
If planting dates are affected by spring weather, yields may suffer, creating the potential foroverapplication of nutrients. Similarly, extended droughts or wet periods may affect yields. Hail
8-142
and other similar weather events can also harm crops, resulting in actual yields that fall short ofeven reasonable yield goals.
Demonstration Status: Estimation of crop yield is a basic feature of farming, although themethods used and accuracy of the estimates vary.
8.3.2.2 Crop Nutrient Needs
Practice: Estimating Crop Nutrient Needs
Description: Crop nutrient needs are the nutrients required by the crop and soil to produce theyield goal. Crop nutrient needs can be calculated for detailed manure nutrient planning. Foranimal feeding operations, N and P are the primary nutrients of concern, and significant researchhas been conducted on specific crop requirements for these nutrients. In some cases, nutrientplanning analyses also evaluate K requirements.
Crop nutrient needs can be estimated by multiplying the realistic yield goal by a local factor foreach nutrient-crop combination. For example, N factors for corn are provided for three regionsin Iowa (USDA NRCS, 1995). If the yield goal is 125 bushels per acre and the N factor is 0.90,the N need for corn is 112.5 pounds per acre (125 x 0.90).
Application and Performance: Estimation of crop nutrient needs is a practice that applies to allfarms and all land to which nutrients are applied. These estimates can be developed by thegrower with assistance, as needed, from qualified company staff, government agency specialists,and private consultants. Nutrient uptake and removal data for common crops are available fromthe NRCS, the local extension office, and other sources (Oldham, 1999).
The accuracy of this calculation depends on the accuracy of the yield goal and nutrient factors forthe crop. In the case of Iowa corn, for example, N factors vary from 0.90 to 1.22. A farmerpreparing for a good year might add a 10 percent cushion to the yield goal of 125 bushels peracre used above, resulting in a revised yield goal of 137.5 bushels per acre. The N need increasesto 123.75 pounds per acre, an increase of 10 percent as well. If the year turns sour and the yieldis 112.5 bushels per acre (10 percent less), the excess N applied becomes 22.5 pounds per acre(123.75-101.25) instead of 11.25 pounds per acre (112.5-101.25), or 100 percent greater.
Estimation of crop nutrient needs does not address direct treatment or reduction of any pollutants,but is essential to determining the proper manure and commercial fertilizer application rates.
Advantages and Limitations: The determination of N needs should account for any N in theorganic fraction of manure that is not available the first year, any N carryover from previouslegume crops, N carryover from previous manure applications, and any commercial N that willbe applied. The major factors determining the amount and availability of carryover N are thetotal amount of N applied, N uptake in the initial crop, losses to air and water, N concentration,carbon-to-nitrogen ratio, soil temperature, and soil moisture (Wilkinson, 1992).
8-143
In their analysis of nutrient availability from livestock, Lander et al. (USDA NRCS, 1998a)assumed that 70 percent of N applied in manure would be available to the crop. Ammoniavolatilization, nitrate leaching, and runoff losses reduce the amount of available nutrient, and thepercentage available also varies depending on soil temperature, soil moisture, organismavailability, and the presence of other nutrients and essentials. When dry or liquid manure isincorporated immediately following application in the north-central region of the United States,about 50 percent of the N is available to the crop (Hirschi et al., 1997).
In North Carolina, it is estimated that half of the total N in irrigated lagoon liquid and 70 percentof the total N in manure slurries that are incorporated into the soil is available to plants (Barkerand Zublena, 1996). Plant availability coefficients for N range from 25 percent (dry litter orsemisolid manure broadcast without cultivation, and liquid manure slurry irrigated withoutcultivation) to 95 percent (injected liquid manure slurry and lagoon liquid), depending on form ofthe manure and method of application (Barker, 1996). For both P and K, the range is 60 to 80percent, with the higher values for injection of liquid manure slurries and lagoon liquids, andapplication of lagoon liquids through broadcasting or irrigation with cultivation. The lowervalues in the range apply to broadcasting dry litter and semisolid manure with no cultivation. The results from plot studies conducted on Cecil sandy loam in Georgia indicate that carryover Nfrom broiler litter should be factored into nutrient management planning for periods longer than 3years (Wilkinson, 1992).
In Ohio, only about one-third of the organic N in animal manure is available to crops during theyear it is applied (Veenhuizen et al., 1999). The P and K in the manure are available during theyear they are applied, as are the equivalent amounts of fertilizer-grade P and K. Ohio StateUniversity Extension has published tables that show the estimated percentage of residual organicN that will be available in the 10 years after initial application.
In addition to organic N in manure, other sources of N can be significant and are included in thecalculation of N needs:
• Mineralization of soil organic matter• Atmospheric deposition• Residue mineralization• Irrigation water
If appropriate, contributions from these sources should be subtracted from the total amount of Nneeded. A general value for calculating the N mineralized per acre from soil organic matter(SOM) is 40 pounds per year for each 1 percent of SOM. The amount of N from atmosphericdeposition can be as much as 26 pounds per acre per year, but local data should be used for thisestimate. Irrigation additions can be estimated by multiplying the N concentration (in parts permillion) by the quantity of water applied (in acre-inches) by 0.227 (USDA NRCS, 1996a).
As discussed earlier, nutrient planning based on N levels alone could lead to excessive soil Plevels, thereby increasing the potential for P to be transported in runoff and erosion. Soil P levels
8-144
should be determined and compared with crop needs before manure or fertilizer containing P isapplied. This can be accomplished by comparing annual P removal rates based on the type ofcrop planted with the amount of P applied the previous year. As with N, data are available forplant removal rates by specific crop.
Operational Factors: As noted above, the major factors determining the amount and availabilityof carryover N include losses to air and water, soil temperature, and soil moisture (Wilkinson,1992). In addition, mineralization of soil organic matter, atmospheric deposition, residuemineralization, and irrigation water applications are all related to climate, temperature, andrainfall.
Demonstration Status: Estimation of crop nutrient needs is a basic feature of farming. Themethods used vary, however, as does the accuracy of the estimates.
8.3.2.3 Nutrients Available in Manure
Manure is an excellent fertilizer because it contains at least low concentrations of every elementnecessary for plant growth. The most important macronutrients in manure are N, P, and K, all ofwhich come from urine and feces. The chemical composition of manure when it is excreted fromthe animal is determined largely by the following variables:
• Species of animal• Breed• Age • Gender• Genetics • Feed ration composition
The composition of manure at the time it is applied usually varies greatly from that at the time itwas excreted from the animal. The nutrients in manure undergo decomposition at varying ratesinfluenced by the following factors:
• Climate (heat, humidity, wind, and other factors)
• Length of time the manure is stored
• Amount of feed, bedding, and water added to manure before removal from the animalhousing facility
• Type of production facility
• Method of manure handling and storage
• Method and timing of land application
8-145
• Use of manure/pit additives
• Soil characteristics at time of application
• Type of crop to which manure is applied
• Net precipitation/evaporation in storage structure
• Uncontrollable anomalies (e.g., broken water line)
• Ratio of nutrients that have been transformed and/or lost to the atmosphere or soil profile
Given these many factors, it is nearly impossible to predict the nutrient content of manure inevery animal production setting. Several state extension and university publications haveattempted to predict nutrient contents for different species of animals at specific productionphases. These book values are an educated guess at best and vary widely from state to state. It isimperative that livestock producers monitor the nutrient content of their manure on a consistentbasis. Knowing the content of macronutrients in manure is an important step to proper landapplication.
Nitrogen
The total amount of N in manure is excreted in two forms. Urea, which rapidly hydrolyzes toammonia, is the major N component of urine. Organic N, excreted in the feces, is a result ofunutilized feed, microbial growth, and metabolism in the animal.
Total N = NH3 (ammonia) + organic N
The ratio of ammonia to organic N in the manure at the time of excretion is largely dependent onspecies, feed intake, and the other factors discussed above.
Before land application, inorganic N forms can be lost either to the atmosphere or into the soilprofile, decreasing the nutrient value of the manure. Depending on the type of manure- handlingand storage system and other factors described above, variable amounts of organic N can bemineralized to inorganic forms, which then can be lost to the atmosphere or into the soil profile. Nitrogen can be lost from manure in the following three ways:
1. NH3 (ammonia) is volatilized into the atmosphere.
2. NO3 (nitrate, a product of mineralization and nitrification) undergoes denitrification andis released into the atmosphere as N2 (inert N gas).
8-146
3. NO3 (nitrate, a water soluble form of N) is leached and carried down through the soilprofile, where it is unavailable to plants.
Agitation of liquid manure prior to land application is extremely important. Solids will separatefrom still manure. The liquid will largely consist of the mineralized, inorganic forms of N,whereas the solid portions will contain the organic forms of N that are unavailable to plants. Proper agitation suspends the solids and helps ensure that the manure will be a more uniform andpredictable fertilizer.
When manure is applied to land, the N content exists in two major forms, the ratio of which canbe determined only by manure analysis. The amount of N that will be available to fertilize theplant will depend on the method and timing of application. The balance of the N available to theplant will be lost in one of the three ways described above or will remain immobilized in theorganic form. It is generally agreed that 25 to 50 percent of N applied in the organic form willundergo mineralization and become available to plants in the first year. The remaining organic Nwill mineralize and become available in subsequent years.
When manure is applied to the surface of land without incorporation into the soil, much of theinorganic N remains on the surface, is lost, and will never be available to the plant. Volatilization of ammonia is the most significant loss factor and is greatest when dryingconditions (dry, warm, sunny days) dominate. Field estimates of volatilization loss from surface-applied manure range from about 10 to 70 percent of ammonia N applied (CAST, 1996).
When manure is incorporated into the soil, inorganic forms of N available to the plant are placeddirectly into the root zone and volatilization is minimized. The inorganic ammonia/ammonium is either taken up by the plant or converted to nitrate. The nitrate can then be taken up by theplant, denitrified, and released into the atmosphere as N gas, or carried by water through the rootzone. In addition, the organic N fraction has more contact with soil microbes when incorporated,resulting in a greater rate of mineralization.
Phosphorus
The vast majority of P contained in manure is derived from the feces. Only small amounts of Pare present in livestock urine. As with N, the amount of P excreted by an animal depends onseveral factors already discussed.
The introduction of water, bedding, and feed into the manure can affect both the nutrientconcentration and the content of the manure product. Manure handling and storage have littleinfluence on the P concentration. Any loss of P is a result of runoff from feedlots or solidssettling in holding basins, storage tanks, or lagoons. This will not be a loss if it is collected andused later.
Most of the P is present in solid manure. As stated for N, proper agitation resuspends the solidsand makes the manure a more uniform and predictable fertilizer.
8-147
Although method and timing of land application have little direct effect on the transformation ofP to plant-available forms, they greatly influence the potential loss of P through runoff. Estimates of P vary widely (CAST, 1996); however, by current estimates, somewhere near 70percent is available for plant uptake in the first year following manure application (Koelsch,1997).
Potassium
In most species, K is equally present in both urine and feces. Similarly, the amount of K inmanure is fairly constant between liquids and solids and is not influenced by agitation. As withthe other macronutrients, the amount of K excreted by an animal depends on a multitude offactors already discussed.
As with P, the introduction of water, bedding, and feed to the manure can affect both the Kconcentration and the content of the manure product. Manure handling and storage have littleinfluence on the K concentration. Any loss of K is a result of runoff from feedlots or solidssettling in holding basins, storage tanks, or lagoons. This will not be a loss if it is collected andused later.
As for P, the method and timing of land application have little direct effect on the transformationof K to plant-available forms, but they greatly influence the potential loss of K through runoff. Most of the K in manure is in the soluble form and is therefore readily available for plant uptake. Availability is estimated to be about 90 percent (Koelsch, 1997).
Swine Specific Information
Swine excrete approximately 80 percent of the N and P and approximately 90 percent of the K inthe feed ration (Sutton et al., 1996). Swine manure can be handled as a slurry, liquid (with theaddition of wastewater), or solid (with the addition of large amounts of bedding).
Estimates of the nutrient content of swine manure classified by manure handling type andproduction phase are given in Table 8-19. The values were compiled from university, extensionservice, and government agency publications from around the United States. The wide range ofvalues is due to the many factors discussed earlier in this section.Poultry Specific Information
Excreted poultry manure has a moisture content of around 80 percent. It can be handled as aslurry or liquid, or in a dry form with added bedding (referred to as litter). Estimates of thenutrient content of chicken and turkey manure are given in Table 8-20. The values werecompiled from university, extension service, and government agency publications from aroundthe United States. The wide range of values is due to the many factors discussed earlier in thissection.
8-148
Dairy Specific Information
Because of the variety of housing and production options associated with dairies, many dairieshave a combination of solid-, liquid-, and/or semisolid-based handling systems. Milking parlorscommonly generate a large amount of wastewater from frequent flushing and cleaning offacilities and cows. Dry cows are often housed outdoors in open lots, while cows being milkedmay be kept in covered or completely enclosed freestall barns or holding pens.
Estimates of the nutrient content of dairy manure classified by manure handling type are given inTable 8-21. The values were compiled from university, extension service, and governmentagency publications from around the United States. The wide range of values is due to the manyfactors discussed earlier in this section.
8-149
Table 8-19. Swine Manure Nutrient Content Ranges
Source Units Total N NH4 P K
ASAE, 1998 pounds/ton 12.4 6.9 4.3 4.4
USDA NRCS, 1996a (farrow, storage tank under slats) pounds/1,000 gal 29.2 23.3 15.0 23.3
USDA NRCS, 1996a (nursery, storage tank under slats) pounds/1,000 gal 40.0 33.3 13.3 13.3
USDA NRCS, 1996a (grow/finish, storage tank underslats)
—, data not available.a selected for nutrient production calculations throughout this document
8-152
Beef Cattle Specific Information
Most beef cattle are produced in an open-lot setting, but some moderate-sized operations producebeef in confinement. The nutrient content of feedlot manure is extremely difficult to quantifybecause of inconsistency in collection methods and content. Varying amounts of dirt, bedding,and precipitation are mixed with the bedding at different times of the year.
Estimates of the nutrient content of beef manure are given in Table 8-22. The ranges werecompiled from university, extension service, and government agency publications from aroundthe United States. The wide range of values is due to the many factors discussed earlier in thissection.
Practice: Manure Testing
Description: The nutrient composition of manure varies widely among farms because ofdifferences in animal species and management, and manure storage and handling (Busch et al.,2000). The only method available for determining the actual nutrient content of manure for aparticular operation is laboratory analysis. Typical laboratory reports show the moisture contentand percentage of N, P, K, Ca, Mg, and Na, as well as the concentration (parts per million) of Zn,Fe, Cu, Mn (McFarland et al., 1998; USDA NRCS, 1996a). Other information, such as the pHand conductivity for liquid samples, is also provided.
Sampling should be performed as close as possible to the time of land application to limit errorresulting from losses occurring during handling, storage, and application (Schmitt, 1999; Buschet al., 2000; Bonner et al., 1998; Sharpley et al., 1994). The best time to collect a representativemanure sample is during the loading or application process (Schmitt, 1999), but the test resultsfrom such sampling cannot be used to plan the current manure applications. Sampling duringhauling is considered more accurate and safer than sampling at storage structures (Busch et al.,2000). Subsamples should be collected from several loads and then composited into a singlesample. This applies to liquid, solid, or semisolid systems. Because the nutrients in manure arenot distributed evenly between the urine and feces portions, mixing is critical to obtaining arepresentative sample.
Barker and Zublena (1996) recommend that land-applied manure be sampled and analyzed twiceannually for nutrient and mineral content. New sampling should be conducted whenever animalmanagement practices change. For example, if there is a significant change in animal rations oroperation management (e.g., a change in the size or type of animals raised), new sampling shouldbe conducted. If manure is applied several times a year, samples should be taken during theperiod of maximum manure application. For example, if the manure that has accumulated allwinter will be used as a nutrient source, sampling should be done before application in thespring.
NCSU, 1994 (anaerobic lagoon, sludge) pounds/1,000 gal 38.2 25.7 12.1
—, data not available.a selected for nutrient production calculations throughout this document
For systems that are emptied or cleaned out once a year, it is recommended that sampling beconducted each time the manure is applied (Busch et al., 2000). This applies to uncoveredlagoons, pits, basins, and stacking slabs. Manure from under-barn concrete pits or coveredaboveground tanks will not vary as much between applications, unless the type of animal oranother significant factor changes. Systems emptied twice a year or more might differ betweenapplication times, so a fall analysis might not be accurate for planning spring applications.
8-154
Application and Performance: Manure sampling is a practice that applies to all farms and allland on which manure is applied. The farmer or trained consultants can conduct the sampling.
Manure sampling does not address direct treatment or reduction of any pollutants, but is essentialto determining the proper manure and commercial fertilizer application rates.
Advantages and Limitations: Manure analysis is the only way in which the actual nutrient contentcan be determined. Standardized tables of manure nutrient content do not reflect how variablethe true nutrient content can be, but they can be useful in planning facilities and land applicationareas (Hirschi et al., 1997).
Convenient laboratory reports allow farmers to easily determine the pounds per ton of nutrientsin solid manure or pounds per acre-inch in liquid manure (McFarland et al., 1998). Laboratoriesare available at universities in most states, and lists of service providers can be obtained fromcounty offices and the Internet.
Without manure analysis, farmers might buy more commercial fertilizer than is needed or spreadtoo much manure on their fields (USDA NRCS, 1996a). Either practice can result inoverfertilization, which, in turn, can depress crop yields and cut profits. Improper spreading ofmanure also can pollute surface and ground water.
Sampling from manure application equipment is quick, but the test results cannot be used to planthe current year’s manure applications. Sampling before hauling allows use of the test results forthe current year, but retrieving an accurate sample is difficult because the manure is not mixed. Further, there is the danger of falling into manure storage structures.
Operational Factors: Sample collection procedures vary considerably depending on manureform and storage, but all are intended to provide representative samples in a safe and convenientmanner. Homogeneity is the key to simple sampling procedures, but the nutrient content ofmanure usually varies considerably within storage structures and stockpiles. For this reason,agitation of liquid manure and mixing of solid manure are generally recommended prior tosampling. Alternatively, several samples can be taken from different locations and depths withina lagoon, pit, or manure stack. Sampling each of several loads of hauled manure is anotheroption to address spatial variability of manure nutrient content. The process of agitating andloading manure is believed to provide mixing that ensures representative sampling (Busch et al.,2000).
The number of samples to be taken for suitable results depends on the variability of the manuresampled (Busch et al., 2000). One sample may be adequate for agitated liquid slurries andlagoon liquids, whereas three or more samples may be needed for stacked solids. It isrecommended that one sample be taken per poultry house.
8-155
Hirschi et al. (1997) recommend taking solid manure samples from several locations in a manurestack or on a feedlot, mixing them together in a tied, 1-gallon plastic bag, placing that bag insideanother bag, and then freezing the sample before shipping to a laboratory for analysis.Busch et al. (2000) say that 10 to 20 subsamples should be taken from different depths andlocations using a pitchfork or shovel. In Texas, five to seven random subsamples arerecommended (McFarland et al., 1998). The subsamples are placed in a pile and mixed before acomposite sample is taken.
Busch et al. (2000) recommend that samples be taken from the manure in the tank or spreaderbox on its way to the field for application. For solid manure, samples should be collected fromapplication equipment using a pitchfork, shovel, or plastic glove, avoiding large pieces or chunksof bedding. The sample taken to the lab should be a mixture of manure taken from several (5 to10) loads representing the beginning, middle, and end of the application process. Subsamplesshould be mixed thoroughly, prior to filling a sample jar three-fourths full, allowing room for gasexpansion. Jars should be cleaned and sealed in a plastic bag, and samples should be frozenbefore being mailed.
Bonner et al. (1998) suggest that samples can be collected by using catch pans in the field as thematerial is applied to the land. Samples from multiple pans are mixed to form the overallsample, and a 1-liter plastic bottle is filled halfway to allow for gas expansion. Samples shouldbe frozen or kept cold until delivered to a laboratory.
Rather than sampling from the lagoon or pit, samples can be retrieved with a plastic pail or acoffee can on a pole from the top of the spreader or from the bottom unloading port (Busch et al.,2000). Sampling should be done immediately after filling.
Hirschi et al. (1997) recommend agitating or mixing liquid manures prior to sampling unless it ismore practical to take samples from several areas within a lagoon or pit and then mix them. Tosample from lagoons and storage facilities, a plastic container attached to a pole or rod isrecommended (Bonner et al., 1998; McFarland et al., 1998; Busch et al., 2000). Alternatively, a½- or ¾- inch PVC pipe can be pushed into the manure to a depth no closer than 1 foot from thebottom (Busch et al., 2000). The sample can be secured by placing a hand over the top of thepipe and pulling the pipe up. Samples should be taken from 5 to 10 locations around the lagoon,covering several depths to include solids. After mixing the samples in a bucket, a representativesample is then taken to a laboratory for analysis.
Demonstration Status: Manure sampling is practiced widely across the United States, but manyfarmers still do not test manure or employ a N credit from manure when determining commercialfertilizer needs (Stevenson, 1995). A 1995 survey of 1,477 swine producers showed that 92percent of operations had not had their manure tested for nutrients within the past 12 months(USDA APHIS, 1995). Approximately 6 percent had tested their manure for nutrients onceduring the past 12 months, while another 1.5 percent had tested it twice. These findings aresupported by a crop nutrient management survey in which only 2 to 17 percent of respondents in
8-156
various regions stated that they factored manure nutrient values into their nutrient managementplans (Marketing Directions, 1998).
8.3.2.4 Nutrients Available in Soil
A major problem in using organic nutrient sources such as animal waste is that their nutrientcontent is rarely balanced with the specific soil and crop needs. For example, the N: P ratio inapplied manure is usually around 3 or less, whereas the ratio at which crops use nutrientstypically ranges from 5 to 7. Therefore, when manure is applied at rates based solely on Nanalysis and crop need for N, P is applied in excess of crop needs. Because the amounts of Padded in manure exceed the amounts removed by crops, continuous use of manure can result inaccumulations of excess P in the soil, increasing the potential for P to be transported in runoffand erosion (Sharpley et al., 1999).
A recent change of emphasis in nutrient management programs has been to base manureapplication rates on both P and N needs. Different soil types can accommodate different Pconcentrations before experiencing significant P export in runoff. The amount of P that a soilcan hold depends on the availability of binding sites. For example, a clayey soil will tend to beable to retain more P than a sandy soil because clays have a greater surface area and typicallycontain a greater proportion of iron, which has a strong affinity for P. Table 8-23 demonstratesthe variability of the P binding capacity of several soils. Phosphorus bound to soils is primarilyin a particulate form; however, as a soil becomes saturated with P, the finite number of bindingsites will be overwhelmed and P can be released into runoff in a soluble form.
Table 8-23. Maximum P-Fixation Capacity of Several Soils of Varied Clay Contents
Soil Great Group (and series) LocationPercent
clayMaximum P fixation
(mg P/ kg soil)
Evesboro (Quartzipsamment) Maryland 6 125
Kitsap (Xerochrept) Washington 12 453
Matapeake (Hapludult) Maryland 15 465
Newberg (Haploxeroll) Washington 38 905Source: Brady and Weil, 1996.
The concept of a P threshold (TH) has been developed to identify soil P levels at which solublelosses of P in runoff become significant. The recently revised USDA NRCS nutrientmanagement policy (Part 402) addressing organic soil amendments, such as manures, proposesthat for soils with a known P TH the following P manure application rates apply:
& If soil P levels are below 75 percent of the P TH, N-based manure application is allowed.
8-157
& If soil P levels are between 75 percent and 150 percent of the P TH, manure applicationrates should be based on the amount of P estimated to be removed by the crop.
& If soil P levels are between 150 percent and 200 percent of the P TH, manure applicationrates should be based on one-half the amount of the P estimated to be removed by thecrop.
& If soil P levels are greater than twice (200 percent) the P TH, no manure should be addedto the soil.
& When no soil-specific TH data are available, P application should be based on soil P testlevels.
& If the soil P test level is low or medium, the application rate of organic soil amendments(e.g., manure) can be based on the soil’s N content.
& If the soil P level is high, the manure application rate should be based on 1.5 times the Pestimated to be removed by the crop.
& If the soil P level is very high, the manure application rate should be based on the Pestimated to be removed by the crop.
& If the soil P level is excessive, no manure should be applied.
Using this threshold concept, several states are developing P indexes to account for site-specificconditions that influence both soluble P losses and particulate P losses resulting from erosion(Lemunyon and Gilbert, 1993; Sharpley, 1995). This approach would categorize agriculturalfields using a quantitative index that can be helpful in assessing the potential risk of Pcontamination of local water bodies. Manure and fertilizer application programs can then bedeveloped accordingly. For instance, an area prone to P transport, such as a field rich in Plocated on erodible soils adjacent to a reservoir, would receive a high score identifying theimportance of a strict nutrient management program. The economic concerns raised by a P-basedplan may be significant because a larger land area may be required in order to dispose of manurefrom livestock operations.
Practice: Soil Testing
Description: Soil testing, an important tool for determining crop nutrient needs, evaluates thefertility of the soil to determine the basic amounts of fertilizer and lime to apply (USDA NRCS,1996a). Soil tests should be conducted to determine the optimum nutrient application of N andP, pH, and organic matter. Typical laboratory reports show soil pH, P, K, Ca, Mg, Zn, and Mnlevels, plus fertilizer and lime recommendations (USDA NRCS, 1996a). Special analyses fororganic matter, nitrate-N, and soluble salts can be requested.
8-158
The best time to sample soil is after harvest or before fall or spring fertilization. Late summerand fall are best because K test results are most reliable at these times (Hirschi et al., 1997). Theworst time to sample is shortly after the application of lime, commercial fertilizer, or manure, orwhen the soil is extremely wet. Samples are usually composited to determine a generalapplication rate for a specific field or field section. The goal is to obtain a representative view ofthe field conditions. This can be achieved by sampling in areas that have similar soil types, croprotation, tillage type, and past fertility programs. In addition, soil samples should be taken atrandom in a zigzag pattern, making sure to avoid irregularities in the land (e.g., fence lines, verywet areas) to get samples that accurately portray the landscape. Two weaknesses of randomsampling in a zigzag pattern are the assumptions that the composite sample is representative ofthe entire field and that the result of the sampling produces an average value for the field(Pocknee and Boydell, 1995). Samples can be gathered and composited over smaller areas todetermine distinct treatment options. To evaluate the variability of the land, the grid method ofdividing the field into 5-acre plots can also be used. Treatment decisions can be made bybalancing labor requirements, environmental concerns, and economics.
Grid-cell sampling and grid-point sampling are two sampling methods used on farms whereprecision farming is practiced. In grid-cell sampling, an imaginary grid is laid over the samplingarea and soil cores are taken randomly within each cell, bulked, and mixed. A subsample is thentaken from the composite sample for analysis. This approach is considered similar to the randomsampling method, with the exception that the sampled area is divided up into many smaller“fields.” In grid-point sampling, a similar imaginary grid is used, but the soil cores are takenfrom within a small radius of each grid intersection, bulked, mixed, and subsampled for analysis. Each of these methods has its limitations. Grid-cell sampling is very time-intensive becausemost of the field needs to be covered in the sampling process, whereas grid-point sampling willnot work well unless grid sizes are very small. Thus, both methods tend to be expensive becauseof the labor involved. A newer method, directed sampling, is based on spatial patterns definedby some prior knowledge about a field. Sampled areas are divided into homogeneous soil unitsof varying size. Factors such as field management history, soil maps, soil color, yield maps,topography, and past soil tests are combined and analyzed using a geographic information system(GIS) to determine optimal sampling patterns.
Sampling equipment for grid sampling includes four-wheelers and trucks equipped with globalpositioning system (GPS) capabilities and mechanized sampling arms (Pocknee and Boydell,1995). Costs for custom service range from $7 to $15 per acre, including soil sampling, analysisof standard elements, and mapping.
Recommendations regarding sampling frequency range from once a year to once every 4 years. In Arizona, soil sampling for residual nitrate content analysis is recommended prior to plantingannual crops (Doerge et al., 1991). For sandy soils in North Carolina, sampling is recommendedonce every 2 to 3 years; testing once every 4 years is suitable for silt and clay loam soils (Baird etal., 1997). A minimum frequency of once every 4 years is generally recommended in the centralUnited States (Hirschi et al., 1997). In Mississippi, soil samples should be taken once every 3years or once per crop rotation (Crouse and McCarty, 1998).
8-159
Application and Performance: Soil sampling is a practice that applies to all farms and all land towhich nutrients are applied. The farmer or trained consultants can conduct the sampling.
Soil sampling does not address direct treatment or reduction of any pollutants, but is essential todetermining the proper manure and commercial fertilizer application rates.
Advantages and Limitations: Soil analysis is the only way in which the actual nutrient contentcan be determined. Nitrogen testing has not been consistently reliable because N is highlymobile in soil, but drier parts of the Corn Belt have had some success with both the early springnitrate-N test and the pre-sidedress N test (Hirschi et al., 1997). There is also some evidence thatthe pre-sidedress test is most helpful on soils to which manure has been applied.
A late spring N test ensures that the proper amount of N was applied to the crops. Because thistest is used to make site-specific adjustments of application rates, following therecommendations provided by this test can help achieve expected crop yields. For example,where N is too high, the late spring N test will indicate that additional N application is notneeded by the crop and may contaminate water supplies. Records should be kept andadjustments made to N applications on future crops.
Without soil analysis, farmers might buy more commercial fertilizer than is needed or spread toomuch manure on their fields (USDA NRCS, 1996a). Either practice can result inoverfertilization, which, in turn, can depress crop yields and cut profits. Improper spreading ofmanure also can pollute surface and ground water.
Convenient laboratory reports allow farmers to easily determine the pounds of nutrients per acreof soil (McFarland et al., 1998). Recommendations based on soil testing results are developedusing crop response data from within a state or region with similar soils, cropping systems, andclimate (Sims et al., 1998). For this reason, it is important to send samples to a laboratory that isfamiliar with the crops, soils, and management practices that will be used on the particular farm. The better the information provided to laboratories for each soil sample—such as previousfertilizer use, management plans, and soil series—the greater the potential for receiving a betterrecommendation. Laboratories are available at universities in most states, and lists of serviceproviders can be obtained from county offices and the Internet.
Operational Factors: Soil samples can be taken with a probe, auger, or spade and collected in aclean bucket. Probes and augers are preferred because they provide an equal amount of soil fromeach depth (Crouse and McCarty, 1998). For uniform fields, one sample is satisfactory, but mostfields are not uniform in treatment, slope, soil type, or drainage, and so should be divided intosmall areas of 5 to 10 acres each for sampling (USDA NRCS, 1996a). It is recommended that asoil map be used to guide sampling, and a separate, composite soil sample should be taken foreach distinct kind of land, soil texture, soil organic matter, fertility level, and management unit(Crouse and McCarty, 1998). The samples should be taken from 20 or more places in the field,using a zig-zag pattern (USDA NRCS, 1996a). Samples should not be taken from unusual areassuch as turn rows, old fence rows, old roadbeds, eroded spots, areas where lime or manure have
8-160
been piled, or in the fertilizer band of row crops. A soil auger, soil tube, or spade can be used forsampling at the plow depth for cropland (6 to 8 inches or more) and at 2 to 4 inches for pasture. Samples should be placed in a clean plastic pail, mixed thoroughly with all clods broken up, andthen sent to a laboratory in a 1/2-pint box for analysis.
Recommendations regarding the appropriate field size to be sampled vary somewhat, as shown inTable 8-24.
Table 8-24. Recommended Field Size for Soil Sampling
Location Field Size Comments Source
Arizona 40 acres or less 15-20 subsamples Doerge et al., 1991
Hawaii 2-5 acres 5-10 subsamples Hue et al., 1997
Minnesota 5-20 acres 15-20 subsamples Rosen 1994
North Carolina 20 acres or less 15-20 subsamples Baird et al., 1997
Texas 10-40 acres 10-15 subsamples McFarland et al., 1998
U.S. 20-30 acres 20-25 subsamples Sims et al., 1998
U.S. 5-10 acres 20 or more subsamples USDA NRCS, 1996a
Sampling for the early spring nitrate-N test involves taking soil samples in 1-foot incrementsdown to a depth of 2 to 3 feet in early spring, while the pre-sidedress N test calls for samplingfrom the top 1 foot of soil when corn is 6 to 12 inches tall (Hirschi et al., 1997). Guidelines oninterpretation of early spring nitrate tests vary across states.
Phosphorus soil tests are based on the chemical reactions that control P availability in soils (Simset al., 1998). These reactions vary among soils, so a range of soil tests is available in the UnitedStates, including the Bray P1 (used in the North Central and Midwest Regions), Mehlich 3 (inwidespread use in the United States), Mehlich 1 (Southeast and Mid-Atlantic), Morgan andModified Morgan (Northeast), and Olsen and AB-DTPA (West and Northwest).
Demonstration Status: Soil testing is widely practiced in the United States. In a national surveyof corn, soybeans, wheat, and cotton growers, 32 to 60 percent of respondents said that theyperform soil testing (Marketing Directions, 1998).
8.3.2.5 Manure Application Rates and Land Requirements
Practice: Determining Manure Application Rates and Land Requirements
Description: The final step of a nutrient management analysis is to determine the amount ofmanure that can be applied to field crops to meet crop needs while simultaneously preventingexcessive nutrient losses. This step involves using the information developed in the nutrientbudget analysis to compare crop nutrient requirements with the supply of nutrients provided per
8-161
unit volume of animal waste. Soil testing helps in determining the rates at which manure shouldbe applied by establishing which nutrients are already present in the soil and available to thecrop. Testing manure identifies the amount and types of nutrients it contains and helps to ensurethat nutrients are not overapplied to the land. Depending on the cropping system, differentamounts of nutrients will be required for optimum production. This final analysis allows theoperator to determine how much land acreage is required to apply the animal manure generatedor, conversely, how much manure can be applied to the available acreage. These finalcalculations are illustrated in Figures 8-13 and 8-14.
Figure 8-13 illustrates that two possible strategies for determining the correct agronomicapplication rate of manure are (1) applying enough manure to ensure the proper amount of N isavailable to the crop and (2) applying manure based on desired amounts of P, then addingcommercial N and K to make up the differences in crop needs. Depending on the frequency ofapplication, the first method might increase the risk of oversupplying P and K, therebypotentially adversely affecting soil and water quality (Dick et al., 1999). For this reason, thestrategy requiring the greater land area for spreading is selected in the analysis illustrated byFigure 8-13.
Application and Performance: Determining manure application rates and land requirementsapplies to all farms and all land to which manure is applied. This analysis does not address directtreatment or reduction of any pollutants, but is essential to determining the proper manure andcommercial fertilizer application rates.
Determine land area needed for manure application.Total pounds of usable nutrients available and pounds of nutrients available to plants in eachgallon have been calculated. This information should be used to calculate the number ofacres you need for manure application.
From nitrogen planning:Net usable nitrogen available lbNet nitrogen amount lb N/acre÷Land area needed for spreading nitrogen: = acres
From phosphorus planning:Net usable P2O5 available: lbTotal P2O5 needs: lb P2O5/acre÷Land area needed for spreading P2O5: = acres
Acres required:Greater of the two above values (a or b):
Adapted from Iowa State University, 1995.
Figure 8-13. Example Procedure for Determining Land Needed for Manure Application
8-162
Determine manure volume to apply.
Total annual volume of manure: gal or TLand area required for spreading: acres÷Manure volume used on field: = gal or T/acre
If the field is smaller than the acres calculated above, calculate the manure to apply to thisfield:
Land area in field: acresManure volume to apply : x gal or T/acreManure volume used on field: = gal or T
Determine the number of gallons or tons of manure remaining to be spread:
Total annual volume of manure: gal or TManure volume used on field: – gal or TManure volume remaining: = gal or T
Manure volume remaining: gal or TManure volume to apply : gal or T/acre÷Additional land area for spreading: = acres
Adapted from Iowa State University, 1995.
Figure 8-14. Example Calculations for Determining Manure Application Rate
Advantages and Limitations: Without this analysis, farmers may buy more commercial fertilizerthan is needed or spread too much manure on their fields (USDA NRCS, 1996a). Either practicecan result in overfertilization, which, in turn, can depress crop yields and cut profits. Improperspreading of manure also can pollute surface and ground water.
In cases where there is inadequate land to receive manure generated on the farm, alternativeapproaches to handling the manure, described elsewhere in this document, need to be considered.
Operational Factors: Although the correct manure application rate is determined by soil andmanure nutrient composition, as well as the nutrient requirements for the crop system, furtherconsideration should be given to soil type and timing of application. Attention to these factorsaids in determining which fields are most appropriate for manure application. Before applyingmanure, operators should consider the soil properties for each field. Coarse-textured soils (highsand content) accept higher liquid application rates without runoff because of their increasedpermeability; however, manure should be applied frequently and at low rates throughout thegrowing season because such soils have a low ability to hold nutrients, which creates a potentialfor nitrate leaching (NCSU, 1998). Fall applications of animal manure on coarse-textured soilsare generally not recommended. Fine-textured soils (high clay content) have slow water
8-163
infiltration rates, and therefore application rates of manure should be limited to avoid runoff.Application on soils with high water tables should be limited to avoid nitrate leaching intoground water (Purdue University, 1994).
Demonstration Status: A 1995 survey of 1,477 swine producers showed that 92 percent ofoperations had not had their manure tested for nutrients within the past 12 months (USDAAPHIS, 1995). Approximately 6 percent had tested their manure for nutrients once during thepast 12 months, while another 1.5 percent had tested it twice. These findings are supported by acrop nutrient management survey in which only 2 to 17 percent of respondents in various regionsstated that they factored manure nutrient value into their nutrient management plans (MarketingDirections, 1998). Like manure testing, analysis of land requirements and application rates ispracticed widely across the United States, but many farmers still do not test manure or employ aN credit from manure when determining commercial fertilizer needs (Stevenson, 1995).
8.3.3 Record Keeping
The key to a successful nutrient management system is sound record keeping. Such a record-keeping regime should include the following:
Practice: Record Keeping
Description: Record keeping for a CNMP includes recording manure generation; fieldapplication (amount, rate, method, incorporation); the results and interpretation of manure, soil,and litter analysis; visual inspections of equipment and fields; manure spreader calibrationworksheets; manure application worksheets (nutrient budget analyses); and related informationon a monthly or more frequent basis.
Application and Performance: Record keeping applies to all farms and all land to which nutrientsare applied. Record keeping does not address direct treatment or reduction of any pollutants, butis essential to tracking the results of activities associated with nutrient management.
Advantages and Limitations: Without record keeping, farmers will have little ability todetermine what works and does not work with regard to on-farm nutrient management. Failureto learn from past successes and mistakes may cause farmers to continue in an endless loop ofbuying more commercial fertilizer than is needed, spreading too much manure on their fields, andrealizing smaller profits than would otherwise be obtainable. For example, tracking manuresampling locations, dates, and methods will help establish a firm basis for adjusting samplingfrequencies to provide an accurate assessment of manure nutrient content (Busch et al., 2000).
Record keeping can seem to be nothing but a burden unless tools are provided with whichfarmers can analyze the information for their own benefit. Fortunately, a great number of toolsare currently available from universities and industry to help farmers use their records to makebetter business decisions. For example, MAX (Farming for Maximum Efficiency Program) is a
1Third-party vendor certification programs may include, but are not limited to, (1) the American Society of Agronomy’s certification
programs, including Certified Crop Advisors (CCA) and Certified Professional Agronomists (CPAg), Crop Scientists (CPCSc), and SoilScientists (CPSSc) (2) land grant university certification programs (3) National Alliance of Independent Crop Consultants (NAICC); and (4) state certification programs.
8-164
program designed to help farmers look at their profit margins, rather than just their yields (CTIC,1998b). MAX software is provided to cooperators to help them document their savings.
Operational Factors: Record keeping can be performed using pencil and paper, personalcomputers, portable computers, or GIS-based systems.
Demonstration Status: Record keeping of some form is conducted on all farms as a matter ofbusiness.
8.3.4 Certification of Nutrient Management Planners
Practice: Training and Certification for Nutrient Management Planners
Description: CNMPs should be developed or modified by a certified specialist. Certifiedspecialists are persons who have a demonstrated ability to develop CNMPs in accordance withapplicable USDA and state standards and are certified by USDA or a USDA-sanctionedorganization. Certified specialists would include individuals who have received certificationsthrough a state or local agency, third-party organization approved by NRCS, or NRCS personnel. In addition, USDA develops agreements with third-party vendors similar to the 1998 agreementwith the Certified Crop Advisors (CCAs) and consistent with NRCS standards and specifications(or state standards if more restrictive).1 CCAs provide technical assistance to producers innutrient management, pest management, and residue management. The purpose of using acertified specialist is to ensure that CNMPs are developed, reviewed, and approved by personswho have the appropriate knowledge and expertise to ensure that plans fully and effectivelyaddress the core components of CNMPs, as appropriate and necessary, and that plans areappropriately tailored to the site-specific needs and conditions of the farm. Because of themultidisciplinary nature of CNMPs, it is likely that a range of expertise will be needed to developan effective CNMP (e.g., professional engineer, crop specialist, soil specialist).
Application and Performance: Certification of nutrient management planners applies to all farmsand all land to which nutrients are applied. Farmers may seek certification themselves or chooseto seek assistance from certified professionals when developing their nutrient management plans.
Certification provides no direct treatment or reduction of any pollutants, but is essential toensuring that CNMPs developed and implemented are effective in preventing pollution.
Advantages and Limitations: Without certification, those who develop CNMPs might not havethe skills or knowledge necessary to develop cost-effective plans. This could result in both waterpollution and less-than-optimal farm profits.
8-165
If a producer chooses to attain certification, a time commitment is required, and training andtravel expenses may be incurred. Course fees of $25 and 1 day of time lost are consideredreasonable estimates of costs based on a review of both state training programs for nutrientmanagement and pesticide certification costs provided by various state extension services. Themajor advantage of becoming certified is that the farmer will be able to develop his or her ownCNMPs without the need for outside technical assistance. Certification would ultimately providebenefits with regard to time commitments, convenience, and expense.
Farmers who choose not to obtain certification will need to purchase services from those who arecertified.
Operational Factors: Producers might need to travel within their state to attain certification.
Demonstration Status: Some states already have certification programs in place for nutrientmanagement planning, which can provide an excellent foundation for CNMP certificationprograms. In addition, USDA develops agreements with third-party vendors similar to the 1998agreement with the Certified Crop Advisors (CCAs).
8-166
8.4 Land Application and Field Management
Two important factors that affect nutrient loss are field application timing and applicationmethod.
8.4.1 Application Timing
The longer manure remains in the soil before crops take up its nutrients, the more likely thosenutrients will be lost through volatilization, denitrification, leaching, erosion and surface runoff. Timing of application is extremely important. To minimize nitrogen losses, a good BMP is toapply manure as near as possible to planting time or to the crop growth stage during whichnitrogen is most needed. Because of regional variations in climate, crops grown, soils, and otherfactors, timing considerations vary across regions.
Spring is the best time for land application to conserve the greatest amount of nutrients. Available nutrients are used during the cropping season. Nutrient losses are still possible,however, because the likelihood of wet field conditions may result in export by surface runoff orleaching. Spring applications result in less time for organic decomposition of manure (an issuefor manure with a low percentage of moisture) and the release of some nutrients. Four mainconsiderations often prevent manure application in the spring. First, a livestock producer mightnot have sufficient storage capacity for an entire year of manure and might be forced to apply atmultiple times during the year. Second, time constraints and labor availability for farmers andapplicators during the spring season make it difficult to complete manure application. Third,time constraints are complicated further if there are wet field conditions. Finally, applyingmanure in the spring creates a potential for greater soil compaction which can cause yield loss. Field equipment, such as heavy manure tanks, compacts the soil and can alter soil structure andreduce water movement. Tillage to break up this compaction is not a viable option in reduced-tillcropping systems. Freezing and thawing cycles in winter months lessen the effect of compactioncaused during fall application.
Conversely, fall application usually results in greater nutrient losses (25 to 50 percent totalnitrogen loss) than spring application, especially when the manure is not incorporated into thesoil (MWPS, 1993). These nitrogen losses are a result of ammonia volatilization and conversionto nitrate, which may be lost by denitrification and leaching. Fall applications allow soilmicroorganisms time to more fully decompose manure and release previously unavailablenutrients for the following cropping season. This is especially advantageous for solid manure,which contains high levels of organic matter. When temperatures are below 50 (F, microbialaction of the soil slows and prevents nitrification, thereby immobilizing some of the nutrients. Inthe fall, manure is best applied to fields to be planted in winter grains or cover crops. If wintercrops are not scheduled to be planted, manure should be applied to fields that require nutrients inthe subsequent crop year or have the most existing vegetation or crop residues, or to sod fields tobe plowed the next spring.
8-167
Summer application is suitable for small-grain stubble, noncrop fields, or little-used pastures. Manure can also be applied effectively to pure grass stands or to old legume-grass mixtures, butnot on young stands of legume forage. Summer application allows a farmer or applicator tospread out the workload of a busy spring and fall.
Winter is the least desirable application time, for both nutrient utilization and pollutionprevention. Late fall or winter applications might be desirable because of greater laboravailability and better soil trafficability. Although there may be significant losses of availablenitrogen, the organic nitrogen fraction will still contribute to the plant-available nitrogen pool.The potential for nutrient runoff is an environmental concern for applications that cannot beincorporated, especially during winter. Winter applications of manure should include workingthe manure into the soil either by tillage or by subsurface injection, thereby reducing runoff. Innorthern areas, frozen soil surfaces prevent rain and melting snow from carrying nutrients intothe soil and make incorporation and injection impossible. Where daily winter spreading isnecessary, manure should be applied first to fields that have the least runoff potential. Application on frozen or snow-covered ground should be avoided because of the possibility ofrunoff.
8.4.2 Application Methods
Manure can be handled as a liquid (less than 4 percent solids), semisolid or slurry (4 to 20percent solids), or solid (greater than 20 percent solids). The amount of bedding and waterdilution influence the form, as do the species and production phase of the animals. Consequently, the manure form dictates the way manure will be collected, stored, and finallyapplied to land (MWPS, 1993).
Liquid manure and slurry manure are applied using similar methods, but equipment needs for thetwo manure forms may vary depending on percentage of solids content. Chopper pumps may benecessary to reduce the particle size of bedding or feed. Agitation of liquid manure is extremelyimportant prior to land application. Inadequate agitation results in inconsistent nutrient contentand makes the manure difficult to credit as a valuable fertilizer source. A lack of uniformapplication can also lead to nutrient excesses and deficiencies, yield loss, and increased incidenceof ground and surface water contamination. Furthermore, insufficient agitation can cause abuildup of solids in the storage tank and lead to decreased capacity. A disadvantage to liquidmanure handling systems is that they may require the addition of water for collection of themanure, increasing the amount of material that must be handled and applied.
The liquid-based manure is applied to fields by means of tank wagons, drag-hose systems, or irrigation systems. Tank wagons can either broadcast manure (surface apply) or inject it into thesoil. The method of injection, and the corresponding level of disturbance to the soil surface, isextremely variable. With the proper implement type, disruption to the soil surface and residuecover can be minimal and appropriate for reduced-tillage operations. Depending on the specificimplement chosen, injection is the preferred method in reduced-till or no-till cropping systems.
8-168
Soil incorporation occurs immediately and crop residues are left on the surface to act as a mulch. The amount of exposed soil surface is minimized, resulting in reduced erosion. Injection systemscan reduce odor by 20 to 90 percent (Hanna, 1998). There is less nutrient loss to air anddiminished runoff as well. For injection, a liquid manure spreader or “umbilical” system andequipment to deposit manure below the soil surface are necessary. Injection requires morehorsepower, fuel, and time than broadcasting. Liquid-based manure can also be pumped from atanker or storage facility located adjacent to the field through a long flexible hose. This umbilicalor drag-hose system is feasible for both broadcasting and injecting manure. Irrigation equipmentapplies liquid manure pumped directly from storage (usually lagoons). Wastewater and manurecan be applied by means of sprinkler or surface (flood) irrigation.
Solid manure is broadcast using box-type or open-tank spreaders. Spreader mechanisms includepaddles, flails, and augers. Rate calibration of box spreaders is often difficult, resulting in lessuniform application, difficulty crediting fertilizer values, nutrient excesses and deficienciesresulting in yield loss, and increased potential for ground and surface water contamination.
Surface application, or broadcasting, is defined as the application of manure to land withoutincorporation. Simply applying manure to the soil surface can lead to losses of most of theavailable nitrogen, depending on soil temperature and moisture. Nitrogen is lost throughvolatilization of ammonia gas, denitrification of nitrates, and leaching. Volatilization losses aregreatest with lower humidity and with increases in time, temperature, and wind speed. High-moisture conditions can carry water-soluble nitrates through the soil profile and out of the plantroot zone, potentially causing ground water contamination. University extension servicesgenerally recommend a certain correction factor (Table 8-25). Environmental conditions such astemperature, wind, and humidity influence this factor. Generally, phosphorus and potassiumlosses are negligible, regardless of application method. However, some phosphorus andpotassium is lost through soil erosion and runoff.
Table 8-25. Correction Factors to Account for Nitrogen Volatilization Losses During Land Application of Animal Manure
Application Method Correction Factor
Direct injection 0.98
Broadcast and incorporation within 24 hours 0.95
Broadcast and incorporation after 24 hours 0.80
Broadcast liquid, no incorporation 0.75
Broadcast dry, no incorporation 0.70
Irrigation, no incorporation 0.60Source: Adapted from Iowa State University Extension PM-1811, November 1999.
8-169
Solid and liquid manures can be incorporated into the soil by tillage in a row-crop system. Incorporation increases the amount of nitrogen available for crops by limiting volatilization,denitrification, and surface runoff. Incorporation also reduces odor and encouragesmineralization of organic nitrogen by microbial action in the soil, thereby increasing the amountof nitrogen readily available to the plants. Although incorporation by tillage makes the nutrientsless susceptible to runoff, the resulting reduction in crop residue can increase sediment runoff. Ifmanure nutrients are to be fully used, incorporation should be performed within 12 to 24 hours ofland application.
8.4.3 Manure Application Equipment
Livestock producers and custom manure applicators consider six predominant criteria whenchoosing an application system: (1) the amount of land to be covered/fertilized; (2) the amount ofmanure to be spread; (3) water content and consistency of the manure; (4) the frequency ofapplication and importance of timeliness; (5) soil trafficability; and (6) distance between storageand the field to be treated. The fundamental classes of application equipment are solid wastespreaders, liquid waste tankers, umbilical systems, and liquid waste irrigation systems. Table 8-26 presents the advantages and disadvantages of the different application systems.
Table 8-26. Advantages and Disadvantages of Manure Application Equipment
Common box spreader withaprons, paddles, or hydraulicpush system. Depending on size, can bepulled by as small as a 15-hptractor.
Equipment readily available. Mobile.Equipment relativelyinexpensive.High solids content allowsless total volume to behandled.
Limited capacity. High laborand time requirement. Fairlydifficult to achieve uniformapplication. Significantnutrient loss and odor if notincorporated immediately.Moderate risk of soilcompaction. Unevenapplications when conditionsare windy.
Flailspreader
V-bottom spreader withchains attached to a rotatingshaft to sling the manure outof the top or side of the tank. Can be pulled by 30- to 90-hptractor.
Wide, even application. Spreads solid, frozen, chunky,slurry, semisolid, or beddedmanure. Low maintenancebecause of few moving parts.
Moderate risk of soilcompaction. Higher cost andpower requirements than boxspreader. Significant nutrientloss and odor if notincorporated immediately.Uneven applications whenconditions are windy.
V-bottom spreader with largeauger across bottom ofspreader. Manure spread byimpeller on side.
Wide, even application. Moderate risk of soilcompaction. Higher cost andpower requirements than boxspreader. Significant nutrientloss and odor if notincorporated immediately.Uneven applications whenconditions are windy.
Liquid (Broadcast)Tankspreader
Mounted tank shoots manurein widespread pattern. Can beon one side, both sides, ordirectly behind spreader. Also can have drop hoses.Spreading width of 15 to 25feet. Capacity of 1,000 to5,000 gallons.
Simple to manage. Lesscostly than injectors. Requires less horsepower thaninjectors.
Great nutrient loss and odorpossibilities. Unevenapplications when conditionsare windy. Air contact resultsin some nutrient loss. High risk of soil compaction.
Tractor-pulledflexiblehose(drag-hose)
Manure is pumped from thestorage facility or tanker at theedge of the field through hosepulled by tractor. Tractor-mounted unit consists of pipe,nozzle, and deflector plate. Spread pattern similar to thatof broadcast tank spreader.
Simple design. Relativelyinexpensive. Low powerrequired to pull hose. Lowrisk of soil compaction.
Great nutrient loss and odorpossibilities. Unevenapplications when conditionsare windy. Air contact resultsin some nutrient loss. May be limited by distancefrom storage to fields and byterrain.
Liquid (Injection)Tankspreader
Front- or rear-mounted tank. Soil is opened and manuredeposited below surface byvariable methods. Capacityof 1,000 to 5,000 gallons.
Odor is minimized. Nutrientsnot lost to atmosphere. Nutrients can be placed nearplant’s root zone in a standingcrop. Depending onimplement type, soil surfaceand residue disturbedminimally.
Pulling injectors requiresmore horsepower. Operationdifficult in stony soil. Moreexpensive than broadcasting.High risk of soil compaction.Increased application time ascompared with broadcasting.
Tractor-pulledflexiblehose(drag-hose)
Manure is pumped fromstorage facility or tanker at theedge of the field through hosepulled by tractor and fed intoinjectors. Injectors must belifted from ground to turn. Rigid, swinging pipe onequipment prevents hosedamage by tractor. 150- to 200-hp tractor needed.
Odor controlled duringspreading. Nitrogen retained. Requires less power thantanker injection systems. Low soil compaction risk.
Some manure may be spilledat end of runs. May be limited by distancefrom the storage to fields andby terrain.Increased application time as compared with broadcastingby drag-hose.
Moderate labor requirement.High degree of managementskill needed. Limited toslopes of less than 2%. Maybe limited by distance to field. High odor levels possible. Difficult to control runoff andachieve uniform application. Significant nutrient loss if notincorporated immediately.
Hand-movedsprinklers
Manure transported throughrigid irrigation pipes,including a mainline and oneor more aluminum pipelaterals. One parcel irrigatedat a time. Pipe isdisassembled and moved byhand to next parcel.
Low initial investment. Fewmechanical parts. Low powerrequirement. Adapts to fieldshape. Little soil compaction.Timely manure application.
High labor requirement. Sprinklers can clog. Significant nutrient loss if notincorporated immediately. High odor levels possible. Uneven distribution in windyconditions.
Towlinesprinklers
Manure transported throughrigid irrigation pipes,including a mainline and oneor more aluminum pipe laterals. Oneparcel irrigated at a time. Laterals are stronger and aremoved using a tractor.
Low initial investment. Requires less labor than hand-move sprinklers. Fewmechanical parts. Low powerrequirement. Little soilcompaction. Timely manureapplication.
Not adaptable to irregularfield shapes because of fixedlaterals. Sprinklers can clog. Require tractor lanes fortowing in tall crops. Significant nutrient loss if notincorporated immediately. High odor possible. Unevendistribution in windyconditions.
Stationarybig gun
Manure transported throughrigid irrigation pipes. Singlelarge gun sprays manure in acircle. Must be moved byhand.
Moderate labor requirement. Few mechanical parts. Adaptable to irregular landarea. Requires less pipe thansmall sprinklers. Big nozzleallows spreading of manureswith more solids. Little soilcompaction. Timely manureapplication.
Moderate to high initialinvestment. High powerrequirement. Unevendistribution in windyconditions. Significantnutrient loss if notincorporated immediately. High odor possible.
Towed biggun
Manure transported throughrigid irrigation pipes. Functions like atowline system with thelaterals replaced by a big gun.
Few mechanical parts. Requires less labor than hand-move or stationary gunsystems. Requires less pipethan small sprinklers. Bignozzle allows spreading of manures with more solids. Little soil compaction. Timely manure application.
Moderate to high initialinvestment. High powerrequirement. Unevendistribution in windyconditions. Less adaptable toland area. Requires tractordriving lanes.Significant nutrient loss if notincorporated immediately. High odor possible.
Manure transported throughrigid irrigation pipes. Irrigation gun travels acrossfield, spreading manure insemicircular pattern. Hard orsoft hose types available. Softhose system is less expensive.
Lowest labor requirement ofall sprinkler systems. Bignozzle allows spreading of manures with more solids. Little soil compaction. Lessenergy required than tankspreader. Timely manureapplication.
High initial costs. May belimited by distance to field. Uniform application difficultin very windy conditions. Possibility of high odor levels. Significant nutrient loss if notincorporated immediately. Environmental damage likelyif not supervised. High odorpossible.
Sources: Adapted from MWPS, 1993, and Bartok, 1994.
Practice: Solid Manure Application with Spreaders
Description: Solid and semisolid manure can be applied to land using box, V-bottom, or flailspreaders. Spreaders are either tractor-pulled or mounted on trucks, depending on the loadcapacity. The manure is discharged from the rear, side, or bottom of the spreader with the aid ofpaddles, flails, chains, or augers (MWPS, 1993).
Application and Performance: Solid waste application methods are appropriate for manurecontaining 20 percent or more solids (MWPS, 1993). Spreaders are most appropriate for smalleroperations with frequent manure removal from small areas (USDA NRCS, 1996a).
Advantages and Limitations: Spreaders are relatively inexpensive but have a limited loadcapacity. They require power to operate and, because of the open-air application method, oftenpresent odor problems during and after application. In addition, calibration can be difficult andcreate a problem with uniform application and nutrient crediting. Most spreaders must be filledusing a tractor front-end loader. Smaller spreaders require a greater time investment because ofthe number of return trips to the manure source for refilling. Increasing spreader capacityreduces the time investment but increases the risk of soil compaction. V-box bottom spreaderscan achieve a more uniform application than box spreaders but require more power andinvestment.
Operational Factors: Spreaders are constructed of treated wood or steel and include a plastic orfiberglass interior lining to assist with loading and unloading. The spreaders can rot or rust,depending on the construction material, and tractor front-end loaders can damage the spreaderand lining during loading. To prevent deterioration and damage, operators should load thespreader carefully, clean and lubricate it regularly, and protect it from the weather.
Demonstration Status: Of grower-finisher swine operations that dispose of waste on owned orrented land, 57.8 percent use broadcast/solid spreader methods. Only 13.7 percent of largegrower-finisher operations (marketing more than 10,000 head) use broadcast/solid spreadermethods (USDA APHIS, 1996a).
8-173
On dairy farms with fewer than 100 milk cows, 90.6 percent broadcast manure with a solidspreader. As herd size increases, solid handling is less common. Solid handling is mostcommon in the northeastern and midwestern areas of the United States (USDA APHIS, 1997).
Fewer than 1 in 7 producers with fewer than 100 milk cows incorporates manure into soil within24 hours of application. This ratio increases with herd size to more than one-third of producerswith more than 500 cows incorporating manure into the soil in less than 24 hours (USDAAPHIS, 1997).
Practice: Liquid Manure Application With Tankers
Description: Manure is applied to the soil surface or injected into the soil using spreader pumptankers or vacuum tankers. The spreader pump tanker is composed of a tank and pump mountedon a truck or wagon and requires a separate pump to load the manure. The vacuum tanker ismounted in a similar fashion but includes a pump that both loads and unloads the manure. Tankers usually include an agitating device (either auger or pump type) to keep solids suspended. Chopper pumps may be needed to prevent malfunctions caused by clogging with manure solidsor fibrous material. A gated opening at the rear bottom of the tank either discharges the manureinto a spinner for broadcasting or directs it through hoses to an injection device.
Application and Performance: Tankers are used for spreading slurry and liquid manure with lessthan 10 percent solids. Tankers are appropriate for moderate- to large-sized operations. Thorough agitation prior to and during tanker loading is necessary to limit inconsistency ofmanure.
Tankers using injection systems can decrease runoff by causing minimal soil surface disturbanceand maintaining a residue cover.
Advantages and Limitations: Broadcast tankers use less power and are less expensive thaninjector tankers but result in greater nutrient loss and odor problems. Tankers with injectorsystems decrease the loss of nitrogen and odorous gases to the atmosphere and place nutrientsnear the plant’s root zone where they are needed; furthermore, depending on the specific injectorsystem, there is a significant decrease in disturbance to the soil surface and residue, limiting thepotential for erosion. The weight of both types of tanker spreaders can cause soil compaction.
Operational Factors: Tankers must be cleaned and repaired regularly and should be protectedfrom the weather. Vacuum pumps, moisture traps, pipe couplers, tires, and power shafts must bemaintained regularly. Sand, often used in dairy freestall barns, can cause damage to the pumps. A vacuum tanker used for swine manure typically lasts 10 years (USDA NRCS, 1996a).
Demonstration Status: Slurry surface application is practiced at 46.0 percent of all grower-finisher operations that apply wastes to land, while subsurface injection of slurry is practiced at21.9 percent of these operations (USDA APHIS, 1996a).
8-174
Slurry surface application is practiced at 44.6 percent of dairy farms having more than 200 milkcows. Subsurface slurry application is practiced at only 8.6 percent of dairy operations of thesame size (USDA APHIS, 1997).
Practice: Liquid Manure Application With a Drag-Hose System
Description: The drag-hose system pumps manure from the manure storage tank, or from aportable tank adjacent to the field, through a supply line that can be up to 3 miles long. Thesupply line attaches to a flexible hose that is pulled across the field by a tractor. Manure is fedthrough the hose to applicator implements similar to the types found on tankers. The manure canbe broadcast or injected.
Application and Performance: Drag-hose systems are used for spreading slurry and liquidmanure with less than 10 percent solids. They are appropriate for moderate- to large-sizedoperations. Up to 40 acres of a field can be covered before the hoses must be repositioned. Thorough agitation prior to and during pumping is necessary to limit inconsistency of manure.
Use of certain injection systems can decrease runoff and erosion by causing minimal soil surfacedisturbance and maintaining residue cover.
Advantages and Limitations: The drag-hose system eliminates the need for repeated trips with awagon or tanker to the manure storage site. It takes more initial setup time, but overall it has asmaller fuel and labor requirement than other spreader systems. Another benefit is decreased soilcompaction and decreased road traffic. The weight of the liquid-based manure is dispersed overa much greater surface area and there is less equipment weight.
The person using a drag-hose system must be careful to not cut the line or break the umbilicalcord during manure application.
For application rates under or around 2,000 gallons per acre, a drag-hose may not be practicalbecause a certain amount of pressure is needed to keep the hose from collapsing.
Operational Factors: The application of drag-hose systems is limited by the distance the supplylines can travel, as well as by terrain.
Demonstration Status: Drag-hose systems are becoming increasingly popular as consolidationtakes place in livestock production. It should be noted that the demonstration figures given in thetanker section also pertain to and include swine and dairy operations using the drag-hose systemfor slurry application.
Practice: Liquid Waste Application by Irrigation
Description: Irrigation systems use pipes to transfer liquid manure and wastewater from thecontainment facility (usually a lagoon) to the field. Wastewater can be transferred to the field
8-175
through portable or stationary pipes or through an open ditch with siphon tubes or gated pipe.Manure is applied to the land using either a sprinkler or surface irrigation system.
Sprinkler systems most often used for manure disposal include handmove sprinklers, towlines,and big guns (MWPS, 1993). Surface irrigation systems include border, furrow, corrugation,flood, and gated pipe irrigation (MWPS, 1993). Descriptions of individual irrigation systems areincluded in Table 8-26.
Application and Performance: Irrigation systems are increasingly used by hog operations thatspread over a million gallons of wastewater per year (USDA NRCS, 1996a). Most irrigationsystems can handle manure that contains up to 4 percent solids (MWPS, 1993). Solid separationpractices may be necessary to achieve this level.
Irrigation system selection varies according to the percentage of solids present in the manure, thesize of the operation, the labor and initial investment available, field topography, and crop height. Advantages and Limitations: Irrigation systems minimize soil compaction, labor costs, andequipment needed for large operations, and they spread the manure more quickly than tankspreaders. Also, irrigation makes it possible to move large quantities of manure in a short timeperiod. Finally, irrigation systems can be used to transport water during dry periods, and they areespecially effective if crop irrigation systems are already in place.
However, nitrogen is easily lost to volatilization and denitrification if not incorporated into thesoil. Odor from the wastewater can create a nuisance. Other problems that might alter theviability of the irrigation system include windy conditions that reduce the uniformity of spreadingand increase odor problems off-site, the fact that soils might not be permeable enough to absorbthe rapidly applied liquid, and a crop height that prevents application (MWPS, 1993; USDANRCS, 1996a).
Although irrigation systems can reduce the overall labor cost of large spreading operations, laborcommunication and coordination are needed for initiating, maintaining, and ceasing an irrigationcycle. System operators must agitate manure before and during pumping to keep solids insuspension. Surface irrigation application must be closely monitored to control runoff andapplication uniformity. Pipes must be flushed with clean water after manure is applied to preventclogs. Irrigation pipes are susceptible to breakage and should be regularly inspected.
Operational Factors: Single-nozzle sprinklers perform better where wind is a problem. Also,one large nozzle is less likely to plug than two smaller nozzles with the same flow capacity.
Demonstration Status: Irrigation of swine wastewater is practiced at 12.8 percent of grower-finisher operations which dispose of their waste on owned or rented land. Nearly 80 percent ofgrower-finisher operations with more than 10,000 head use irrigation for land application ofmanure.
8-176
Land application of wastewater by irrigation is also common at large dairy operations; 40.5percent of producers with more than 200 cows used irrigation for manure application.
Practice: Center Pivot Irrigation
Description: Center pivots are a method of precisely irrigating virtually any type of crop (withthe exception of trees) over large areas of land. In a center pivot, an electrically driven lateralassembly extends from a center point where the water is delivered, and the lateral circles aroundthis point, spraying water. A center pivot generally uses 100 to more than 150 pounds ofpressure per square inch (psi) to operate and therefore requires a 30- to 75-horsepower motor.
The center pivot system is constructed mainly of aluminum or galvanized steel and consists ofthe following main components:
Pivot: The central point of the system around which the lateral assembly rotates. Thepivot is positioned on a concrete anchor and contains various controls for operating thesystem, including timing and flow rate. Wastewater from a lagoon, pond, or other storagestructure is pumped to the pivot as the initial step in applying the waste to the land.
Lateral: A pipe and sprinklers that distribute the wastewater across the site as it movesaround the pivot, typically 6 to 10 feet above the ground surface. The lateral extends outfrom the pivot and may consist of one or more spans depending on the site characteristics. A typical span may be from 80 to 250 feet long, whereas the entire lateral may be as longas 2,600 feet.
Tower: A structure located at the end point of each span that provides support for the pipe. Each tower is on wheels and is propelled by either an electrically driven motor, ahydraulic drive wheel, or liquid pressure, which makes it possible for the entire lateral tomove slowly around the pivot.
The center pivot is designed specifically for each facility, based on wastewater volume andcharacteristics, as well as site characteristics such as soil type, parcel geometry, and slope. Thesoil type (i.e., its permeability and infiltration rate) affects the selection of the water sprayingpattern. The soil composition (e.g., porous, tightly packed) affects tire size selection as towhether it allows good traction and flotation. Overall site geometry dictates the location andlayout of the pivots, the length of the laterals, and the length and number of spans and towers.Center pivots can be designed for sites with slopes of up to approximately 15 percent, althoughthis depends on the type of crop cover and methods used to alleviate runoff. Figure 8-15 presentsa schematic of a central pivot irrigation system.
8-177
Figure 8-15. Schematic of a Center Pivot Irrigation System
Application and Performance: Using a center pivot, nutrients in the wastewater, such as nitrogenand phosphorus, can be efficiently applied to the cropland to meet crop needs. With a knownnutrient concentration in the wastewater, the animal waste can be agronomically applied tocropland very precisely by appropriately metering the flow based on crop uptake values. Agronomic application helps reduce runoff of pollutants from cropland and overapplication ofnutrients to the soil.
Center pivot irrigation does not provide wastewater treatment. Nutrients, pathogens, and otherpollutants simply pass through and are distributed by the center pivot.
Operational Factors: According to one manufacturer (Valley Industries), center pivot systemscan be designed to handle wastes containing up to 5 percent solids. Thus, it may be necessary tohave a solids removal step (e.g., settling basin or mechanical separator) prior to wastewaterstorage and subsequent land application. It is also a good practice to flush the pipes with cleanwater following waste application to prevent clogging of pipes and sprinkler nozzles.
Salt accumulation in the soil may be an issue, especially in drier climates. Salt concentrations inthe wastewater and soil should be monitored to determine if salinity is a problem at a particularsite.
8-178
Odor may also be a problem when using a center pivot to apply liquid animal wastewater to theland. However, techniques can be implemented to reduce the dispersion of the waste stream intothe wind, such as positioning the sprinklers closer to the ground, using low trajectory sprinklers,and using low pressure sprinklers. Proper timing of application based on environmentalconditions (i.e, monitoring wind velocity and direction) can also help reduce odor problems.
Application efficiency (i.e., the percentage of the total water pumped that reaches the ground orplant surface) depends primarily on climatic factors such as ambient temperature, relativehumidity, and wind velocity and direction. A typical application efficiency is about 90 percent,provided that at least 1 inch of water is applied.
Advantages and Limitations: As noted above, a center pivot is an effective means of distributingliquid animal waste and supplying nutrients to cropland at agronomic rates. The center pivotdesign is fairly flexible and can be adapted to a wide range of site and wastewater characteristics.Center pivots are also advantageous because they can distribute the wastewater quickly,uniformly, and with minimal soil compaction. Center pivots have low operating labor costscompared with manual application methods.
One limitation of a center pivot system is the relatively high capital investment it entails. Otherlimitations may result from sloped lands, high solids content of waste, and potential odorproblems. Center pivots are also vulnerable to high winds and lightning. Additionally, swinewaste is fairly corrosive so the waste either needs to be treated to reduce its corrosivity or systemcomponents such as piping need to be corrosion-resistant (e.g., galvanized or lined pipe). Another concern with center pivot spraying is nitrogen loss through volatilization, which isestimated to be as high as 25 percent (USDA NRCS, 1996a).
Demonstration Status: Center pivots have been in operation in the United States since the 1950s. In the 1970s, center pivots started to become popular as a means of land-applying wastewaterfrom municipal, industrial, and agricultural sources. Today, center pivots are widely used inagriculture, including land application of wastewater from swine, beef, and dairy facilities.
Practice: Calibration of Application Equipment
Description: Three conditions must be addressed to ensure that application rates are accurate(Schmitt and Rehm, 1998). First, analysis of a properly collected manure sample is needed toquantify nutrient content. Second, the rate of manure being applied to the field must be knownand kept constant; calibration must be conducted for all manure applications. Third, theapplication or spread pattern of the manure must be uniform throughout the field.
Manure spreaders can discharge manure at varying rates, depending on forward travel speed,power take-off speed, gear box settings, discharge opening, width of spread, overlap patterns, andother parameters (USDA NRCS, 1996a). Calibration defines the combination of settings andtravel speed needed to apply manure at a desired rate.
8-179
The actual rate at which a spreader applies manure will differ from the manufacturer’s estimates,so calibration is necessary to ensure accurate manure application (Hirschi et al., 1997). Two basicmethods, the load-area method and weight-area method, can be used for calibration (USDANRCS, 1996a). In the load-area method, the amount of manure in a loaded spreader is measuredand the rate is determined based on the number of loads needed to cover a known area of land. Inthe weight-area method, manure spread over a small surface is weighed, and the weight per unitarea is calculated. Although there are only two basic calibration methods, a variety of specificcalibration procedures are available, many of which require knowledge of the tank’s or spreader’sload size (Hirschi et al., 1997).
For solid systems, the spreader can be weighed before and after going to the field to determine theweight of manure spread (Schmitt and Rehm, 1998). Using the width of the spread manure andthe distance traveled per load, the weight of manure applied per acre can be calculated. Alternatively, the rate per acre can be estimated using the weight of a full load as determined witha scale, the number of loads per field, and the field acreage. A third method is to lay a tarp orsheet of strong plastic in a field and make a pass over it with the spreader. The manure depositedon the tarp or sheet of plastic is then collected and weighed. Using the area of the tarp or plasticsheet, the weight of manure applied per unit area can be determined. Because of the small areainvolved in this method, there is high variability, so multiple samples should be collected. Knowledge of the variability in application rate, however, is useful information when oneconsiders that uniform application is desired.
For liquid systems, calibration requires that the manure be measured in gallons per acre. The bestway to determine the volume applied is to weigh the tank before and after spreading the manureand then to divide by the density of liquid manure (8.3 lb/gallon) (Schmitt and Rehm, 1998). Combining this information with the width of the spread pattern and the distance the tank travelsbefore emptying the tank will provide the data necessary to determine the application rate. Asecond option for liquid systems that does not involve a scale is to fill the tank, count the numberof loads applied uniformly per unit area of field, and then calculate the volume per acre using theknown volume of a filled tank.
Manure application rates must often be adjusted to match the recommended rate (Schmitt andRehm, 1998). The most common method of changing the application rate is to change the speedat which the spreader is driven across the field. Solid manure equipment may also have anadjustment that changes the chain speed in the box, thereby changing the application rate. Liquidmanure application equipment may have valve opening adjustments to alter the rate. Because theflow rate may change from the beginning to the end of a tank of liquid manure, some equipmentuses pressurized tanks, flow pumps, and newer distributor designs to address the problem ofvariable flow. Once equipment is adjusted or driving rates are changed to achieve newapplication rates, recalibration is necessary to maintain the accuracy in calculating applicationrates.
A wide range of water measurement devices is available, including some that primarily measurerate or volume of flow and some that primarily measure rate of flow (USDA NRCS, 1997). A
8-180
suitable measuring device, calibrated in the laboratory or field, can be used to determine totalapplication volume, which, combined with the measured nutrient concentration in the appliedliquid, can be used to determine the quantity of nutrients applied to the receiving land. Dividingthe quantity of nutrients by the land acreage provides the nutrient application rate. Rain gaugescan be used in the field to check the uniformity of application of sprinkler systems.
Application and Performance: Calibration is a practice that applies to all farms and all land onwhich manure is applied, and it can be performed by the producer with little training.
Calibration of manure application equipment provides no direct treatment or reduction of anypollutants, but it is essential to accurate application of manure.
Advantages and Limitations: Calibrating manure applicators helps to ensure that applications areadequate for crop needs, but not excessive and a source of water quality problems (USDA NRCS,1995).
Calibration of spreaders should take less than 1 hour (Hirschi et al., 1997).
Operational Factors: Agitation of liquid manure is extremely important prior to land application. Inadequate agitation results in inconsistent nutrient content and makes the manure difficult tocredit accurately as a valuable fertilizer source. A lack of uniform application can also lead tonutrient excesses and deficiencies, yield loss, and increased incidence of ground and surface watercontamination.
Solid manure is broadcast using box-type or open-tank spreaders. Spreader mechanisms includepaddles, flails, and augers. Rate calibration of box spreaders is often difficult, resulting in lessuniform application, difficulty crediting fertilizer values, nutrient excesses and deficienciesresulting in yield loss, and increased potential for ground and surface water contamination.
Windy conditions can affect the uniformity of applications with sprinklers. System operatorsmust agitate manure before and during pumping to keep solids in suspension. Surface irrigationapplication must be closely monitored to control runoff and application uniformity.
Demonstration Status: Calibration of manure spreaders is a topic that has been addressed intechnical guidance and extension service publications across the United States. Informationregarding the extent to which farmers calibrate manure applicators was not found, but informationregarding the extent to which manure is sampled is probably indicative of the maximum extent towhich calibration is practiced.
Manure sampling is practiced widely across the United States, but many farmers still do not testmanure or employ a nitrogen credit from manure when determining commercial fertilizer needs(Stevenson, 1995). A 1995 survey of 1,477 swine producers showed that 92 percent of operationshad not had their manure tested for nutrients within the past 12 months (USDA NAHMS, 1999). Approximately 6 percent had tested their manure for nutrients once during the past 12 months,
8-181
while another 1.5 percent had tested it twice. These findings are supported by a crop nutrientmanagement survey in which only 2 to 17 percent of respondents in various regions stated thatthey factored manure nutrient value into their nutrient management plans (Marketing Directions,1998).
Practice: Transportation of Waste Off Site
Description: Animals at an animal feeding operation generate a large amount of liquid and semi-solid waste every day. This waste is rich in nutrients and can be applied to cropland as fertilizer.Often, there are more nutrients present in the waste than can be used by the crops on site. In thiscase, or in the case where the operation has no cropland, the waste must be transported off site toa facility that can manage the waste properly.
Application and Performance: At an agronomic application rate, some facilities will be able toapply all produced animal waste to on-site cropland. However, some animal feeding operationsdo not have sufficient land to accommodate all of the waste on site. These facilities musttransport the waste off site using farm equipment or by hiring a contractor to haul the waste away.Hiring a contractor is a viable option for operations that do not have the capital to purchase theirown trucks to haul excess waste.
Transportation does not “treat” the waste; however, it does move the waste off the farm. Bytransporting the waste off site, the operation prevents potential pollution by limiting the time thatwaste remains on the feedlot, and thereby reduces the likelihood of nutrients, pathogens, andother pollutants being carried from the stockpile by rainfall, runoff, seepage, or volatilization.
The cost of transporting waste off site is determined by the quantity and consistency of the wasteas well as the distance the waste must be transported to be managed properly. Semisolid or liquidmanure can be more expensive to haul because it requires a tanker truck for transport and isheavier due to a higher moisture content. Solid waste is easier to handle and is therefore lessexpensive to transport. Because the amount of manure transported off site is dictated by theamount that is applied to on-site cropland, it is expected that facilities will apply semisolid wasteto fields before they apply solid waste. The distance manure must be hauled to be properlymanaged depends on the proximity of crops that need additional nutrients.
Advantages and Limitations: One advantage of transportation as a waste management practice isnot having to treat and dispose of the waste on site. Excess waste at one operation can betransported to and used as fertilizer at another operation, distributing the nutrient load amongcropland at multiple facilities. In addition, in some cases the operation owner is able to sell thewaste to a compost or fertilizer facility or another farm operation. This income can potentiallyoffset the cost of the transportation.
It is important to consider the potential non-water-quality impacts that result from increaseddiesel truck traffic. EPA assumes that some facilities do not currently apply at agronomic rates,and therefore, there will be an increase in excess waste once operations begin applying
8-182
agronomically. This increase in excess waste requires an increase in truck traffic, causing anincrease in exhaust emissions from the trucks transporting the waste.
Operational Factors: There are three operational factors considered in determining transportationpractices: the amount of waste to be transported, type of waste to be transported (semisolid orliquid), and the distance from the operation to the off-site destination. The amount of waste to betransported per year determines the size of the trucks that are required and the time that is spenthauling the waste. The consistency of the waste determines the type of truck that is used and thecost of handling that waste. The distance of the off-site facility from the operation determineshow far the waste must be hauled and the cost of transporting the waste. The regional location ofthe operation also plays a role in determining how frequently the waste needs to be transported(e.g., if there are seasons in which the waste is not applied, due to climate or crop cycles).
Demonstration Status: It is not known what portion of animal feeding operations have their wastehauled by contractors and what portion opt to own and operate their own vehicles. It is assumedthat each operation chooses the most economically beneficial option, which in most cases is tocontract-haul the waste off site.
Beef: Eleven percent of beef feedlots across the country currently sell excess manure waste, and27 percent give away their manure waste. Approximately 3 percent of beef operations currentlypay to have manure waste hauled off site (USDA APHIS, 2000).
Dairy: In 1997, 23 percent of dairies with more than 200 head give away some portion of theirmanure waste, and 18 percent sold or received compensation for their manure waste (USDAAPHIS, 1997).
Poultry: Most poultry operations are currently transporting their waste off site. Nationwide,broiler operations transport about 95 percent of their waste. The percentage of layer operationstransporting waste varies by region: 40 percent in the Central region, 100 percent in the Midwestregion, 75 percent in the Mid-Atlantic region, 95 percent in the Pacific region, and 50 percent inthe South region (USDA NAHMS, 2000).
Swine: Four to six percent of swine operations currently transfer some manure off site (USDAAPHIS 1995), while 23 percent of small swine operations and 54 percent of large swineoperations do not have enough land to apply agronomically under an N-based application scenario(Kellogg et al., 2000).
8.4.4 Runoff Control
Fields to which manure is to be applied should have an appropriate conservation managementsystem in place to prevent nutrients from leaving the landscape. In the event of mismanagedmanure application, such as applying manure prior to an unexpected rainfall, conservationpractices that reduce soil erosion and water runoff, including grassed waterways, sediment basins,and buffers, can help to minimize the transport of nutrients off-site.
8-183
Susceptibility to erosion and the rate at which it occurs depend on land use, geology,geomorphology, climate, soil texture, soil structure, and the nature and density of vegetation inthe area. Soil erosion can be caused by wind or water and involves the detachment of soilparticles, their transport, and their eventual deposition away from their original position. Movement of soil by water occurs in three stages: (1) soil particles, or aggregates, are detachedfrom the soil surface when raindrops splash onto the soil surface or are broken loose by fast-moving water; (2) the detached particles are removed or transported by moving water; and (3) thesoil particles fall out of suspension when the water velocity slows, and are deposited as sedimentat a new site.
Soil erosion caused by water is generally recognized in four different forms: sheet erosion, rillerosion, ephemeral erosion, and gully erosion. Erosion occurs during or immediately afterrainstorms or snowmelt. Sheet erosion is the loss of a uniform, thin layer of soil by raindropsplash or water runoff. The thin layer of topsoil, about the thickness of a dime, disappearsgradually, making soil loss visibly imperceptible until numerous layers are lost.
Rill erosion often occurs in conjunction with sheet erosion and is a process in which numerouschannels, a few inches deep, are formed by fast-flowing surface water. The detachment of soilparticles results from the shear stress that water exerts on the soil. The shear stress is related tothe velocity of water flow. Therefore, when water gains velocity on steeper and longer slopes, rillerosion increases. Sheet and rill erosion carry mostly fine-textured small particles and aggregates. Fine-textured particles contain the bulk of plant-available nutrients, pesticides, and otherabsorbed pollutants because there is more surface area per given volume of soil.
Ephemeral erosion occurs when concentrated water flows through depressions or drainage areas. The water forms shallow channels that can be erased by tillage practices. Ephemeral erosion is aprecursor to gully erosion if left untreated.
Once rills become large enough to restrict vehicular access, they are referred to as gullies. Gullyerosion results from the removal of vast amounts of topsoil and subsoil by fast-flowing surfacewater through depressions or drainage areas. Gully erosion detaches and transports soil particlesthat are the size of fine to medium sand. These larger soil particles often contain a much lowerproportion of absorbed nutrients, organic material, and pollutants than the fine-textured soilparticles from sheet and rill erosion.
It is not practical to prevent all erosion, but the preferred strategy is to reduce erosion losses totolerable rates. In general terms, tolerable soil loss, sometimes referred to as T, is the maximumrate of soil erosion that can occur while still maintaining long-term soil productivity. Thesetolerable soil loss levels determined by USDA NRCS are based on soil depth and texture, parentmaterial, productivity, and previous erosion rates. The levels range from 1 to 5 tons/acre/year (2to 11 metric tons/hectare/year). The strategies for controlling erosion involve reducing soildetachment and reducing sediment transport.
8-184
Surface water runoff contains pollutants, including nutrients (e.g., nitrogen and phosphorous) andsome pathogens. Excessive manure application can cause increased nitrate concentration inwater. If the rate of manure application exceeds plant or crop nitrogen needs, nitrates may leachthrough the soil and into ground water. Nitrates in drinking water are the cause ofmethemoglobinemia (“blue baby syndrome”).
Agricultural nonpoint source pollutants, such as those contained in manure, can migrate off thefield and into surface water through soil erosion. Excessive nutrients attached to the sedimentand carried into surface water bodies can cause algae blooms, fish kills, and odors. Combinationsof BMPs can be used to protect surface water by reducing the amount of nutrient-rich sedimentthat is detached and transported away from a field.
A BMP is a practical, affordable strategy for conserving soil and water resources withoutsacrificing profitability. BMPs that reduce soil erosion are part of a broader integrated soilmanagement system that improves overall soil health and water quality. In addition, BMPsbenefit crop production in a variety of ways, such as improved drainage, improved moisture-holding capacity, pest management, and ultimately, long-term profitability.
Runoff Control Practices
Livestock manure can be a resource if managed correctly. A large proportion of livestock manureis returned to the land as organic fertilizer. Unfortunately, if manure is handled incorrectly, it canbecome a source of pollution that ends up in streams or lakes. The nutrients in animal manure,especially phosphorus and nitrogen, can cause eutrophication of water.
Eutrophication is a natural process that takes place in all surface water bodies. The naturalprocess is accelerated by increased sediment and nutrient loading in the water. It is characterizedby an aquatic environment rich in nutrients and prolific plant production (algae). As a result ofnutrient enrichment, the biomass of the water body increases and eventually produces a noxiousenvironment that accelerates algae growth, leading to a reduction in water quality.
The transport of manure nutrients to streams and lakes is very similar to the transport of nutrientsfrom commercial fertilizers. Nitrogen is water-soluble and moves largely with the flow of water. Injecting or incorporating manure into the land however, significantly reduces the amount ofnitrogen transported with runoff. Yet nitrogen can still move with ground water or subsurfacewater flow.
Reducing phosphorous levels in surface water is the best way to limit algae growth. Most of thephosphorous transported by surface water is attached to sediment particles. Therefore, reducingsoil erosion is essential to protecting water quality.
Manure from properly managed grazing animals has little detrimental effect on water quality. Ina grazing system, 100 percent of the manure generated by the grazing animal is applied to the landdaily. In addition, the runoff from a well-managed grazing system carries very little sediment or
8-185
nutrients; however, manure from feedlots or overgrazed pastures is more susceptible to runoff andsediment delivery (Hatfield, 1998).
Practices to Reduce Soil Detachment
The most effective strategy for keeping soil on the field is to reduce soil detachment. Cropcanopy and crop residue on the soil surface protect against soil detachment by intercepting fallingraindrops and dissipating their energy. In addition, a layer of plant material on the ground createsa thick layer of still air next to the soil to buffer against wind erosion. Keeping sufficient coveron the soil is therefore a key factor to controlling both wind and soil erosion.
Conservation practices, such as no-tillage, preserve or increase organic matter and soil structure. No-tillage reduces soil detachment and transport and results in improved water infiltration andsurface stability. No-tillage also increases the size of soil aggregates, thereby reducing thepotential of wind to detach soil particles.
Combinations of the following practices can be used to effectively reduce soil detachment bywind or water erosion:
• Conservation tillage (including mulch-tillage, no-tillage, strip-tillage, and ridge-tillage)• Cover crops• Contour stripcropping/contour buffer strips• Crosswind trap strips• Crosswind ridges• Crosswind stripcropping• Crop rotation, including small grains, grasses, and forage legumes• Chemical fallow or no fallow• Grassed waterways• Pasture management• Shelterbelts/field windbreaks
Practices to Reduce Transport Within the Field
Sediment transport can be reduced in several ways, including the use of vegetative cover, cropresidue, and barriers. Vegetation slows runoff, increases infiltration, reduces wind velocity, andtraps sediment. Strips of permanent vegetation (e.g., contour strip cropping and contour grassstrips) slow runoff and trap sediment. Contour farming creates rough surfaces that slow surfacewater velocity and reduce transport of sediment.
Reductions in slope length and steepness reduce sediment-carrying capacity by slowing velocity. Terraces and diversions are common barrier techniques that reduce slope length and slow, or stop,surface runoff.
8-186
By decreasing the distance across a field that is unsheltered from wind, or by creating soil ridgesand other barriers, sediment transport by wind can be reduced.
Combinations of the following practices can be used to effectively reduce soil transport by windor water erosion:
• Conservation tillage, (including mulch-tillage, no-tillage, strip-tillage, and ridge-tillage)• Crop rotation including grains, grasses and forage legumes• Chemical fallow or no fallow• Cover crops• Crosswind ridges• Crosswind stripcropping• Diversions• Ponds• Sediment basins • Terraces
Practices to Trap Sediment Below the Field or Critical Area
Practices are also typically needed to trap sediment leaving the field before it reaches a wetland orriparian area. Deposition of sediment is achieved by practices that slow water velocity andincrease infiltration. Combinations of the following practices can be used to effectively trapsediment below the field or critical area:
Practices That Have Multiple Functions to Reduce Detachment, Transport, and SedimentDelivery
Many conservation practices have multiple functions. Table 8-27 identifies the primary functionsof each practice.
Considerations in BMP Selection
The selection of the most effective BMPs to protect water quality depends on the objectives of thefarmer and the specific site conditions of individual fields. The best combination of BMPs forany specific field depends on factors such as the following:
• Rainfall—more rainfall means more erosion potential.• Soil type—some soils erode more easily than others.• Length of slope—a longer slope has increased potential for erosion due to increased
runoff energy.• Steepness of slope—steep slopes erode more easily than gradual slopes.• Ground cover—the more the soil is covered with protective grasses, legumes, or crop
residues, the better the erosion control.
Other factors to consider include:• Type of farm operation• Size of the field or farm• Nutrient levels of manure• Nutrient requirements of crops • Proximity to a waterway (stream, lake), water source (drinking water well), or water of the
state• Relationship of one erosion control practice to other supporting conservation practices• Conservation plan if required by USDA NRCS• Economic feasibility
8-188
Table 8-27. Primary Functions of Soil Conservation Practices
Conservation Practice Detachment Transport Sedimentation
Chemical fallow or no fallow O O
Conservation Tillage (mulch-till, ridge-till, strip-till, and no-till)
X / O X / O
Contour or Cross Slope X
Contour Stripcropping/Contour BufferStrips
X X X
Cover Crops X X
Crop Rotation, including small grains,grasses, and forage legumes
X X
Crosswind Trap Strips O O O
Crosswind Ridges O O
Crosswind Stripcropping O O O
Diversions X X
Field Borders X
Filter Strips X X
Grassed Waterways X X X
Ponds X X
Riparian Buffers X X
Sediment Basins X X
Shelterbelts/Field Windbreaks O O O
Terraces X X
Wetlands XNote: X = water erosion; O = wind erosion
Agricultural nonpoint source runoff management practices that protect natural resources generallyhave two principal goals: (1) to reduce runoff volume and (2) to contain and treat agriculturalrunoff. An effective runoff control system meets both of these goals by integrating severalpractices in a way that meets the needs of the particular management system. Strategies forcontrolling erosion involve reducing soil detachment, reducing sediment transport, and trappingsediment before it reaches a water body.
8-189
Soil erosion can be reduced by using a single conservation practice or a combination of practices. The following section explains conservation practices that can be used separately or incombination to reduce manure runoff and improve water quality.
Practice: Crop Residue Management
Description: Tillage operations influence the amount and distribution of plant residues on or nearthe soil surface. In the past, the preferred system, conventional tillage, was designed to bury asmuch residue and leave the soil surface as smooth as possible, which unfortunately led tosignificant soil erosion. In contrast, residue management systems are designed to leave residue ontop of the soil surface to increase infiltration and reduce erosion. In general, the more residue lefton the soil surface, the more protection from erosion the soil has. The amount of crop residue leftafter planting depends on the original amount of residue available, the tillage implements used,the number of tillage passes, and the depth and speed at which tillage was performed.
Crop residue management has been designated by many terms since its inception. The NaturalResources Conservation Service (NRCS) and the Conservation Technology Information Center(CTIC) have adopted the following terms and definitions.
• Conventional-till: Tillage types that leave less than 15 percent residue cover afterplanting. Generally this involves plowing or intensive (numerous) tillage trips.
• Reduced-till: Tillage types that leave 15 to 30 percent residue cover after planting.
• Conservation tillage: Any tillage and planting system that leaves 30 percent, or more, ofthe ground covered after planting with the previous year’s crop residues. Conservationtillage systems include mulch-till, no-till, strip-till, and ridge-till.
- Mulch-till: Full-width tillage that disturbs the entire soil surface is performedprior to and during planting. Tillage tools such as chisels, field cultivators, discs,sweeps, or bands are used. Weed control is accomplished with herbicides and/orcultivation.
- No-till and strip-till: The soil is left undisturbed from harvest to planting exceptstrips up to one-third of the row width (strips may involve only residue disturbanceor may include soil disturbance). Planting or drilling is accomplished using discopeners, coulter(s), row cleaners, in-row chisels, or roto-tillers. Weeds arecontrolled primarily with herbicides. Cultivation may be used for emergency weedcontrol. Other common terms used to describe no-till include direct seeding, slotplanting, zero-till, row-till, and slot-till.
- Ridge-till: The soil is left undisturbed from harvest to planting except for strips upto one-third of the row width. Planting is completed on the ridge and usuallyinvolves the removal of the top of the ridge. Planting is completed with sweeps,
8-190
disc openers, coulters, or row cleaners. Residue is left on the surface betweenridges. Weeds are controlled with herbicides (frequently banded) and/orcultivation. Ridges are rebuilt during cultivation (CTIC, 1998a).
No-till, strip-till, and ridge-till provide the most soil conservation protection.
Application and Performance: Plant residues can aid in soil erosion control. Residues canprotect the soil from the time of rowcrop harvest through the time the succeeding crop hasdeveloped sufficiently to provide adequate canopy protection. Conservation tillage reduces soilerosion by reducing detachment. It also reduces transport by minimizing soil crusting andincreasing infiltration, which reduces runoff. The residue acts as small dams, slowing themovement of water across the field and reducing its ability to carry soil particles.
Conservation tillage increases the size of soil aggregates, which reduces the potential of wind todetach soil particles and thereby reduces wind erosion. The residue also slows the wind speed atground level, reducing its ability to carry soil particles.
Advantages and Limitations: Benefits other than soil conservation that can be gained include thefollowing:
• Reduced tillage costs• Reduced labor• Reduced runoff• Reduced fuel use• Reduced machinery wear• Reduced particulate matter in air from wind erosion• Increased soil moisture• Improved surface water quality• Increased water infiltration• Decreased soil compaction• Improved soil tilth• Increased populations and diversity of wildlife• Increased sequestration of greenhouse gases (carbon dioxide)
Normally, the cost of changing from a conventional tillage system to a conservation tillage systemis minimal if current equipment can be adapted. The cost of changing is associated with thepurchase of additional attachments for equipment and depends on the type of conservation tillageto be done (no-till, ridge-till, mulch-till, and so forth). The incremental cost of these attachmentsmay range from $1.00 to $3.00/acre/year. However, if equipment is impossible to adapt or needsextreme adaptations, the investment in changing to a conservation tillage system can becomesignificant.
Intensive overall management is critical to the success of a no-tillage or ridge-tillage system. Constraints and challenges within the system should be considered before choosing a no-tillage or
8-191
ridge-tillage method. The most successful system needs a strong commitment from aknowledgeable manager. Management considerations and system constraints include thefollowing:
• Manure application and the need to incorporate• Alternative methods or equipment modifications for nutrient placement• The need to apply and/or incorporate lime• Planter and harvesting attachments need to be correctly installed and maintained• Critical timing of field operations• Greater reliance on herbicides for weed control• Shifts in weed populations and weed varieties• Increased nitrogen requirements due to an increase in residue that has a high carbon-to-
nitrogen ratio• Delays in spring field operations due to cold, wet soils • Delayed seed germination due to cold, wet soils
Conservation tillage can be used on cropland fields where excess sheet and rill erosion and winderosion are a concern. Conservation tillage is most effective when used with other supportingconservation practices such as grassed waterways, contouring, and field borders.
Operational Factors: In the northern areas of the United States where soil temperatures staycolder for longer periods of time, no-till may not be as well adapted as some of the otherconservation tillage systems. In these areas strip-till or ridge-till may be better options.
Demonstration Status: Conservation tillage is used across the United States and in conjunctionwith all the major crops.
Practice: Crop Rotation
Description: Crop rotation is the practice of alternating high-residue crops with low-residuecrops on the same piece of land, from year to year. Although crop rotations can varysignificantly, a typical rotation giving significant erosion protection could include high-residue-producing crops like small grains and hay, and low-residue-producing row crops like corn andsoybeans. A typical rotation using these crops would be corn-soybeans-corn-small grain-hay-hay.
Application and Performance: The soil conservation purpose of a crop rotation is to alternatecrops that have high erosion potential with crops that have low erosion potential because it is theaverage soil loss over time that is critical. It is expected that in those years when low-residuecrops are planted, significant erosion may occur. However, in years when high-residue crops areplanted, very little erosion will occur. Therefore, the average rate of soil erosion throughout therotation sequence will be significantly lower than it would be if only low-residue crops had beenplanted. A rotation of corn-soybeans-corn-small grain-hay-hay could be expected to reduce soilerosion by 50 percent as compared with just corn and soybeans, depending on the tillage system(Renard et al, 1997).
8-192
Advantages and Limitations: Weather conditions, unexpected herbicide carryover, and marketingconsiderations may result in a desire to change a scheduled crop rotation. Since most farmerswant to balance production acres of different crops, they need to have the flexibility of changingthe rotations in one field because of an unexpected condition in another field.
Operational Factors: Crop rotation can be used where sheet and rill erosion is a problem oncropland. Crop rotation works best with other supporting conservation practices such asconservation tillage, contouring, and grassed waterways. A market or use for the small grains orhay is needed before farmers will adopt the use of crop rotation.
Demonstration Status: The use of crop rotations is generally adopted in those regions that havedairy herds because of the need for hay.
Practice: Contouring and Cross-Slope Farming
Description: Contour farming is the practice of tilling, planting, and cultivating crops around aslope on a nearly level line that slowly grades water to a nonerosive area that can handleconcentrated flow. In gentle rains, the contoured rows are able to slowly grade the water to anonerosive area such as a grassed waterway or field border. In heavier rains, when the water runsover the tops of the rows, the rows serve as mini-dams to slow the water. Slowing the waterallows for more infiltration of water into the soil profile and reduces sediment transport in thefield.
On some slopes, strict contour farming that results in sharp turns and endless point rows isimpractical. Farm machinery may be too large to accommodate the tight turns and numerouspoint rows and increases the amount of time required to complete field operations. In this case,an alternative to contouring is cross-slope farming, which allows greater deviation from thecontour line. Although cross-slope makes farming easier, it is generally only half as effective ascontouring in reducing soil erosion.
In some areas of the country, using a rollover plow on the contour is beneficial to turn the soiluphill while performing conventional tillage. By using a rollover plow on the contour, soil ismechanically moved up-slope.
To allow for the removal of water in a concentrated flow, waterways need to be seeded, or shapedand seeded.
Application and Performance: Contouring can reduce soil erosion by 25 to 50 percent and cross-slope farming can reduce soil erosion by 10 to 25 percent depending on slope length, slopesteepness, field roughness, and row grade (Renard et al, 1997).
Advantages and Limitations: Because contouring and cross-slope farming slow the runoff ofwater, water infiltration is increased and soil erosion is reduced. The increased water infiltration
8-193
may also mean more available subsoil moisture during the growing season. Horsepowerrequirements may also be lower when farming on the contour or cross-slope.
On longer slopes, both contouring and cross-slope farming become less effective and should thenbe used in combination with a supporting conservation practice such as terraces or contour stripcropping.
The major disadvantage of contouring, and to a lesser extent cross-slope farming, is the increasedtime needed to perform the tilling, planting, spraying, cultivating, and harvesting operations. Contouring may require 25 to 50 percent more time as compared with farming straight rows. Cross-slope farming may require 10 to 25 percent more time as compared to farming straightrows. This increased time leads to higher labor, fuel, and equipment costs on a per acre basis.
Operational Factors: Contouring or cross-slope farming can be used on most slopes on whichrow crops are planted.
Demonstration Status: Contouring or cross-slope farming is widely adopted across the UnitedStates.
Description: Contour stripcropping is a system of growing crops in approximately even-widthstrips or bands on the contour. The crops are arranged so that a strip of meadow or close-growing crop is alternated with a strip of row crop. Contour stripcropping combines the soilprotection of both contouring and crop rotation. The widths of rowcrop strips should equal thewidths of the hay or small grain strips. The strips of hay or small grain slow water flow and trapsediment from the row crop strips above them.
Contour buffer strips can be used when a higher percentage of row crop acres are needed. Acontour buffer strip system allows for the hay or small grain strips to be narrower than the stripsof row crop. Because a contour buffer strip system results in more row crop acres, it is lesseffective than contour strip cropping in reducing soil erosion.
The strip width depends on the steepness of the slope and the management practices being used. It is also designed to accommodate the width of equipment (planters, sprayers, and harvesters). An even number of equipment passes along each strip improves field operation efficiency bystarting and finishing a pass at the same end of the field. Grassed field borders and grassedwaterways are an integral part of any stripcropping system. They provide access lanes and safeareas for concentrated water runoff.
Application and Performance: Contour stripcropping is very effective in reducing sheet and rillerosion. It can reduce soil loss by as much as 75 percent, depending on the type of crop rotationand the steepness of the slope. Depending on the width of the grass strip and the row crop strip
8-194
and the steepness of the slope, contour buffer strips can reduce sheet and rill erosion by as muchas 75 percent or as little as 20 percent (Renard et al., 1997).
Advantages and Limitations: Choosing to use contour stripcropping or contour buffer strips is anexcellent conservation practice for a farmer who can use small grains or hay. Instead of plantingone entire field to small grains or hay and another entire field to row crops, strips of hay or graincan be alternated, thereby reducing soil erosion.
Effective stripcropping systems require strips that are wide enough to be farmed efficiently. Ifpossible, consolidation of fields may be necessary. The major disadvantage of using contourstripcropping or contour buffer strips as an erosion control practice is the same as that ofcontouring: increased time to perform the field operations (e.g., tillage, planting, spraying, andharvesting). These practices may require 25 to 50 percent more time than farming straight rows. Increased time used in field operations leads to higher labor, fuel, and equipment costs on a peracre basis.
Operational Factors: Contour stripcropping and contour buffer strips can be used where sheetand rill erosion are a problem in cropland, and they work best with other supporting conservationpractices such as conservation tillage and grassed waterways. The use of contour stripcroppingand contour buffer strips is practical only if there is a market or use for the small grains or hay.
Demonstration Status: The use of crop rotations is generally adopted in those regions that havedairy herds, beef cattle, or sheep because of the need for hay.
Practice: Grassed Waterways
Description: Grassed waterways are areas planted to grass or other permanent vegetative coverwhere water usually concentrates as it runs off a field. They can be either natural or man-madechannels. Grass in the waterway slows the water as it leaves the field. Grassed waterways canserve as safe outlets for graded terraces, diversions, and contour rows. They can also serve aspassageways for water that enters a farm from other land located higher in the drainage basin. Grassed waterways significantly reduce gully erosion and aid in trapping sediment.
Application and Performance: Grassed waterways protect the soil from erosion at points ofconcentrated water flow. They are designed to safely carry runoff water from the area that drainsinto them to a stable outlet. Small waterways are designed in a parabolic shape and are built wideenough and deep enough to carry the peak runoff from a 24-hour storm that would be expected tooccur once every 10 years.
The decision to mow or not to mow grassed waterways depends on supporting conservationpractices and other management concerns. To increase the lifespan of the waterway, it is best tomow or clip the grass in the waterway. If grasses are allowed to grow, the flow rate of thewaterway is slowed, increasing the rate of sedimentation in the waterway, which in turn increasesthe cost of maintaining the waterway. If waterways are clipped, however, water flows faster and
8-195
the sediment is carried farther down slope before being dropped out. If manure is applied in thewaterway drainage area, grassed waterways should not be mowed. To prevent excessivesedimentation in the unmowed waterways, other supporting conservation practices, such ascontouring, conservation tillage, or barrier systems, should be in place.
Advantages and Limitations: The goal of a waterway design is to protect against soil loss whileminimizing siltation and gullying in the waterway. Gullies can form along the side of a waterwayif the water does not enter the waterway or if the runoff spills out of the waterway and runsparallel to it. This can be caused by inadequate design (too shallow or too narrow) or inadequatemaintenance, and in some cases by flooding. Even under the best conditions, grassed waterwaystend to either silt in or develop channels or gullies. Timely maintenance and repairs can preventmajor reconstruction. Silt can be cleaned out and small gullies can be filled in. However, if thewaterway is damaged too badly, it will need to be completely reshaped and reseeded. Oftenheavy equipment such as a bulldozer or a scraper is required.
Grassed waterways permanently take land out of cereal and row crop production, but they can beharvested for forage production if the farmer has a use and/or market for the forage and theequipment to harvest the forage.
The cost of waterway construction depends on the depth and width of the waterway. It rangesfrom $1.50 to $3.50 per linear foot, with mulch and seed. In addition to the construction cost,there is a maintenance cost. The cost to maintain a waterway is highly variable depending ondrainage area size, soil type, grade of the waterway, and level of control of soil erosion above thewaterway. Some waterways can function for 10 years without maintenance, whereas others needmaintenance on a yearly basis.
Operational Factors: Grassed waterways can be used where ephemeral erosion and gully erosionare a problem.
Demonstration Status: Grassed waterways are used across the United States and in conjunctionwith all the major crops.
Practice: Terraces
Description: Terraces are earthen structures that run perpendicular to the slope and interceptrunoff on moderate to steep slopes. They transform long slopes into a series of shorter slopes. On shorter slopes, water velocity is slower and therefore has less power to detach soil particles. Terraces slow water, catch water at intervals down slope, and temporarily store it in the terracechannel.
Depending on the soil type, the water can either infiltrate into the ground or be delivered into agrassed waterway or an underground tile. Terraces are spaced to control rill erosion and to stopephemeral gullying. Terrace spacing is determined by several factors, including soil type, slope,and the use of other supporting conservation practices such as conservation tillage and crop
8-196
rotation. When more than one terrace is placed on a hillside, it is best to construct the terracesparallel to each other and at spacings that are multiple widths of field equipment. This approachhelps eliminate short rows and improves the efficiency of field operations.
Application and Performance: Terraces reduce the rate of runoff and allow soil particles to settleout.
Advantages and Limitations: One of the biggest advantages of terraces is that they are permanentconservation practices. A farmer usually does not adopt terracing one year and decide the nextyear not to use it, unlike such management practices as conservation tillage or contouring. Inalmost all cases, terraces will not be removed until they have exceeded their life expectancy of 20years.
A disadvantage of terraces is that they are built with heavy construction equipment and the soilstructure around the terrace can be permanently altered. Terraces are built by pushing soil up, andthey usually require a bulldozer. Compaction on the lower side of the terrace is always a concernand can last for years after the terrace is constructed.
Terraces can permanently remove land from production. The amount of land removed fromproduction depends on the terrace system installed, but it normally ranges from 0 to 5 percent ofthe overall land base. The cost to install terraces ranges between $0.75 and $3.00 per linear foot,including seeding. In many cases terraces also require either a tile line or a waterway as an outletfor the water. The cost of installing tile can range from $.75 to $1.50 per linear foot. Waterwaycosts are covered in the section on grassed waterways. It can cost in the range of $100 to $165 toprotect 1 acre of land with terraces and suitable outlets. In addition to construction costs, thereare always maintenance costs. If excessive rains occur, terraces will overtop and requiremaintenance. The sediment collected in terrace channels should be cleaned out periodically, atleast every 10 years, or sooner, depending on the sedimentation rate. Maintenance also includesremoving trees and shrubs from the terrace and repairing rodent damage.
In addition to the loss of cropland and cost of construction and maintenance, terraces are laid outon the contour, which can increase the time, fuel, and equipment costs associated with fieldoperations. See the section on contouring and cross-slope farming for costs associated withcontouring.
Operational Factors: Terraces can be used when sheet, rill, or ephemeral erosion are a concern.
Demonstration Status: Terraces are widely adopted across the United States.
Practice: Field Borders
Description: A field border is a band or strip of perennial vegetation, usually grass and/orlegume, established at the edge of a field. From a soil conservation standpoint, field borders areused to replace end rows that run up and down a hill. Sometimes field borders replace end rows
8-197
all the way around the field, and other times they are used where slope length and steepnesspresent a concern for soil erosion. Field borders can be used in fields that are contoured, cross-sloped, contour stripcropped, contour buffer stripped, or terraced.
Application and Performance: Field borders reduce detachment, slow transport, and help reducesediment load in water.
Advantages and Limitations: Field borders reduce acres of cereal crops or row crops inproduction. However, if the field border is planted to forage, it can be harvested, as long as thefarmer has the proper equipment and a use or market for the crop. The cost of seeding an acre offield borders is approximately $50 to $70 per acre.
Operational Factors: Field borders can be used with all crops and in all regions of the UnitedStates.
Demonstration Status: Field borders are commonly used as a conservation practices incombination with other practices.
Practice: Sediment Basin
Description: A sediment basin is a barrier structure constructed to collect and store manure,sediment, or other debris.
Application and Performance: Sediment basins are constructed to accumulate and temporarilystore water runoff. For controlling manure runoff, sediment basins may be used in two types ofsettings: to capture feedlot runoff or to capture field runoff. As runoff accumulates and water isslowly discharged through an outlet, soil particles settle out and are trapped in the basin. Frequently, a filter strip is positioned as a secondary treatment practice below the sediment basinto catch the additional sediment flowing through the outlet. Sediment basins reduce the transportof soil and manure by flowing water.
Advantages and Limitations: The construction cost of sediment basins is quite variable,depending on the steepness of the land and the size of the drainage area flowing into the basin. However, basins are normally a cost-effective practice to capture sediment.
On-site erosion control cannot be achieved with sediment basins, because they do little to stopdetachment and transport of soil.
Operational Factors: Sediment basins can be used with all crops and in all regions of the UnitedStates.
Demonstration Status: Sediment basins are commonly used as a conservation practices in allcropland systems.
8-198
Practice: Cover Crops
Description: A cover crop is a crop of close-growing grass, legumes, or small grain grownprimarily for seasonal protection and soil improvement. These crops are also known as greenmanure crops. Cover crops are usually grown for 1 year or less, except where there is permanentcover (e.g., orchards). They increase vegetative and residue cover during periods when erosionenergy is high, and especially when primary crops do not furnish adequate cover. Cover cropsmay be established by conventional or conservation tillage (no-till or mulch-till) methods or byaerial seeding.
Cover crops should be planted immediately after harvest of a primary crop to maximize theerosion control benefits. Recommended seeding dates vary from year to year and depend on soiltype, local climatic conditions, field exposure, and the species of cover crop being grown.
Application and Performance: Cover crops control erosion during periods when the major cropsdo not furnish adequate cover. Since cover crops provide a quick canopy, they reduce the impactof raindrops on the soil surface, thereby reducing soil particle detachment. Cover crops also slowthe surface flow of water, reducing transport of sediment and increasing water infiltration. Covercrops can add organic material to the soil; they improve water infiltration, soil aeration, and soilquality. In addition, cover crops can control plant nutrients and soil moisture in the root zone. Ifa legume crop is used as a cover crop, it will provide nitrogen for the next year’s crop.
Actively growing cover crops use available nutrients in the soil, especially nitrogen, thuspreventing or decreasing leaching or other loss. These nutrients may then become available to thefollowing crop during the decaying process of the green manure.
Advantages and Limitations: Cover crops increase transpiration. In areas of the United Stateswhere moisture is limited, cover crops may use up too much of the available soil moisture. Lossof available soil moisture may reduce the yield of the primary crop planted after the cover crop,reducing profits.
Preparing a seedbed and drilling in a winter cereal crop costs $40 to $45 per acre. Broadcastseeding after harvest, followed by a tillage pass that levels the soil surface, costs $35 per acre. Broadcast seeding prior to harvest costs $15 per acre.
Operational Factors: Cover crops can be used when major crops do not furnish adequate coverand sheet and rill erosion is a problem.
Demonstration Status: Cover crops are used throughout the United States.
Practice: Filter Strip/Riparian Buffer
Description: Filter strips are strips of grass used to intercept or trap field sediment, organics,pesticides, and other potential pollutants before they reach a body of water.
8-199
Riparian buffers are streamside plantings of trees, shrubs, and grasses that can interceptcontaminants from both surface water and ground water before they reach a stream.
Application and Performance: Filter strips and riparian buffers are designed to interceptundesirable contaminants such as sediment, manure, fertilizers, pesticides, bacteria, pathogens,and heavy metals from surface and subsurface flows of water to a waterbody. They provide abuffer between a contaminant source and waterbodies. Buffers and filter strips slow the velocityof water, allowing soil particles to settle out.
Advantages and Limitations: Buffer strips and riparian buffers reduce the acreage in cereal cropsor row crops, but they can be harvested for forage production if the farmer has a use or market forthe forage and the equipment to harvest the forage. Depending on whether the filter strip orriparian buffer strip is seeded to grass or planted to trees, the cost of seeding can range from $50to $500 per acre.
Operational Factors: Buffer strips and riparian buffers can be used with all crops and in allregions of the United States.
Demonstration Status: Filter strips and riparian buffers have been widely promoted and adoptedthroughout the United States with programs like the Conservation Reserve Program (CRP).
Description: Crosswind trap strips are rows of perennial vegetation planted in varying widths andsituated perpendicular to the prevailing wind direction. They can effectively prevent winderosion in cropping areas with high, average annual wind speeds.
Crosswind ridges are formed by tillage or planting and are aligned across the prevailing winderosion direction. The ridges reduce wind velocity near the ground, and the soil particles that dostart to move are trapped in the furrows between the ridge crests.
Crosswind stripcropping is growing crops in strips established across the prevailing winddirection and arranged so that the strips susceptible to wind erosion are alternated with stripshaving a protective cover that is resistant to wind erosion.
A shelterbelt or field windbreak is a row (or rows) of trees, shrubs, or other plants used to reducewind erosion, protect young crops, and control blowing snow. Shelterbelts also provide excellentprotection from the elements for wildlife, livestock, houses, and farm buildings. Fieldwindbreaks are similar to shelterbelts but are located along crop field borders or within the fielditself. In some areas of the country, they may also be called hedgerow plantings.
Application and Performance: These practices are designed to reduce soil erosion by increasingthe soil roughness and reducing the wind speed at the soil surface.
8-200
Advantages and Limitations: The same practices that reduce wind erosion also reduce moistureloss. Snow is more likely to stay on the field than to blow off, thereby increasing soil moisture. A drawback to crosswind trap strips, shelterbelts, and field windbreaks is that they take croplandout of production. Also, they are a physical barrier to operations such as manure application withan umbilical cord system.
Operational Factors: These practices can be used anywhere that wind erosion is a concern inrow crops.
Demonstration Status: These practices are used where row crops are planted in the Plains states.
8-201
8.5 References
AAC. 2000. Farming for Tomorrow: Conservation Facts. Rotational Grazing: The Rest andRecovery Method of Pasture Management. <http://aceis.agr.ca/pfra/land/fft10.htm> Accessed 2/11/00. Agriculture and Agri-Food Canada.
ASAE. 1998. Standards, 45th Edition, Standards, Engineering Practices and Data. AmericanSociety of Agricultural Engineers, St. Joseph, MI.
Baird, J.V., S.C. Hodges, and M.R. Tucker. 1997. Careful soil sampling—the key to reliable soiltest information. Publication AG-439-30, North Carolina Cooperative Extension Service,North Carolina State University, Raleigh, North Carolina.
Barker, J.C. 1996. Livestock waste sampling, analysis, and calculation of land application rates.Publication Number EBAE 111-84, North Carolina Cooperative Extension Service, NorthCarolina State University, Raleigh, North Carolina.
Barker, J.C., and J.P. Zublena. 1996. Components of a complete manure management plan.Publication Number EBAE 185-93, North Carolina Cooperative Extension Service, NorthCarolina State University, Raleigh, North Carolina.
Barth, C.L. and J. Kroes. 1985. Livestock Waste Lagoon Sludge Characteristics, In:Agricultural Waste Utilization and Management, Proceedings of the Fifth InternationalSymposium on Livestock Wastes, St. Joseph, MI, ASAE, p.660-671.
Bartok, J.W. 1994. Fertilizer and manure application equipment. NRAES-57. NortheastRegional Agricultural Engineering Service, Cooperative Extension, Ithaca, New York. April.
Beal, J.D., P.H. Brooks, and H. Schulze. 1998. The effect of the addition of a protease enzymeto raw or autoclaved soya bean on the growth performance of liquid fed grower/finisherpigs. Abstract submitted for the Brit. Soc. Anim. Sci. meetings.
Berry, J.T., and N. Hargett. 1984. Fertilizer summary data. Tennessee Valley Authority, NationalFertilizer Development Center, Mussel Shoals, Alabama.
Bicudo, J., D. Schmidt, C. Jacobson, K. Janni. 1999. Nutrient Content and Sludge Volumes inSingle Cell Recycle Anaerobic Swine Lagoons in North Carolina, Transactions of theASAE. Vol.42(4): 1087-1093, 1999.
Bonner, J., R.B. Moore, and J. Thomas. 1998. Managing animal waste nutrients. MississippiState University Extension Service, Mississippi State University, Jackson, Mississippi.
8-202
Brady, N.C., and R.R. Weil. 1996. The nature and properties of soils. 11th ed. MacmillanPublishing Company, New York, New York.
Bridges, T.C.; L.W. Turner, G.L. Cromwell, and J.L. Pierce. 1995. Modeling the effects of dietformulation on nitrogen and phosphorus excretion in swine waste. Applied Engineeringin Agriculture 11: 5, 731-739.
Brumm, M.C., J. D. Harmon, M. C. Honeyman, and J. Kliebenstein. 1997. Hoop Structures forGrow-Finish Swine. Agricultural Engineers Digest 41: 1-16. February 1997.
Busch, D., T. Wagar, and M. Schmitt. 2000. Livestock manure sampling. FO-6423-GO, Collegeof Agricultural, Food, and Environmental Sciences, University of Minnesota ExtensionService, St. Paul, Minnesota.
CAST. 1996. Integrated animal waste management. Task Force Report No. 28. Council forAgricultural Science and Technology, Ames, Iowa. November.
Chase, L. E. 1998. "Phosphorus nutrition of dairy cattle" Mid-South Ruminant NutritionConference, Dallas, Texas, sponsored by Texas Animal Nutrition Council and the TexasAgricultural Extension Service. May 7-8.
Chastain, J., W. Lucas, J. Albrecht, J. Pardue, J. Adams, and K.Moore. 1998. Solids andNutrient Removal from Liquid Swine Manure using a Screw Press Separator. Paper No.98-4110. American Society of Agricultural Engineers, St. Joseph, MI.
Cheng, J., J. Pace, K. D. Zering, J. C. Barker, K. F. Roos, and L. M. Saele. 1999. Evaluation ofAlternative Swine Waste Treatment Systems in Comparison with Traditional LagoonSystem. Paper to be presented at Livestock Waste Management Symposium, AmericanSociety of Agricultural Engineers, Des Moines, IA, October 2000.
CIAS. 2000. Dairy Grazing Can Provide Good Financial Return. Center for IntegratedAgricultural Systems. <http://www.wisc.edu/cias/pubs/resbrief/050.html> Accessed5/29/00.
Conner, M. 1994. Update on alternative housing for pigs. Manitoba Swine SeminarProceedings 8: 93-96.
Conner, M. 1993. Evaluation of a biotech housing for feeder pigs. Manitoba Swine Update. July1993. 5(3)1.
Crouse, K., and W. McCarty. 1998. Soil testing for the farmer. Extension Agronomy, Mississippi
CTIC. 1998b. The 1998 MAX report. Conservation Technology Information Center, PurdueUniversity, West Lafayette, Indiana.
Culotta, C. P., and G. H. Schmidt 1988. An Economic Evaluation of Three Times Daily Milkingof Dairy Cows. Journal of Dairy Science 71: 1960.
Cummings, R.J., and W.J. Jewell. 1977. Thermophilic Aerobic Digestion of Dairy Waste. In Food, Fiber, and Agricultural Residues, ed. R.C. Loehr. pp. 637-657. Ann Arbor SciencePublishers, Inc., Ann Arbor, Michigan.
Dahl, G. E., J. P. Chastain and R. R. Peters. 1998. Manipulation of photoperiods to increasemilk production in cattle: biological, economic and practical considerations. InProceedings of the Fourth International Dairy Housing Conference, J. P. Chastain ed.,American Society of Agricultural Enginineers, St. John's, Michigan.
Dahl, G.E., T.H. Elsasser, A.V. Capuco, R.A. Erdman and R.R. Peters. 1996. Long dayphotoperiod that stimulates milk yield and also increases circulating insulin-like growthfactor-1 (IGF-1). FASEB J. 10: A751.
Dick, W.A., D.J. Eckert, J.W. Johnson. 1999. Land application of poultry litter. ANR-4-98. Ohio State University Extension Fact Sheet, School of Natural Resources, Columbus,Ohio.
Dierick and Decuypere. 1994: referenced by Close, W.H. 1996. Nutritional management ofswine is ever-evolving challenge. Feedstuffs, 22 Jan.:16-19,46-47
Dinn, N. E. , L. J. Fisher, J. A. Shelford and J. Paul. 1996. The use of the Cornell netcarbohydrate and protein system and rumen protected lysine and methionine to reducenitrogen excretion of lactating dairy cows. J. Dairy Sci. 79: (Suppl 1) 129.
Doerge, T.A., R.L. Roth, and B.R. Gardner. 1991. Nitrogen fertilizer management in Arizona.College of Agriculture, University of Arizona, Tucson, Arizona.
Dunlap, T. F., R. A. Kohn and K. F. Kalscheur. 1997. Effect of animal grouping strategies onnutrient losses from the dairy farm. J. Dairy Sci. 80: (Suppl. 1) 246.
Edens F. and C. Simons. 1998. Use of Phytase in Poultry diets to Reduce Phosphorus Excretion. North Carolina State University, Department of Poultry Sciences, and Center for Applied
8-204
Poultry Research, Netherlands.
Emmicx, D.L. 2000. State Grasslands Specialist, New York State. ABC's of RotationalGrazing: Questions and Answers. Accessed from the Internet 2/11/00.<http://www.kingcd.org/stewardship/Ag%20Pr...ces/Pastures/ABCsofRotationalGrazing.html>
Envirologic Corporation. 2000. High-Rise™ Hog Facilities. Informational packet distributed byFort Recovery Equipment Systems, Inc. Received March 27, 2000.
Erdman, R. A. and M. Varner. 1995. Fixed yield responses to increased milking frequency. J.Dairy Sci. 78: 1199.
Ferguson, J. D. 1999. Typical concentrations of urea found in milk. in More MUN Research(web site) <http://www.dhia.psu.edu/munnews>. Accessed (date).
Fox, D.G., M.C. Barry, R.E. Pitt, D.K. Roseler and W.C. Stone. 1995. "Application of thecornell net carbohydrate and protein system for cattle consuming forage" J. Anim. Sci. 73: 267.
Fulhage C. 1998. Gaseous Emissions from Manure Management Systems - An Overview.Presented at 1998 American Society of Agricultural Engineers Annual Meeting, Orlando,Florida. 1998.
Fulhage, C. and J. Hoehne. 1999. Manure Nutrient Content and Variability in Missouri SwineLagoons. Presented at 1999 American Society of Agricultural Engineers Mid-CentralMeeting, St. Joseph, MO. April 20-May 1, 1999. Paper. No. MC99-104
Fulhage, C.D., and D.L. Pfost. 1993. Flushing Systems for Dairies. WQ308. Department ofAgriculture Engineering, University of Missouri-Columbia, Columbia, MO. July 15.
Garber, L. 1999. USDA NAHMS Center for Animal Health Monitoring facsimile sent August1999.
Graham, H. and J. Inborr. 1993. Feed enzymes: mode of action and application to heat processedpoultry feeds. Amandus Kahl Seminar
Graves, R. 2000. Department of Agriculture Engineering, Penn State University, UniversityPark, PA. E-mail correspondence. April 2.
Hallberg, G.R.. 1991. A progress review of Iowa's agricultural-energy-environmental initiatives:nitrogen management in Iowa. Technical Information Series 22, Iowa Department ofNatural Resources, Iowa City, IA.
8-205
Halverson, M. 1998. Management in Swedish Deep-Bedded Swine Housing System:Background and Behavioral Considerations. Managing Manure in Harmony with theEnvironment Conference and Proceedings, February 10-12 1998, Ames, Iowa: 155-158.
Hanna, M. 1998. Incorporate manure to reduce odor and maintain residue cover. Iowa ManureMatters Odor Nutrient Management Newsletter. Summer 1998. Iowa State University,Ames, Iowa.
Hannawale, J. 2000. Telephone conversation with Jim Hannawale, USDA, on April 4, 2000.
Harmon, J., H. Xin. 1997. Thermal Performance of a Hoop Structure for Finishing Swine. ASL-R1391. 1996 Swine Research Reports: 104-106. Iowa State University Extension,Ames, IA.
Harmon, J., M. Honeyman. 1997. Hoop Structures- Research on Performance and Operation. Iowa State University Agriculture and Biosystems Engineering, Ames, IA.<http://www.ae.iastate.edu/aen189.htm> Accessed March 15, 2000.
Hatfield, J.L. 1998. Evaluation of the potential environmental implications of animal manure. National Soil Tilth Laboratory, Ames, Iowa.
Hirschi, M., R. Frazee, G. Czapar, and D. Peterson. 1997. 60 ways farmers can protect surfacewater. North Central Regional Extension Publication 589, University of Illinois,Urbana-Champaign, Illinois..
Honeyman, M. 1999. An Overview of Swine System Options. Proceedings: Swine SystemOptions For Iowa 1999, February 17, 1999. Iowa State University, Ames, Iowa.
Honeyman, M. 1996. Hoop Structures with Deep Bedding for Grow-finish Pigs. ASL-R1392.
1996 Swine Research Reports: 107:110. Iowa State University Extension, Ames, Iowa.
Honeyman, M., J. Harmon, D. Lay, and T. Richard. 1997. Gestating Sows in Deep-bedded HoopStructures. ASL-R1496. 1997 Swine Research Reports. Iowa State University Extension,Ames, Iowa.
Honeyman, M., J. Harmon, A. Penner, and C. Jorgenson. 1999. Performance of Finishing Pigsin Hoops and Confinement During Summer and Winter. ASL-R1682. 1999 SwineResearch Reports. Iowa State University Extension, Ames, Iowa.
Hue, N.V., R. Uchida, and M.C. Ho. 1997. Testing your soil—why and how to take a soil-testsample. AS-4. Agronomy and Soils, Cooperative Extension Service, College of TropicalAgriculture & Human Resources, University of Hawaii at Manoa, Hawaii.
8-206
Humenick, F. , A.A. Szogi, P.G. Hunt, J.M. Rice, and G.R. Scalf. 1972. Constructed Wetlandsfor Swine Wastewater Treatment. Waste Management Research, Proceedings of the 1972Cornell Agricultural Waste Management Conference. Cornell University and USEPA. P341-353.
Hutchinson, L.J. 1988. Animal Health, Pest Management and Environment U.S. Department ofAgriculture, Soil Conservation Service, Northeast National Technical Center, Chester,Pennsylvania. Proceedings of the Pasture in the Northeast Region of the United States. April 1988.
Iowa State University. 1999. Managing Nutrients for Crop Production. PM-1811. Iowa StateUniversity Extension, Ames, IA. November.
Iragavarapu, R., and T. Doerge. 1999. Manure Phosphorus - Problems Regulations, and CropGenetic Solutions. Crop Insights 9(6). <http://www.pioneer.com/usa/nutrition/manure_phosphorus _availability_99.html>. Accessed September 20, 1999
ISU. 1995. Iowa State University. Land application for effective manure nutrient management.Pm-1599. October 1995. Iowa State University Extension, Ames, Iowa.
Jeffery, R. 1996. Nitrogen and Phosphorus Accumulation in the Soil Profile Beneath anAlternative Housing System for Pigs, Report No 2. Pig Research and DevelopmentCorporation, Medina Research Centre, February 27, 1996, Greenwood, W.A.
John, R.E. 1991. Alternative Animal Products: The Industry. University of Maryland NationalDairy Database. Updated September 21, 1991. Accessed September 24, 1999.<http://www.inform.umd.edu/EdRes/Topic/AgrEnv/ndd/feeding/ALTERNATIVE_ANIMAL_PRODUCTS_THE_INDUSTRY.html>
Johnson, D.E., G.M. Ward and J. Torrent. 1992. "The environmental impact of bovinesomatotropin use in dairy cattle" J. Environ. Qual. 21: 157.
Johnson, Kerstin P., and Montemagno, Carlo D. 1999. An Analysis of Dairy Waste TreatmentUsing Sequencing Batch Reactors. Cornell University, Department of Agricultural andBiological Engineering, 1999.
Jones, D.D. 2000. Department of Agriculture and Biosystems, Purdue University, WestLafayette, IN. E-mail correspondence. March 31.
Jonker, J.S., R.A. Kohn and R.A. Erdman. 1998. Using Milk Urea Nitrogen to Predict NitrogenExcretion and Utilization Efficiency in Lactating Dairy Cows. J. Dairy Sci. 81:2681.
Kalscheur, K.F., R.A Kohn, R.A. Erdman, and J.H. Vandersall. 1997. Evaluation of Diet
8-207
Formulation Models Using Low Protein Corn-based Diets. J. Dairy Sci. 80: (Suppl. 1)162.
Keener, H., D. Elwell, T. Menke, and R. Stowell. 1999. Design and Management of High-Rise™Hog Facility Manure Drying Bed. ASAE Paper 994108. ASAE, St. Joseph, MI.
Keplinger, K. 1998. Cost savings and environmental benefits of dietary P reductions for dairycows in the Bosque river watershed. Working paper, Texas Institute for AppliedEnvironmental Research.
Knowlton, K. F., and R. Kohn. 1999. "We've got to stop overfeeding phosphorus" Hoard'Dairyman, Vol. 144, no. 11, June.
Koelsch, R. 1997. Determining crop available nutrients from manure. G97-1335A. NebGuide,Cooperative Extension Publication. Institute of Agriculture and Natural Resources,University of Nebraska-Lincoln, Lincoln, Nebraska. September.
Kohn, R. A., K. F. Kalscheur and M. Hanigan. 1998. "Evaluation of Models for Balancing theProtein Requirements of Dairy Cows" J. Dairy Sci. 81: 3402.
Kohn, R.A. 1999. "The Impact of Dairy Herd Management on Nutrient Losses to WaterResources" In Manurenet (website), <http://www.inform.umd.edu/ManureNet/herdeffic>.
Kroodsma, W. 1985. Separation as a Method of Manure Handling and Odours Reduction in PigBuildings. In: Odour Prevention and Control of Organic Sludge and Livestock Farming. Elsevier Applied Science Publishing, London, England.
Langland, M.J., and D.K. Fishel. 1996. Effects of agricultural best-management practices on theBrush Run Creek headwaters, Adams County, Pennsylvania, prior and during nutrientmanagement. U.S. Geological Survey, Water Resources Investigations Report 95-4195,Lemoyne, Pennsylvania.
Lee, A. 2000. What Is Pastured Poultry? By Farmer/Author/Instructor, Andy Lee. Accessedfrom the Internet on 12/04/00 <http://www.lionsgrip.com/pastured.html>
Lei, X.G., P.K. Ku, E.R. Miller, and M.T. Yokoyama. 1993. Supplementing corn-soybean mealdiets with microbial phytase linearly improves phytate phosphorus utilization by weaningpigs. Journal of Animal Science 71(12): 3359-3367.
Lemunyon, J.L., and R.G. Gilbert. 1993. The concept and need for a phosphorus assessment tool.Journal of Production Agriculture: 6(4): 483-486.
Lenis, N.P., and J.B. Schutte. 1990. Aminozuurvoorziening van biggen en vleesvarkens in
8-208
relatie tot stikstofuitscheiding. In: Mestproblematiek: aanpak via de voeding van varkensen pluimvee (A.W. Jongbloed and J. Coppoolse, eds.), pp. 79-89. Onderzoek inzake demest en ammoniakproblematiek in de veehouderij 4, Dienst LandbouwkundigOnderzoek, Wageningen.
Liskey, R.K., J.B. Franzini, D.L. Freyberg, and G. Tchobanoglous. 1992. Water Resources, 4th
ed. McGraw-Hill, New York, New York.
Loehr, R. 1977. Pollution Control for Agriculture, Academic Press, Inc., New York, NY.
Lorimor, J. 2000. Department of Agriculture and Biosystems Engineering, Iowa StateUniversity, Ames, IA. E-mail correspondence. April 4.
Lusk, P. 1998. Methane Recovery from Animal Manures: The Current Opportunities Casebook.National Renewable Energy Lab, Golden, CO. NREL/SR-580-25145. September 1998
Marketing Directions. 1998. Nutrient management research. Conservation TechnologyInformation Center, West Lafayette, Indiana.
Martin, J.H., Jr. 1999. Pathogen Reduction-Temperature Relationships. Unpublished reportprepared for the Engineering Analysis Division, U.S. Environmental Protection Agency,Washington, DC by ICF, Inc., (need to insert City, State).
McClure, T.J. 1994. Nutritional and Metabolic Infertility in the Cow, CAB International, Oxon,UK.
McFarland, M.L., T.L. Provin, and S.E. Feagley. 1998. Managing crop nutrients through soil,manure and effluent testing. L-5175, Texas Agricultural Extension Service, Texas A&MUniversity System, College Station, Texas.
Meals, D.W., J.D. Sutton, and R.H. Griggs. 1996. Assessment of progress of selected waterquality projects of USDA and state cooperators, U.S. Department of Agriculture, NationalResources Conservation Service, Washington, DC.
Menke, T., R. Mackin, H. Keener, M. Veenhuizen, and Organic Resource Technologies, Inc. 1996. An Integrated Method of Managing the Residuals of Swine Production. Ademonstration project/study proposal. March 21, 1996.
Mescher, T., T. Menke, R. Stowell, M. Veenhuizen, and H. Keener. 1999. Design, Performance,and Economics of a High-Rise™ Swine Finishing Building. ASAE Paper 994107. ASAE,St. Joseph, MI.
Metcalf & Eddy, Inc. 1991. edited by G. Tchabanoglous. Wastewater Engineering: Treatment,
8-209
Disposal, And Reuse, Third Edition. McGraw-Hill Book Co., New York, NY.
Michele, D., J.R. Bacon, C.M. Gempesaw, and J.H. Martin. 1986. Nutrient management byDelmarva poultry growers: A survey of attitudes and practices. University of Delaware,Newark, Delaware.
Monge, H., P.H. Simmins, and J. Weigel. 1998. Reduction du taux proteique alimentairecombinee avec differents rapports methionine:lysine. Effet sur le bilan azote du porcmaigre en croissance et en finition. Journees de la Recherce Porcine en France29:293-298.
Moser, M., Dr. J. Martin, A. Martin, R.P. Mattocks. 1999. Pig Manure Solids Separation.Unpublished report prepared by ICF Inc. for the Engineering Analysis Division, UnitedStates Environmental Protection Agency, Washington DC.
Moser, M.A., and A. Martin. 1999. Anaerobic Manure Management. Unpublished reportprepared for the Engineering Analysis Division, United States Environmental ProtectionAgency, by ICF Inc.
Mroz, Z., A.W. Jongbloed, and P.A. Kemme. 1994. Apparent digestibility and retention ofnutrients bound to phytate complexes as influenced by microbial phytase and feedingregimen in pigs. J. Anim. Sci. 72:126-132.
Murphy, B. 1988. Voisin Grazing Management in the Northeast. U.S. Department ofAgriculture, Soil Conservation Service, Northeast National Technical Center, Chester,Pennsylvania. Proceedings of the Pasture in the Northeast Region of the United States. April 1988.
NCSU. 1998. EPA national guidelines for swine and poultry waste management. NorthCarolina State University, Raleigh Durham, North Carolina.
NCSU. 1999. Nitrogen and Phosphorus Excretion in Poultry Production. Unpublished. February 1999. North Carolina State University, Animal Waste Management Program
Oldham, L. 1999. Nutrient management. Mississippi State University Extension Service,Mississippi State University, Jackson, Mississippi.
Pennsylvania State University. 1992. Nonpoint source database. Department of Agricultural andBiological Engineering, Pennsylvania State University, University Park, Pennsylvania.
Pocknee, S., and B. Boydell. 1995. Soil sampling for precision farming. National
8-210
Environmentally Sound Production Agriculture Laboratory, College of Agricultural andEnvironmental Sciences, University of Georgia, Athens, Georgia.
PPRC. 1996. Impacts of Intensive Rotational Grazing on Stream Ecology and Water Quality. September 1996. Accessed from the Internet 2/11/00.<http://www.pprc.org/pprc/rpd/fedfund/usda/sare_nc/impactsi.html> PollutionPrevention Resource Center, Seattle, WA.
Purdue Research Foundation. 1994. Manure Storage - Storage Facilities. Purdue ResearchFoundation, West Lafayette, IN. <http://abe.www.ecn.purdue.edu/~epados/farmstead/manure/src/credits.htm> Accessed September 15, 1999
RCM, Inc. 2000. File date. RCM Inc., Berkeley, CA.
RCM, Inc. 1999. File date. RCM Inc., Berkeley, CA.
Reeves, P.L., K.P. Johnson, and C.D. Montemagno. 1999. Biological treatment of dairy manureusing sequencing batch reactors: Improving profitability through innovative design.Cornell University, Ithaca, New York
Renard, K.G., G.R. Foster, G.A. Weesies, D.K. McCool, and D.C. Yoder. 1997. Predicting soilerosion by water: A guide to conservation planning with the revised universal soil lossequation (RUSLE). Agricultural Handbook No. 703. U.S. Department of Agriculture,Washington, DC.
Richard T., S. Smits. 1998. Management of Bedded-Pack Manure from Swine Hoop Structures:1998 Results. ASL-R1595. 1998 Swine Research Reports. Iowa State UniversityExtension, Ames, IA.
Richard, T., J. Harmon, M. Honeyman, and J. Creswell. 1997. Hoop Structure Bedding Use,Labor, Bedding Pack Temperature, Manure Nutrient Content, and Nitrogen LeachingPotential. ASL-R1499. 1997 Swine Research Reports. Iowa State University Extension,Ames, IA.
Ross, C.C., et al. 1996. Handbook of Biogas Utilization, 2nd ed, U.S. Department of Energy,Southeastern Regional Biomass Energy Progam, Tennessee Valley Authority, MuscleShoals, AL.
Sansinena, M., L.D. Bunting, S.R. Stokes, and E.R. Jordan. 1999. "A survey of trends andrationales for dietary phosphorus recommendations among mid-south dairy nutritionists"
Schmitt, M., and G. Rehm. 1998. Fertilizing Cropland with Poultry Manure. FO-5881-GO. University of Minnesota, St. Paul, Minnesota.
Schmitt, M.A. 1999. Manure management in Minnesota. FO-3553-GO. College of Agricultural,Food, and Environmental Sciences, University of Minnesota Extension Service, St. Paul,Minnesota.
Sharpley, A.N. 1995. Identifying sites vulnerable to phosphorus loss in agricultural runoff.Journal of Environmental Quality, 24(5): 947-951.
Sharpley, A.N., S.C. Chapra, and R. Wedepohl. 1994. Managing agricultural phosphorus forprotection of surface waters: Issues and options. Journal of Environmental Quality, 23(3):437-446.
Sharpley, A.N., T.Daniel, T. Sims, J. Lemunyon, R. Stevens, and R. Parry. 1999. Agriculturalphosphorus and eutrophication. ARS-149. U.S. Department of Agriculture, AgriculturalResearch Service, Pasture Systems & Watershed Management Research Laboratory,University Park, Pennsylvania.
Shih, J. 2000. North Carolina Department of Poultry Science, North Carolina State University,Raleigh, NC. E-mail correspondence. April 6.
Sims, J.T., S. Hodges, and J. Davis. 1998. Principles of soil testing for phosphorus. In SERA-17,Soil testing for phosphorus: Environmental uses and implications, Southern CooperativeSeries Bulletin #389.
Sniffen, C.J., J.D. O'Connor, P.J. Van Soest, D.G. Fox and J.B. Russell. 1992. "A NetCarbohydrate and Protein System for Evaluating Cattle Diets: Ii. Carbohydrate andProtein Availability" J. Anim. Sci. 70: 3562.
Sohail S. and D. Roland. 1999. Phytase Enzyme Proving Helpful to Poultry Producers andEnvironment. Highlight of Agricultural Research. 46(1), Spring 1999. <http://www.ag.auburn.edu /aaes/information/highlights/spring99/phytase.html>.Accessed September 21, 1999.
Steevens, B.J., L.J. Bush, J.D. Stout, and E.I. Williams. 1971. "Effects of varying amounts ofcalcium and phosphorus in rations for dairy cows" J. Dairy Sci. 54:655.
Stevenson, G.R. 1995. Watershed management and control of agricultural critical source areas. In Animal waste and the land-water inteface, K. Steele ed., pp. 273-281, CRC Press, Inc.,Baton Rouge, Louisianna.
8-212
Stokes, S.R. 1999. Addressing Environmental Concerns Associated with the Dairy Industry,Report to the Bosque River Advisory Council, personal collection, July 8.
Stowell, R., D. Elwell, B. Strobel, H. Keener, and T. Menke. 1999. Airflow and Air Qualitywithin a High-Rise™ Hog Facility.
Sutton, A., D. Jones, E. Collins, L. Jacobs, and S. Melvin. 1996. Swine Manure as a PlantResource. PIH-25. Oklahoma State University Cooperative Extension Service,Stillwater, OK. February.
Tammiga, S. 1992. Nutrition management of dairy cows as a contribution to pollution control. J. Dairy Science. 75:345.
Tengman, C.L., H.L. Person, and D.R. Rozeboom. Undated Draft. Immediate liquid-solidseparation of swine manure below slats using sloped pit floors to concentrate phosphorusin the solids. Michigan State University, Department of Animal Science, East Lansing,Michigan.
Terwillger, A.R., and L.S. Crauer. 1975. Liquid Composting Applied to Agricultural Wastes. InManaging Livestock Wastes, pp. 501-505. American Society of Agricultural Engineers,St. Joseph, MI.
UD. 1999. Changes for chicken? New Hybrid Corn Helps Reduce Phosphorus in Poultry Litter.UD scientists report. University of Delaware, August 1999.<http://www.eurekalert.org/releases/udel-cfc0824999.html>. Accessed September 10,1999.
USDA APHIS. 1995. Swine '95 Part I: Reference of 1995 Grower/Finisher Health andManagement. U.S. Department of Agriculture, animal and Plant Health InspectionService, Washington DC. <http://www.aphis.usda.gov/vs/ceah/cahm/>. Filesw95des2.pdf accessed October 15, 1998.
USDA APHIS. 1997. Waste Handling Facilities and Manure Management on U.S. DairyOperations. U.S. Department of Agriculture, Animal and Plant Health InspectionService, Washington DC. <http://www.aphis.usda.gov/vs/ceah/cahm/>. Accessed April4, 2000.
USDA APHIS. 1996a. Environmental Practices/Management by U.S. Pork Producers. Swine‘95 Part II: Reference of 1995 Grower/Finisher Health and Management. U.S.Department of Agriculture, Animal and Plant Health Inspection Service, Washington DC.<http://www.aphis.usda.gov/vs/ceah/cahm/>. Accessed April 4, 2000.
USDA APHIS. 1996b. National Animal Health Monitoring System, Part III: Reference of 1996Dairy Health and Health Management Practices. U.S. Department of Agriculture,
8-213
Animal and Plant Health Inspection Service. Washington, D.C.
USDA APHIS. 1996c. APHIS Info Sheet: Waste Handling Facilities and Manure Managementon U.S. Dairy Operations. U.S. Department of Agriculture, Animal and Plant HealthInspection Service. Washington, D.C.
USDA NAHMS. 2000. Part I: Baseline Reference of Feedlot Management Practices: NationalAnimal Health Monitoring System. May 2000.
USDA NRCS. 1995. Nutrient management for better crops, more profit, and clean water. U.S.Department of Agriculture, Natural Resources Conservation Service, Washington, DC.
USDA NRCS. 2000. Field Office Technical Guide No. IA-208. IA-208. U.S. Department ofAgriculture, Natural Resources Conservation Service. Des Moines, IA. January.
USDA NRCS. 1999. National Handbook of Conservation Practices. U.S. Department ofAgriculture, Natural Resources Conservation Service, Washington, DC.
USDA NRCS. 1998a. Nutrients available from livestock manure relative to crop growthrequirements. U.S. Department of Agriculture, Natural Resources Conservation Service,Washington DC.
USDA NRCS. 1996a. Agricultural waste management field handbook, Part 651. U.S.Department of Agriculture, Natural Resources Conservation Service, Washington, DC.
USDA. 1997. National Range and Pasture Handbook. Chapter 5: Management of GrazingLands. U.S. Department of Agriculture. September 1997.
USEPA. 1999. Unified National Strategy for Animal Feeding Operations. U.S. Department ofAgriculture and U.S. Environmental Protection Agency, Washington, DC.
USEPA. 2000. Cost Model Report for Beef and Dairy Operations Developed for the EffluentLimitations Guidelines. Office of Water, U.S. Environmental Protection Agency,Washington, DC.
Van der Peet-Schwering, C. 1993. Effect microbieel fytase in het voer op de opfokresultatenvan gespeende biggen. Praktijkonderzoek varkenshouderij. Proefstation voor deVarkenshouderij, Rosmalen.
Van Horn, H.H., G.L. Newton and W.E. Kunkle. 1996. "Ruminant nutrition from anenvironmental perspective: factors affecting whole-farm nutrient balance" J. Anim. Sci.
8-214
74: 3082.
Van Horn, H.H., G.L. Newton, R.A. Nordstedt, E.C. French, G. Kidder, D.A. Graetz, and C.F.Chambliss. 1998. Dairy Manure Management: Strategies for Recycling Nutrient toRecover Fertilizer Value and Avoid Environmental Pollution. Florida CooperativeExtension Service, Institute of Food and Agricultural Services, University of Florida,Gainesville.
Van Horn, H.H. 1999. "Options in Managing Manure Phosphorus" Florida Ruminant NutritionSymposium, Gainesville, Florida, Jan 14-15.
Vanschoubroeck, F., L. Coucke, and R. van Spaendonck. 1971. The quantitative effect ofpelleting feed on the performance of piglets and fattening pigs. Nutr. Abstr. Rev. 41:1-9.
Veenhuizen, M.A., D.J. Eckert, K. Elder, J. Johnson, W.F. Lyon, K.M. Mancl, and G. Schnitkey.1999. Ohio livestock manure and wastewater management guide, Bulletin 604, ExtensionService, Ohio State University, Columbus, Ohio.
Vetsch, J. Fertility and Management Issues. Lecture Notes. June 23, 1999. Rippey, Iowa.
Wheaton, H.N. and J.C. Rea. 1999. Forages for Swine. University Extension, University ofMissouri-Columbia, Publication No. G2360.
Wilkinson, S.R. 1992. Nitrogen carryover from broiler litter applied to coastal bermudagrass, IN:National livestock, poultry and aquaculture waste management - proceedings of thenational workshop 29-31 July 1991, Westin Crown Center Hotel, Kansas, Missouri,ASAE publication 03-92, American Society of Agricultural Engineers, St. Joseph, MI,pp. 166-170.
Zhang, Ruihong, Li, Xiujing, Tao, Jun. 1999. Treatment of Dairy Wastewater with SequencingBatch Reactor Systems (ASAE Paper No. 994069), written for presentation at the 1999ASAE Annual International Meeting in Toronto, Canada, July 1999.