Soil salinity is a form of land degradation in which salts accumulate in the soil pro fi le to an extent that plant growth or infrastructure are negatively affected. A range of both fi eld and laboratory procedures exist for measuring soil salinity. In the fi eld, soil salinity is usually inferred from apparent electrical conductivity (EC a ) using a range of devices, depending on the required depth of analysis, or size of the survey area. Field mea-surements of EC a require calibration to the actual salt content by laboratory analysis. In the laboratory, soil salinity is usually assessed by determining either the total soluble salts by evaporation of a soil water extract (TSS), or by determining the electrical conductivity (EC) of either a 1:5 distilled water:soil dilution, or a saturated paste extract. Although procedures for measuring soil salinity appear relatively straightforward, differences in methodology have considerable in fl uence on measured values and interpretation of results.
Soil salinity refers to the presence of soluble salts in soil or soil water at levels that adversely affect plant growth. Globally salinity is predicted to affect 3,230,000 km² ( 1 ) . Salinity can be natural or induced by human activities including clearing of deep rooted veg-etation and use of irrigation. Soil salinity reduces plant growth by a combination of (1) reducing the osmotic potential of the soil solution which limits water uptake by the plant, (2) speci fi c ion toxicity from ions such as sodium, chloride, and boron, and (3) reduced uptake of nutrients. In order to monitor changes in the extent of salt affected land over time or predict the effect of soil salinity on plant growth or crop yield, it is necessary to measure soil salinity in a reliable, repeatable, cost effective manner.
A variety of techniques exist to measure soil salinity. In the fi eld, soil salinity is commonly measured by determination of the
1. Introduction
416 M. Hardie and R. Doyle
apparent electrical conductivity (EC a ) at multiple locations in order to generate a map of apparent electrical conductivity. Laboratory methods for determining soil salinity involve either the determina-tion of total soluble salts (TSS), electrical conductivity (EC) of a soil suspension, or determination of the type and proportion of salt species using spectrophotometers. Advantages and disadvantages of each approach are discussed, as well as procedures for reporting EC values, and procedures for converting EC 1:5 values to an equiv-alent saturated paste value (EC eq ).
Soil salinity may be indirectly measured using a range of devices of which electromagnetic induction (EM) is the most popular ( 2 ) . Electromagnetic induction (EM) uses a transmitting coil to create a magnetic fi eld that penetrates into the soil. The magnetic fi eld creates an electrical current that in turn creates a secondary mag-netic fi eld which is received by the meters receiver coil ( 3 ) . The ratio of the secondary to primary magnetic fi eld is in linear propor-tion to the soil’s apparent electric conductivity (EC a ). Consequently, EC a represents the electrical conductivity of both the soil and water, in which EC a is in fl uenced by salt content, soil porosity, per-meability, moisture content, soil temperature, and clay composition ( 2, 4 ) . Thus, interpretation of EC a values in terms of salt content is non-unique and depends on other assumptions about soil prop-erties. Studies in Australia typically report that between 75% and 90% of EC a values can be explained by total soluble salt content ( 2 ) . Provided that total soil moisture content is greater than 10%, elec-tromagnetic approaches are usually a reliable means for rapid determination of soil salinity ( 5, 6 ) . In topsoils or within the crop root zone EC a is usually determined by EM 38 which operates to a maximum depth of approximately 1.5 m, whilst subsoil EC a is usually measured by EM 31, or down boreholes by EM 39. EM 38 and EM 31 devices may be operated manually or mounted to a vehicle with precision GPS to enable rapid paddock or farm scale mapping. Interpretation of soil salinity from EC a maps requires calibration of EC a values to laboratory determined measurements of electric conductivity (EC 1:5 , EC sp ) from multiple locations and soil depths. Electromagnetic devices may also be mounted behind fi xed wing aircraft or helicopters (AEM). Combined with other devices such as LIDAR, radiometrics, or digital elevation models, AEM enables rapid catchment scale mapping of multiple soil attri-butes and their position in the landscape. Calibration of AEM surveys requires considerable calibration data usually from down borehole induction (EM 39) or electrical depth sounding. Interpretation of AEM surveys requires sop histicated processing, statistical and image processing software. AEM has advantages over standard EM surveys due to its lower cost per hectare, rapid survey of large areas, and the ability to resolve spatial variations in EC a at discrete depth intervals.
1.1. Field Techniques
41728 Measuring Soil Salinity
Soil salinity may be determined in the laboratory by measuring the (1) electrical conductivity (EC) of soil water extracts, (2) soluble ion concentrations of soil water, (3) mass of total dissolved solids (TDS), or total dissolved ions (TDI).
Soil salinity is most commonly measured as electrical conduc-tivity (EC) of a 1:5 soil:distilled water suspension following 1 h of end-over-end mixing. Electrical conductivity is a surrogate mea-sure of salinity in which the salt content of a soil water suspension or a soil water extract is determined by the ability of the extract/suspension to conduct electricity between two metal electrodes accessed as based on the ability of the extract/suspension to con-duct electricity. The more salt in the soil extract or suspension, the more current is conducted between the two electrodes, resulting in higher EC values. Electrical conductivity values increase with increas-ing temperature and this must be corrected for if not measured at 25°C. An approximate correction can be made by increasing the values by 2% for each degree that the ambient temperature is below 25°C, and decreasing when the temperature is above 25°C ( 7 ) .
Soil salinity may also be determined as the total dissolved salts or TDS (mg/L). This is measured by evaporating a known fi ltered volume of water to dryness, then weighing the remaining solid residue. This approach is prone to error resulting from incomplete fi ltration of clay platelets and inclusion of non-saline dissolvable organic compounds in the evaporite ( 8 ) . There is no exact relationship between EC (mS/cm) and TDS (ppm) as the form of the salt spe-cies present infl uences conversion values. However, in water with a high proportion of sodium chloride, one can estimate TDS(ppm) by multiplying EC (mS/cm) by 0.5 – 0.67 ( 7 ) .
Approaches such as EC and TDS are not able to determine the species of ions that contribute to soil salinity. Soil salinity may result from a range of soluble salts, typically the cations Na + , Mg 2+ , and Ca 2+ and the anions Cl − , SO 4
2− , CO 3 2− , and HCO 3
− . Soluble fertilizer also contributes other ions such as K + , NH 4
+ , and NO 3
− . In order to determine the types and relative impor-tance of the different ions that contribute to soil salinity, the sol-uble anion and cation concentrations of soil water extracts need to be determined by approaches such as fl ame-atomic absorption spectroscopy, colorimetric methods, ion chromatography, and titrimetric methods ( 9 ) .
1. Field techniques require access to appropriate electromagnetic devices depending of the scale and depth of the required inves-tigation. Typical EM devices include airborne electromagnetic (AEM), hand held or vehicle mounted EM 38, EM 31, and
1.2. Laboratory Techniques
2. Materials
418 M. Hardie and R. Doyle
down borehole apparatus (EM 39). These are usually provided by specialist consultants or may be purchased directly from suppliers such as Geonics Ltd., Fugro Airborne Surveys, Geophex Ltd., etc.
2. A calibrated EC meter, with temperature sensor or tempera-ture compensation. A number of manufacturers supply suitable EC meters including Hanna instruments, HM Digital, Extech Instruments, Milwauke meters, etc.
3. Calibration solution. Commercially available solutions are typ-ically available at 1.413 dS m −1 and 12.880 dS m −1 , or can be made directly from potassium chloride.
4. Deionized or Distilled Water. The water must have an electri-cal conductivity of <10 −4 dS m −1 , and have a CO 2 concentration not more than that in equilibrium with the atmosphere.
5. 100 mL vials with lid (depending on the quantity of soil required).
6. Shaker, preferably end-over-end shaker. 7. The saturated paste approach will also require a small beaker or
cup for mixing saturated paste and either Buchner funnel with highly retentive fi lter paper and vacuum apparatus or centrifuge.
In the laboratory, soil salinity is commonly measured as the electri-cal conductivity at 25°C from an un fi ltered 1:5 soil:distilled water suspension (EC 1:5 ) ( see Note 2 ).
1. Prepare a 1:5 soil/water suspension. For example, weigh 20.0 g air-dry soil into a vial and add 100 mL deionized water.
2. Mechanically shake (end-over-end preferred) at 25°C in a closed system for 30 min to dissolve soluble salts.
3. Allow about 15 min for the soil to settle. 4. Calibrate the conductivity cell and meter in accordance with
manufacturers’ instructions. 5. If standard solutions are not available, make a 0.010 M potas-
sium chloride reference solution by dissolving 0.7455 g potas-sium chloride (KCl; dried at 110°C for 2 h) and make volume to 1.0 L with CO 2 -free, distilled or deionized water. This solu-tion has an electrical conductivity of 1.413 dS m −1 at 25°C.
6. Dip the conductivity cell into the supernatant, moving it up and down slightly without disturbing the settled soil. Take the reading with the cell stationary when the system has stabilized. Rinse the cell with deionized water between samples and
3. Methods
3.1. EC 1:5 Soil/Water Extract
41928 Measuring Soil Salinity
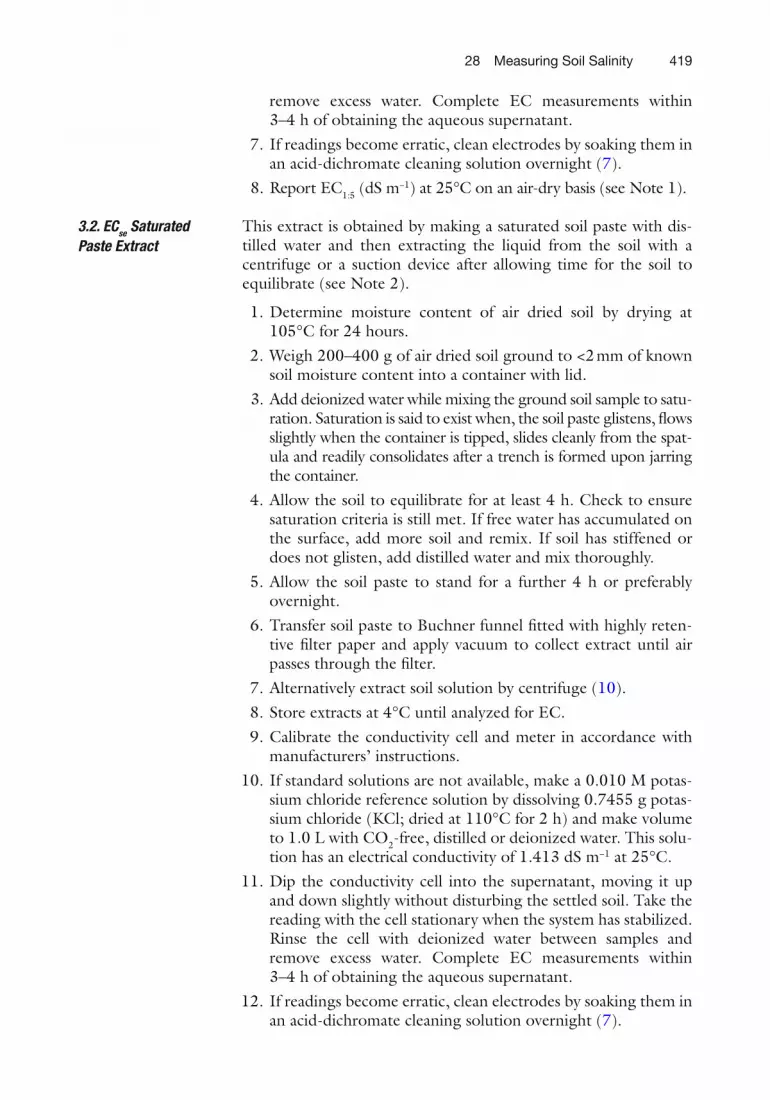
remove excess water. Complete EC measurements within 3–4 h of obtaining the aqueous supernatant.
7. If readings become erratic, clean electrodes by soaking them in an acid-dichromate cleaning solution overnight ( 7 ) .
8. Report EC 1:5 (dS m −1 ) at 25°C on an air-dry basis ( see Note 1 ).
This extract is obtained by making a saturated soil paste with dis-tilled water and then extracting the liquid from the soil with a centrifuge or a suction device after allowing time for the soil to equilibrate ( see Note 2 ).
1. Determine moisture content of air dried soil by drying at 105°C for 24 hours.
2. Weigh 200–400 g of air dried soil ground to <2 mm of known soil moisture content into a container with lid.
3. Add deionized water while mixing the ground soil sample to satu-ration. Saturation is said to exist when, the soil paste glistens, fl ows slightly when the container is tipped, slides cleanly from the spat-ula and readily consolidates after a trench is formed upon jarring the container.
4. Allow the soil to equilibrate for at least 4 h. Check to ensure saturation criteria is still met. If free water has accumulated on the surface, add more soil and remix. If soil has stiffened or does not glisten, add distilled water and mix thoroughly.
5. Allow the soil paste to stand for a further 4 h or preferably overnight.
6. Transfer soil paste to Buchner funnel fi tted with highly reten-tive fi lter paper and apply vacuum to collect extract until air passes through the fi lter.
7. Alternatively extract soil solution by centrifuge ( 10 ) . 8. Store extracts at 4°C until analyzed for EC. 9. Calibrate the conductivity cell and meter in accordance with
manufacturers’ instructions. 10. If standard solutions are not available, make a 0.010 M potas-
sium chloride reference solution by dissolving 0.7455 g potas-sium chloride (KCl; dried at 110°C for 2 h) and make volume to 1.0 L with CO 2 -free, distilled or deionized water. This solu-tion has an electrical conductivity of 1.413 dS m −1 at 25°C.
11. Dip the conductivity cell into the supernatant, moving it up and down slightly without disturbing the settled soil. Take the reading with the cell stationary when the system has stabilized. Rinse the cell with deionized water between samples and remove excess water. Complete EC measurements within 3–4 h of obtaining the aqueous supernatant.
12. If readings become erratic, clean electrodes by soaking them in an acid-dichromate cleaning solution overnight ( 7 ) .
3.2. EC se Saturated Paste Extract
420 M. Hardie and R. Doyle
13. Report EC eq (dS m −1 ) at 25°C on an air-dry basis ( see Note 1 ). 14. If required, saturation percentage can be calculated from the weight
of added water, soil moisture content, and mass of soil ( 9 ) .
1. Reporting results Considerable confusion surrounds the reporting of soil salinity values. It is proposed that the following nomenclature be adopted for reporting soil salinity. Determination of electrical conductivity by un fi ltered soil:water 1:5 dilution as EC 1:5 , deter-mination by saturated paste fi ltered extracts as EC sp , and deter-mination by saturated paste equivalent in which EC 1:5 values are multiplied by a texture coef fi cient as EC eq ( see Note 3 ). The nomenclature EC eq is preferred to EC e in order to remove con-fusion as to whether determination was conducted by texture coef fi cient or saturated paste method.
Historically, electrical conductivity has been measured in micro-mhos per centimeter ( m mho/cm), or in milli-mhos per cen-timeter (mmho/cm), today electrical conductivity is reported in deci-siemens per meter (dS/m), in which one dS/m is equivalent to 1 mmho/cm or 1,000 m S/cm. Salinity may also be measured by TDI in units of mg/L (milligrams/liter) or ppm (parts per mil-lion) ( 8 ) , in which 1 dS/m is approximatly equal to 670 ppm or mg/L of salt depending on the species of ion present in the soil solution. Conversions between units are presented in Table 1 .
4. Notes
Table 1 Conversion (multiply by) of electrical conductivity units and approximate salt concentrations
From/to dS/m mS/m m S/m mS/cm m S/cm TDI mg/L Meq/L
dS/m 1 100 100,000 1 1,000 667 10
mS/m 0.01 1 1,000 0.01 10 6.7 0.1
m S/m 0.00001 0.001 1 0.00001 0.01 0.0067 0.0001
mS/cm 1 100 100,000 1 1,000 667 10
m S/cm 0.001 0.1 100 0.001 1 0.67 0.01
TDI mg/L 0.0015 0.15 150 0.0015 1.5 1 0.015
Meq/L 0.1 10 10,000 0.1 100 66.7 1
TDI total dissolved ions (note conversion is approx and based on the composition of seawater), Meq / L milliequivalent per Liter
42128 Measuring Soil Salinity
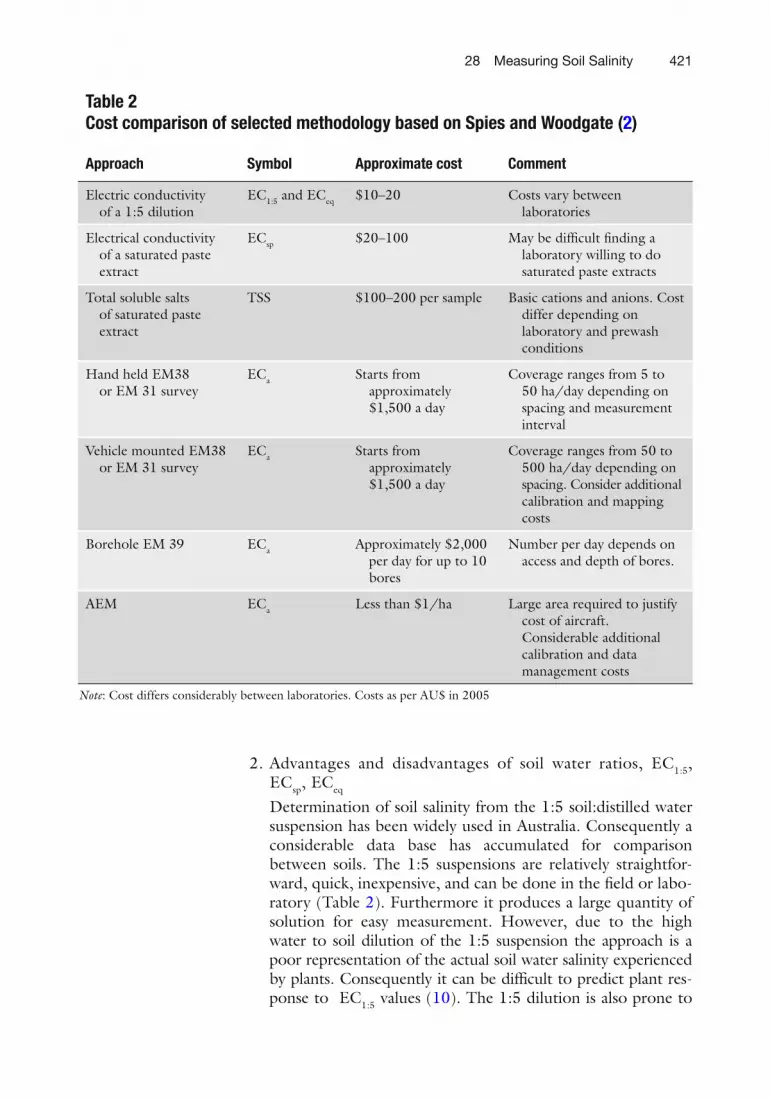
2. Advantages and disadvantages of soil water ratios, EC 1:5 , EC sp , EC eq Determination of soil salinity from the 1:5 soil:distilled water suspension has been widely used in Australia. Consequently a considerable data base has accumulated for comparison between soils. The 1:5 suspensions are relatively straightfor-ward, quick, inexpensive, and can be done in the fi eld or labo-ratory (Table 2 ). Furthermore it produces a large quantity of solution for easy measurement. However, due to the high water to soil dilution of the 1:5 suspension the approach is a poor representation of the actual soil water salinity experienced by plants. Consequently it can be dif fi cult to predict plant res-ponse to EC 1:5 values ( 10 ) . The 1:5 dilution is also prone to
Table 2 Cost comparison of selected methodology based on Spies and Woodgate ( 2 )
Approach Symbol Approximate cost Comment
Electric conductivity of a 1:5 dilution
EC 1:5 and EC eq $10–20 Costs vary between laboratories
Electrical conductivity of a saturated paste extract
EC sp $20–100 May be dif fi cult fi nding a laboratory willing to do saturated paste extracts
Total soluble salts of saturated paste extract
TSS $100–200 per sample Basic cations and anions. Cost differ depending on laboratory and prewash conditions
Hand held EM38 or EM 31 survey
EC a Starts from approximately $1,500 a day
Coverage ranges from 5 to 50 ha/day depending on spacing and measurement interval
Vehicle mounted EM38 or EM 31 survey
EC a Starts from approximately $1,500 a day
Coverage ranges from 50 to 500 ha/day depending on spacing. Consider additional calibration and mapping costs
Borehole EM 39 EC a Approximately $2,000 per day for up to 10 bores
Number per day depends on access and depth of bores.
AEM EC a Less than $1/ha Large area required to justify cost of aircraft. Considerable additional calibration and data management costs
Note : Cost differs considerably between laboratories. Costs as per AU$ in 2005
422 M. Hardie and R. Doyle
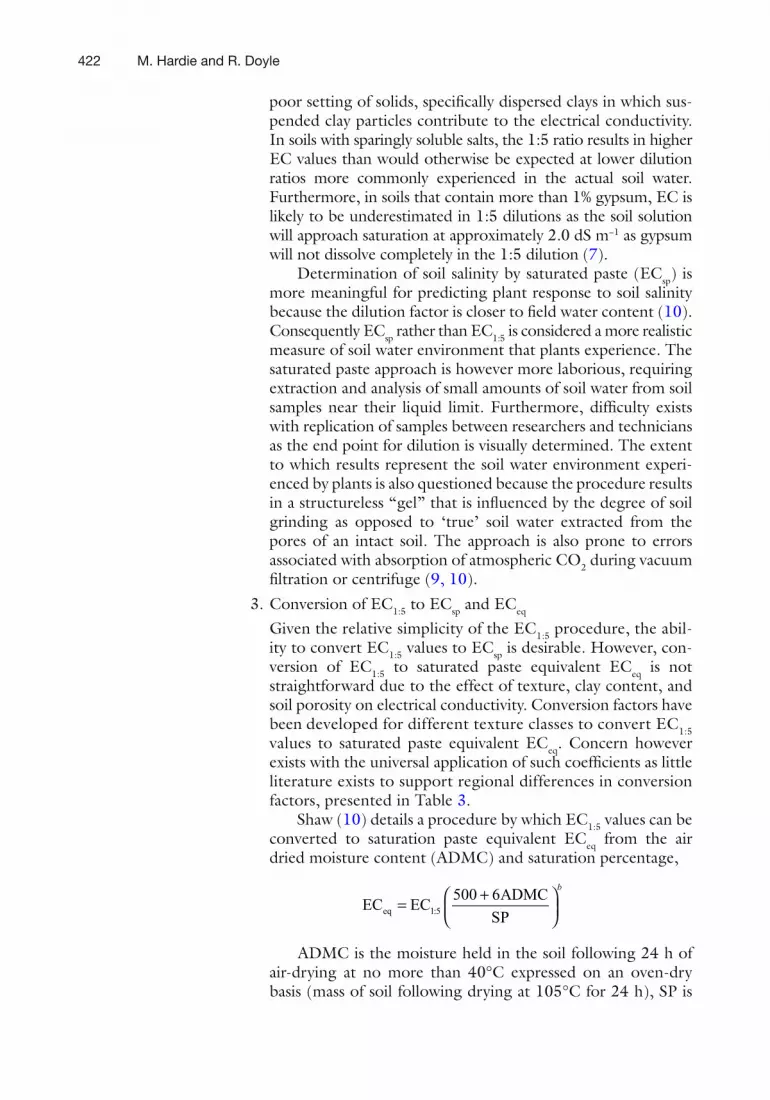
poor setting of solids, speci fi cally dispersed clays in which sus-pended clay particles contribute to the electrical conductivity. In soils with sparingly soluble salts, the 1:5 ratio results in higher EC values than would otherwise be expected at lower dilution ratios more commonly experienced in the actual soil water. Furthermore, in soils that contain more than 1% gypsum, EC is likely to be underestimated in 1:5 dilutions as the soil solution will approach saturation at approximately 2.0 dS m −1 as gypsum will not dissolve completely in the 1:5 dilution ( 7 ) .
Determination of soil salinity by saturated paste (EC sp ) is more meaningful for predicting plant response to soil salinity because the dilution factor is closer to fi eld water content ( 10 ) . Consequently EC sp rather than EC 1:5 is considered a more realistic measure of soil water environment that plants experience. The saturated paste approach is however more laborious, requiring extraction and analysis of small amounts of soil water from soil samples near their liquid limit. Furthermore, dif fi culty exists with replication of samples between researchers and technicians as the end point for dilution is visually determined. The extent to which results represent the soil water environment experi-enced by plants is also questioned because the procedure results in a structureless “gel” that is in fl uenced by the degree of soil grinding as opposed to ‘true’ soil water extracted from the pores of an intact soil. The approach is also prone to errors associated with absorption of atmospheric CO 2 during vacuum fi ltration or centrifuge ( 9, 10 ) .
3. Conversion of EC 1:5 to EC sp and EC eq Given the relative simplicity of the EC 1:5 procedure, the abil-ity to convert EC 1:5 values to EC sp is desirable. However, con-version of EC 1:5 to saturated paste equivalent EC eq is not straightforward due to the effect of texture, clay content, and soil porosity on electrical conductivity. Conversion factors have been developed for different texture classes to convert EC 1:5 values to saturated paste equivalent EC eq . Concern however exists with the universal application of such coef fi cients as little literature exists to support regional differences in conversion factors, presented in Table 3 .
Shaw ( 10 ) details a procedure by which EC 1:5 values can be converted to saturation paste equivalent EC eq from the air dried moisture content (ADMC) and saturation percentage,
eq 1:5
500 6ADMCEC EC
SP
b+⎛ ⎞= ⎜ ⎟⎝ ⎠
ADMC is the moisture held in the soil following 24 h of air-drying at no more than 40°C expressed on an oven-dry basis (mass of soil following drying at 105°C for 24 h), SP is
1. Brinkman R (1980) Saline and sodic soils. In: Land reclamation and water management. International Institute for Land Reclamation and Improvement (ILRI), Wageningen, The Netherlands, pp 62–68
2. Spies B, Woodgate P (2005) Salinity mapping methods in the Australian context. Department of the Environment and Heritage; and Agriculture, Fisheries and Forestry, Australia
4. Cook PG, Walker GR, Buselli G, Potts I, Dodds AR (1992) The application of electro-magnetic techniques to groundwater recharge investigations. J Hydrol 130:201–229
5. Williams BG, Baker GC (1982) An electromag-netic induction technique for reconnaissance surveys of soil salinity hazards. Aus J Soil Res 20:107–118
6. McFarlane DJ, George RJ (1992) Factors affecting dryland salinity in two wheatbelt catchments in Western Australia. Aus J Soil Res 30:85–100
7. Rayment GE, Higginson FR (1992) Australian laboratory handbook of soil and water chem-ical methods. Inkata Press, Melbourne
8. Watling K (2007) Measuring salinity, in facts, land series, L137. Natural Resources and Water, Queensland
9. Miller JJ, Curtin D (2008) Chapter 15: electrical conductivity and soluble ions. In: Carter MR, Gregorich EG (eds) Soil sampling and methods of analysis, 2nd edn. Canadian Society of Soil Science, CRC Press, Boca Raton, pp 161–171
10. Shaw RJ (2001) Soil salinity—electrical con-ductivity and chloride. In: Peverill KI, Sparrow LA, Reuter RJ (eds) Soil analysis, an interpre-tation manual. CSIRO Publishing, Melbourne, pp 129–145
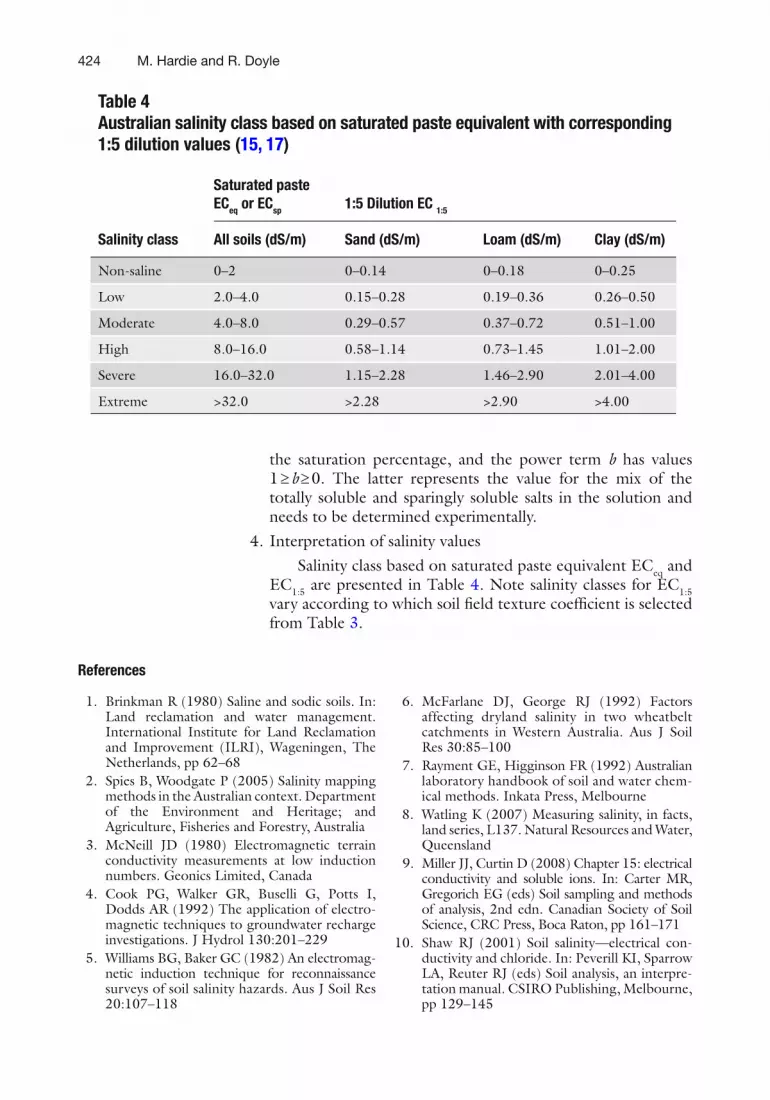
Table 4 Australian salinity class based on saturated paste equivalent with corresponding 1:5 dilution values ( 15, 17 )
Salinity class All soils (dS/m) Sand (dS/m) Loam (dS/m) Clay (dS/m)
Non-saline 0–2 0–0.14 0–0.18 0–0.25
Low 2.0–4.0 0.15–0.28 0.19–0.36 0.26–0.50
Moderate 4.0–8.0 0.29–0.57 0.37–0.72 0.51–1.00
High 8.0–16.0 0.58–1.14 0.73–1.45 1.01–2.00
Severe 16.0–32.0 1.15–2.28 1.46–2.90 2.01–4.00
Extreme >32.0 >2.28 >2.90 >4.00
the saturation percentage, and the power term b has values 1 ³ b ³ 0. The latter represents the value for the mix of the totally soluble and sparingly soluble salts in the solution and needs to be determined experimentally.
4. Interpretation of salinity values Salinity class based on saturated paste equivalent EC eq and
EC 1:5 are presented in Table 4 . Note salinity classes for EC 1:5 vary according to which soil fi eld texture coef fi cient is selected from Table 3 .
References
42528 Measuring Soil Salinity
11. McMahon S, Bell I (1992) Saltpak Tasmania: an information package, Department of Primary Industry and Fisheries Tasmania, National Soil Conservation Program, Landcare Tasmania
12. Gibbs S (2000) How to texture soils and test for salinity, in salinity notes, p 4, NSW Agriculture—Salt Action, No 8, October
13. Taylor S. (1993) Dryland salinity—introductory extension notes. Department of Conservation and Land Management, Bathurst, New South Wales
14. Barrett-Lennard EG (2003) Saltland pastures in Australia: a practical guide, 2nd edn. Land,
water and wool sustainable grazing on saline lands sub-program
15. Land and Water Australia (2009) Saltland solutions, options for saltland restoration, Future Farm Industries CRC, Land Water and Wool SGSL, Canberra, ACT
16. Slavich PG, Petterson GH (1993) Estimating the electrical conductivity of saturated paste extracts from 1:5 soil, water suspensions and texture. Aus J Soil Res 31:73–81
17. Nichols P, Barrett-Lennard EG, Bennett S (2010) Pasture legumes and grasses for salt-land, in Farmnote. Department of Agriculture and Food, Western Australia