BioOne sees sustainable scholarly publishing as an inherently collaborative enterprise connecting authors, nonprofit publishers, academic institutions, research libraries, and research funders in the common goal of maximizing access to critical research. Radiolarian biodiversity dynamics through the Triassic and Jurassic: implications for proximate causes of the end-Triassic mass extinction Author(s): Ádám T. Kocsis, Wolfgang Kiessling, and József Pálfy Source: Paleobiology, 40(4):625-639. 2014. Published By: The Paleontological Society DOI: http://dx.doi.org/10.1666/14007 URL: http://www.bioone.org/doi/full/10.1666/14007 BioOne (www.bioone.org ) is a nonprofit, online aggregation of core research in the biological, ecological, and environmental sciences. BioOne provides a sustainable online platform for over 170 journals and books published by nonprofit societies, associations, museums, institutions, and presses. Your use of this PDF, the BioOne Web site, and all posted and associated content indicates your acceptance of BioOne’s Terms of Use, available at www.bioone.org/page/ terms_of_use . Usage of BioOne content is strictly limited to personal, educational, and non-commercial use. Commercial inquiries or rights and permissions requests should be directed to the individual publisher as copyright holder.
Transcript
BioOne sees sustainable scholarly publishing as an inherently collaborative enterprise connecting authors, nonprofitpublishers, academic institutions, research libraries, and research funders in the common goal of maximizing access tocritical research.
Radiolarian biodiversity dynamics through the Triassic andJurassic: implications for proximate causes of the end-Triassicmass extinctionAuthor(s): Ádám T. Kocsis, Wolfgang Kiessling, and József PálfySource: Paleobiology, 40(4):625-639. 2014.Published By: The Paleontological SocietyDOI: http://dx.doi.org/10.1666/14007URL: http://www.bioone.org/doi/full/10.1666/14007
BioOne (www.bioone.org) is a nonprofit, online aggregation of core research in thebiological, ecological, and environmental sciences. BioOne provides a sustainable onlineplatform for over 170 journals and books published by nonprofit societies, associations,museums, institutions, and presses.
Your use of this PDF, the BioOne Web site, and all posted and associated contentindicates your acceptance of BioOne’s Terms of Use, available at www.bioone.org/page/terms_of_use.
Usage of BioOne content is strictly limited to personal, educational, and non-commercialuse. Commercial inquiries or rights and permissions requests should be directed to theindividual publisher as copyright holder.
Radiolarian biodiversity dynamics through the Triassic andJurassic: implications for proximate causes of the end-Triassicmass extinction
Adam T. Kocsis, Wolfgang Kiessling, and Jozsef Palfy
Abstract.—Within a ~60-Myr interval in the Late Triassic to Early Jurassic, a major mass extinction tookplace at the end of Triassic, and several biotic and environmental events of lesser magnitude have beenrecognized. Climate warming, ocean acidification, and a biocalcification crisis figure prominently inscenarios for the end-Triassic event and have been also suggested for the early Toarcian. Radiolarians,as the most abundant silica-secreting marine microfossils of the time, provide a control group againstmarine calcareous taxa in testing selectivity and responses to changing environmental parameters. Weanalyzed the origination and extinction rates of radiolarians, using data from the PaleobiologyDatabase and employing sampling standardization, the recently developed gap-filler equations and animproved stratigraphic resolution at the substage level. The major end-Triassic event is well-supportedby a late Rhaetian peak in extinction rates. Because calcifying and siliceous organisms appear similarlyaffected, we consider global warming a more likely proximate trigger of the extinctions than oceanacidification. The previously reported smaller events of radiolarian turnover fail to register abovebackground levels in our analyses. The apparent early Norian extinction peak is not significantcompared to the long-term trajectory, and is probably a sampling artifact. The Toarcian Oceanic AnoxicEvent, previously also thought to have caused a significant radiolarian turnover, did not significantlyaffect the group. Radiolarian diversity history appears unique and complexly forced, as its trajectoryparallels major calcareous fossil groups at some events and deviates at others.
Adam T. Kocsis and Jozsef Palfy. MTA-MTM-ELTE Research Group for Paleontology and Department ofPhysical and Applied Geology, Eotvos University, Pazmany Peter setany 1/C, Budapest, H-1117 Hungary.E-mail: [email protected], [email protected]
Accepted: 4 April 2014Published online: 31 July 2014Supplemental materials deposited at Dryad: doi:10.5061/dryad.31g77
Introduction
The Late Triassic–Early Jurassic interval wasa period of major changes in the Earth system,including the end-Triassic extinction event andseveral others of lesser magnitude. Severeenvironmental changes led to the extinctionof various marine organisms and reef crises.However, the causes and mechanisms remaincontroversial, and the geographical and tem-poral extents of these events are not adequate-ly constrained.
Recent studies concerning the end-Triassicmass extinction demonstrated that extremegreenhouse warming and ocean acidificationmay have played a substantial role (McElwainet al. 1999; Hautmann et al. 2008; Kiesslingand Simpson 2011; Steinthorsdottir et al. 2011;Greene et al. 2012; Honisch et al. 2012). Ifocean acidification was a dominant cause of
the extinctions, radiolarians, as organismswith a siliceous test, may have been substan-tially less affected than organisms secretingcalcium carbonate. On the basis of Sepkoski’s(2002) compendium, Hautmann et al. (2008)have suggested that radiolarians were indeedonly marginally affected by this crisis.
The rich fossil record of radiolarians is well-suited for global diversity analyses. However,the radiolarian range data of Sepkoski (2002)are rather outdated and some radiolarianworkers maintain that the group was seriouslyhit by the end-Triassic event (Carter and Hori2005). A recent sampling-standardized analy-sis of the radiolarian fossil record from theLate Permian to Late Jurassic concluded thatalthough Rhaetian extinction rates were high-er than in Sepkoski’s compendium, there is noevidence for an end-Triassic mass extinction(Kiessling and Danelian 2011). Instead, the
� 2014 The Paleontological Society. All rights reserved. 0094-8373/14/4004-0007/$1.00
Paleobiology, 40(4), 2014, pp. 625–639DOI: 10.1666/14007
end-Triassic extinctions fall within the back-ground of generally elevated Triassic extinc-tion rates.
Large Databases vs. Section-based Studies.—Because of the focus on the potential massextinction horizon, the best radiolarian-bear-ing localities (the Haida Gwaii [formerlyQueen Charlotte Islands] in Canada and theInuyama sections in Japan) are probably muchbetter sampled at the Triassic/Jurassic bound-ary (TJB) than at other intervals. AlthoughCarter and Hori (2005) stated that substantialturnover occurred at the TJB, this in itselfcannot inform us about the relative magnitudeof such a turnover compared to other events,possibly occurring at other stage boundaries.Continuous sections ranging through the TJBare very scarce and most of them lack thedetail of lithological and paleontological evi-dence that properly document the short-termvariations related to the environmental distur-bance.
Renaudie and Lazarus (2013) argued thatfor applications of diversity analyses inpaleoenvironmental reconstructions, datacompilations such as the Paleobiology Data-base (PaleoDB) might not be useful, becausethe resolution of the time series is not fineenough. The average duration of time slices inour study is much longer than their preferred100 Kyr, which cannot be attained at the TJBowing to the nature of the geologic record. Afiner stratigraphic resolution could beachieved by computer-aided sequencing ofevents (Sadler 2004), but data from even thebest studied fossil localities (such as HaidaGwaii) are compilations of partial sections,where most of the radiolarian-bearing samplesare limestone nodules in fine-grained silici-clastic sedimentary rocks. Moreover, unbinneddata are not suitable for sampling standardi-zation.
Smaller Events.—The Late Triassic–EarlyJurassic interval includes other, smaller bioticand environmental events, whose character-ization may be aided by studying radiolariandiversity patterns. O’Dogherty (2010) claimedthat radiolarians suffered significant extinc-tions in the Early Norian substage, which havenot been quantitatively assessed before, norhave they been correlated to changes in any
environmental parameter. On the other hand,the much-studied early Toarcian OceanicAnoxic Event (Jenkyns 2010) and the relatedsecond-order extinction is said to be manifest-ed in elevated radiolarian turnover. Hori(1997) described a Toarcian radiolarian eventfrom bedded cherts of Japan, but this has notbeen confirmed from elsewhere, and a distinctextinction peak is not evident at the stage level(Kiessling and Danelian 2011).
Here we reassess radiolarian turnover ratesfrom the Triassic to the earliest Cretaceous,using a finer, substage-level stratigraphicresolution in the Late Triassic–Early Jurassic(Carnian–Toarcian) interval and a novel taxo-nomic (origination and extinction) rate calcu-lation method, the ‘‘gap-filler’’ equations(Alroy 2014). Extinction and origination ratesof radiolarians are then compared with thoseof major calcareous marine invertebrate fossilgroups, in order to test the ocean acidificationhypothesis, which predicts that a biocalcifica-tion crisis preferentially affects marine calci-fiers over silica-secreting organisms.
Data
Data Download and Taxonomic Revision.—Radiolarian occurrence data of the Capitanian(Middle Permian) to Albian (mid-Cretaceous)interval were downloaded from the PaleoDBon December 16, 2013 and comprise 2144fossil collections, each usually representingmicrofossils extracted from a single hand-sample. This data set is similar to the oneused for a previous analysis (Kiessling andDanelian 2011) but has been supplemented byabout 800 collections from more than 40references. Genus occurrences marked as‘‘aff.’’ or ‘‘cf.’’, and those with quotation markswere excluded. For comparison, we have alsodownloaded occurrences of major benthicmarine invertebrate groups with calcareousskeletons (bivalves, brachiopods, corals, cal-careous sponges, gastropods).
Until recently, Mesozoic radiolarian datawere not appropriate for turnover analysisbecause their taxonomy was unstandardizedeven at the genus level and the speciesconcepts varied among taxonomists. To en-hance the taxonomic robustness of the dataset, we have entered taxonomic opinions from
626 ADAM T. KOCSIS ET AL.
recent monographs (Gorican et al. 2006;O’Dogherty et al. 2009a,b) to correct olderoccurrence entries automatically. We have alsoapplied the same additional taxonomic cor-rections to the downloaded data that wereperformed in the previous study (Kiesslingand Danelian 2011) (see Appendix).
Stratigraphic Resolution.—The default strati-graphic resolution of the PaleoDB is thegeologic stage, also used in the analyses byKiessling and Danelian (2011). To achieve ahigher resolution in our focus interval, most ofthe 785 Late Triassic to Early Jurassic radio-larian collections were assigned to substages,on the basis of additional stratigraphic infor-mation gleaned from the original references.This resulted in a finer and more uniformstratigraphic resolution in terms of bin dura-tion, with the average length of the time sliceslowered from 6.4 to 5.1 Myr, and theirstandard deviation from 3.9 to 2.6 Myr.
We used the generally accepted substagesfor the Carnian to Toarcian stages (Gradsteinet al. 2012) except for the short Hettangianstage. In addition, we subdivided the Rhaetianinto two units, to assess the assumption thatextinctions were concentrated near the TJB.Following Lucas (2002), we distinguished theParacochloceras amoenum and Choristocerascrickmayi ammonite zones, which correspondto the Proparvicingula moniliformis and Globo-laxtorum tozeri radiolarian zones suggested byCarter (1993), as the two subunits of theRhaetian. On the other hand, to increase datadensity, we combined the Early Triassic stagesand the middle and late Toarcian substagesinto one time slice each.
We excluded any occurrence data that couldnot be assigned to a single interval of ourstage/substage timescale (Table 1). Althoughthis loss of data is substantial in the substage-level part of the series, its effects on biodiver-sity dynamics are minor in this case (seeAppendix) and there is no substantial changein the overall pattern of extinction rates at thestage level when compared with the results ofKiessling and Danelian (2011).
Methods
Rate Estimation.—Because traditional com-pilations (Sepkoski 2002) utilized first and last
appearance data, the most widely used meth-ods to assess originations and extinctions arebased on stratigraphic ranges (i.e., Foote2000). Foote’s (2000) per capita, range-basedestimates remained the ‘‘industry standard’’ inthe calculation of origination and extinctionrates. However, because occurrence-baseddata sets are becoming increasingly availableand simple range-metrics cannot be correctedfor heterogeneous sampling intensity, occur-rence-based counting and standardizationmethods (Alroy 2010c, 2014) are increasinglybeing used to estimate fossil turnover rates.We chose to apply the modified three-timermetrics proposed by Alroy (2008, 2014), whichare suited for sampling-standardization andavoid edge effects that usually create abackward smearing of extinction rates andforward smearing of origination rates.
A recent modification of the three-timermetrics is the gap-filler equation (Alroy 2014).Rates are calculated from recorded occurrencedata and use a four time-slice window, as dothe corrected three-timer rates, but because ofthe different categorization of taxon counts,they are more robust for smaller data sets andlower sampling completeness values. The gap-filler extinction rates are calculated as
l ¼ log ð2ti þp tiÞ=ð3ti þp ti þu giÞh i
ð1Þ
and the origination rates as
k ¼ log ð2tiþ1 þp tiÞ=ð3ti þp ti þd giÞh i
; ð2Þ
where 3ti is the number of three-timer taxa thathave occurrences in the focal bin as well as thetime slice preceding and following it, 2ti is thenumber of two-timer taxa that have recordedoccurrence in time slices i and i�1,and pti is thenumber of part-timers, the number of taxa thatare not present in interval i, but occur in boththe previous and following time slices. Thenovelty in these equations is the utilization ofthe gap-filler category, which in the case ofextinctions (ugi) contains taxa that occur intime slices i�1, iþ2 but are absent in bin iþ1. Inthe case of originations, dgi is the mirror imageof ugi, containing the number of taxa present intime slice iþ1 and i�2 but absent in i�1.
LATE TRIASSIC–EARLY JURASSIC RADIOLARIANS 627
Other rate metrics such as the per capita
rates of Foote (2000) and the corrected three-
timer rates of Alroy (2008) were also calculat-
ed for comparison, which allowed us to
compare results obtained with three different
taxonomic rate metrics. The performance of
the gap-filler approach was deemed appropri-
ate for this study, because it combines the
advantages of occurrence-based methods with
the wider applicability of range-based ap-
proaches.
The time series of extinction rates contains a
substantial amount of noise due to the
incomplete sampling of the fossil record.
Because the three-timer method uses only a
subset of the available data, in the case of
smaller data sets, it amplifies the noise in the
series which might result in negative rate
values when the binomial error is high (J.
Alroy personal communication 2013). The
gap-filler method utilizes more information
resulting in less noise and fewer incidences of
negative rate values.
Sampling Standardization.—The gap-filler
equations require the three-timer sampling
completeness (Alroy 2008) to be as even as
possible (Alroy 2014), which is best accom-
plished by using classical rarefaction (CR;
Raup 1975), an approach followed in this
study. The genus richness was estimated by
using the geometric means of genus counts in
the individual subsampling trials with the
applied target quota of 54 genus occurrences.
This low quota is necessary to achieve
complete time series. An increase of the
subsampling quota did only marginally
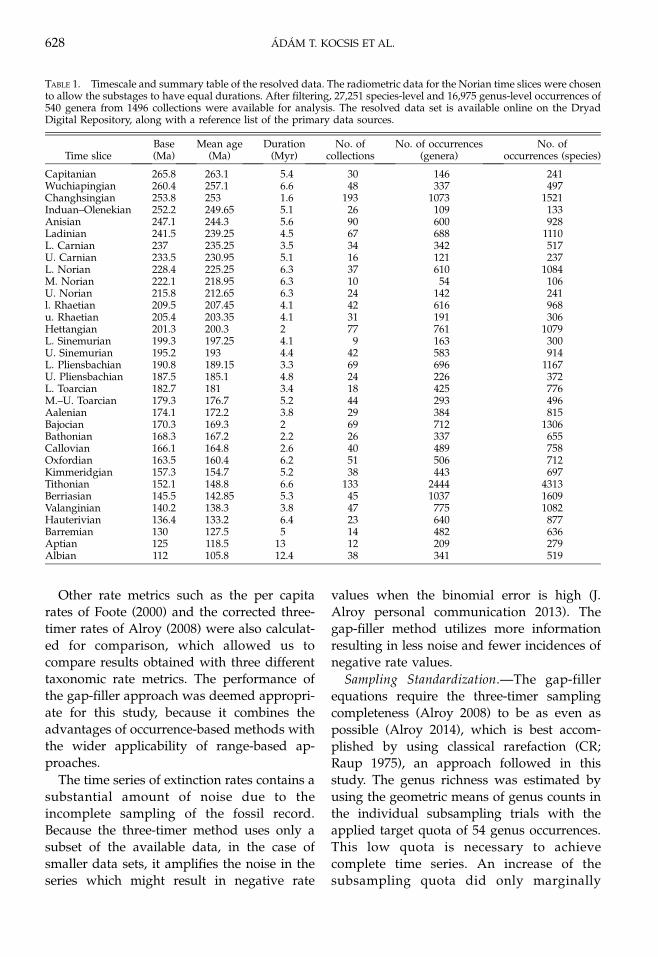
TABLE 1. Timescale and summary table of the resolved data. The radiometric data for the Norian time slices were chosento allow the substages to have equal durations. After filtering, 27,251 species-level and 16,975 genus-level occurrences of540 genera from 1496 collections were available for analysis. The resolved data set is available online on the DryadDigital Repository, along with a reference list of the primary data sources.
change the results in the less complete timeseries. We used a high number of 1500iterations to ensure stability of the subsampledrates.
For comparison, we have also computed thetaxonomic rates using Shareholder QuorumSubsampling (SQS; Alroy 2010a,b,c) with thetargeted quorum of 0.6, and by-list occurrenc-es weighted (OW) subsampling (Alroy et al.2001), with the same quota as for CR.
Hypothesis Testing and Model Selection.—Allcorrelation tests were performed using Spear-man’s rank-order correlation. Time-series datawere first detrended by applying generalizeddifferencing (McKinney and Oyen 1989; Kies-sling 2005) to remove significant autocorrela-tions. The expanded set of rate calculationmethods makes the comparison of differenttaxa difficult. We regard correlations as sig-nificant only when they are significant usingboth the per-capita and the gap-filler rates,thus we take into account both an occurrence-and a range-based method. Because thesignificance thresholds need to be adjusted inmultiple comparisons, in such cases weapplied a classical one-stage false discoveryrate method (Pike 2011) to test the significanceof the p-values.
Akaike weights calculated from the correct-ed Akaike Information Criterion (Burnhamand Anderson 2002) were used to evaluate therelative support of turnover models and therobustness of order-specific extinction ratecalculations for the selectivity tests (Kiesslingand Simpson 2011). We used the lm and thenls2 R functions (from the stats and nls2packages, respectively) to calculate the log-likelihoods of the various regression models oftaxonomic rates. Selectivity of extinctions canbe stated only if the model supportingindividual extinction rates of the two groupsin question (two-rate model) differs signifi-cantly from a one-rate model. The ratio of theweights expresses the relative likelihood of theevaluated models (Burnham and Anderson2002), and we treated the evidence as strongenough to accept a model when the ratio ofthe weights exceeded 8 (Wagner et al. 2006).All analyses were performed using the Rprogramming language and software environ-ment (R Development Core Team 2013).
Results
Triassic–Jurassic Radiolarian Turnover Rates
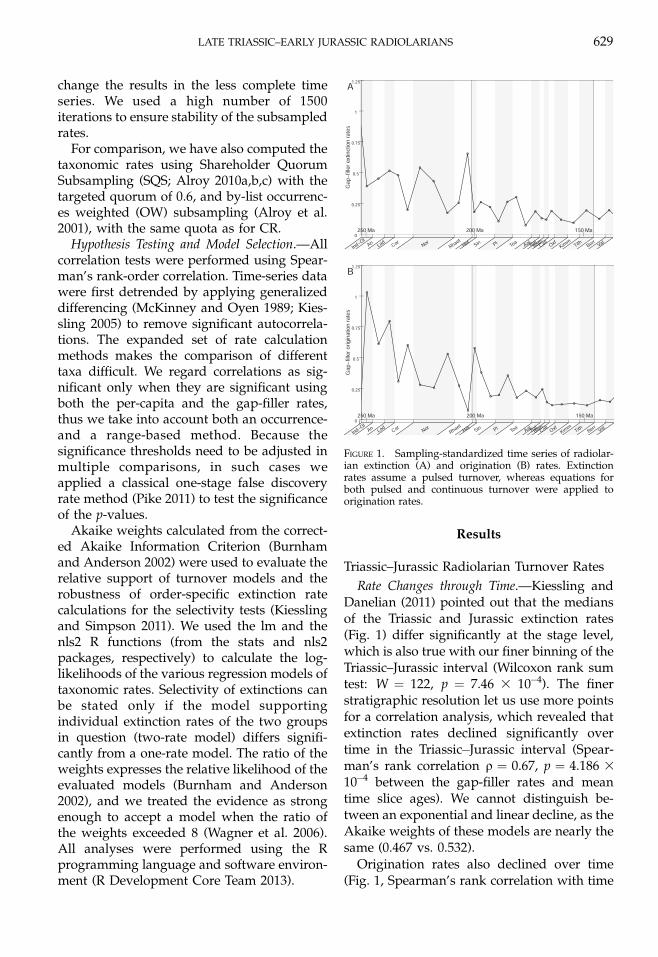
Rate Changes through Time.—Kiessling andDanelian (2011) pointed out that the mediansof the Triassic and Jurassic extinction rates(Fig. 1) differ significantly at the stage level,which is also true with our finer binning of theTriassic–Jurassic interval (Wilcoxon rank sumtest: W ¼ 122, p ¼ 7.46 3 10�4). The finerstratigraphic resolution let us use more pointsfor a correlation analysis, which revealed thatextinction rates declined significantly overtime in the Triassic�Jurassic interval (Spear-man’s rank correlation q ¼ 0.67, p ¼ 4.186 3
10�4 between the gap-filler rates and meantime slice ages). We cannot distinguish be-tween an exponential and linear decline, as theAkaike weights of these models are nearly thesame (0.467 vs. 0.532).
Origination rates also declined over time(Fig. 1, Spearman’s rank correlation with time
FIGURE 1. Sampling-standardized time series of radiolar-ian extinction (A) and origination (B) rates. Extinctionrates assume a pulsed turnover, whereas equations forboth pulsed and continuous turnover were applied toorigination rates.
LATE TRIASSIC–EARLY JURASSIC RADIOLARIANS 629
q ¼ 0.79, p ¼ 4.794 3 10�6 with the gap filler
rates) and their overall trajectory is similar to
that of extinctions, but Akaike weights sup-
port an exponential model better (0.925 vs.
0.075).
Magnitude of the End-Triassic Extinction.—
The extinction rate of the late Rhaetian time
slice is above the confidence interval of the
point estimates of both the linear and the
exponential regression (see Supplementary
Materials), and it is over the 97.5% critical
value of the detrended extinction rates (as-
suming normality, Shapiro-Wilk W¼ 0.9183, p¼ 0.053 detrended with a linear model),
regardless of the function used to detrend
the data (Fig. 2). Although it is possible that
the late Rhaetian value is part of the log-
normal distribution of detrended rates (W ¼0.9708, p ¼ 0.6869 with a linear function),
similarly to the great Phanerozoic extinctions
(Alroy 2008), the relative magnitude of this
peak suggests that a significant extinction
event occurred in the last time slice of the
Triassic.
Extinction Selectivity at the Triassic/JurassicBoundary.—Although a higher proportion of
spumellarian (24%) than nassellarian genera
(17%) have their last occurrences in the late
Rhaetian, there is no statistical support for
selective extinctions in the raw data, as a
single rate model for the late Rhaetian is better
supported (Akaike weights for the single and
dual rate models: 0.73 and 0.27, respectively).
Ecological selectivity could not be tested
because we know too little of Mesozoicradiolarian ecology.
Originations near the Triassic/Jurassic Bound-ary.—Although the drop in originations is notsignificant in the Late Triassic, the relativelylower rate values are noteworthy. The phe-
nomenon that low origination rates of marineinvertebrates characterized the interval pre-ceding the end-Triassic biotic crisis is widelyrecognized (Bambach et al. 2004; Alroy 2008),
and our results suggest that radiolarians showa similar pattern.
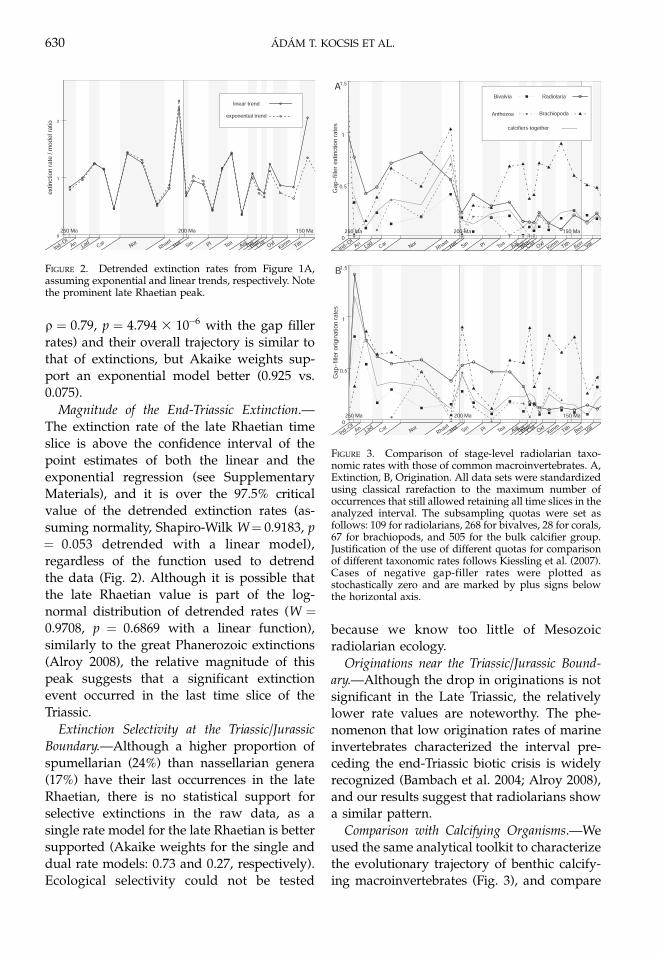
Comparison with Calcifying Organisms.—We
used the same analytical toolkit to characterizethe evolutionary trajectory of benthic calcify-ing macroinvertebrates (Fig. 3), and compare
FIGURE 2. Detrended extinction rates from Figure 1A,assuming exponential and linear trends, respectively. Notethe prominent late Rhaetian peak.
FIGURE 3. Comparison of stage-level radiolarian taxo-nomic rates with those of common macroinvertebrates. A,Extinction, B, Origination. All data sets were standardizedusing classical rarefaction to the maximum number ofoccurrences that still allowed retaining all time slices in theanalyzed interval. The subsampling quotas were set asfollows: 109 for radiolarians, 268 for bivalves, 28 for corals,67 for brachiopods, and 505 for the bulk calcifier group.Justification of the use of different quotas for comparisonof different taxonomic rates follows Kiessling et al. (2007).Cases of negative gap-filler rates were plotted asstochastically zero and are marked by plus signs belowthe horizontal axis.
630 ADAM T. KOCSIS ET AL.
it with that of radiolarians (for a detailedanalysis of calcifiers, see Kiessling and Aber-han 2007 and Kiessling et al. 2007). Because asubstage stratigraphic resolution could not beachieved for the great majority of macroinver-tebrate occurrences we compare rates at thestage level.
Taxonomic rates of radiolarians are higherthan those of benthic calcifiers, among whichbivalves exhibit the lowest turnover rates. Theoverall trajectories of origination rates ofcalcifiers are similar to those of radiolarians,but only bivalves exhibit a similar decline overtime (Table 2), regardless of the rate metrics.Radiolarians are the only group for whichextinction rates decline significantly over theTriassic–Jurassic interval.
Per capita rates tend to have better correla-tions than the gap-filler rates between therates of different groups (Table 3), andextinction rates among taxa are better corre-lated than origination rates. Extinction rates ofbivalves are correlated with those of bothbrachiopods and radiolarians. At the stagelevel, radiolarians have slightly lower extinc-tion rates than the pooled calcifiers, but theevidence for differing values is not strongenough to support selectivity (0.32 is theAkaike weight for the single, 0.68 for the dualrate model).
Resolution-dependence of the Patterns.—Thetrajectory of stage-level extinction rates (Fig. 4)is very similar to that of Kiessling andDanelian (2011), although the latter was
obtained using different metrics. The lateRhaetian is the time interval when thedifference between the previous and ourresults are most pronounced. This is attributedto the enhanced stratigraphic resolution in ouranalysis.
The end-Triassic mass extinction of radio-larians becomes evident only with an analysisat the substage level: even though the long-term trends did not change, the short-termpattern at the substage resolution is remark-ably different from that at stage level. Theapparent variability of the substage-leveltaxonomic rates suggests that significantturnover might have happened within thestages.
Pulsed vs. Continuous Turnover.—Alroy(2010c) characterized his occurrence-basedrates as being ‘‘instantaneous,’’ meaning thatorigination and extinction rates are indepen-dent from time slice durations. This is consis-tent with the simulations of Foote (2005), whoproposed that turnover tends to be pulsed atthe stage level of stratigraphic resolution. Inour case, the independence of rate magnitudesfrom bin durations is supported by the lack ofcorrelation between the gap-filler rates and thedurations of the time slices (originations:Spearman’s rank-order correlation q ¼ 0.10, p¼ 0.5913; extinctions: q ¼ �0.08, p ¼ 0.6814).Normalizing the rate values with the time slicedurations introduces artificial correlationsbetween bin durations and both extinction (q¼�0.47, p¼ 0.0096) and origination rates (q ¼
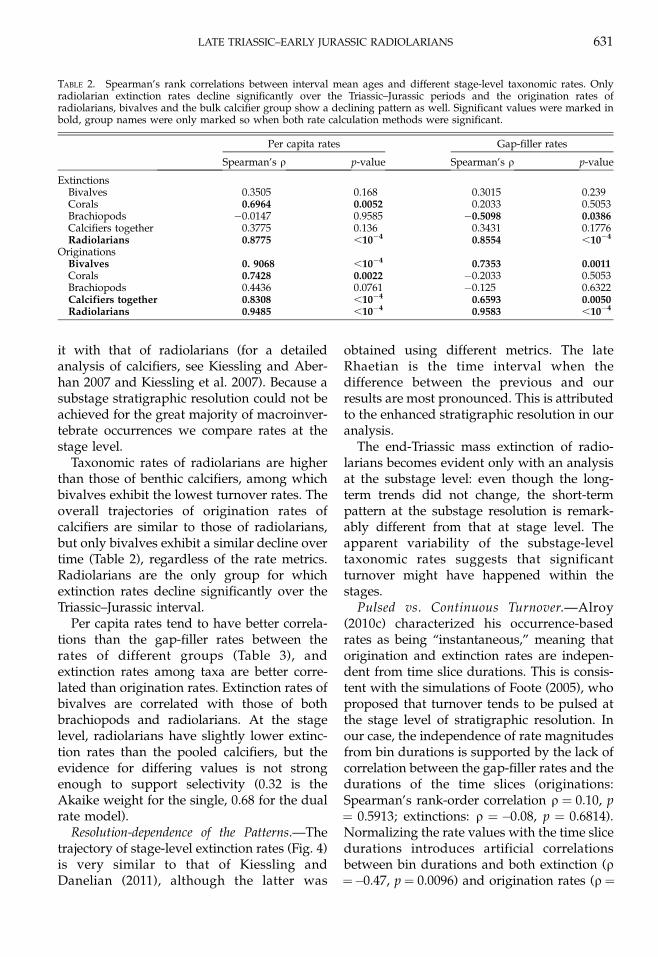
TABLE 2. Spearman’s rank correlations between interval mean ages and different stage-level taxonomic rates. Onlyradiolarian extinction rates decline significantly over the Triassic–Jurassic periods and the origination rates ofradiolarians, bivalves and the bulk calcifier group show a declining pattern as well. Significant values were marked inbold, group names were only marked so when both rate calculation methods were significant.
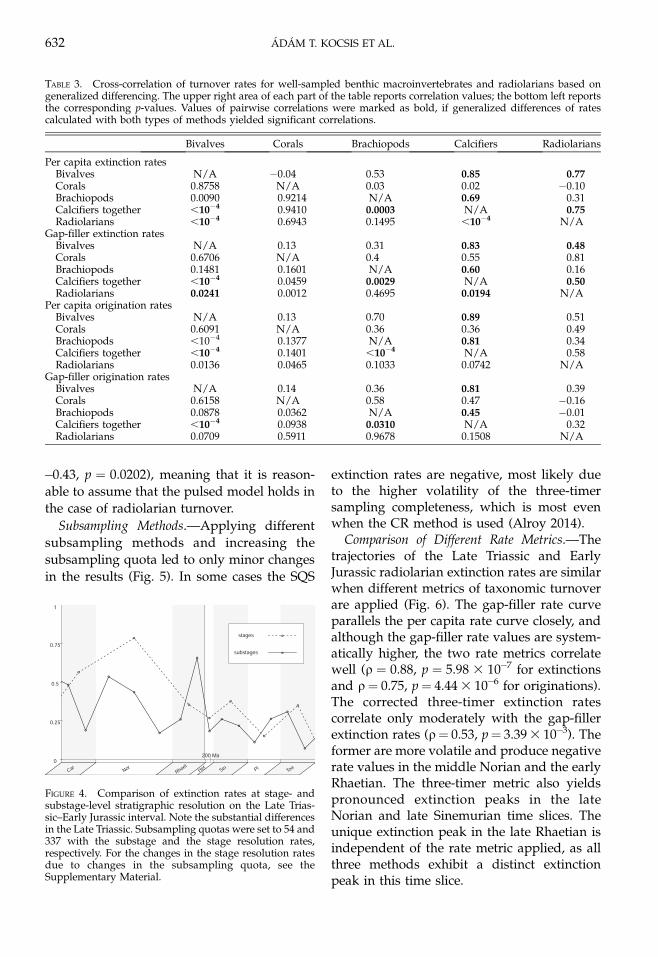
extinction rates are negative, most likely dueto the higher volatility of the three-timersampling completeness, which is most evenwhen the CR method is used (Alroy 2014).
Comparison of Different Rate Metrics.—Thetrajectories of the Late Triassic and EarlyJurassic radiolarian extinction rates are similarwhen different metrics of taxonomic turnoverare applied (Fig. 6). The gap-filler rate curveparallels the per capita rate curve closely, andalthough the gap-filler rate values are system-atically higher, the two rate metrics correlatewell (q ¼ 0.88, p ¼ 5.98 3 10�7 for extinctionsand q¼ 0.75, p¼ 4.44 3 10�6 for originations).The corrected three-timer extinction ratescorrelate only moderately with the gap-fillerextinction rates (q¼ 0.53, p¼ 3.39 3 10�3). Theformer are more volatile and produce negativerate values in the middle Norian and the earlyRhaetian. The three-timer metric also yieldspronounced extinction peaks in the lateNorian and late Sinemurian time slices. Theunique extinction peak in the late Rhaetian isindependent of the rate metric applied, as allthree methods exhibit a distinct extinctionpeak in this time slice.
TABLE 3. Cross-correlation of turnover rates for well-sampled benthic macroinvertebrates and radiolarians based ongeneralized differencing. The upper right area of each part of the table reports correlation values; the bottom left reportsthe corresponding p-values. Values of pairwise correlations were marked as bold, if generalized differences of ratescalculated with both types of methods yielded significant correlations.
FIGURE 4. Comparison of extinction rates at stage- andsubstage-level stratigraphic resolution on the Late Trias-sic–Early Jurassic interval. Note the substantial differencesin the Late Triassic. Subsampling quotas were set to 54 and337 with the substage and the stage resolution rates,respectively. For the changes in the stage resolution ratesdue to changes in the subsampling quota, see theSupplementary Material.
632 ADAM T. KOCSIS ET AL.
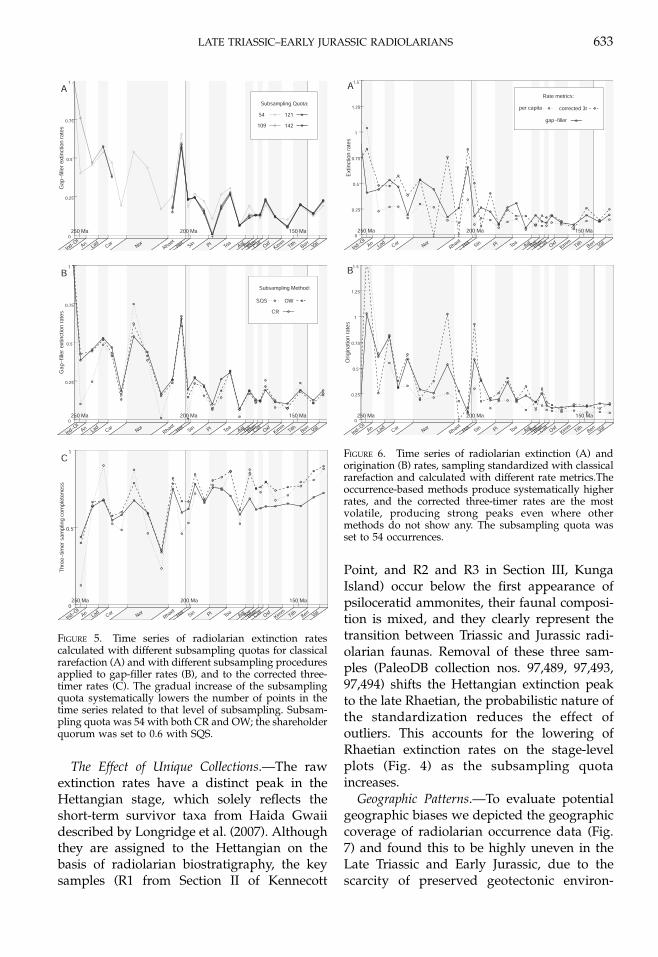
The Effect of Unique Collections.—The rawextinction rates have a distinct peak in theHettangian stage, which solely reflects theshort-term survivor taxa from Haida Gwaiidescribed by Longridge et al. (2007). Althoughthey are assigned to the Hettangian on thebasis of radiolarian biostratigraphy, the keysamples (R1 from Section II of Kennecott
Point, and R2 and R3 in Section III, KungaIsland) occur below the first appearance ofpsiloceratid ammonites, their faunal composi-tion is mixed, and they clearly represent thetransition between Triassic and Jurassic radi-olarian faunas. Removal of these three sam-ples (PaleoDB collection nos. 97,489, 97,493,97,494) shifts the Hettangian extinction peakto the late Rhaetian, the probabilistic nature ofthe standardization reduces the effect ofoutliers. This accounts for the lowering ofRhaetian extinction rates on the stage-levelplots (Fig. 4) as the subsampling quotaincreases.
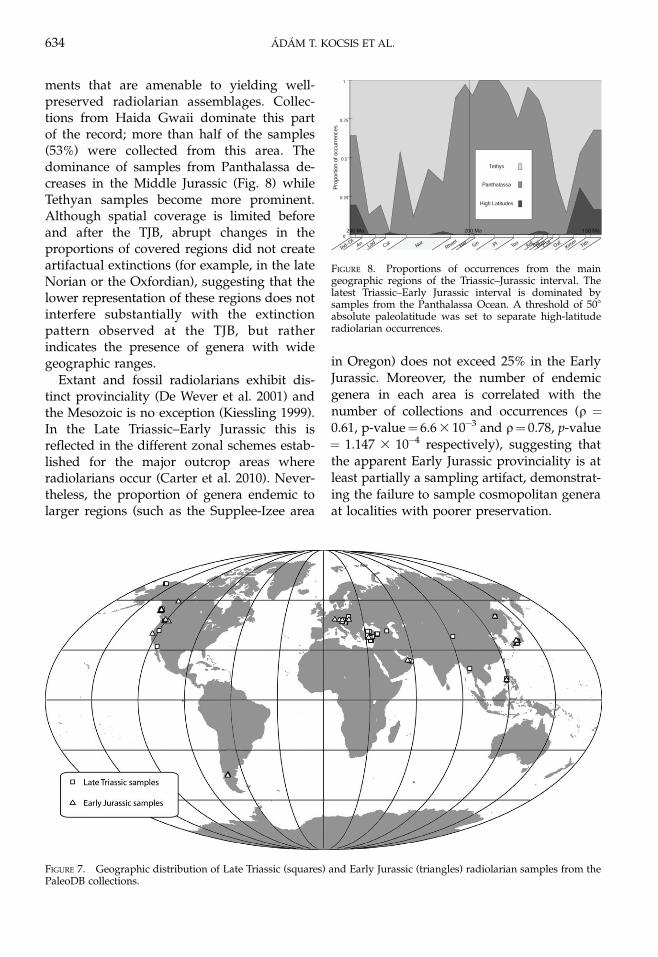
Geographic Patterns.—To evaluate potentialgeographic biases we depicted the geographiccoverage of radiolarian occurrence data (Fig.7) and found this to be highly uneven in theLate Triassic and Early Jurassic, due to thescarcity of preserved geotectonic environ-
FIGURE 5. Time series of radiolarian extinction ratescalculated with different subsampling quotas for classicalrarefaction (A) and with different subsampling proceduresapplied to gap-filler rates (B), and to the corrected three-timer rates (C). The gradual increase of the subsamplingquota systematically lowers the number of points in thetime series related to that level of subsampling. Subsam-pling quota was 54 with both CR and OW; the shareholderquorum was set to 0.6 with SQS.
FIGURE 6. Time series of radiolarian extinction (A) andorigination (B) rates, sampling standardized with classicalrarefaction and calculated with different rate metrics.Theoccurrence-based methods produce systematically higherrates, and the corrected three-timer rates are the mostvolatile, producing strong peaks even where othermethods do not show any. The subsampling quota wasset to 54 occurrences.
LATE TRIASSIC–EARLY JURASSIC RADIOLARIANS 633
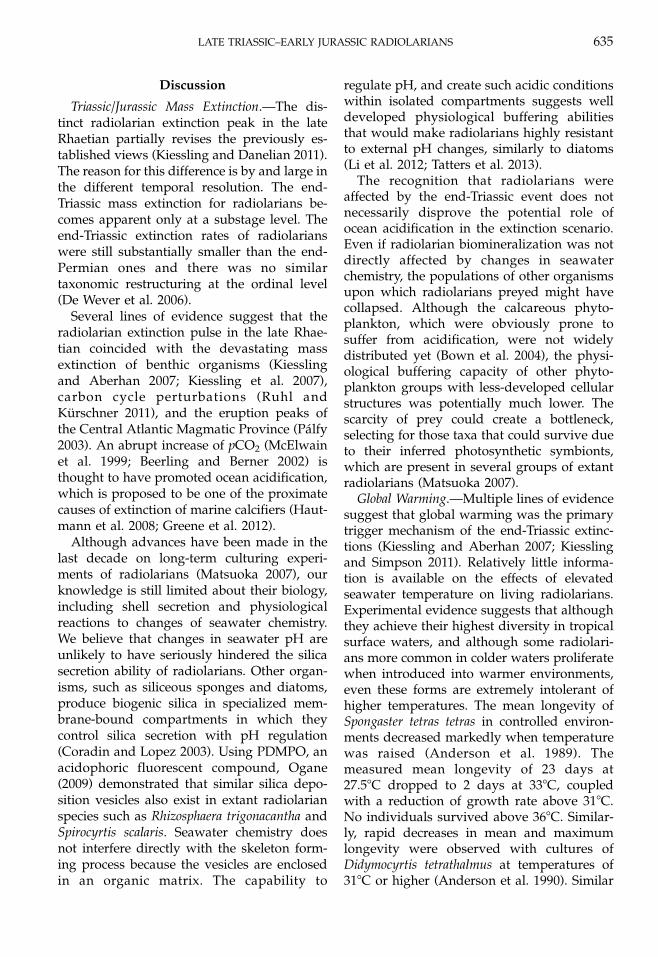
ments that are amenable to yielding well-preserved radiolarian assemblages. Collec-tions from Haida Gwaii dominate this partof the record; more than half of the samples(53%) were collected from this area. Thedominance of samples from Panthalassa de-creases in the Middle Jurassic (Fig. 8) whileTethyan samples become more prominent.Although spatial coverage is limited beforeand after the TJB, abrupt changes in theproportions of covered regions did not createartifactual extinctions (for example, in the lateNorian or the Oxfordian), suggesting that thelower representation of these regions does notinterfere substantially with the extinctionpattern observed at the TJB, but ratherindicates the presence of genera with widegeographic ranges.
Extant and fossil radiolarians exhibit dis-tinct provinciality (De Wever et al. 2001) andthe Mesozoic is no exception (Kiessling 1999).In the Late Triassic–Early Jurassic this isreflected in the different zonal schemes estab-lished for the major outcrop areas whereradiolarians occur (Carter et al. 2010). Never-theless, the proportion of genera endemic tolarger regions (such as the Supplee-Izee area
in Oregon) does not exceed 25% in the EarlyJurassic. Moreover, the number of endemicgenera in each area is correlated with thenumber of collections and occurrences (q ¼0.61, p-value¼ 6.6 3 10�3 and q¼ 0.78, p-value¼ 1.147 3 10�4 respectively), suggesting thatthe apparent Early Jurassic provinciality is atleast partially a sampling artifact, demonstrat-ing the failure to sample cosmopolitan generaat localities with poorer preservation.
FIGURE 7. Geographic distribution of Late Triassic (squares) and Early Jurassic (triangles) radiolarian samples from thePaleoDB collections.
FIGURE 8. Proportions of occurrences from the maingeographic regions of the Triassic–Jurassic interval. Thelatest Triassic–Early Jurassic interval is dominated bysamples from the Panthalassa Ocean. A threshold of 508absolute paleolatitude was set to separate high-latituderadiolarian occurrences.
634 ADAM T. KOCSIS ET AL.
Discussion
Triassic/Jurassic Mass Extinction.—The dis-tinct radiolarian extinction peak in the lateRhaetian partially revises the previously es-tablished views (Kiessling and Danelian 2011).The reason for this difference is by and large inthe different temporal resolution. The end-Triassic mass extinction for radiolarians be-comes apparent only at a substage level. Theend-Triassic extinction rates of radiolarianswere still substantially smaller than the end-Permian ones and there was no similartaxonomic restructuring at the ordinal level(De Wever et al. 2006).
Several lines of evidence suggest that theradiolarian extinction pulse in the late Rhae-tian coincided with the devastating massextinction of benthic organisms (Kiesslingand Aberhan 2007; Kiessling et al. 2007),carbon cycle perturbations (Ruhl andKurschner 2011), and the eruption peaks ofthe Central Atlantic Magmatic Province (Palfy2003). An abrupt increase of pCO2 (McElwainet al. 1999; Beerling and Berner 2002) isthought to have promoted ocean acidification,which is proposed to be one of the proximatecauses of extinction of marine calcifiers (Haut-mann et al. 2008; Greene et al. 2012).
Although advances have been made in thelast decade on long-term culturing experi-ments of radiolarians (Matsuoka 2007), ourknowledge is still limited about their biology,including shell secretion and physiologicalreactions to changes of seawater chemistry.We believe that changes in seawater pH areunlikely to have seriously hindered the silicasecretion ability of radiolarians. Other organ-isms, such as siliceous sponges and diatoms,produce biogenic silica in specialized mem-brane-bound compartments in which theycontrol silica secretion with pH regulation(Coradin and Lopez 2003). Using PDMPO, anacidophoric fluorescent compound, Ogane(2009) demonstrated that similar silica depo-sition vesicles also exist in extant radiolarianspecies such as Rhizosphaera trigonacantha andSpirocyrtis scalaris. Seawater chemistry doesnot interfere directly with the skeleton form-ing process because the vesicles are enclosedin an organic matrix. The capability to
regulate pH, and create such acidic conditionswithin isolated compartments suggests welldeveloped physiological buffering abilitiesthat would make radiolarians highly resistantto external pH changes, similarly to diatoms(Li et al. 2012; Tatters et al. 2013).
The recognition that radiolarians wereaffected by the end-Triassic event does notnecessarily disprove the potential role ofocean acidification in the extinction scenario.Even if radiolarian biomineralization was notdirectly affected by changes in seawaterchemistry, the populations of other organismsupon which radiolarians preyed might havecollapsed. Although the calcareous phyto-plankton, which were obviously prone tosuffer from acidification, were not widelydistributed yet (Bown et al. 2004), the physi-ological buffering capacity of other phyto-plankton groups with less-developed cellularstructures was potentially much lower. Thescarcity of prey could create a bottleneck,selecting for those taxa that could survive dueto their inferred photosynthetic symbionts,which are present in several groups of extantradiolarians (Matsuoka 2007).
Global Warming.—Multiple lines of evidencesuggest that global warming was the primarytrigger mechanism of the end-Triassic extinc-tions (Kiessling and Aberhan 2007; Kiesslingand Simpson 2011). Relatively little informa-tion is available on the effects of elevatedseawater temperature on living radiolarians.Experimental evidence suggests that althoughthey achieve their highest diversity in tropicalsurface waters, and although some radiolari-ans more common in colder waters proliferatewhen introduced into warmer environments,even these forms are extremely intolerant ofhigher temperatures. The mean longevity ofSpongaster tetras tetras in controlled environ-ments decreased markedly when temperaturewas raised (Anderson et al. 1989). Themeasured mean longevity of 23 days at27.58C dropped to 2 days at 338C, coupledwith a reduction of growth rate above 318C.No individuals survived above 368C. Similar-ly, rapid decreases in mean and maximumlongevity were observed with cultures ofDidymocyrtis tetrathalmus at temperatures of318C or higher (Anderson et al. 1990). Similar
LATE TRIASSIC–EARLY JURASSIC RADIOLARIANS 635
patterns were observed in experiments withcultures of Dictyornyne truncatum; skeletalgrowth and survival were remarkably sup-pressed at temperatures above 328C (Matsuo-ka and Anderson 1992).
Even if early Mesozoic radiolarians haddifferent temperature tolerances, the conse-quences of global warming would involvesubstantial poleward migrations and commu-nity changes leading to novel biotic interac-tions and detrimental effects via alterednutrient supply and increased stratificationof upper part of the water column (Parmesan2006).
Smaller Events.—Although O’Dogherty et al.(2010) reported that radiolarians sufferedelevated extinction in the early Norian, whichprimarily affected multicyrtid nassellarians, inour sampling-standardized analyses the earlyNorian extinction rate remains within therange of background values. Because there isno evidence for any environmental distur-bance that could have triggered significantextinctions, we conclude that the early Norianextinction peak observed in the raw data (Fig.7) is probably an artifact related to the poorsampling of the other Norian time slices.
Similarly, the allegedly drastic turnover, de-scribed by Hori (1997) as the Toarcian Radiolar-ian Event, at the boundary of the Parahsuumsimplum and Hexasaturnalis hexagonus assem-blage zones (corresponding to the lower/middle Toarcian boundary; Carter et al. 2010),also appears to be a sampling artifact. Althoughglobal warming was substantial in this interval(Bailey et al. 2003), the Toarcian extinctions arelargely attributed to oceanic anoxia (Aberhanand Baumiller 2003), which might explain thelimited response of radiolarians. Some radiolar-ian taxa are thought to have been associatedwith dysoxic environments in the Cretaceous(Erbacher and Thurow 1997), but anoxia itselfmight have had only a minor effect on thegroup, as radiolarians attain maximum abun-dance and diversity in the surface layer oftoday’s ocean, and there is no reason to assumethat this has changed over time.
In comparison with benthic calcifiers, evolu-tionary forcing affecting radiolarians in theirplanktonic habitat appears significantly differ-ent. The good radiolarian data across the TJB
largely come from the Panthalassa ocean(Japan and Wrangellia), whereas the benthicanimal diversity dynamics are largely based onTethyan shelf deposits. These settings presum-ably differed in several aspects such as CaCO3
saturation state and nutrient regimes. Never-theless the end-Triassic extinction event affect-ed radiolarians and benthic calcifiers similarly,suggesting a common extrinsic cause, mostlikely the extreme global warming.
Conclusions
The analysis of evolutionary trajectories ofradiolarians reveals some similarities but alsointriguing differences from those of the morecommonly analyzed calcareous benthic organ-isms. A feature shared with all benthicmacroinvertebrates is the end-Triassic extinc-tion pulse. Consequently, a biocalcificationcrisis alone cannot fully account for the marinemass extinction, but other factors, such asextreme warming, must have been importantdrivers of radiolarian extinctions. In the LateTriassic–Early Jurassic interval, radiolariansresponded differently to other environmentalperturbations. Notably, global changes inclimate and ocean chemistry during theToarcian Oceanic Anoxic Event had onlyminor effects on radiolarian origination andextinction rates.
Our study underlines the importance ofincreased stratigraphic resolution in databaseanalyses, and the adequate performance of thenew gap-filler method for calculating taxo-nomic metrics from medium-sized data sets.The different patterns of taxonomic turnoverrevealed through the increase of temporalresolution calls for more detailed studiesabout the effects this may impose in otherfocal groups and time intervals.
Acknowledgments
We thank M. Aberhan, J. Alroy, A. Matsuo-ka, A. Tomasovych, A. Miller, P. Ozsvart, andfour anonymous colleagues for helpful dis-cussions, ideas and comments on earlierversions of this paper. U. Merkel and T.Danelian helped with data entry. This studywas supported by the Hungarian ScienceFoundation (grant no. OTKA K62733) andthe SYNTHESYS project. This is MTA–MTM–
Tatters, A. O., M. Y. Roleda, A. Schnetzer, F. Fu, C. L. Hurd, P. W.
Boyd, D. A. Caron, A. A. Y. Lie, L. J. Hoffmann, and D. A.
Hutchins. 2013. Short- and long-term conditioning of a
temperate marine diatom community to acidification and
warming. Philosophical Transactions of the Royal Society of
London B 368. doi: 10.1098/rstb.2012.0437.
Appendix
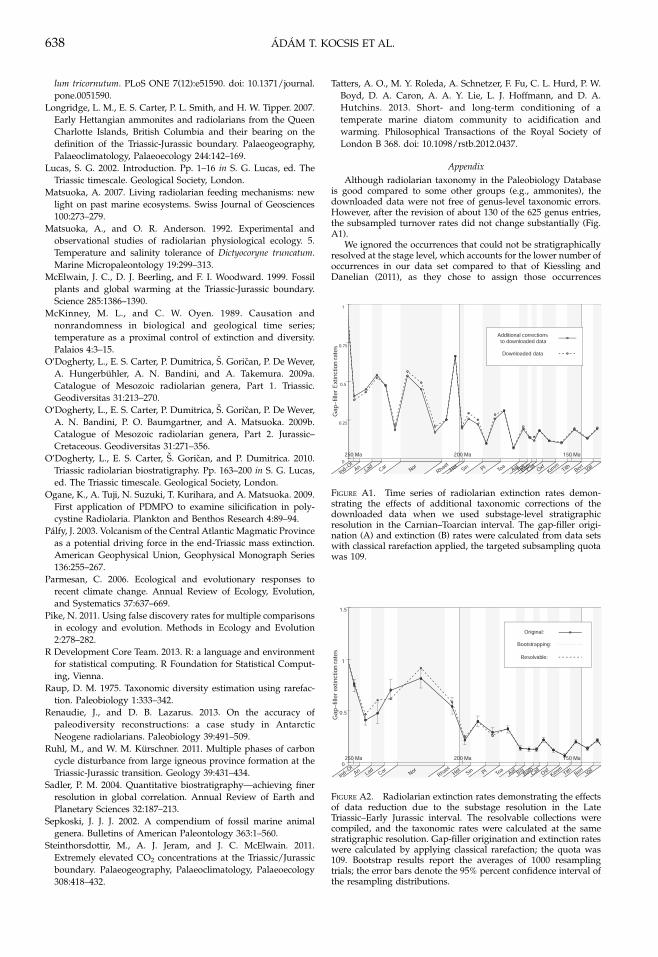
Although radiolarian taxonomy in the Paleobiology Databaseis good compared to some other groups (e.g., ammonites), thedownloaded data were not free of genus-level taxonomic errors.However, after the revision of about 130 of the 625 genus entries,the subsampled turnover rates did not change substantially (Fig.A1).
We ignored the occurrences that could not be stratigraphicallyresolved at the stage level, which accounts for the lower number ofoccurrences in our data set compared to that of Kiessling andDanelian (2011), as they chose to assign those occurrences
FIGURE A1. Time series of radiolarian extinction rates demon-strating the effects of additional taxonomic corrections of thedownloaded data when we used substage-level stratigraphicresolution in the Carnian–Toarcian interval. The gap-filler origi-nation (A) and extinction (B) rates were calculated from data setswith classical rarefaction applied, the targeted subsampling quotawas 109.
FIGURE A2. Radiolarian extinction rates demonstrating the effectsof data reduction due to the substage resolution in the LateTriassic–Early Jurassic interval. The resolvable collections werecompiled, and the taxonomic rates were calculated at the samestratigraphic resolution. Gap-filler origination and extinction rateswere calculated by applying classical rarefaction; the quota was109. Bootstrap results report the averages of 1000 resamplingtrials; the error bars denote the 95% percent confidence interval ofthe resampling distributions.
638 ADAM T. KOCSIS ET AL.
randomly. Also, not all radiolarian occurrences in the LateTriassic–Early Jurassic could be binned at the substage level ofstratigraphic resolution. In this interval, 625 collections (11,105occurrences) were resolved at the stage level, of which 477collections (8563 occurrences) were assigned to a substage.Because this data loss is substantial, the stage-level rates werecompared with rates that were calculated from substage-level datawith collections reassigned to form a stage-level series again. Afterthe omission of about 150 collections (24%), the subsampledresults barely changed. We have also conducted by-collection
resampling of the data to estimate the values and deviations of the
taxonomic rates at a subsample size that corresponds to the
number of collections that can be resolved to substages (Fig. A2).
The taxonomic rates calculated from the resolvable data set have
slightly higher values in the Norian than implied from a random
reduction of the data. This suggests that both originating and
disappearing genera tend to be somewhat overrepresented in the
Norian part of the finer-resolution time series, but this should have