Rapid palaeoceanographic changes in the Benguela Upwelling System for the last 160,000 years as indicated by abundances of
planktonic foraminifera
M.G. Little a,., R.R. Schneider b,1, D. Kroon a,2, B. Price a,a, T. Bickert b,4, G. Wefer b,5 a Geology and Geophysics, University of Edinburgh, Kings' Buildings, West Mains Road, Edinburgh EH9 3JW, UK
b Fachbereich Geowissenschafien, Universit~t Bremen, Klagenfurter Strafle, D-28359 Bremen, Germany
Received 19 March 1996; revision 28 October 1996; accepted 28 October 1996
136 M. G. Little et al. / Palaeogeography, Palaeoclimatology, Palaeoecology 130 (1997) 135 161
1. Introduction
Upwelling systems, and the associated enhanced primary and secondary productivity, make a sig- nificant contribution to the total carbon reservoir in the ocean sediments (Shaffer, 1993). It is vital that a proper understanding of upwelling systems, their variability and driving mechanisms is gained to quantify the carbon sinks in the oceans. The southwest African margin is an excellent area to study upwelling dynamics as it is the site of intense upwelling and exceptionally high productivity. Offshore displacement of more oligotrophic sub- tropical waters by the southeast trade winds allows the intense upwelling of cold, nutrient-rich waters into the surface layer. This stimulates extreme phytoplankton growth (Brown et al., 1991) in a narrow shoreward zone of eutrophy resulting in most of the surface sediments being of biogenic
17°S
2(F
2Y
30 ° I 0 15 2/)~E
Fig. 1. Study area showing the continental shelf and slope bathymetry, and the locations of the Namibian continental- slope core sites used in text: GeoB 1711, GeoB 1706, GeoB 3608, GeoB 3606, GeoB 1028, DSDP 532, PC 12 and PC 16. Bathymetry of the southwest African coast is given in meters by Dingle and Nelson (1993). Inset shows position with respect to the African continent.
origin. Recent surface Benguela sediment distribu- tions are discussed by Calvert and Price (1983), Rogers and Bremner (1991), Giraudeau et al. (1993), Dingle (1995) and Summerhayes et al. (1995b).
The aim of this study is to assess the variation of planktonic tbraminifera to determine changes in the oceanography of the Benguela Upwelling System, in the expectation that this will enable us to assess the extent to which upwelling has changed temporally and spatially, and to determine what controls these changes. The high-resolution plank- tonic foraminiferal records of cores GeoB 1706, southwest of Cape Fria (1933.7'S, II~I0.5'E, Fig. 1) and GeoB 1711, off Walvis Bay (23 18.9'S, 12 22.6'E) are used to investigate the variability of palaeoceanography of the Namibian Margin for the last 160 kyr. Two main questions to be investigated are: (1) Can abundance variations of planktonic foraminifera be used to determine past changes of upwelling intensity in the Benguela Upwelling System? (2) To what degree is the Benguela Current System (BCS) influenced by cold-water advection from the Southern Ocean as has previously been suggested (McIntyre et al., 1989; Giraudeau, 1993; Summerhayes et al., 1995b; Giraudeau et al., 1997)?
2. Regional oceanography
The oceanography off South Africa, Namibia and southern Angola is controlled by the coastal branch of the Benguela Current forming the north- eastern limb of the anticyclonic gyre of the South Atlantic. The hydrography of the Benguela Current System (BCS) has been described in detail by a number of workers (Shannon, 1985; Lutjeharms and Meeuwis, 1987; Lutjeharms and Stockton, 1987; Summerhayes et al., 1995b; Shannon and Nelson, 1997), and is summarized in Fig. 2. The Benguela Oceanic Current (BOC) is the equatorward drift of cool surface waters flowing from 34°S (Cape Town) past southwestern Africa to 23S (Walvis Bay), where it diverges from the coast. Inside the shelf break, along the entire coastline, a component of the BOC moves equatorwards forming the Benguela Coastal
M.G. Little et al. /Palaeogeography, Palaeoclimatology, Palaeoecology 130 (1997) 135 161 137
15°S
20 °
25 °
30 °
35 °
10 ° 15 ° 20°E
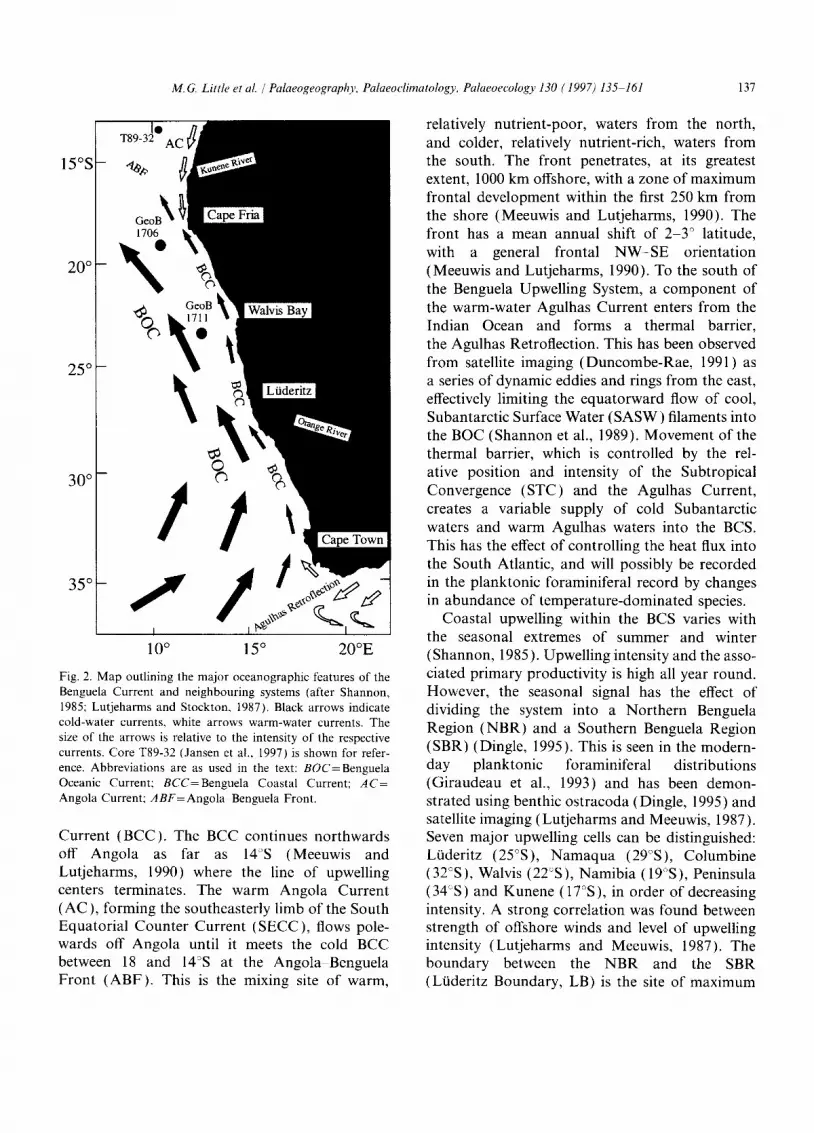
Fig. 2. Map outlining the major oceanographic features of the Benguela Current and neighbouring systems (after Shannon, 1985; Lutjeharms and Stockton, 1987). Black arrows indicate cold-water currents, white arrows warm-water currents. The size of the arrows is relative to the intensity of the respective currents. Core T89-32 (Jansen et al., 1997) is shown for refer- ence. Abbreviations are as used in the text: BOC=Benguela Oceanic Current; BCC=Benguela Coastal Current; AC= Angola Current; ABF=Angola Benguela Front.
Current (BCC). The BCC continues northwards off Angola as far as 14°S (Meeuwis and Lutjeharms, 1990) where the line of upwelling centers terminates. The warm Angola Current (AC), forming the southeasterly limb of the South Equatorial Counter Current (SECC), flows pole- wards off Angola until it meets the cold BCC between 18 and 14°S at the Angola Benguela Front (ABF). This is the mixing site of warm,
relatively nutrient-poor, waters from the north, and colder, relatively nutrient-rich, waters from the south. The front penetrates, at its greatest extent, 1000 km offshore, with a zone of maximum frontal development within the first 250 km from the shore (Meeuwis and Lutjeharms, 1990). The front has a mean annual shift of 2-3 ° latitude, with a general frontal N W - S E orientation (Meeuwis and Lutjeharms, 1990). To the south of the Benguela Upwelling System, a component of the warm-water Agulhas Current enters from the Indian Ocean and forms a thermal barrier, the Agulhas Retroflection. This has been observed from satellite imaging (Duncombe-Rae, 1991) as a series of dynamic eddies and rings from the east, effectively limiting the equatorward flow of cool, Subantarctic Surface Water (SASW) filaments into the BOC (Shannon et al., 1989). Movement of the thermal barrier, which is controlled by the rel- ative position and intensity of the Subtropical Convergence (STC) and the Agulhas Current, creates a variable supply of cold Subantarctic waters and warm Agulhas waters into the BCS. This has the effect of controlling the heat flux into the South Atlantic, and will possibly be recorded in the planktonic foraminiferal record by changes in abundance of temperature-dominated species.
Coastal upwelling within the BCS varies with the seasonal extremes of summer and winter (Shannon, 1985). Upwelling intensity and the asso- ciated primary productivity is high all year round. However, the seasonal signal has the effect of dividing the system into a Northern Benguela Region (NBR) and a Southern Benguela Region (SBR) (Dingle, 1995). This is seen in the modern- day planktonic foraminiferal distributions (Giraudeau et al., 1993) and has been demon- strated using benthic ostracoda (Dingle, 1995) and satellite imaging (Lutjeharms and Meeuwis, 1987). Seven major upwelling cells can be distinguished: Lfideritz (25°S), Namaqua (29°S), Columbine (32°S), Walvis (22°S), Namibia (19°S), Peninsula (34°S) and Kunene (17°S), in order of decreasing intensity. A strong correlation was found between strength of offshore winds and level of upwelling intensity (Lutjeharms and Meeuwis, 1987). The boundary between the NBR and the SBR (Li~deritz Boundary, LB) is the site of maximum
138 M.G. Little et al. /' Palaeogeography, Palaeoclimatology, Palaeoecology 130 (1997) 135 161
upwelling intensity at 26 -2TS (Ltideritz), which has the coldest and the most persistent upwelling (Fig. 3). Upwelling in the area north of the LB
17°S , I
20 ° ~
GeoB 1706
/ GeoB 1711 2 5 o -
N B R
30 o
Cape Fria Species Dominance
N. pachyderma (s)
Gr. inflata
N. pachyderma (d)
Gg. bulloides
Walvis Bay
NAMIBIA
Lfideritz
SOUTH AFRICA
S B R
': 'i
15 ° 20°E Fig. 3. Recent distribution of planktonic foraminifera in the study area, after Giraudeau ( 1993): N. paehyderma (s) is found in eutrophic, cool upwelled waters; Gr. inflata is found in rela- tively oligotrophic, sub tropical conditions; and, N. paehyderma (d) and Gg. bulloides are found in the mixed+ mesotrophic, sub- tropical and upwelled waters typical of the offshore Northern Benguela Region (NBR). The L/ideritz Boundary represents the boundary between the Northern (NBR) and Southern Benguela regions (SBR). N. paehyderma (s) includes only sinistral forms, whilst N. paehyderma (d) includes all dextral forms of N. paehyderma and all forms of N. dutertrei.
(NBR) is predominantly a winter phenomenon, but the area is typified by year round high produc- tivity and enhanced accumulation of phytoplank- ton (Brown et al., 1991). Wind speeds are of medium intensity with a wide, oceanic, filamen- tous, mixing domain (Lutjeharms and Stockton, 1987). Surface sediments are rich in organics with a maximum in the inner-shelf belt of diatomaceous ooze (Bremner, 1983; Rogers and Bremner, 1991 ). in the Recent setting, the NBR has the lowest dissolved-oxygen, related to a poor oxygen source in the Angola Basin, and the highest marine organic carbon levels and sea surface temperatures (SSTs) (Dingle, 1995). Boyd et al. (1987) found late-summer poleward intrusion of surface and subsurface warm Angolan water south to Walvis Bay to be a common feature.
The SBR has a highly seasonal upwelling regime with its maximum in summer, and a restricted mixing domain (kutjeharms and Meeuwis, 1987; Giraudeau and Rogers, 1994). Offshore there is a strong thermal front between the cold, dense upwelled waters and the displaced subtropical waters. Seasonal variability in nutrient supply and low values of chlorophyll a (Giraudeau, 1993) are associated with the variable upwelling intensity. In the Recent sediments, the SBR has the highest dissolved-oxygen levels which support an abun- dant benthic ostracod population (Dingle, 1995).
The most recent review of the Quaternary upwelling history offshore Namibia was by Summerhayes et al. (1995b). Using geochemical and micropalaeontological analyses of a piston core (PG/PC12, see Fig. 1) from the slope off Walvis Bay, they discussed the dynamics of upwell- ing in the BCS during the last 70 kyr. They indicated that the most productive time interval, derived from organic carbon data, was during glacial stages 4 2, peaking in isotope stage 3, and coinciding with the coldest SSTs from alkenone data. Upwelling and organic matter flux was found to increase in stages 4 and 3, but decline into stage 2, the Last Glacial Maximum (LGM). This was attributed to an equatorward shift of the trade winds in stage 2, leading to a marked decrease in upwelling at site PG/PC12, northwest of Walvis Bay (Fig. 1). The primary control on the system is believed to be the precessionally controlled posi-
M.G. Little et al. /Palaeogeography, Palaeoclimatology, Palaeoecology 130 (1997) 135-161 139
tion of the South Atlantic Anticyclonic Gyre (Summerhayes et al., 1995b) and corresponding variations in the upwelling-inducing trade winds. Aside from this primary control on productivity, Summerhayes et al. (1995a) suggest variations in the supply of nutrients into the system via subsur- face waters which sank at the STC, and continued clockwise around the South Atlantic with the Equatorial Undercurrent (EUC) and through the Angola Basin to Namibia.
Jansen et al. (1997) used planktonic foramini- fera from three cores on the Angola-Zaire margin to reconstruct palaeo-positions of the ABF for the last 180 kyr. Using a low-resolution record, they suggest that the extreme latitudinal shifts of the BCS can be described by the 100 kyr (eccentricity) period and the meridional shifts by the 23 kyr (precession) component of the Earth's orbital parameters. Jansen et al. (1997) show strong equa- torward shifts in stages 4 and substages 3.3-3.1, whilst the southernmost positions (similar to the present situation) were occupied in substages 6.3, 5.5 and stage 1. In agreement with Summerhayes et al. (1995b), they associate the shifting of the ABF, and accompanying upwelling cells, to changes in position and relative intensity of the SAAG and corresponding southeast trade winds, with an additional component from advected Southern Ocean surface or intermediate waters.
3. Modern-day distribution of planktonic foraminifera
The variability of watermasses is important in any discussion of the distribution of planktonic foraminifera. B6 and Tolderlund (1971) grouped planktonic foraminifera into five faunal zones, showing a bipolar and anti-tropical nature of preferred habitats with distinct faunas living in particular latitudinal zones, seemingly governed by the temperature regime. However, other studies brought the dominance of temperature into ques- tion, with "typically" cold-water species such as Globigerina bulloides d'Orbigny being found in tropical upwelling areas (Thiede, 1975; Prell and Curry, 1981; Kroon, 1991), reinforcing the idea that species distribution is governed by nutrient
levels and not by temperature (Reynolds and Thunnel, 1985). Three watermass types ade- quately describe the BCS as observed by the modern distribution of planktonic foraminifera (Giraudeau, 1993 ) and satellite imaging (Lutjeharms and Stockton, 1987; Meeuwis and Lutjeharms, 1990).
In the modern setting, Giraudeau (1993) mapped the distribution of planktonic foraminifera and found that the assemblages occur within oceanographically distinct zones or belts, from Cape Town to Cape Fria (Fig. 3). In the SBR, Globorotalia inflata d'Orbigny mainly inhabits the offshore waters that are typical of a transitional system with lower nutrient levels and reduced primary productivity compared to the inshore upwelling cells. Inshore, the eutrophic, nutrient- rich, cooler upwelled waters form an area much more agreeable to Neogloboquadrina pachyderma sinistral (Ehrenberg) [N. pachyderma (s)]. The sharp break between the two zones of foraminiferal domination correlates precisely to the hydrography of the SBR. Bang (1971) studied the water struc- ture between 29 and 32°S (SBR) and distinguished a coast-parallel coastal upwelling front over the continental shelf with a sharply defined thermal anomaly between an offshore divergence zone and the newly upwelled waters of the BCS. Barange and Pillar (1992) extended the observations north- wards to 17°S (NBR) and reported that the off- shore divergence zone is a permanent feature independent of the wind stress. A "tongue" of warm, oxygen- and nutrient-poor, Angola Basin water filters into the northern BCS intermittently throughout the year (Boyd et al., 1987), further increasing the extent of the filamentous mixing domain in the NBR. As well as the offshore conditions in the SBR, Gr. inflata also inhabits the nutrient-poor, subtropical Angola Current fila- ments injected into the BCS in the NBR. The offshore zone of the NBR is characterized by areas of mixed nutrient levels, suitable for Neogloboquadrina pachyderma dextral (Ehrenberg) [N. pachyderma (d)] and Gg. bulloides. N. pachy- derma (d) prefers the mesotrophic, but higher nutrient levels of the upwelled filaments, whilst Gg. bulloides prefers the relatively lower nutrient levels away from the upwelling filaments
140 3/£ G. Litth" et al. / Palaeogeography, Palaeoclimatolog), Palaeoecology 130 (1997) 135 ~ 161
(Giraudeau, 1993). Nearshore waters, which upwell in this area, are of a shallower origin than in the SBR (Shannon and Nelson, 1997), and are less ideal for N. pachyderma (s) than the nearshore area to the south.
Oberh~insli (1991) and Schmidt (1992) used the abundances of planktonic foraminifera as indica- tors of past upwelling processes in the BCS. Both documented cold periods within early stage 6 and stages 4 2 from sites GeoB 1028 and DSDP 532, on the Walvis Ridge (Fig. 1) recorded by the greatest maxima of the cold-water species N. pachyderma (s). However, although both showed distinct peaks in the planktonic foraminiferal assemblages, the records were of too low a reso- lution to ascertain a periodicity for the variations seen and to imply any forcing mechanisms for the system as a whole. Studies of uk7 (Schneider et al., 1995) and organic matter in PG/PCI2 (Summerhayes et al., 1995b) reveal similar histor- ies of cooling, suggesting that oceanographic varia- tion may be related to an increased vigour of upwelling, not simply an introduction of cold water from the south.
and 500 ~tm, but for comparative reasons foramini- feral analysis was made only on the > 125 ~tm size fraction. Archived core material is kept at the Department of Geosciences, University of Bremen, Germany.
4.2. Stable oxygen- and carbon-isotope analysis
Tests of Gr. inflata and Cibicidoides wuellerstorfi Schwager were hand-picked under a binocular microscope from the 250-500 ~tm fraction to achieve an analytical weight between 0.05 and 0.10mg, composed of between 8 and 10 well- preserved and clean specimens. Stable oxygen- and carbon-isotope analysis was conducted on a Finnigan MAT 251 mass spectrometer using a KIEL automated sampling device. The tests of the foraminifera were reacted with concentrated ortho- phosphoric acid at 75°C. Calibration to the stan- dard Pee Dee Belemnite was via the NBSI8, NBS19 and NBS20 standards. Analytical precision for oxygen- and carbon-isotope analyses was _+0.08 and _+0.04%o, respectively.
4. Materials and methods
4.1. Sampling
In this study, we used two gravity cores (GeoB 1706-2 and GeoB 1711-4) both collected on METEOR cruise M20/2 ( 1991 ) from 980 m on the upper continental slope of the Walvis Ridge (19°33.7'S, ll~10.5'E) and 1967m on the Namibian continental slope off Walvis Bay (23°18.9'S, 12°22.6'E), respectively (Fig. 1). The core length of GeoB 1706 was l l l 3 c m , and of GeoB 1711 1066 cm. Sedimentology and further core characteristics are given in Schulz et al. (1992). Samples were taken at 5cm intervals throughout the core, allowing geochemical, micro- paleontological and isotopic analyses to be carried out at a high resolution. Samples (10 cm 3) for geochemical study were freeze-dried and ground prior to analysis. Micropalaeontological samples (10 cm 3) for foraminiferal work were originally wet-sieved for fractions greater than 63, 125, 250
5. Oxygen-isotope stratigraphy and age model
The planktonic foraminiferal isotope records for GeoB 1706 and GeoB 1711 were produced from the tests of Gr. inflata, and the benthic foramini- feral oxygen-isotope record was produced from C. wuellerstorfi. The oxygen-isotope records were sub- sequently correlated with the stacked record of Imbrie et al. (1984) to obtain an age model for the cores. Nine isotopic events within the last 140 kyr were identified in GeoB 1711 by using the benthic foraminiferal oxygen-isotope record, and eight events for GeoB 1706 by using the planktonic foraminiferal oxygen-isotope record (Table 1 ). For further correlation between the two cores we used seven tie-lines between the two Gr. in/lata records based on both the oxygen- and carbon-isotope profiles (Fig. 4). Correlation between the plank- tonic foraminiferal isotope records revealed a period of non-deposition, or a hiatus, at site GeoB 1706 during isotope substages 5.5-5.2.
The GeoB 1706 foraminiferal isotope record illustrates the missing heavy values of 613C in
M. G. Little et al. / Palaeogeography, Palaeoclimatology, Palaeoecology 130 (1997) 135-161 141
Table 1 Age control-points for the oxygen-isotope curves of GeoB 1706 and GeoB 1711 (Imbrie et al., 1984)
Time span for the hiatus comes from comparison with 8180 and 813C signatures of GeoB 1711 (Fig. 4) and the benthic foraminiferal isotope record of GeoB 1711 (Fig. 6). Depth measurements for GeoB 1711 are composite depths, and origi- nal depth for GeoB 1706. aDenotes benthic foraminiferal isotope record for GeoB 1711.
isotope substage 5.3, and the missing light isotopic values of 8~80 in isotope substage 5.5 compared to the record of GeoB 1711. In all stable oxygen- isotope records from the Angola and Cape Basins, and the continental slope off southwestern Africa and equatorial West Africa (Schneider, 1991; Schneider et al., 1997), substage 5.5 values reach Holocene 8~sO minima. The 8180 values for GeoB 1706 in isotopic stage 5 are higher than the Holocene values. Detailed examination of carbon- and oxygen-isotope signatures allow the hiatus to be best-fitted between the samples at 848 and 843 cm in GeoB 1706, matching 126.5 and 87.5 kyr, respectively, in GeoB 1711. Fig. 5 shows the carbon:isotope records of GeoB 1711 and GeoB 1706 to directly compare the records adjusted for age. The maximum of 813C in substage 5.3 is clearly missing, whilst the excellent correlation in early stage 5 marks the isotope substage 5.5 start of the hiatus. The 8~80 stratigraphy of the com- plete benthic foraminiferal record (Fig. 6) further
clarifies the missing section of sediment within mid-stage 5. Alkenone-derived SST data for both GeoB 1706 and GeoB 1711 reinforce the age model described (Mialler, unpubl.), and further suggests the presence of a hiatus between substages 5.5 and 5.2 in GeoB 1706.
6. Results
Twenty eight planktonic foraminiferal species were identified using the taxonomic concepts of Parker (1962) and the Neogene planktonic fora- miniferal classification of Kennett and Srinivasan (1983). For the purpose of this paper all dextral neogloboquadrinids are grouped as N. pachyderma (d) including all adult forms of Neogloboquadrina dutertrei d'Orbigny, thus accounting for the prob- lem of the N. pachyderma intergrades of Kipp (1976). Similarly, Mix and Morey (1997) grouped an "upwelling assemblage" of N. pachyderma (d), Gg. bulloides and N, dutertrei as we use here. In both cores, seven species have an average abun- dance greater than 1%, and of those, four species (N. pachyderma (s), Gg. bulloides, N. pachyderma (d) and Gr. inflata) make up, on average, over 95% of the total assemblage (Plate I). The relative abundances of planktonic foraminifera can be divided into a series of discrete episodes described with respect to the dominant species present in that time slice (Figs. 7 and 8).
There are four types of episode characterizing the variation of assemblages seen offshore Namibia. Episode A is dominated by N. pachy- derma (s) when it is in abundances greater than 40% over all others. Episode B is not dominated by a single species, but consists of >20% each of N. pachyderma (s), N. pachyderma (d) and Gg. bulloides. Episode C is dominated by two species, N. pachyderma (d) and Gg. bulloides, both contrib- uting to a total of --~ 80% of the total assemblage. Finally, Gr. inflata dominates episode D when it shows abundances greater than 20%. The graphic representation of the temporal variance in episodes A-D (right hand side of Figs. 7 and 8) shows no obvious correlation with the glacial-interglacial pattern of the isotope stages (left hand side of Figs. 7 and 8).
142 M.G. Little el al. /Palaeogeograph)', Palaeoclimatolo$:v. Palaeoecology 130 (1997) 135 161
0 -
200-
400"
¢D
600"
800"
1000"
8180 (%o) GeoB 1711 813C (%c) GeoB 1711
3 2.5 2 1.5 i 0.5 0 -0.6 -0.2 0.2 0.6 1 i . . i 1 I 1 . e l I 1 1 , i ] t , a 1 1 . 1 1 . I , , I i ] I . . , I , , . f . . . I , , , l , , , h , , I . . . l l I l J l l l l
Isotope Stages
m 2 .2
~'= 3.3
4.2
===5.1
~= 5.2
=m 5.3
m = 5 .4
~'~ 5.5
==* 6.2
200
4OO
g
6 0 0
' 800
1000
I ' ' ' 1 ' ' ' 1 ' ' ' 1 ' ' | 1 ' ' ' 1 ' ' ' i ' ' ' I ' ' ' I I ' ' ' 1 ' ' ' 1 ' " I " ' f " ' l ' ' ' l ' " l ' " l " ' l
2.2 1.8 1.4 1 -0.6 -0.2 0.2 0.6 1
8180 (%o) GeoB 1706 813C (%0) GeoB 1706
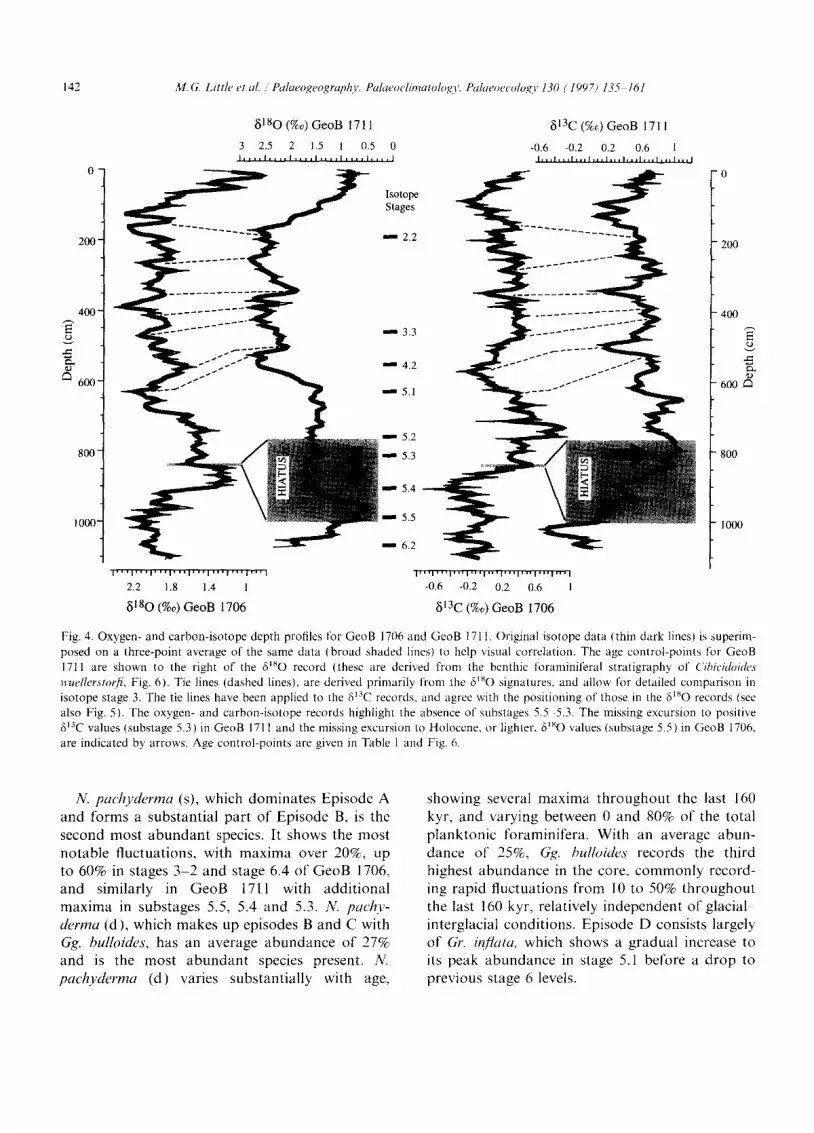
Fig. 4. Oxygen- and carbon-isotope depth profiles for GeoB 1706 and GeoB 1711. Original isotope data (thin dark lines) is superim- posed on a three-point average of the same data (broad shaded lines) to help visual correlation. The age control-points for GeoB 1711 are shown to the right of the 61~O record (these are derived from the benthic foraminiferal stratigraphy of CibieidoMes wuellerstorfi, Fig. 6). Tie lines (dashed lines), are derived primarily from the 6JsO signatures, and allow for detailed comparison in isotope stage 3. The tie lines have been applied to the 6'3C records, and agree with the positioning of those in the 8~sO records (see also Fig. 5). The oxygen- and carbon-isotope records highlight the absence of substages 5.5 5.3. The missing excursion to positive ~3C values (substage 5.3) in GeoB 1711 and the missing excursion to Holoccne, or lighter, 6~SO values (substage 5.5) in GeoB 1706, are indicated by arrows. Age control-points are given in Table 1 and Fig. 6.
N. pachyderma (s), which dominates Episode A and forms a substantial part of Episode B, is the second most abundant species. It shows the most notable fluctuations, with maxima over 20%, up to 60% in stages 3-2 and stage 6.4 of GeoB 1706, and similarly in GeoB 17ll with additional maxima in substages 5.5, 5.4 and 5.3. N. pachy- derma (d), which makes up episodes B and C with Gg. bulloides, has an average abundance of 27% and is the most abundant species present. N. pachyderma (d) varies substantially with age,
showing several maxima throughout the last 160 kyr, and varying between 0 and 80% of the total planktonic foraminifera. With an average abun- dance of 25%, Gg. bulloides records the third highest abundance in the core, commonly record- ing rapid fluctuations from 10 to 50% throughout the last 160 kyr, relatively independent of glacial interglacial conditions. Episode D consists largely of Gr. in)quta, which shows a gradual increase to its peak abundance in stage 5.1 before a drop to previous stage 6 levels.
M.G. Little et al. / Palaeogeography, Palaeoclimatology, Palaeoecology 130 (1997) 135-161 143
1513 C (%o) GeoB 1711 Isotope
-0,6 -0.2 0.2 0.6 1 stages I , , , h , , I , , , I , , , I , , , I , , , h , , h , I l l l l l , , , I
20
40"
60"
ixl 80"
<
100"
120"
140"
160"
-0.6 -0.2 0.2 0.6 I
1513C (%o) GeoB 1706
Fig. 5. Carbon-isotope stratigraphy for GeoB 1706 and GeoB 1711 with respect to age. Original data (dark thin line) is super- imposed on a three-point average (broad shaded line). The excellent correlation of the two 813C records versus age clarifies the positioning of the hiatus boundaries in the interval of sub- stages 5.5 5.2. The record shows an excellent correlation of the two datasets between stages 4 2, where are two records are linked using the 8180 tie lines (dashed lines, Fig. 4).
7. Discussion
7.1. Planktonic Jbramin(fera and nutrient availability
The planktonic foraminiferal records in the two cores under study are subdivided into episodes characterized by specific foraminiferal assemblages (Figs. 7 and 8). N. pachyderma (s), which domi- nates Episode A, has the greatest influence on the
major fluctuations in the system. N. pachyderma (s) does not vary with the changes in the global hydrological cycle, described by ~1~O variations (Imbrie et al., 1984), but instead shows a higher frequency of change with abundance maxima throughout isotope stages 6-2, including intergla- cial stage 5 (Little et al., 1995). Previous investiga- tions within the BCS have distinguished a good agreement with the distribution patterns of the planktonic foraminifera, nutrient levels and surface water hydrography (Giraudeau, 1993; Ufkes and Zachariasse, 1993; Ufkes, 1997). Giraudeau et al. (1997) found a similar pattern when they studied coccolith abundances in the same area. On the basis of factor analysis they correlated the abun- dances of coccolith species to the modern-day distribution of trophic areas. A comparison of planktonic foraminiferal (Fig. 3) and coccolith dis- tributions in Recent surface sediments (Giraudeau, 1993; Giraudeau et al., 1993; Giraudeau and Rogers, 1994), reveals a striking similarity to the modern-day trophic-level distribution, indicating a relationship between foraminifera type/number and nutrient levels within the Benguela Upwelling System, similar to other oceanic settings (Reynolds and Thunnel, 1985; Kroon and Ganssen, 1989; Kroon, 1991 ). The fossil assemblages are thus best interpreted with respect to a temporally varying nutrient availability or supply (Figs. 7 and 8). Episodes type A and D infer eutrophic (high) and relatively oligotrophic (low) nutrient levels, respec- tively, when the observed modern-day nutrient-- foraminiferal relationship is applied. Eutrophic Episode A, would be correlated with the trophic situation presently occurring in the nearshore upwelling centres, particularly intense off Ltideritz and further south in the SBR. The offshore, sub- tropical conditions of the SBR, would be represen- tative of Episode D trophic levels. Episodes B and C would characterize intermediate, mesotrophic conditions, typical of the mixed zone offshore in the NBR, similar to the modern-day situation at the sites of GeoB 1706 and GeoB 1711. At the site of GeoB 1706, eutrophic conditions dominated the oceanographic setting during isotope sub-stage 6.4 and stages 3 and 2. At site GeoB 1711, the planktonic foraminiferal record similarly suggests upwelling conditions throughout stage 3 and into
144 M.G. Little et aL / Palaeogeography, Palaeoelimatology, Palaeoecology 130 (1997) 135 161
0-
20"
40-
60-
80- <
100"
120
140
1 6 0
8180 (%~)
2.3 1.9 1.5 1.1 0.7 i I ~ i , I , i , i , ] , i , i , i
i i I i i i i I i i i i I I . . . . i . . . . i , , , i ]
, ,
,
~ - ~ , •
GeoB 171 I. Gr. inflata GeoB 171 I. Cibicidoides wuellerstorfi
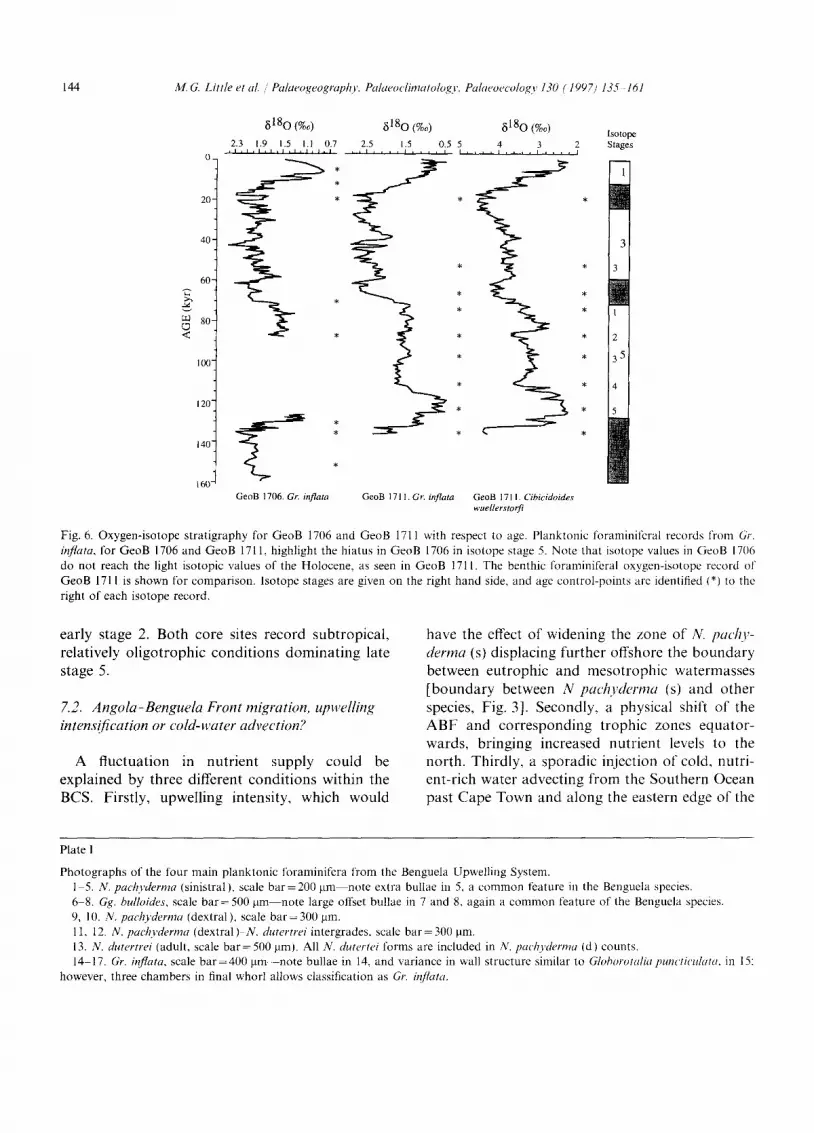
Fig. 6. Oxygen-isotope stratigraphy for GeoB 1706 and GeoB 1711 with respect to age. Planktonic foraminiferal records from (it'. inflata, for GeoB 1706 and GeoB 1711, highlight the hiatus in GeoB 1706 in isotope stage 5. Note that isotope values in GeoB 1706 do not reach the light isotopic values of the Holocene, as seen in GeoB 1711. The benthic ff~raminiferal oxygen-isotope record of GeoB 1711 is shown for comparison. Isotope stages are given on the right hand side, and age control-points are identified (*) to the right of each isotope record.
early stage 2. Both core sites record subtropical, relatively oligotrophic conditions dominating late stage 5.
7.2. Angola-Benguela Front migration, upwelling intensification or cold-water advection?
A fluctuation in nutrient supply could be explained by three different conditions within the BCS. Firstly, upwelling intensity, which would
have the effect of widening the zone of N. pachy- derma (s) displacing further offshore the boundary between eutrophic and mesotrophic watermasses [boundary between N pachyderma (s) and other species, Fig. 3]. Secondly, a physical shift of the ABF and corresponding trophic zones equator- wards, bringing increased nutrient levels to the north. Thirdly, a sporadic injection of cold, nutri- ent-rich water advecting from the Southern Ocean past Cape Town and along the eastern edge of the
Plate 1
Photographs of the four main planktonic foraminifera from the Benguela Upwelling System. 1 5. N. pachyderma (sinistral), scale bar = 200/am note extra bullae in 5, a common feature m the Benguela species. 6 8. Gg. bulloides, scale bar = 500 ~tm note large offset bullae in 7 and 8, again a common feature of the Benguela species. 9, 10. N. pachyderma (dextral), scale bar = 300 jam. 11, 12. N. pachyderma (dextral) N. dutertrei intergrades, scale bar = 300 jam. 13. N. dutertrei (adult, scale bar=500 jam). All N. dutertei forms are included in N. paehyderma Id) counts. 14 17. Gr. inflata, scale bar =400 ~tm note bullae in 14, and variance in wall structure similar to Glohorotalia puncticulata, in 15:
however, three chambers in final whorl allows classification as Gr. inflata.
M.G. Little et al. / Palaeogeography Palaeoclimatology, Palaeoecology 130 (1997) 135-161 145
PLATE I
1 4 6 M. G. Little et al. ; Palaeogeographv, Palaeoclimatology, Palaeoecology 130 (1997) 135 161
Fig. 7, Fluctuations in the relative abundances of the four major species of planktonic foraminifera with age. Isotope stages are given on the left for reference, whilst a schematic reference for episode dominance is given on the right. Episode A: Dominance of N. pachyderma (s)>40% over all others; Episode B: 20% each (or>) of N. paehyderma (s), N. pa~hyderma (d) and Gg. bulloMes; Episode C: Dominance of N. pachyderma (d) + Gg. bulloides both contributing to a total of ~ 80%: Episode D: Gr. i~flata > 20%. See text for discussion.
BCS. All of these conditions would be observed in the fossil record by a relative enhancement of the typical upwelling fauna, in particular NI pachy- derma (s). An alternative hypothesis, an increase in the nutrient supply by poleward undercurrents from the Angola Basin, was postulated by Summerhayes et al. (1995a) and Struck et al. (1993) using the 613C record of the surface dweller Gg. ruber, although no firm evidence for nutrient enrichment from the north has been proven.
The distribution of planktonic foraminiferal zones is linked to the oceanographic regimes which are presently occurring off the southwest African coast, The coccoliths and planktonic foraminifera
(Giraudeau and Rodgers, 1994) seem to be responding primarily to nutrient availability, and thus upwelling intensification and/or advection of Southern Ocean surface waters. Jansen et al. (1997) recorded high abundances of N. pachy- derma (s), within the Angola Basin, with maximum abundances throughout the last 160 kyr, and a peak in abundance during early isotope stage 3. The variation in planktonic foraminiferal abun- dances was correlated to physical shifts of the ABF in response to changes in the intensity and position of the South Atlantic Gyre and the Subtropical Convergence (STC). An equatorwards deflection of the ABF would produce a shift of
M.G. Little et al. / Palaeogeography, Palaeoclimatology, Palaeoecology 130 (1997) 135 161 147
I s o t o p e
s t a g e s
11
20
I 4 0 3 1
I
~. 60 I
< 80 .!-i
I
loo 51[' ' i
i-: 1 2 0 _ .
ot 1 4 0 "
0 5
GeoB 1711 % N. pachyderma (d) 0 I0 20 30 40 5 0 60 70 80 90 I I t [ I I I I I I
: E p i s o d e A
: E p i s o d e B
[ ~ : E p i s o d e C
[ ' " 1 : E p i s o d e D
i i i i i I i i i i , i i i , i t i
~0 15 20 25 30 35 40 0 5 Jo i s 20 25 30 35 40 45 50
% Gr. inflata % Gg. bulloides
% N. pachyderma (s) 0 10 20 30 4 0 50 60 70 80 90
Fig. 8. Fluctuations in the relative abundances of the four major species of planktonic foraminifera with age. Isotope stages are given on the left for reference, whilst a schematic reference for episode dominance is given on the right. Episode A: Dominance of N. paehyderma (s) >40% over all others; Episode B: 20% each (or >) of N. pachyderma (s), N. pachyderma (d) and Gg. bulloides; Episode C: Dominance of N. pachyderma (d) + Gg. bulloides both contributing to a total of ~ 80%; Episode D: Gr. inflata > 20%. See text for discussion.
the more eutrophic areas [dominated by N. pachy- derma (s)] to the north, whilst a poleward shift would decrease the relative nutrient supply at the Walvis Ridge by moving the upwelling centers south. In the extreme case, a large poleward dis- placement of the ABF as far as GeoB 1706 could be possible, extending the southerly intrusion of warm Angolan water onto the Walvis Ridge. I f the whole Benguela Upwelling System were to move with the ABF, we would predict maxima of N. pachyderma (s) at times of equatorward shifts.
The temporal fluctuations in the two planktonic foraminiferal records correlate well with the shifts of the ABF, described by the Benguela Index (Fig. 9). The fluctuations of N, pachyderma (s) in
GeoB 1706 and GeoB 1711 are directly comparable to similar peaks at 60-70 kyr in stage 4, and 45-50 and 30-35 kyr in stage 3, as seen in T89-32 ( 14°58.2'S, 10°41.6'E; Fig. 2) and T89-24 (8°54.7'S, 12°03.1'E) from the Angola Basin. Jansen et al. (1997) predict major equatorward shifts in isotope stage 4 and substages 3.3-3.1, and maximum pole- ward shifts in isotope substages 6.3, 5.5 and stage 1, although not a major equatorward shift at the LGM. In addition, the ABF record shows a similar position in late isotope stage 6-ear ly stage 5 to that of the Holocene. These shifts are mirrored in the Benguela Index records of GeoB 1706 and GeoB 1711, although there are differences, but they are mainly related to discrepancies within the
148 M.G. Little et aL/ Palaeogeography Palaeoclimatology, Palaeoecology 130 (1997) 135 16l
Latitude (°S) Benguela Index - GeoB 1706 6 0 50 4 0 30 20 I 0 0
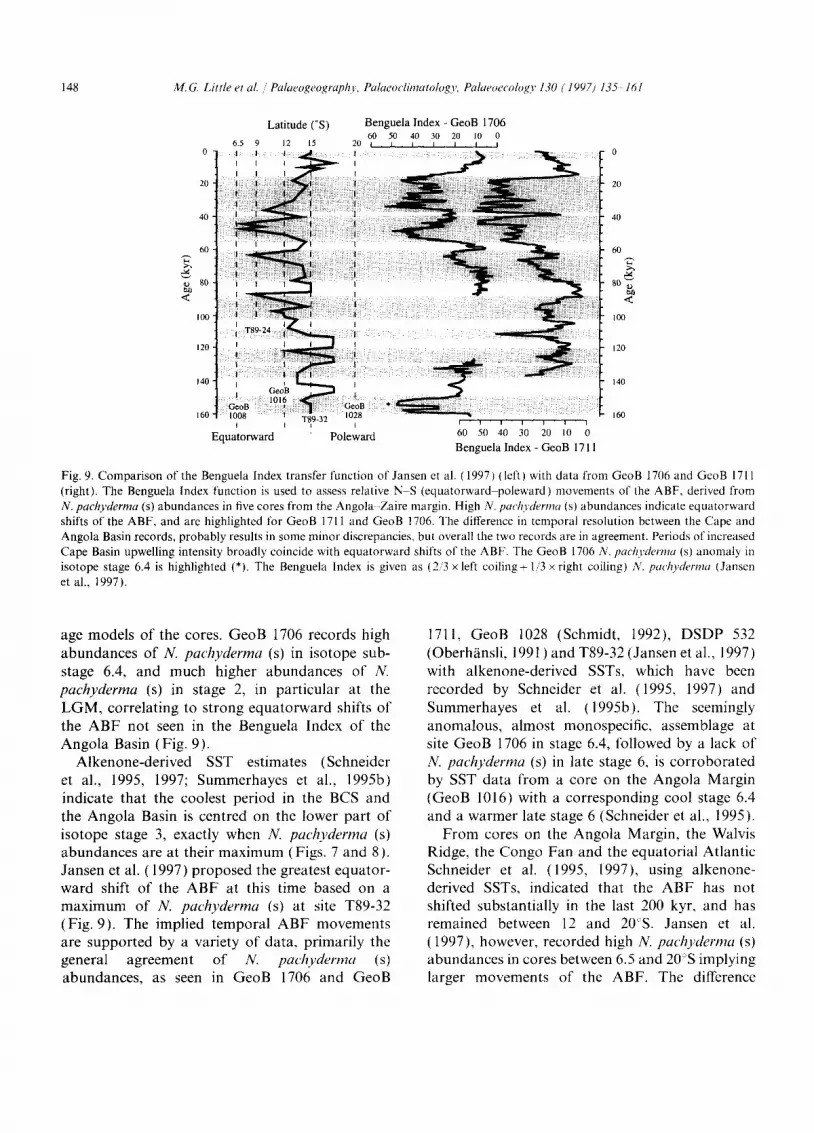
Fig. 9. Comparison of the Benguela Index transfer function of Jansen et al. (1997) (left) with data from GeoB 1706 and GeoB 1711 (right). The Benguela Index function is used to assess relative N S (equatorward poleward) movements of the ABF, derived from N. pachyderma (s) abundances in five cores from the Angola -Zaire margin. High N. pachyderma (s) abundances indicate equatorward shifts of the ABF, and are highlighted for GeoB 1711 and GeoB 1706. The difference in temporal resolution between the Cape and Angola Basin records, probably results in some minor discrepancies, but overall the two records are in agreement. Periods of increased Cape Basin upwelling intensity broadly coincide with equatorward shifts of the ABF. The GeoB 1706 N. pachyderma (s) anomaly in isotope stage 6.4 is highlighted (*). The Benguela Index is given as (2..'3 x left coiling+ 1..'3 x right coiling) N. pachyderma (Jansen et al., 1997).
age models o f the cores. GeoB 1706 records high abundances o f N. pachyderma (s) in isotope sub- stage 6.4, and much higher abundances of N. pachyderma (s) in stage 2, in particular at the L G M , correlating to strong equatorward shifts o f the A B F not seen in the Benguela Index of the Angola Basin (Fig. 9).
Alkenone-der ived SST estimates (Schneider et al., 1995, 1997; Summerhayes et al., 1995b) indicate that the coolest period in the BCS and the Angola Basin is centred on the lower part o f isotope stage 3, exactly when N. pachyderma (s) abundances are at their max imum (Figs. 7 and 8). Jansen et al. (1997) proposed the greatest equator- ward shift o f the A B F at this time based on a max imum of N. pachyderma (s) at site T89-32 (Fig. 9). The implied temporal A B F movements are supported by a variety o f data, primarily the general agreement o f N. pachyderma (s) abundances, as seen in GeoB 1706 and GeoB
1711, GeoB 1028 (Schmidt, 1992), D S D P 532 (Oberhfinsli, 1991 ) and T89-32 (Jansen et al., 1997) with alkenone-derived SSTs, which have been recorded by Schneider et al. (1995, 1997) and Summerhayes et al. (1995b). The seemingly anomalous , almost monospecific, assemblage at site GeoB 1706 in stage 6.4, followed by a lack of N. pachyderma (s) in late stage 6, is cor robora ted by SST data f rom a core on the Angola Margin (GeoB 1016) with a corresponding cool stage 6.4 and a warmer late stage 6 (Schneider et al., 1995).
F r o m cores on the Angola Margin, the Walvis Ridge, the Congo Fan and the equatorial Atlantic Schneider et al. (1995, 1997), using alkenone- derived SSTs, indicated that the A B F has not shifted substantially in the last 200 kyr, and has remained between 12 and 20'S. Jansen et al. (1997), however, recorded high N. pachyderma (s) abundances in cores between 6.5 and 20~S implying larger movements o f the ABF. The difference
M.G. Little et al. /Palaeogeography, Palaeoclimatology, Palaeoecology 130 (1997) 135-161 149
between the two datasets may be related to the habitat of the coccolithophores from which the alkenones and SSTs are derived. The alkenones, and therefore SSTs, are dependent upon the bio- geographic limits of coccolithophorids (review by Brassel, 1993). The coccolithophores respond to averaged temperature changes within the water- mass they inhabit, and often co-vary with the global glacial interglacial regime (M~iller et al., 1997, and others therein) and not directly with upwelling (Ten Haven and Kroon, 1991; Emeis et al., 1995). N. pachyderma (s) in the BCS, however, is found in the cores of the upwelling ceils (Ufkes and Zachariasse, 1993; Ufkes, 1997) and records the immediate, intensification of upwelling seemingly unaffected by the glacial-in- terglacial pattern. N. pachyderma (s) records the maximum fluctuations of the ABF, whilst the coccolith-derived SSTs are measuring the averaged effect of the upwelling cell fringes and global glacial-interglacial regime, not the position of the upwelling cores themselves. Most likely it is the combined effect of the physical movement of the ABF and an increase in upwelling intensity which accounts for the planktonic foraminiferal variations seen in the Angola and Cape basins.
Many of the previous studies in the BCS (Mclntyre et al., 1989; Schneider et al., 1995; Summerhayes et al., 1995b; Jansen et al., 1997) have discussed advection of Southern Ocean sur- face or intermediate waters as a result of equator- ward shifts of the Subtropical Convergence (STC). Morley (1989) and Howard and Prell (1992), studied the movements of the STC, situated to the south of Cape Town, marking the boundary between cold, polar-waters from the Southern Ocean and warmer waters of the South Atlantic. Using cores in the southern Indian Ocean, they recorded maximum poleward positions of the STC in isotope stages 11, 9, 5 and 1, from planktonic foraminiferal and radiolarian evidence, whilst max- imum equatorward positions were recorded in isotope stages 12, 10, 8, 6 and 4-2. The movements of the STC can be described by a two end-member system: (1) maximum poleward position of the STC, permitting the largest pulses of Indian Ocean water entry into the Atlantic, which is accompa- nied by maximum equatorward heat advection
into the BCS and the maximum poleward position of the ABF; and (2) maximum equatorward posi- tion of the STC, limiting the amount of Agulhas Current advecting into the Atlantic by formation of a thermal barrier or gradient off Cape Town. This may, in extreme cases, allow an increase in cold-water advection from either the South Atlantic Surface Water (SASW) or the Antarctic Intermediate Water (AAIW) below, without neces- sitating an unlikely shift of the polar front (Shannon et al., 1989). However, although the timing of events links well with the shifting of the ABF, as proposed by Jansen et al. (1997) and this paper, it still does not conclusively argue for or against an advectionally controlled system. For further evidence planktonic foraminiferal or SST data from the SBR are needed to record equator- ward heat flux around and past the Cape of Good Hope.
New core material and planktonic foraminiferal data (Little, 1997) were collected on the recent leg of the R.V. Meteor cruise M32/1 (January 1996). Onboard sampling and foraminiferal analysis has yielded the first conclusive evidence against cold- water advection from the south. Seven cores were recovered from varying water depths along three transects covering the Cape Basin from Cape Point to the Walvis Ridge. The cold-water N. pachyderma (s) was found to be almost completely absent in continental-slope cores from 2000 and 3000 m off Cape Town for the last 200,000 years (cores GeoB 3603 and GeoB 3602; Table 2). We are unable to report on the temporal fluctuations of the plank- tonic foraminiferal abundances in these cores as oxygen-isotope age models have not yet been pro- duced. No obvious sign of selective dissolution was observed and the other planktonic forms, typical of the SBR, were in great abundance with significant numbers of tropical forms, presumably intruding around from the Indian Ocean. A trend to higher maxima and average values is clearly obvious in a traverse from the Southern Cape Basin to the north (Table2). Full datasets and complete planktonic foraminiferal analyses are given in Little (1997). If northward advection was to play a major role in the planktonic foraminiferal variations seen in the Benguela Upwelling System, then we would almost certainly see the highest
150 M.G. Little et al. Palaeogeography, Palaeoc/imatology, Palaeoecology 130 (1997) 135 161
Table 2 Average and maximum relative abundances of sinistral coiling N. pachyderma for all cores analysed
Core site (water depth, m) Core position Average abundance Maximum abundance listed north to south N. pachyderma (s) N. pachyderma (s)
Values for GeoB 3606, GeoB 3605 and GeoB 3602 are marked by single excursions (anomalies) to higher values; first number given is the second highest recorded abundance. Within the three most southerly (poleward) cores (GeoB 3602, GeoB 3603 and GeoB 3604), values of abundance only exceed 10% four times in 30 m of core sampled. Note that average relative abundances are much lower in the southern reaches of the Cape Basin and that there is a positive trend to high values equatorward into the Northern Cape Basin. Core characteristics for GeoB 3602-GeoB 3608 are given in Bleil et al. (1996).
abundances of the cold-water N. pachyderma (s) in the south of the region, not the almost zero abundances actually recorded. We would therefore conclude that the ABF and trophic-area shifts described are responding primarily to changes in upwelling intensity via fluctuations in the BCS.
7.3. Trade windJorcing
Mclntyre et al. (1989) used ~lanktonic foramini- feral estimates of SST to estimate seasonality in the equatorial Atlantic. Seasonality maxima, largest summer winter temperature range, are recorded at similar times to greatest upwelling intensity in the BCS, and broadly coincide with the relative shifts of the ABF (Jansen et al., 1997). Trade wind zonality is strongly related to the seasonality at the equator (Mix et al., 1986; lmbrie et al., 1989; McIntyre et al., 1989; Little et al., 1995; Schneider et al., 1995; Mix and Morey, 1997), and also contributes to most of the SST, palaeoproductivity and palaeoceanography varia- tions within the BCS (Schneider et al., 1995; Summerhayes et al., 1995b; Jansen et al., 1997: Mix and Morey, 1997; Schneider et al., 1997, submitted). The records of GeoB 1706 and GeoB 1711 suggest intensification of upwelling in the northern Cape Basin coinciding with increased equatorial and Angola Basin upwelling, at times of increased trade wind zonality. There is no
evidence in support of the advection of Southern Ocean water across the STC, and equatorward heat advection, other than that from upwelling via the BCS, plays a minor if not insignificant'role in equatorial and Angola Basin palaeoceanography. It is the injection of newly upwelled BCS waters, rather than advection of Southern Ocean water, which Mclntyre et al. (1989) observed at the equator. The BCS is driven by atmospheric condi- tions controlling trade wind intensity and zonality over Southwestern Africa (Mclntyre et al., 1989; Schneider et al., 1995, 1997; Mix and Morey, 1997). Times of maximum abundances of N. pachyderma (s), indicate maximum offshore diver- gence and associated upwelling intensity, at times of maximum trade wind intensity and zonality.
Summerhayes et al. (1995b) suggested that upwelling increased in stages 4 and 3, but declined into stage 2. This was attributed to an equatorward shift of the trade winds in stage 2, leading to a marked decrease in upwelling at site PG/PC12. The planktonic foraminiferal record of GeoB 1711, on the continental slope nearby to PG/PC12, indi- cates that upwelling off Walvis Bay was intense throughout isotope stage 3 into early stage 2, with a decrease of intensity and associated reduction in zonality of the trade winds, from 15 ka to the present,
Trade wind zonality and intensification are intrinsically linked to global-atmosphere-cryo-
M. G, Little et al. /Palaeogeography, Palaeoclimatology, Palaeoecology 130 (1997) 135-161 151
sphere changes for at least the last 160,000yr. Planktonic foraminifera, SST and isotope records from sediment and ice cores in all of the world's major oceans (Yiou et al., 1991; Bond et al., 1992; Grousset et al., 1993; Park et al., 1993; Bender et al., 1994; Hagelberg et al., 1994; Mayewski et al., 1994; Kennett and Ingrain, 1995; Little et al., 1995; Behl and Kennett, 1996; Charles et al., 1996), record similar rapid, discrete events to those of the N. pachyderma (s) records of the BCS. The Benguela Upwelling system is in an important position that may influence cross-equatorial and inter-ocean heat flux. Further investigation into the timing and correlation of these global events is necessary to understand the complexity of cross- equatorial and inter-ocean teleconnections.
the Angola-Benguela Front situated to the north of the Walvis Ridge. The physical movement of the ABF cannot be disassociated from the increase in upwelling intensity recorded in the fossil record. The absence of high abundances of N. pachyderma (s) from the continental slope of the southern Cape Basin conclusively rules out Southern Ocean sur- face water advection. Upwelling intensification along the entire coast of western and southwestern Africa is generated by changes in the strength and zonality of the trade wind system, responding to similar shifts and intensity of the atmospheric and oceanic gyres. Similar rapid events in all of the world's oceans suggest global variations in cross- equatorial and inter-ocean teleconnections.
8. Summary
The planktonic foraminiferal records for GeoB 1706 and GeoB 1711 show that the abundance of the cold-water planktonic foraminifer, N. pachy- derma (s), does not vary with the global glacial-in- terglacial pattern. Four species make up over 95% of the variation within the core, and enable the record to be divided into episodes characterized by specific planktonic foraminiferal assemblages, with meaningful ecological significance when com- pared to those of the modern day. N. pachyderma (s), dominates the modern-day, coastal upwelling centres; Gr. inflata characterizes the oligotrophic, offshore zone of the SBR; and together, Gg. bul- loides and N. pachyderma (d) inhabit the meso- trophic areas of the mixed zone in the NBR. In the fossil record, the planktonic foraminifera are thought to be varying largely with changing nutri- ent supply, and the subsequent levels of primary productivity, according to local water hydrography and oceanography currently existing offshore Namibia and western South Africa. In cores GeoB 1706 and GeoB 1711, episodes of high N. pachy- derma (s) abundances are interpreted as evidence of increased upwelling intensity, and the associated increase in nutrients. Periods of high N. pachy- derma (s) abundances describe rapid, discrete events dominating isotope stages 3 and 2, the timing of which correlate to the temporal shifts of
Acknowledgements
We thank the crew and scientists aboard R.V. Meteor for their help with coring and sampling operations during cruises to the South Atlantic. We are grateful to Colin Summerhayes, Wolfgang Berger, John Rogers and Kate Darling whose comments and critical review significantly improved the manuscript. We would also like to thank Monika Segl and Birgit Meyer-Schack for their assistance with the mass spectrometers and both Alastair Matthewson and Ian Alexander for their helpful advice and discussion. This research was funded by the Natural Environmental Research Council (NERC grant GR3 8344 at Edinburgh University) and the Deutsche Forschungsgemeinschaft (Sonderforschungs- bereich 261 at Bremen University, Contribution No. 132).
Appendix A
Oxygen-isotope data from GeoB 1711, using the benthic foraminifer Cibicidoides wuellerstorfi. The depth scale is the combined depths of the upper box core and the longer gravity core. The 813C and 8180 values are both parts per thousand (%,,)
152 M.G. Little et al. / Palaeogeography. Palaeoclimatology. Palaeoeeology 130 ( 19971 135 161
M.G. Little et aL / Palaeogeography, Palaeoclimatology, Palaeoecology 130 (1997) 135-161 153
Oxygen- and carbon-isotope data from GeoB 1706, using the planktonic foraminifer Globorotalia inflata. The 8~3C and 8180 values are both parts per thousand (%0)
154 M. G. Little et al. , Palaeogeography, Palaeoclimatologi,, Palaeoecolog 3, 130 (19971 135 161
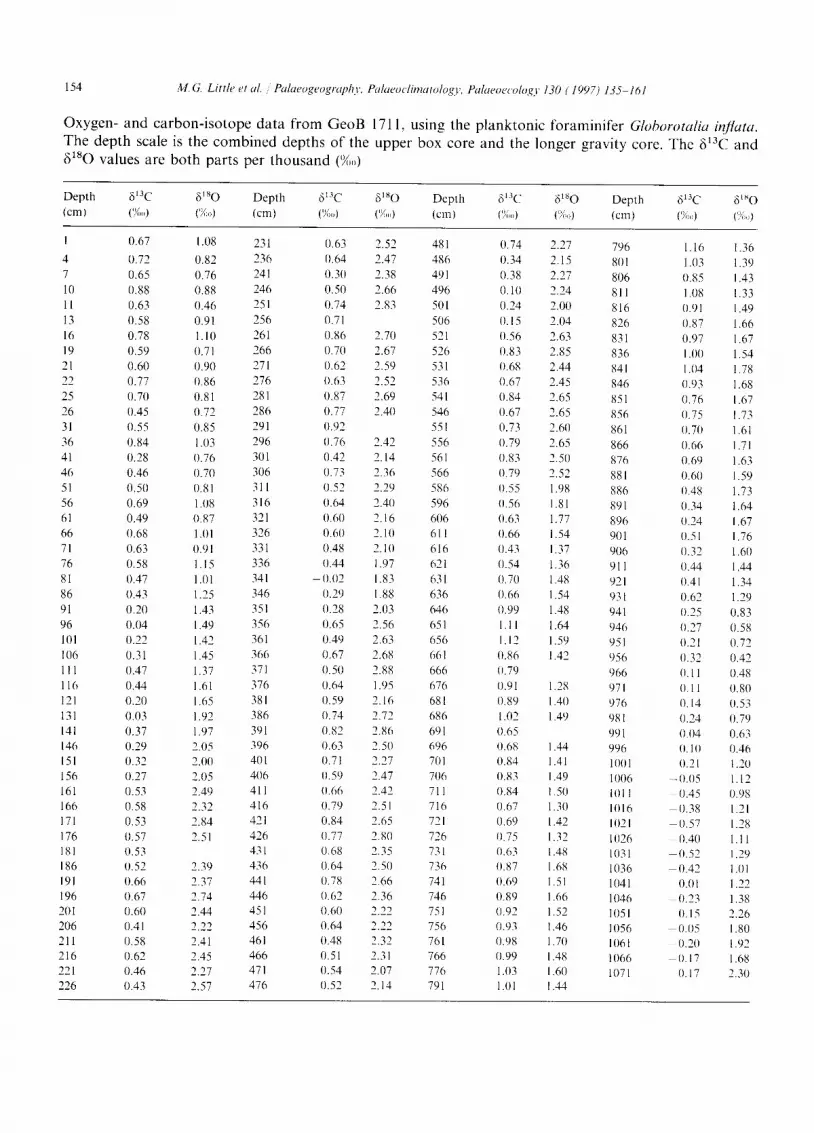
Oxygen- and carbon-isotope data from GeoB 1711, using the planktonic foraminifer Globorotalia inflata. The depth scale is the combined depths of the upper box core and the longer gravity core. The 813C and 6180 values are both parts per thousand (%o)
M.G. Little et al. / Palaeogeography, Palaeoclimatology, Palaeoecology 130 (1997) 135 161 155
Relative abundances of planktonic foraminifera from GeoB 1706. Abbreviations are as follows: N. pachy (s) = N. pachyderma (s); Gg. bull. = Gg. bulloides; N. pachy ( d ) = N. pachyderma (d); Gr. inf. = Gr. inflata
Depth N. pachy(s ) Gg. bull. N. p a c h y ( d ) Gr. inK Depth N. pachy(s ) Gg. bull. N. pachy (d ) Gr. inf. (cm) (%) (%) (%) (%) (cm) (%) (%) (%) (%)
M.G. Little et al. / Palaeogeography, Palaeoclimatology, Palaeoecology 130 (1997) 135-161 157
Relative abundances of planktonic foraminifera from GeoB 1711. Abbreviations are as follows: N. pachy. ( s )=N. pachyderma (s); Gg. bull. = Gg. bulloides; N. pachy ( d ) = N . pachyderma (d); Gr. inf. = Gr. inflata. The composite depth scale incorporates the upper box core (BC) and the longer gravity core
Depth N. pachy. (s) Gg. bull. N. pachy. (d) Gr. inf. Depth N. pachy. (s) Gg, bull. N. pachy. (d) Gr. inf. (cm) (%) (%) (%) (%) (cm) (%) (%) (%) (%)
M. G. Little et al. / Palaeogeography, Palaeoclimatology, PaIaeoecology 130 (1997) 135 161 159
References
Bang, N.D., 1971. The southern Benguela Current region in February 1966. Part 2. Bathymetry and air/sea interactions. Deep-Sea Res., 18:209 265.
Barange and Pillar, 1992. Cross-shelf circulation, zonation and maintenance mechanisms of Nyctiphanes capensis and Euphasia hanseni (Euphausiacea) in the northern Benguela upwelling system. Cont. Shelf Res., 12: 1027-1042.
B6, A.W.H. and Tolderlund, D.S., 1971. Distribution and ecol- ogy of living planktonic foraminifera in surface waters of the Atlantic and Indian Oceans. In: B.M. Funnel and W.R. Riedel (Editors), The Micropalaeontology of the Oceans. Cambridge Univ. Press, pp. 105 149.
Behl, R.J. and Kennett, J.P., 1996. Brief interstadial events in the Santa Barbara Basin, NE Pacific, during the past 60 kyr. Nature, 379:243 246.
Bender, M., Sowers, T., Dickson, M.-L., Orchado, J., Grootes, P., Mayeweski, P.A. and Meese, D.A., 1994. Climate correla- tions between Greenland and Antarctica during the past 100,000 years. Nature, 372:663 666.
Bleil, U. and participants, 1996. Bericht und erst Ergenbnisse tiber die METEOR-Fahrt M32/1, Cape Town Walvis Bay, 2.1.1996-28.1.1996. Ber Fachbereich Geowiss., Univ. Bremen.
Bond, G., Heinrich, H., Broecker, W., Labeyrie, L., McManus, J., Andrews, J., Huon, S., Jantschik, R., Clasen, S., Simet, C., Tedesco, K., Klas, M., Bonani, G. and Ivy, S., 1992. Evidence for massive discharges of icebergs into the North Atlantic ocean during the last glacial period. Nature, 360: 245 249.
Boyd, A.J., Salat, J. and Maso, M., 1987. The seasonal intrusion of relatively saline water on the shelf off northern and central Namibia. S. Afr. J. Mar. Sci., 5: 107-120.
Brassel, S.C., 1993. Applications of biomarkers for delineating marine palaeoclimatic fluctations during the Pleistocene. In: M.H. Engel and S.A. Macko (Editors), Organic Geochemis- try: Principles and Applications. Plenum Press, pp. 699-738.
Bremner, J.M., 1983. Biogenic sediments on the South West African (Namibian) continental margin. In: J. Thiede and E. Suess (Editors), Coastal Upwelling: Its Sediment Record. Part B: Sedimentary Records of Ancient Coastal Upwelling. Plenum Press, pp. 73 104.
Brown, P.C., Painting, S.J. and Cochrane, K.L., 1991. Esti- mates of phytoplankton and bacterial biomass and pro- duction in the northern and southern Benguela ecosystems. S. Afr. J. Mar. Sci., 11: 537-564.
Calvert, S.E. and Price, N.B., 1983. Geochemistry of Namibian shelf sediments. In: E. Suess and J. Thiede (Editors), Coastal Upwelling, its Sediment Record: Part A: Responses of the Sediment Regime to Present and Coastal Upwelling. Plenum Press, pp. 337--375.
Charles, C.D., Lynch-Stieglitz, J., Ninnemann, U.S. and Fair- banks, R.G., 1996. Climate connections between the hemi- sphere revealed by deep sea sediment core/ice core correlations. Earth Planet. Sci. Lett., 142: 19-27.
Dingle, R.V., 1995. Continental shelf upwelling and benthic
ostracoda in the Benguela System (southeastern Atlantic Ocean). Mar. Geol., 122: 207-225.
Dingle, R.V. and Nelson, G., 1993. Sea bottom temperature, salinity and dissolved oxygen on the continental margin off south-western Africa. S. Afr. J. Mar. Sci., 13: 33-49.
Duncombe-Rae, C.M., 1991. Agulhas retroflexion rings in the South Atlantic Ocean: an overview. S. Aft. J. Mar. Sci., 11: 327-344.
Emeis, K.-C., Anderson, D.M., Doose, H., Kroon, D. and Schultz-Bull, D., 1995. Sea surface temperatures and the his- tory of monsoon upwelling in the NW Arabian Sea during the last 500 kyr. Quat. Res., 43: 355-361.
Giraudeau, J., 1993. Planktonic foraminiferal assemblages in surface sediments from the southwest African continental margin. Mar. Geol., 110: 1-16.
Giraudeau, J. and Rogers, J., 1994. Phytoplankton biomass and sea-surface temperature estimates from sea-bed distribution of nannofossils and planktonic foraminifera in the Benguela Upwelling System. Micropalaeontology, 40(3): 275-285.
Giraudeau, J., Monteiro, P.M.S. and Nikodemus, K., 1993. Distribution and malformation of living coccolithophores in the northern Benguela upwelling system off Namibia. Mar. Micropalaeontol., 22: 93-110.
Giraudeau, J., Summerhayes, C.P. and Kroon, D., 1997. Upwelling variability off Namibia from phytoplankton bio- mass estimates over the last 70,000 years (in prep.).
Grousset, F.E., Labeyrie, L., Sinko, J.A., Cremer, M., Bond, G., Duprat, J., Cortijo, E. and Huon, S., 1993. Patterns of ice rafted detritus in the glacial North Atlantic (40 55'~N). Paleoceanography, 8: 175-192.
Hagelberg, T.K., Bond, G. and de Menocal, P., 1994. Milan- kovitch band forcing of sub-Milankovitch climate variability during the Pleistocene. Paleoceanography, 9: 545-558.
Imbrie, J., Hays, J.D., Martinson, D.G., McIntyre, A., Mix, A.C., Morley, J.J., Pisias, N.G., Prell, W.L. and Shackleton, N.J., 1984. The orbital theory of pleistocene climate: support from a revised chronology of the marine 61so record. In: A. Berger, J. Imbrie, J. Hays, G. Kukla and B. Saltzman (Edi- tors), Milankovitch and Climate, Part I. Reidel, pp. 269 305.
Imbrie, J., McIntyre, A. and Mix, A., 1989. Oceanic response to orbital forcing in the Late Quaternary: Observational and experimental strategies. In: A. Berger (Editors), Climate and Geo-Sciences. Kluwer Academic Publishers, pp. 121-164.
Jansen, F., Ufkes, E. and Schneider, R., 1997. Late Quaternary movements of the Angola-Benguela Front, SE Atlantic, and their response to orbital forcing. In: G. Wefer, W.H. Berger, G. Siedler and D. Webb (Editors), The South Atlantic: Pre- sent and Past circulation. Springer, Berlin, pp. 553-575.
Kennett, J.P. and Ingram, B.L., 1995. A 20,000 year record of ocean circulation and climate change from the Santa Barbara Basin. Nature, 377: 510-513.
Kennett, J.P. and Srinivasan, M.S., 1983. Neogene planktonic foraminifera: A Phylogenetic Atlas. Hutchison Ross, Stroudsburg, PA, 265 pp.
Kipp, N.G., 1976. New transfer function for estimating past sea-surface conditions from sea-bed distribution of plank- tonic foraminiferal assemblages in the North Atlantic. In:
160 M.G. Little et al. /Palaeogeography, Palaeoclimatology, Palaeoecology 130 (1997) 135-161
R.M. Cline and J.D. Hays (Editors), Investigation of South- ern Ocean Palaeoceanography and Palaeoclimatology. Geol. Soc. Am. Mem. 145.
Kroon, D., 1991. Distribution of extant planktic foraminiferal assemblages in Red Sea and nothern Indian Ocean surface waters. Rev. Esp. Micropaleontol., 23 (1): 37 74.
Kroon, D. and Ganssen, G., 1989. Northern Indian Ocean upwelling cells and the stable isotope composition of living planktonic foraminifera. Deep Sea Res., 36:1219 1236.
Little, M.G., 1997. Late Quaternary Palaeoceanography of the Benguela Upwelling System, Eastern South Atlantic Ocean. Ph.D. Thesis, Edinburgh Univ.
Little, M.G., Kroon, D., Schneider R.R., Price, B., MUller, P. and Wefer, G., 1995. Late Quaternary palaeoceanography and palaeoproductivity of the Benguela upwelling system for the last 180,000 years. ICP V Halifax, Nova Scotia. Abstract volume, pp. 133 134.
Little, M. G., Kroon, D., Schneider, R.R., Price, N.B. and Summerhayes, C., in press. Trade Wind forcing of upwelling, seasonality, and Heinrich events as a response to sub-Milan- kovitch climate variability. Paleoceanography.
Lutjeharms, J.R.E. and Meeuwis, J.M.~ 1987. The extent and variability of SE Atlantic upwelling. S. Aft. J. Mar. Sci., 5: 51-62.
Lutjeharms, J.R.E. and Stockton, P.L., 1987. Kinematics of the upwelling front off southern Africa. S. Afr. J. Mar. Sci., 5: 35-49.
Mayewski, P.A., Meeker, L.D., Whitlow, S., Twickler, M.S., Morrison, M.C., Bloomfield, P., Bond, G.C., Alley, R.B., Gow, A.J., Grootes, P.M., Meese, D.A., Ram, A., Taylor, K.C. and Wumkes, W., 1994. Changes in atmospheric circu- lation and ocean ice cover over the North Atlantic during the last 41,000 years. Science, 263:1747 1751.
McIntyre, A., Ruddiman, W.F., Karlin, K. and Mix, A.C., 1989. Surface water response of the equatorial Atlantic Ocean to orbital forcing. Paleoceanography, 4: 19-~55.
Meeuwis, J.M. and Lutjeharms, J.R.E., 1990. Surface thermal characteristics of the Angola-Benguela front. S. Afr. J. Mar. Sci., 9:261 279.
Mix, A.C. and Morey, A.E., 1997. Climate feedback and Pleis- tocene variations in the Atlantic South Equatorial Current. In: G. Wefer, W.H. Berger, G. Siedler and D. Webb (Edi- tors), The South Atlantic: Present and Past Circulation. Springer, Berlin, pp. 503--525.
Mix, A.C., Ruddiman, W.F. and McIntyre, A., 1986. Late Qua- ternary paleoceanography of the tropical Atlantic, 2: The seasonal cycle of sea surface temperatures, 0 20,000 years B.P. Paleoceanography, 1:339 353.
Morey, J.J., 1989. Variations in high-latitude oceanographic fronts in the southern Indian Ocean: An estimation based on faunal changes. Paleoceanography, 4: 547-554.
MUller, P.J., Cepek, M,, Ruhland, G. and Schneider, R.R., 1997. Alkenone and coccolithophorid species changes in late Quaternary sediments from the Walvis Ridge: Implications for the alkenone palaeotemperature method. Palaeogeogr., Palaeoclimatol., Palaeoecol. (submitted).
Oberhfinsli, H., 1991. Upwelling signals at the northeastern
Walvis Ridge during the past 500,000 years. Paleoceanog- raphy, 6:53 71.
Parker, F.L., 1962. Planktonic foraminiferal species in Pacific sediments. Micropalaeontology, 8: 219-254.
Park, J., D'Hondt, L.D., King, J.W. and Gibson, C., 1993. Late Cretaceous precessional cycles in double time: A warm-Earth Milankovitch response. Science, 261:1431 1434.
Prell, W.L. and Curry, W.B., 1981. Faunal and isotopic indices of monsoonal upwelling: Western Arabian Sea. Oceanol. Acta 4.
Reynolds, L.A. and Thunnel, R.C., 1985. Seasonal succession of planktonic foraminifera in the subpolar North Pacific. J. Foraminiferal Res., 15: 282-301.
Rogers, J. and Bremner, J.M., 1991. The Benguela Ecosystem. Part VII. Marine geological aspects. Oceanogr. Mar. Biol. Annu. Rev., 29:1-85.
Schmidt, H.. 1992. Der Benguela Strom im Bereich des Walfisch RUckens im Sp~tquartO.r. Ph.D. Thesis, Univ. Bremen, 28, 172 pp.
Schneider, R.R., 1991. Spfitquart~re Produktivitfits~inderungen im 6stlichen Angola-Becken: Reaktion auf Variationen im Passat-Monsun-Windsystem und in der Advektion des Benguela-Kfistenstroms. Ph.D. Thesis, Univ. Bremen, 21, 198 pp.
Schneider. R.R., MUller, P.J. and Ruhland, G., 1995. Late Qua- ternary surface circuation in the east-equatorial south Atlan- tic: Evidence from Alkenone sea-surface temperatures. Paleoceanography, 10:197 219.
Schneider, R.R., MUller, P.J., Ruhland, G., Meinecke, G., Schmidt, H. and Wefer, G., 1997. Late Quaternary surface temperatures and productivity in the east-equatorial South Atlantic: Response to changes in Trade/Monsoon Wind forc- ing and surface water advection. In: G. Wefer, W.H. Berger, G. Siedler and D. Webb (Editors), The South Atlantic: Pre- sent and Past Circulation. Springer, Berlin, pp. 527 551.
Schneider. R.R., Mfiller, P.J., Kroon, D., Price, B. and Alexan- der, I.~ in press. Monsoon related Zaire (Congo) discharge fluctuations and influence of fluvial silicate supply on marine productivity in the east equatorial Atlantic over the last 200,000 years. Paleoceanography.
Schulz, H.D. and cruise participants, 1992. Bericht und erst Ergenbnisse fiber die METEOR-Fahrt M20/2, Abidjan-Da- kar, 27.12.1991 3.2.1992. Ber. Fachbereich Geowiss. Univ. Bremen 25, 173 pp.
Shaffer, G., 1993. Effects of the marine biota on global carbon cycling. In: M. Heinmann (Editor), The Global Carbon Cycle. Springer Verlag.
Shannon, L.V., 1985. The Benguela Ecosystem Part 1: Evolu- tion of the Benguela, physical features and processes. Oceanogr. Mar. Biol. Annu. Rev., 23:105 182.
Shannon, L.V. and Nelson, G., 1997. The Benguela physical features, shelf dynamics and system variability. In: G. Wefer, W.H. Berger, G. Siedler and D. Webb (Editors), The South Atlantic: Present and Past Circulation. Proc. S. Atlantic Conf., Bremen, 15 19 August, Springer, Berlin, pp. 163 210.
Shannon, L.V.. Lutjeharms, J.R.E. and Agenbag, J.J., 1989.
M. G. Little et al. /Palaeogeography, Palaeoclimatology, Palaeoecology 130 (1997) 135-161 161
Episodic input of Subantarctic water into the Benguela region. S. Afr. Tydskr. Wet. 85.
Struck, U., Sarnthein, M., Westerhausen, L., Barnola, J.M. and Raynauld, D., 1993. Ocean-atmosphere carbon exchange: impact of the "biological pump" in the Atlantic equatorial upwelling belt over the last 330,000 years. Palaeogeogr., Palaeoclimatol., Palaeoecol., 103: 41-56.
Summerhayes, C.P., Emeis, K.C., Angel, M.V., Smith, R.L. and Zeitzschel, B., 1995a. Upwelling in the ocean: Modern processes and ancient records. In: C.P. Summerhayes, K.C. Emeis, M.V. Angel, R.L. Smith and B. Zeitzschel (Editors), Upwelling in the Ocean. Dahlem Workshop Report. Wiley, pp. 1-38.
Summerhayes, C.P., Kroon, D., Rosel-Mel& A., Jordan, R.W., Schrader, H.J., Hearn, R., Villanueva, J., Grimalt, J.O. and Eglinton, G., 1995b. Variability in the Benguela Current System over the last 70,000 years. Prog. Oceanogr., 35: 207 251.
Ten Haven, H.L. and Kroon, D., 1991. Late Pleistocene sea surface temperature variations off Oman as revealed by the distribution of long-chain alkenones. Proc. ODP, Sci. Results, 117: 445-452.
Thiede, J., 1975. Distribution of foraminifera in surface waters of a coastal upwelling area. Nature, 253: 712-714.
Ufkes, E., 1997. Planktonic foraminifera in the surface waters of the eastern South Atlantic during springtime. Oceanol. Acta (submitted).
Ufkes, E. and Zachariasse, W.-J., 1993. Origin of coiling differ- ences in living negloboquadrinids in the Walvis Bay region, off Namibia, Southwest Africa. Micropalaeontology, 39: 283-287.
Yiou, P., Genthon, C., Ghil, M., Jouzel, J., Le Treut, H., Bar- nola, J.M., Lorius, C. and Korotkevitch, Y.N., 1991. High- frequency palaeovariability in climate and CO2 levels from Vostock ice core records. J. Geophys. Res., 96: 20,365 20,378.