Journal of Volcanology and Geothermal Research, 40 (1990) 327-342 Elsevier Science Publishers B.V., Amsterdam--Printed in The Netherlands
327
Renewal of explosive activity at Vesuvius: models for the expected tephra fallout
G I O V A N N I M A CEDONIO a, M. TERESA PARESCHI b and ROBERTO SANTACROCE c
a Centro di Studio per la Geologia Strutturale e Dinamica dell'Appennino, CNR, Via Santa Maria 53, 1- 56100, Pisa, Italy
b Centro Ricerca IBM, Via Santa Maria 67, 1-56100, Pisa, Italy c Dipartimento di Scienze della Terra, Via Santa Maria 53, 1-56100, Pisa, Italy
(Received January 26, 1989; revised and accepted October, 18, 1989)
Abstract
Macedonio, G., Pareschi, M.T. and Santacroce, R., 1990. Renewal of explosive activity at Vesuvius: models for the expected tephra fall out. J. Volcanol. Geotherm. Res., 40: 327-342.
One of the major problems concerning the assessment of volcanic hazard at Vesuvius is to determine the type and size of the eruptive event that will characterize the volcano when it becomes active once again. During its history, Somma-Vesuvius has exhibited different types of activity, ranging from quiet lava emission to moderate strombolian activity, to catastrophic plinian eruptions. Available data support a behavior model characterized by the increasing size and explosiveness of the eruptions with increasing repose time, as a consequence of a roughly constant periodic supply of deep basic magma to a shallow magma chamber and differentiation and mixing in the chamber. After the A.D. 79 eruption, a homogene- ous HK (high potassium) nature of erupted products was reflected by a magma alimentation rate roughly estimated at 1.5-2.0 millions of cubic meters per year. Assuming no major changes have occurred in the feeding system of the volcano after its last eruption in 1944, a volume of 40-70 × 106 m 3 magma could be considered presently available for a renewal of activity at Vesuvius. The emission of such a mass of magma during a single eruption would result into the largest event since the highly disruptive 1631 subplinian eruption. Presently, no possibility exists to forecast the eruptive character of such an eruption, and either a "ultrastrombolian" or a "subplinian" case appear equally possible. The latter possibility im- plies the highest potential hazard. This paper provides the numerical simulations of the main eruptive phenomenon that probably will occur during this "maximum expected event": the fallout of tephra from a high, sustained eruption column. After the initial explosive opening of the vent, the scenario consists of the formation of a high convective column with lee-side fallout of pumice and lithic fragments, accom- panied and followed by column collapses generating pyreclastic flows and surges. The column behavior was numerically simulated by using the Wilson and Walker column model with the following input parameters: mass eruption rate between 0.4 and 2.0 × 10⁷ kg s -1, gas content between 5 and 10 wt.%, lithic content 20 wt.%, basal radius of the column larger than the minimum value for subsonic initial velocity of the jet. The resulting maximum column height and maximum gas thrust height were respec- tively 11-16 km and below 1000 m. The tephra fallout was modeled by a continuity equation solved on a nonuniform three-dimensional grid. The input parameters to the model are: seasonal wind velocity pro- files; eddy diffusion coefficients of 3000 m 2 s -1 (horizontal) and 50 m 2 s -1 (vertical); particles whose nature and grain size are inferred after data on pyroclastic deposits from ancient Vesuvius eruptions distributed along a vertical linear source. The hazard implications of the different modeled cases are brief- ly discussed.
The last eruption of Vesuvius occurred in March 1944. Since that t ime the volcano has lain in a complete quiescent state and there are no indications at all suggesting a renewal of its activity. However, Vesuvius must be con- sidered a very dangerous active volcano. Dur- ing its long life it has experienced long rest periods many times, which in some cases, lasted centuries or tens of centuries. The history of the volcano suggests a more and more violent awakening the longer the preceding repose.
The present senseless urbanization of the vesuvian area results in a situation of extreme- ly high potential risk. On the slopes of the volcano and within 10 km from the summit crater more than 700,000 people live today and
the outskirts of Naples itself are not more than 15 km from the vent (Fig. 1). An unexpected eruption would have today heavy conse- quences, surely not mitigable under contigent solicitation.
The Italian scientific community is, however, conscious of the problem, and it is quite im- probable that an eruption would occur without the volcano surveillance network being able to recognize adequately in advance the coming danger. However, this is only one aspect of the question: another point, equally important for the assessment of volcanic hazard at Vesuvius, and probably that whose solution is the hardest, concerns the forecasting of type and size of the future eruption. Only if such elements have been correctly evaluated, the Public Authority will have the possibility of planning interventions which are neither in-
Fig. 1. The Somma-Vesuvius volcanic complex and the surrounding urban area.
EXPLOSIVE ACTIVITY AT VESUVIUS: MODELS FOR EXPECTED TEPHRA FALLOUT 329
adequate nor excessive. The zonation and assessment of the volcanic
hazard at Vesuvius have been the object of many Italian research programs in the last years. These researches allowed firstly the reconstruction of the eruptive history of the volcano, by defining different types of activity, length of the repose periods, nature and com- position of erupted products (Scandone, 1977; Delibrias et al., 1979; Barberi et al., 1981; Car- ta et al., 1981; Arno' et al., 1987; Joron et al., 1987), with the prime purpose of understanding the behavior of the volcano (Santacroce, 1983). The different types of eruption were therefore analyzed through detailed studies of single events and the eruptive dynamics were recon- structed (Sheridan et al., 1981; Rosi and San- tacroce, 1983; Scandone et al., 1986; Bertagnini et al., 1987; Barberi et al., 1989). Once this in- dispensable knowledge was obtained, pre- liminary volcanic hazard maps were drawn for the different past eruptive phenomena (Scan- done, 1977; Barberi et al., 1977; Rosi et al., 1982; Barberi et al., 1983; Luongo, 1987; Rosi et al., 1987), and, finally, computer-assisted simulations of some historical events were made (Macedonio et al., 1987, 1988).
This paper should represent a further signifi- cant advancement towards scientifically reliable evaluation of volcanic hazard related to explosive renewal of Vesuvius activity. The areas of different probable danger have been identified by referring to an explosive "max- imum expected event" having defined dimen- sions and by using a numerical model for the assessed eruptive phenomenon, the fallout of tephra.
Type and size of the expected eruption
The beginning of the volcanic activity in the Vesuvius area, as deduced by the age of a lava cut by a deep geothermal well drilled on the southeastern slope of the volcano, dates back to about 0.3-0.5 Ma, but reliable geological infor- mation is limited to the last 20-25,000 years.
In this time interval, Vesuvius has exhibited extremely variable kinds of activity ranging from quiet lava emission and moderate strom- bolian explosions to catastrophic explosive pli- nian eruptions. For the sake of simplicity, three main categories of eruptions can be schema- tically distinguished:
(1) Small size, "ultrastrombolian" (million tons of erupted magma). A typical example is the 1906 eruption. Eruptive phenomena record- ed for this type of event consist of lava effusion, lava fountains and moderate tephra fallout. Minor pyroclastic surges can occur. Mud flows originate by the heavy rain which constantly accompanies these eruptions. The slumping of hot pyroclastic material from the oversteepen- ed cone of Vesuvius, the "hot avalanches" of Perret (1924), is also common.
(2) Medium size, "subplinian" (hundreds of million tons of erupted magma). The reference example is the A.D. 472 eruption. This type of eruption is exclusively explosive. The fallout of tephra and the formation of highly disruptive glowing clouds appear to be the most dangerous eruptive phenomena. Within the observed pyroclastic sequences, pyroclastic surge depo- sits generally do not show textural features of high-energy emplacement. The emplacement of huge lahars is, on the contrary, a frequent and well documented phenomenon.
(3) Large size, "plinian" (billions of tons of erupted magma). The reference example is the A.D. 79 "Pompei" eruption. Plinian pumice eruptions are by far the most dangerous events of Somma-Vesuvius. They typically start with the paroxysmal ejection of large volumes of pumice with minor lithic xenoliths; ash-cloud surges are a common phenomenon during the final part of the pumice-fall phase. The emplacement of large pyroclastic flows and mud flows generally closes the eruption cycle. Ash clouds and mud hurricanes are associated with pyroclastic flows over generally limited distances.
The past history of the volcano suggests that the size and the explosivity of eruptions in-
330 G. M A C E D O N I O E T A L .
E v
W
J 0 >
<(
CO <(
n o H
~J
[] H [0 W rr
I J_ 0 UP
Z C)
u
o
. I (b)
(a) . . . . i . . . . i ' ' ~ l ~ '
~ N T 1i694-19Z41 ICTIVITY
• I . , I , . I
IO I00 I000
REPOSE TIME PRECEDING THE ERUPTION (YEARS)
• i I I
pU~EN* --_ _ _ y ~EENI~
/ I i . /
i@3i - iq44 Lava flows ~--- 1 1 /x
+ ~ */ g.O. lS3t / / J + /~/
++ / + /
+ / + / ÷ J
+ J t- /
. 7 I
1 0 , I , , I
iO0 iO00
REPOSE TIME PRECEDING THE ERUPTION {YEARS}
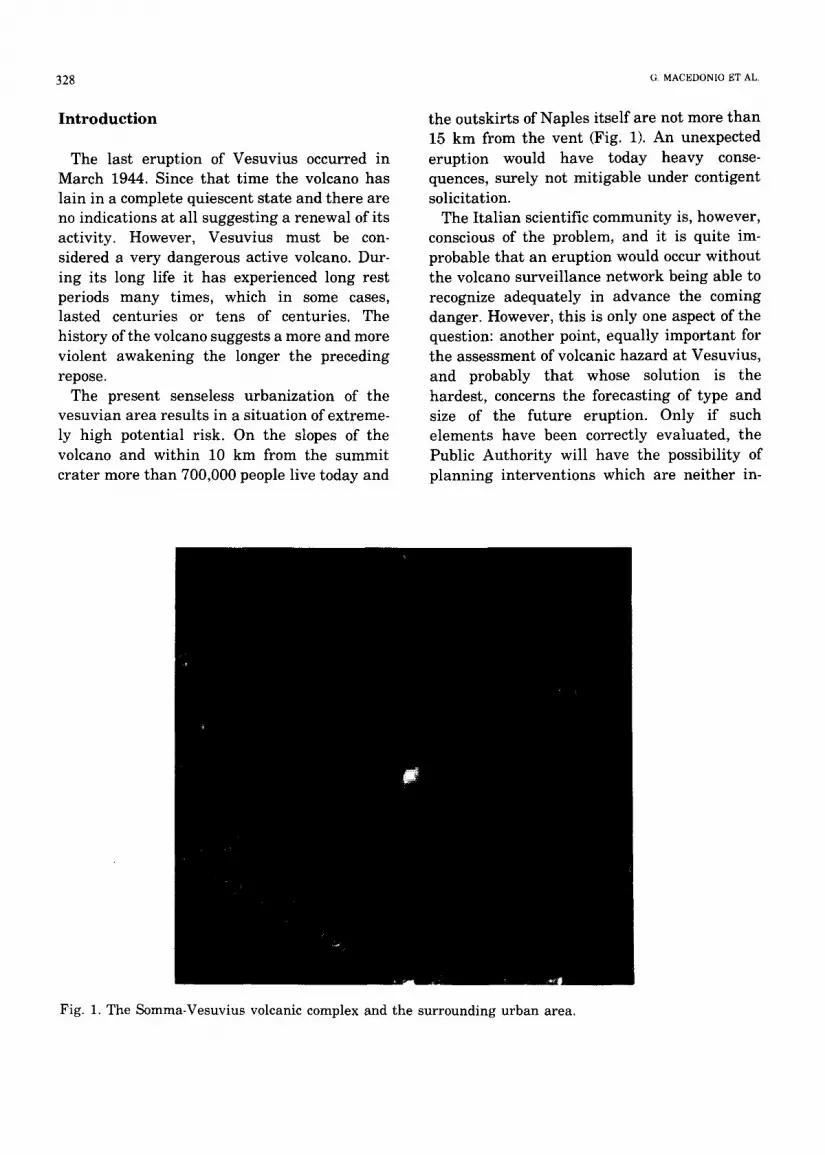
Fig. 2. a. Rates of magma supply (alimentation) and eruption vs repose time in the past A.D. 79 period. Circle shows the volume of erupted magma during the A.D. 472 subplinian eruption; asterisk gives the calculated volume of basic magma that entered the chamber (Rosi and Santacroce, 1983). Bold line represents average eruption rate in the period 1694-1944 (1.6 x 10 -3 km 3 yr -] as calculated by Cortini and Scandone (1982) (Modified after Rosi et al., 1987). b. Control of degree of magma fractionation by repose time. Fraction of the residual liquid has been calculated using imcompatible trace elements. Bars refer to the emission of compositionally graded magma. Pollena: A.D. 472; Greenish: about 15,500 yr B.P.; Pompei: A.D. 79; Mercato: about 7,900 yr B.P.; Avellino: about 3.800 yr B.P. The repose times preceeding the eruptions are preferred values from Rosi et al. (1987); possible range are: A.D. 1631 = 280 to 130 (preferred); A.D. 472 = 270 (preferred) to 150; A.D. 79 Pompei = 700 (preferred) to 1000; Avellino = 4100 (preferred) to 600; Mercato = 3500 (preferred) to 600; Greenish = 1000 to 500. During the recent period (after 1631) Vesuvius was characterized by semi-persistent activity reflecting open chimney condi- tions and magma at high level: "repose time" utilized is the interval between each eruption and the previous reported effusion (after Rosi et al., 1987).
EXPLOSIVE ACTIVITY AT VESUVIUS: MODELS FOR EXPECTED TEPHRA FALLOUT 331
crease with increasing repose time, as a conse- quence of a nearly continuous supply of deep basic magma to the chamber (Santacroce, 1983). In the last 20-25,000 years the Vesuvius basic magmas were highly variable in both composition and alimentation rate; after A.D. 79, however, a homogeneous HK nature of eruption products was reflected by a roughly constant alimentation rate evaluated at 1.5-2 x 10⁶ m 3 yr -1 (Fig. 2) (Santacroce, 1983). By assuming no major changes have oc- curred in the feeding system of the volcano after its last eruption (March 1944), a volume of 60-90 x 106 m 3 of magma could have entered the subsurface reservoir of Vesuvius. This volume, if all erupted during a single event, would place the expected eruption below the medium-size "Pollena-type" class. It would be, nevertheless, the most violent since 1631.
No reliable data are presently available to determine if this eruption will be mainly ef- fusive or explosive, that is either "ultrastrom- bolian" or "subplinian" eruptions would be possible today.
"Ultrastrombolian" eruptions generally in- volve lower, however severe, risk than the subplinian ones. Preliminary hazard maps for ultrastrombolian explosions have been drawn based upon the analysis of past eruptions of this kind at Vesuvius (Rosi et al., 1987).
During a subplinian Vesuvius eruption several phases can be generally distinguished (Rosi et al., 1983). In simulating such a kind of event the following eruptive scenario is propos- ed: (1) Explosive opening of the vent with ballistic
ejection of tephra (maximum distance reached by large blocks: 4 -5 km from the vent).
(2) Formation of a sustained column with con- sequently tephra fallout, accompanied and followed by: Sporadic partial column collapses which originate pyroclastic flows and ash cloud surges.
(3)
(4) Declining energy of the eruption and con- tinuous column collapse ("boiling over"), which creates moderate pyroclastic surges, flows and lahars.
The knowledge of the physical parameters which affect the column behavior and deter- mine different phenomena (tephra fall or surges/flows) is the first step towards a realistic automatic simulation of the eruptive scenario.
The co lumn dynamics
During its rise, the gas/pyroclastic mixture ejected from the vent, whose bulk density ini- tially was generally greater than the surroun- ding atmosphere, entraps and heats air. Conse- quently, if the initial effective density is not too high, the density of the column, after an initial gas thrust phase, becomes lighter than the sur- rounding air, and a convective column appears at heights of 30-40 km in the most violent cases (plinian eruptions). From the thrust region, where column density is greater, partial column collapses can occur, forming pyroclastic surges and flows. For magmas with low water content or high proportions of CO 2 respect to water steam, or for magmas with intermediate water content but with low initial velocities, or erupting from large vents, the absorption and heating of atmospheric air can not be sufficient to reduce the effective density of the column. In this case, convection cannot occur and a con- tinuous collapsing regime is established, generating low-energy pyroclastic surges and f lOWS.
The column behavior has been numerically simulated using the Wilson and Walker (1987) column model, which represents the updated refinement of previous applications of tur- bulent convective plume theory to plinian erup- tions (Wilson et al., 1978; Sparks, 1986; Carey and Sparks, 1986):
1/M(dM/dz) = (2k/bX~a/ ~m) (1)
332 G. MACEDONIO ET AL.
l /N(dN/dz) = (g/u2)[Qa/Om)- l]
(Cgng + Can a + Clnl)[(1/0m)d0m/dz +
(l/M)(dM/dz)] = Ca(0a/Om)(1/M)(dM/dz)-
c g( dn g/ dz) - ca ( dna/ dz ) - Cl( dn l/ dZ )
+/Cgng[(~Cg- 1)/~,g] + Cana[('ya- 1)/'ya] 1
(2)
(1/P)(dP/dz) (3)
where: M = ~rO.mub 2 is the total vertical mass flow; N = 7r0mu2b2 is the total vertical momen- tum; P is the pressure; u is the upward velocity (equal for gas and particles); 0m, Oa are the fluid and air density; 0m, 0a a r e the fluid and air temperature; c m, c a and c 1 are the fluid, air and magma specific heats; nm, n a and n 1 are the fluid, air and magma weight fractions; b is the column radius; z is the vertical coordinate; ~/m and 3'a are the gas and air ratios of specific heat at constant pressure to specific heat at con-
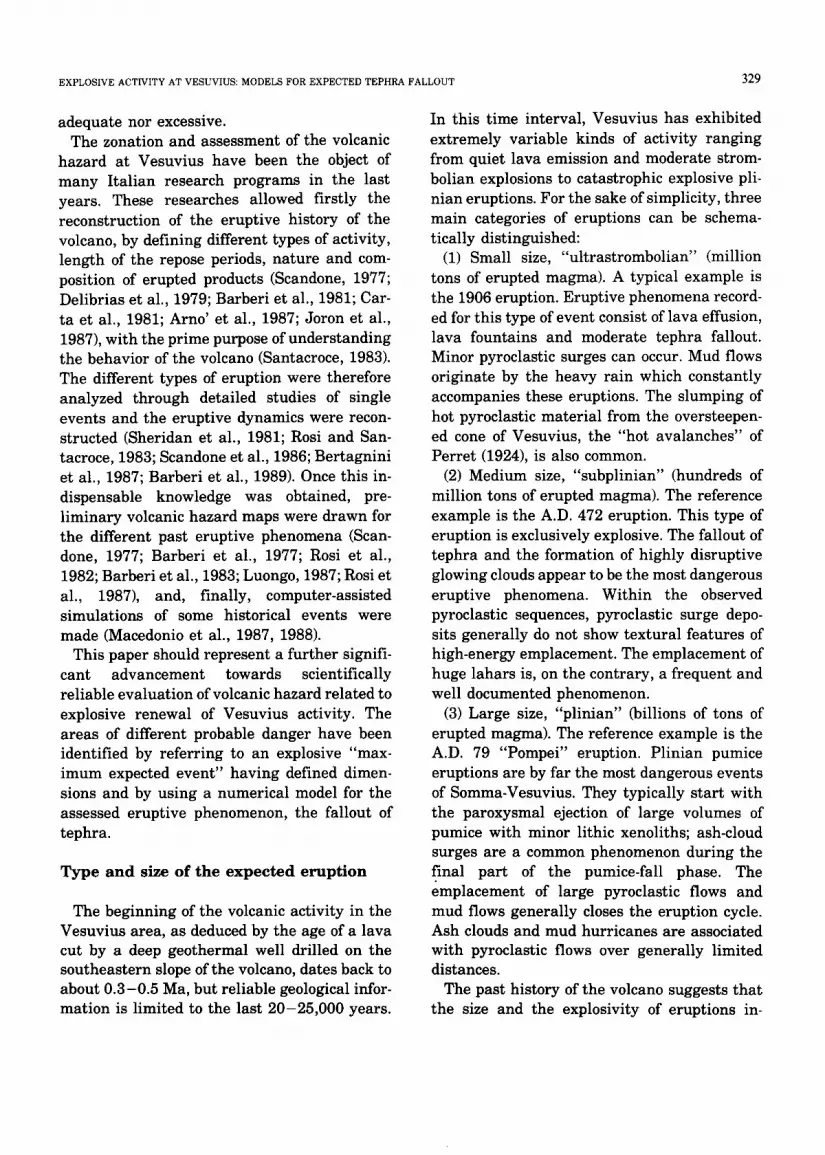
stant volume and k is the air entra inment fac- tor. The input parameters to this model are: air density and air temperature profile; gas, magma and air specific heat; gas and magma temperature at the vent; gas weight fraction at the vent; air entra inment factor; column radius at the vent; gas and particles velocity (supposed equal) at the vent. The model describes column behavior, tha t is the variation in density, temperature, velocity and radius of the column as a function of its height. The model simulates the convection regime, or predicts collapse if, at the end of the thrust phase, the density of the column is always greater than air density. Three of these parameters mainly control the column behavior: column radius at the vent, gas fraction weight and emission velocity (or mass eruption rate). By dimensional analyses (see Appendix), the curve which separates the convection and the collapse regions can be easi- ly calculated in (mass eruption rate) vs (initial column radius) space, for an assigned weight of the gas fraction. Figure 3 gives two curves
1 0 =
'm t 0 =
uJ ~ , . M . S O 7
| . 2 t 1 . ~ o I Z 0
~ 4 . 1 3 . | o l n
UJ
t 0 I
: [
t 0 s
• I " I
CONVECTION
(SUSTAINED COLUMN)
COLLAPSE
/ . / I / . , / , , I , I 4-0 1 0 0 1 0 0 0
INITIAL COLUMN RAOIUS (m)
Fig. 3. Mass eruption rate vs initial column radius as controlling the column regime (convection and collapse). Dotted lines = mass discharge rates for different durations of the eruption (3, 6 and 12 hours). Full lines: (a) separate convection from collapse regime for 5 and 10% gas content; (b) separate conditions of sonic (right) from supersonic initial velocity of the jet (left) for 5 and 10 wt.% gas content. The mixture temperature is 800°C as resulting from an initial magma and gas temperature of 1000°C and a lithics temperature of 15°C.
EXPLOSIVE ACTIVITY AT VESUVIUS: MODELS FOR EXPECTED TEPHRA FALLOUT 333
(curves a), one corresponding to 5% and the other to 10% gas content. On the left of these curves (straight lines in a bilogarithmic scale), that is for low column radii and high mass erup- tion rates, there is the region of convection; while on the right, for larger column radii and lower mass eruption rates, collapse occurs. The computations have been performed by assum- ing that the gas is steam. Lines of Figure 3 are obtained for an initial magma temperature of 1000 ° C. The initial temperature of the mixture (magma + lithics + volcanic gas) is reduced to 800°C to account for the heating of the lithic material from 15°C to the thermal equilibrium temperature. The mixture is assumed to be in thermal and mechanical equilibrium. This is approximately true, since the average resi- dence time of the smaller particles inside the column (about 300 s) are quite higher than the relaxation t ime for the thermomechanical equilibrium (3 s for particles smaller than 1 mm). Thermomechanical equilibrium has been assumed also for particles with 1 cm diameter, for which the relaxation time is about 300 s. Variations of the gas and magma temperature at the vent, in a range of 200°C introduce minor variations (< 10%) in the position of the curves. As already mentioned, a feeding rate of deep basic magma of 1 .5-2 .0 x 106 m 3 yr -1 can be reasonably assumed for the entire past A.D. 79 period (Fig. 2a), resulting into a volume of 6 0 - 9 0 x 106 m 3 of primitive magma entered in the shallow magma chamber after 1944. The nature of the products in the last 17,000 years shows a significant positive correlations be- tween the repose time and the degree of fractio- nation of the erupted magma (Fig. 2b). It can therefore be estimated that about 30 wt.% of the pr imary liquid will have crystallized and fractioned, resulting into a volume of 4 0 - 7 0 x 106 m 3 of tephritic leucititic magma possibly available today for a future eruption. Data from the pyroclastic deposits of the last subplinian eruptions of Vesuvius (Barberi et al., 1989) in- dicate a lithic component equal to about 20 wt.% of the total erupted material. Therefore
the lithic volume involved in the eruption could be 10 -15 x 106 m 3. By assuming a mean den- sity for both liquid magma and lithics of about 2500 kg m -3, a maximum total available mass of about 2 x 10¹¹ kg would result. By assuming this eruptible mass and an eruption duration in the range 3 - 1 2 hours, mass eruption rate is ex- pected in the range 0 .4-2 .0 x 107 kg s -1.
The domain of convection (Fig. 3) can be fur- ther restricted by introducing a minimum value of the column radius at the vent, by calculating the column radius below which the jet becomes supersonic. The sonic velocity a m for a mixture of gas and particles in thermal and mechanical equilibrium is given by the for- mula (Buresti and Casarosa, 1987; Buresti and Casarosa, 1989):
J 3~mRmn 1 a m = (4)
1 - nl~m/~l
The rather arbi trary assumption of a sonic velocity involves negligible extension of an eventual underexpanded supersonic basal por- tion of the column (Woods, 1988). The constrain of sonic emission velocities results in Figure 3 in a family of straight lines, one for each gas content (curves b), with a lower slope than that of the collapse lines (curves a). Therefore, for a given initial gas content, the convection region in Figure 3 is between curves a and b.
The obtained range of the initial column radius implies limitations on the range of the possible heights of either the whole column and the gas thrust region. Figures 4 and 5 show, respectively for a water content of 5% and 10%, the range of the total column heights and of the thrust region heights, computed by using equa- tions (1), (2) and (3). As expected, in the con- sidered range, the initial gas content has hard- ly any influence on the maximum height of the column (Fig. 4) (Macedonio et al., 1987). As shown in Figures 4 and 5, total column heights are in the range 11 -16 km and thrust region heights are below 1000 m. The gas thrust is here defined as the lower part of the column
3 3 4 G. MACEDONIO ET AL.
where the column density is higher than tha t of surrounding air. For radii greater than the col- lapse radius, the volume of the entrained air
o F
z
o o
C O N V E C T I V E P H A S E
T l q i
COLLAPSE
/
2E7 I SET
MASS ERUPTION RATE (kg/s -1)
Fig. 4. Maximum height of the convective column vs mass eruption rate. Full lines = 5 wt.% initial con- tent of magmatic gas (H20); dotted lines = 10 wt.% gas content. Upper lines separate collapse (above) from convection regimes; lower lines separate condi- tions of sonic (above) from supersonic initial velocity of the jet.
OOL
I
L 0
T H R U S T P H A S E
i i i i
COLLAPSE ( ~
f COLLAPSE [gas-lO~) ~
/
/ / -- -- ~ -- - - ~ O U N D SPEEO (gas-5%) / - . j j / .....
. ~ . . . . . . . . . ?OUN~ SPEED (g . . . . 0%)
J / I L 4 E6 8 E6 i 2E7 1 6E7 2 E7
MASS ERUPTION RATE (kg/s -1)
Fig. 5. Maximum gas thrust height vs mass eruption rate. Full lines = 5 wt.% initial content of magmatic gas (H20); dotted lines = 10 wt.% gas content. Upper lines separate collapse (above) from convection regimes; lower lines separate conditions of sonic (above) from supersonic initial velocity of the jet.
can be neglected and column height becomes: u 2 ~ / 2 g ( [ 3 - ~a ), where u is the outcoming magma velocity at the vent (from eq. (1) and (2), with k = 0). Having this in mind, in the case of con- tinuous collapse, expected maximum heights are less than 1000 m.
Tephra fallout
When the gas-pyroclast mixture erupted from the vent forms a convective column, the dynamics that the particles develop in the at- mosphere and their distribution during the fallout is controlled by the wind regime.
To simulate the dynamics of the falling par- ticles in the air, a continuity equation has been used. The main factors affecting particle behavior which have to be considered are: wind, diffusion, settling and feeding due to the source (the particles which leave the convective plume in the unit time). The continuity equation has been solved by numerical schemes, which ac- count for complex wind data and mass eruption rates (Armienti et al., 1988; Macedonio et al., 1988).
The ground deposition computed by the model strictly depends on the choice of the input parameters: the wind field, the vertical and horizontal eddy diffusion coefficients of ash, the grain size and density distribution of the par- ticles, the shape of the column and the mass eruption rate.
The wind velocity and direction recorded over a period of 10 years at Brindisi (Italy) (Cornell et al., 1983) allow the recognition of two dif- ferent seasonal wind profiles: a summer field and an autumn-winter-spring field (AWS) (Fig. 6a,b).
The horizontal and vertical diffusion coeffi- cients strictly depend on the temporal, and con- sequently on the spatial, scale of the phenomenon, in the sense that, if the particles are falling from great heights and with low velocities, turbulent eddies of bigger and bigger size have to be considered, with a consequently increase in the diffusion coefficients. Maximum
EXPLOSIVE ACTIVITY AT VESUVIUS: MODELS FOR EXPECTED TEPHRA FALLOUT 335
(a) (b)
o
iO YEARS AVERAGE PRESENT WIND VELOCITY
0 SUMMER WIIND * A W S WINO
10 15 20 WIND VELOCITY (m s "1)
IO-YEARS AVERAGE PRESENT WIND DIRECTION
o SUMMER WIND * A W S WIND
90 i80 270 360 WIND DIRECTION [DECREES)
Fig. 6. (a) Mean wind velocity (m s -1) and (b) mean wind directions (90 ° means east) recorded at Brindisi (South Italy) during summer and autumn-winter-spring (AWS), as a function of altitude. After Cornell et al. (1983).
va lues of 2 0 0 0 - 3 0 0 0 m 2 s -1 for hor izonta l dif- fusion coefficients are expected. These va lues have been empir ica l ly der ived by the simula- t ions of the 79 A.D. Vesuvius e rupt ion (Macedonio et al., 1988; Macedonio et al., 1987).
F igure 7a,b give particle density, velocity and grain size distribution for the juveni le and lithic f rac t ion t ha t we have assumed. The gra in size d is t r ibut ion has been supposed to be s imi lar to t h a t of the grey phase of the 79 A.D. P l in ian e rup t ion of Vesuvius (Macedonio et al., 1988), bu t the l i thic component has been reduced to 1/2, to give more s imi la r i ty wi th da ta f rom
subpl in ian erupt ions (1631 and 472) (Barberi et al., 1989 and unpublished). F igure 7c repor ts the total settling velocity distribution obta ined by the da ta of F igure 7a,b.
As a l ready ment ioned, the total erupted mass has been es t imated to be 2 x 10¹¹ kg, and the height of the column has been assumed to be in the range 1 1 - 1 6 km.
Table 1 summar izes the input da ta as a whole (ei ther assumed, inferred and calculated) we have ut i l ized for the s imulat ion. The resul ts of the par t ic le fa l lout s imula t ions are reported, as isomass lines on ground (kg m-2), in F igures 8,
TABLE 1
Input data utilized for the simulation
Total erupted mass: Mass eruption rate: Eruption duration: Gas content: Lithics content: Wind field: Size and density of particles: Settling velocities of particles: Diffusion coefficients: Total column heights: Thrust column height: Initial temp. of magma and gas: Initial temp. of lithics:
2 x 10¹¹ kg (juveniles + lithics) 0.4-2.0 x 10 7 kg s 1 3 -12 hours 5 wt.%, 10 wt.% 20 wt.% autumn-winter-spring and summer profiles (Figs. 6 and 7) from last eruptions at Vesuvius (Figs. 8 and 9) seven classes: 1, 2, 3, 4, 5, 7 and 9 m/s 1 vertical 50 m 2 s -1, horizontal 3000 m 2 s -1 11-16 km < lO00m IO00°C 15°C
336 G. MACEDONIO ET AL.
3
~J
2
o0
u~
032
H
~ o
JUVENILES
i i i i i i r f
W JUVENILES
+ DENSITY (g crn -3)
, " 8' ' ~ ~ ,,;2 l)A J~ ,~",s mra
LITHICS
r i t i I t t t w
* LITHICS
+ DENSITY (g cm -3) 1)
, " ' ' ' 1 ' ' ' ' ' , /16 I / B I / 2 1/4
mm
S E T T L I N G V E L O C I T Y D I S T R I B U T I O N
f i t l t i i t l
0 TOTAL
JUVENILES LITHICS
SETTLING VELOCITY (m s °I)
9 and 10 for three different column heights (11, 13 and 16 km) and, consequently, three dif- ferent durations of the eruption (12, 6 and 3 hours respectively). The two different utilized wind patterns induce two main seasonal dif- ferences: (1) A change of about 15 ° of the main disper-
sion axis, shifted southwards in the Sum- mer case.
(2) A more pronounced eccentricity of the AWS isomass lines in respect to the summer ones as a consequence of the higher variability of the Summer wind.
It has to be noted, however, tha t the utilized wind velocity distribution represent 10 years of averages: main dispersion axes different from those of Figures 8, 9 and 10 are always possible, however less probable, mainly during the sum- mer. As an example we can recall the south- eastward dispersion of the fallout deposit of the 79 A.D. "Pompei" eruption (Lirer et al., 1973). A statistical approach to the tephra fallout dispersion can be found in Barberi et al. (1990).
The height variations of the convective cloud significantly affect the ground distribution of particles in the summer case, by decreasing the distance reached by the "heavy" isomass line and by increasing that of the "l ight" ones with increasing column height; they only moderate- ly modify, on the contrary, the AWS ground distribution. This also is a clear consequence of the higher summer variability of the wind direction, which is most remarkable at low altitudes.
Fig. 7. Particles wt.% density (g cm -3) and settling velocity (m s -I) of (a) juvenile and (b) lithic fragments used in the fallout simulation as a func- tion of the grain size of particles. The increase of juvenile and lithic wt.% at 1/16 mm is due to the fact that in our simulation we have considered particles smaller than 1/16 mm as particles of 1/16 mm. (c) Total wt.% of particles (juveniles + lithics) as a func- tion of the settling velocity (m s-I), after data of Fig. 7a,b, by assuming a ratio juvenile/lithic = 4:1.
EXPLOSIVE ACTIVITY AT VESUVIUS: MODELS F O R E X P E C T E D T E P H R A F A L L O U T ~3"7
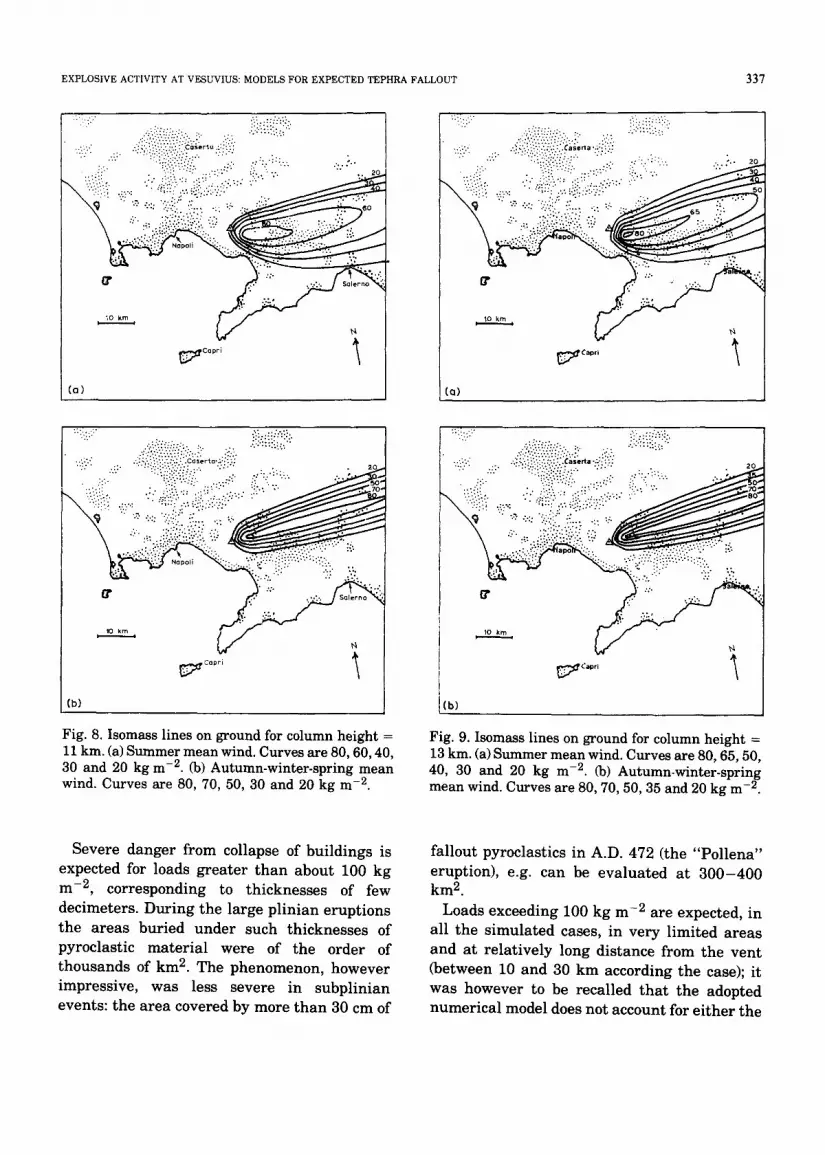
Fig. 8. Isomass lines on ground for column height = 11 kin. (a) Summer mean wind. Curves are 80, 60, 40, 30 and 20 kg m -2. (b) Autumn-winter-spring mean wind. Curves are 80, 70, 50, 30 and 20 kg m -2.
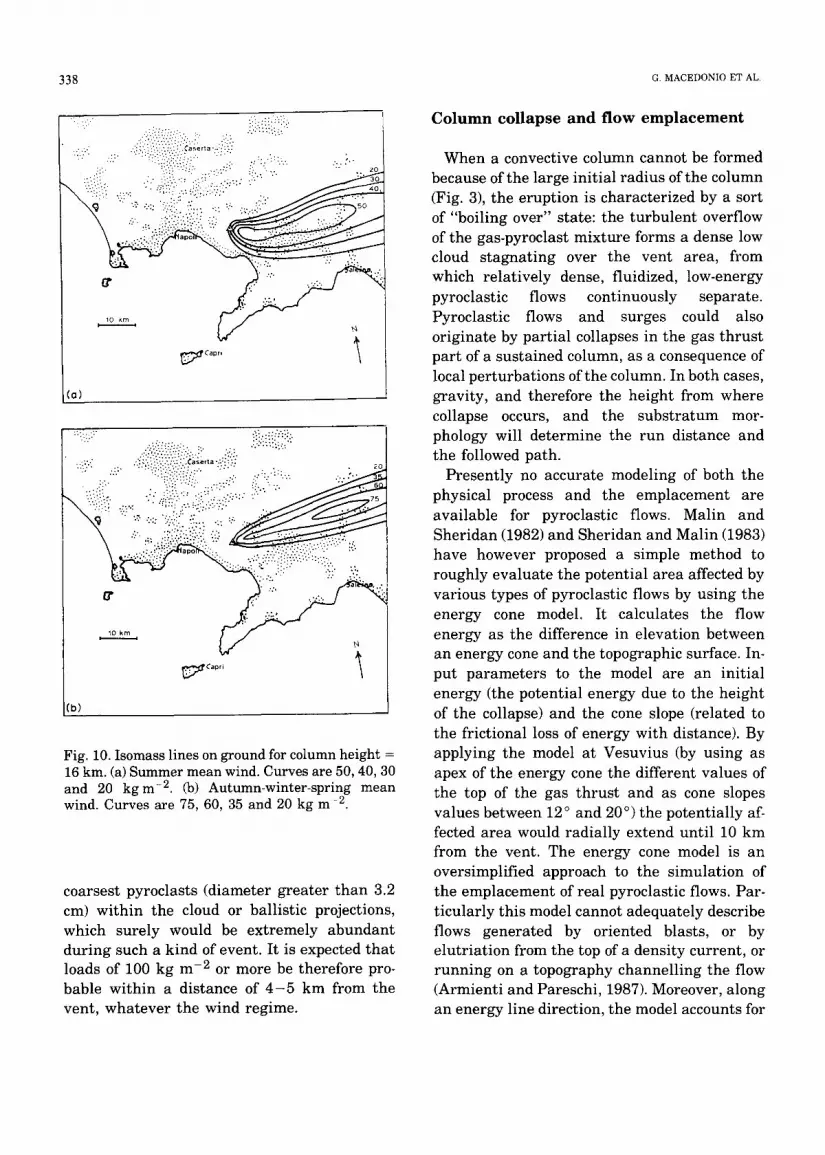
Fig. 9. Isomass lines on ground for column height = 13 km. (a) Summer mean wind. Curves are 80, 65, 50, 40, 30 and 20 kg m -2. (b) Autumn-winter-spring mean wind. Curves are 80, 70, 50, 35 and 20 kg m -2.
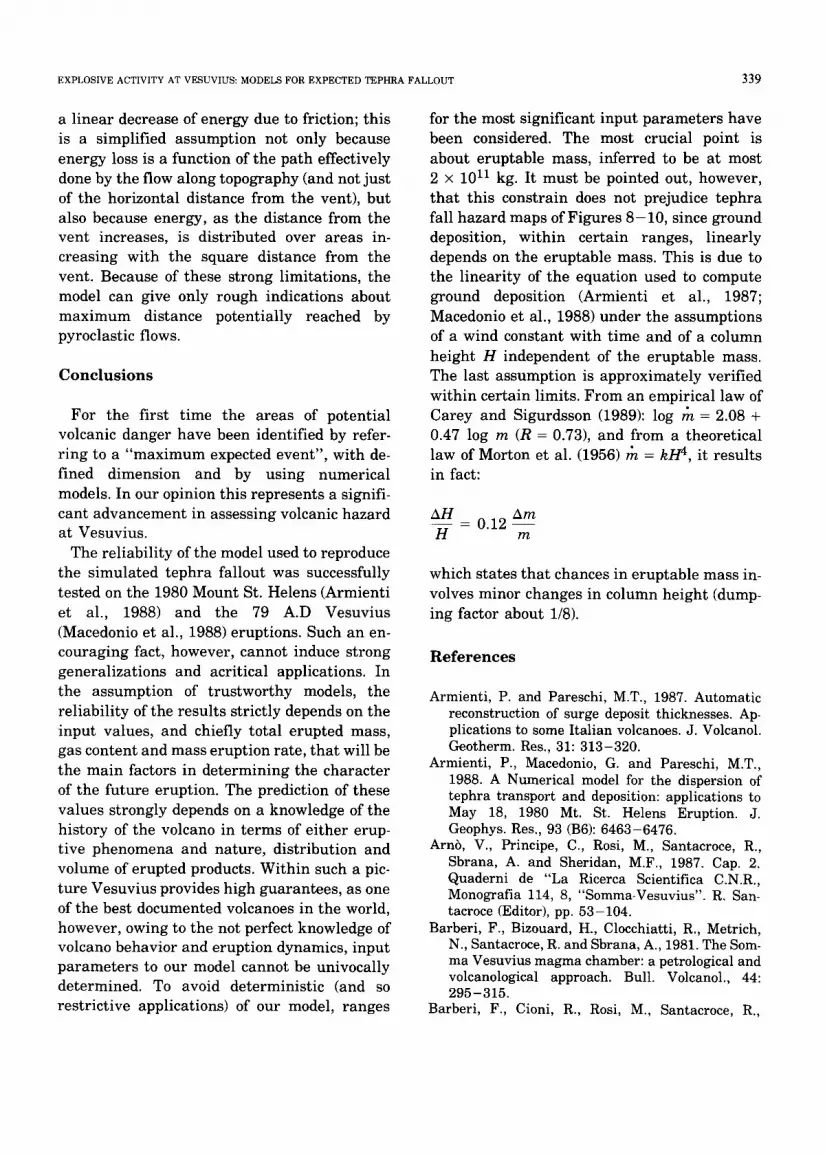
Severe danger from collapse of buildings is expected for loads greater t h a n about 100 kg m -2, corresponding to thicknesses of few decimeters. Dur ing the large pl in ian erupt ions the areas buried under such thicknesses of pyroclastic mater ia l were of the order of thousands of km 2. The phenomenon, however impressive, was less severe in subpl in ian events: the area covered by more t h a n 30 cm of
fal lout pyroclastics in A.D. 472 (the "Po l l ena" eruption), e.g. can be eva lua ted at 3 0 0 - 4 0 0 k m 2.
Loads exceeding 100 kg m -2 are expected, in all the s imula ted cases, in very l imited areas and at re la t ively long distance from the vent (between 10 and 30 km according the case); it was however to be recalled t ha t the adopted numer ica l model does not account for e i ther the
Fig. 10. Isomass lines on ground for column height = 16 km. (a) Summer mean wind. Curves are 50, 40, 30 and 20 kgm -2. (b) Autumn-winter-spring mean wind. Curves are 75, 60, 35 and 20 kg m -2.
coarsest pyroclasts (diameter greater than 3.2 cm) within the cloud or ballistic projections, which surely would be extremely abundant during such a kind of event. It is expected tha t loads of 100 kg m -2 or more be therefore pro- bable within a distance of 4 - 5 km from the vent, whatever the wind regime.
Column collapse and flow emplacement
When a convective column cannot be formed because of the large initial radius of the column (Fig. 3), the eruption is characterized by a sort of "boiling over" state: the turbulent overflow of the gas-pyroclast mixture forms a dense low cloud stagnating over the vent area, from which relatively dense, fluidized, low-energy pyroclastic flows continuously separate. Pyroclastic flows and surges could also originate by partial collapses in the gas thrust part of a sustained column, as a consequence of local perturbations of the column. In both cases, gravity, and therefore the height from where collapse occurs, and the substratum mor- phology will determine the run distance and the followed path.
Presently no accurate modeling of both the physical process and the emplacement are available for pyroclastic flows. Malin and Sheridan (1982) and Sheridan and Malin (1983) have however proposed a simple method to roughly evaluate the potential area affected by various types of pyroclastic flows by using the energy cone model. It calculates the flow energy as the difference in elevation between an energy cone and the topographic surface. In- put parameters to the model are an initial energy (the potential energy due to the height of the collapse) and the cone slope (related to the frictional loss of energy with distance). By applying the model at Vesuvius (by using as apex of the energy cone the different values of the top of the gas thrust and as cone slopes values between 12 ° and 20 ° ) the potentially af- fected area would radially extend until 10 km from the vent. The energy cone model is an oversimplified approach to the simulation of the emplacement of real pyroclastic flows. Par- ticularly this model cannot adequately describe flows generated by oriented blasts, or by elutriation from the top of a density current, or running on a topography channelling the flow (Armienti and Pareschi, 1987). Moreover, along an energy line direction, the model accounts for
EXPLOSIVE ACTIVITY AT VESUVIUS: MODELS FOR EXPECTED TEPHRA FALLOUT 339
a linear decrease of energy due to friction; this is a simplified assumption not only because energy loss is a function of the path effectively done by the flow along topography (and not just of the horizontal distance from the vent), but also because energy, as the distance from the vent increases, is distributed over areas in- creasing with the square distance from the vent. Because of these strong limitations, the model can give only rough indications about maximum distance potentially reached by pyroclastic flows.
C o n c l u s i o n s
For the first time the areas of potential volcanic danger have been identified by refer- ring to a "maximum expected event", with de- fined dimension and by using numerical models. In our opinion this represents a signifi- cant advancement in assessing volcanic hazard at Vesuvius.
The reliability of the model used to reproduce the simulated tephra fallout was successfully tested on the 1980 Mount St. Helens (Armienti et al., 1988) and the 79 A.D Vesuvius (Macedonio et al., 1988) eruptions. Such an en- couraging fact, however, cannot induce strong generalizations and acritical applications. In the assumption of t rustworthy models, the reliability of the results strictly depends on the input values, and chiefly total erupted mass, gas content and mass eruption rate, that will be the main factors in determining the character of the future eruption. The prediction of these values strongly depends on a knowledge of the history of the volcano in terms of either erup- tive phenomena and nature, distribution and volume of erupted products. Within such a pic- ture Vesuvius provides high guarantees, as one of the best documented volcanoes in the world, however, owing to the not perfect knowledge of volcano behavior and eruption dynamics, input parameters to our model cannot be univocally determined. To avoid deterministic (and so restrictive applications) of our model, ranges
for the most significant input parameters have been considered. The most crucial point is about eruptable mass, inferred to be at most 2 x 10¹¹ kg. It must be pointed out, however, that this constrain does not prejudice tephra fall hazard maps of Figures 8 -10 , since ground deposition, within certain ranges, linearly depends on the eruptable mass. This is due to the linearity of the equation used to compute ground deposition (Armienti et al., 1987; Macedonio et al., 1988) under the assumptions of a wind constant with time and of a column height H independent of the eruptable mass. The last assumption is approximately verified within certain limits. From an empirical law of Carey and Sigurdsson (1989): log m = 2.08 + 0.47 log m (R = 0.73), and from a theoretical law of Morton et al. (1956) m = kH 4, it results in fact:
AH Am - 0 . 1 2 - -
H m
which states that chances in eruptable mass in- volves minor changes in column height (dump- ing factor about 1/8).
R e f e r e n c e s
Armienti, P. and Pareschi, M.T., 1987. Automatic reconstruction of surge deposit thicknesses. Ap- plications to some Italian volcanoes. J. Volcanol. Geotherm. Res., 31: 313-320.
Armienti, P., Macedonio, G. and Pareschi, M.T., 1988. A Numerical model for the dispersion of tephra transport and deposition: applications to May 18, 1980 Mt. St. Helens Eruption. J. Geophys. Res., 93 (B6): 6463-6476.
Arnb, V., Principe, C., Rosi, M., Santacroce, R., Sbrana, A. and Sheridan, M.F., 1987. Cap. 2. Quaderni de "La Ricerca Scientifica C.N.R., Monografia 114, 8, "Somma-Vesuvius". R. San- tacroce (Editor), pp. 53-104.
Barberi, F., Bizouard, H., Clocchiatti, R., Metrich, N., Santacroce, R. and Sbrana, A., 1981. The Som- ma Vesuvius magma chamber: a petrological and volcanological approach. Bull. Volcanol., 44: 295-315.
Barberi, F., Cioni, R., Rosi, M., Santacroce, R.,
340 G. MACEDONIO ET AL.
Sbrana, A. and Vecci, R., 1989. Magmatic and phreatomagmatic phases in explosive eruptions of Vesuvius as deduced by grain-size and compo- nent analysis of the pyroclastic deposits. J. Volcanol. Geotherm. Res., 38: 287-307.
Barberi, F., Marinelli, G., Rosi, M. and Santacroce R., 1977. I1 rischio da lahar nel Somma-Vesuvio. Atti del Convegno: I Vulcani Attivi dell'Area Napoletana, Napoli, pp. 93-95.
Barberi, F., Rosi, M., Santacroce, R. and Sheridan, M.F., 1983. Volcanic Hazard Zonation: Mt. Vesuvius. In: H. Tazieff and J.-C. Sabroux (Editors), Forecasting Volcanic Events. Elsevier, Amsterdam, pp. 149-164.
Barberi, F., Macedonio, G., Pareschi, M.T. and San- tacroce, R., 1990. Mapping the tephra fallout risk: an example from Vesuvius, Italy. Nature, 344: 142-144.
Bertagnini, A., Landi, P., Menga, G., Santacroce, R. and Sbrana, A., 1987. La dinamica dell'eruzione vesuviana dell'Aprile 1906 ricostruita sulla base delle cronache contemporanee e dello studio dei depositi piroclastici. CNR-Boll. GNV, Roma, pp 109-144.
Buresti, G. and Casarosa, C., 1987. A one- dimensional model for the flow of equilibrium gas-particle mixture in vertical ducts with fric- tion and its application to volcanological pro- blems. Atti Dipartimento Ingegneria Aero- spaziale, Pisa University, Italy.
Buresti, G. and Casarosa, C., 1989. One-dimensional adiabatic flow of equilibrium gas-particle mix- tures in long vertical ducts with friction. J. Fluid Mech., 203: 251-272.
Carey, S. and Sigurdsson, H., 1989. The intensity of plinian eruptions. Bull. Volcanol., 51: 28-40.
Carey, S. and Sparks, R.S.J., 1986. Quantitative models of the fallout and dispersal of tephra from volcanic eruption columns. Bull. Volcanol., 48: 109-125.
Carta, S., Figari, R., Sartoris, G., Sassi, E. and Scan- done, R., 1981. A statistical model of Vesuvius and its volcanological implication. Bull. Volca- nol., 44: 129-151.
Cornell, W., Carey, S. and Sigurdsson, H., 1983. Computer modeling of tephra fallout for the Y-5 Campanian ash layer. J. Volcanol. Geotherm. Res., 17: 88-109.
Cortini, M. and Scandone, R., 1982. The feeding system of Vesuvius between 1754 and 1944. J. Volcanol. Geotherm. Res., 12: 393-400.
Delibrias, G., Di Paola, G.M., Rosi, M. and San- tacroce, R., 1979. La Storia eruttiva del complesso vulcanico Somma-Vesuvio ricostruita dalle suc- cessioni piroclastiche del Monte Somma. Rend. Soc. Ital. Mineral. Petrol., 35: 411-438.
Joron, J.L., Metrich, N., Rosi, M., Santacroce, R. and
Sbrana, A., 1987. Cap. 3. Quaderni de "La Ricer- ca Scientifica C.N.R., Monografia 114, v.8, "Somma-Vesuvius", R. Santacroce (Editor), pp. 105-174.
Lirer, L., Pescatore, T., Booth, B. and Walker, G.P.L., 1973. Two plinian pumice-fall deposits from Somma-Vesuvius, Italy. Geol. Soc. Am. Bull., 84: 759-772.
Luongo, G., 1987. Rischio vulcanico - Vesuvio, Cam- pi Flegrei, Ischia, Etna, Stromboli, Vulcano. Rischio Vulcanico e Programmazione Ter- ritoriale, Napoli, La Provincia di Napoli, Spec. vol., pp. 34-61.
Macedonio, G., Pareschi, M.T. and Santacroce, R., 1987. Valutazione e controllo di alcuni parametri fisici agenti durante la fase pliniana dell'eruzione del Vesuvio del 79 D.C. CNR-Boll. GNV, Roma, pp. 445-466.
Macedonio, G., Pareschi, M.T. and Santacroce R., 1988. A numerical simulation of the plinian fall phase of 79 A.D. eruption of Vesuvius. J. Geophys. Res., 93 (B12): 14817-14827.
Malin, M.C. and Sheridan, M.F., 1982. Computer assisted mapping of pyroclastic surges. Science, 217: 637-639.
Morton, B.R., Taylor, G. and Turner, S., 1956. Tur- bulent gravitational convection from maintained and instantaneous sources, Proc. R. Soc. London, 234: 1-23.
Perret, F.A., 1924. The Vesuvius eruption of 1906. Carnegie Inst. Washington, 339: 1-151.
Rosi, M. and Santacroce, R., 1983. The A.D. 472 "Pollena" Eruption: volcanological and petro- logical data from this poorly known plinian-type event at Vesuvius. J. Volcanol. Geotherm. Res., 17: 249-271.
Rosi, M., Santacroce, R. and Sheridan, M.F., 1982. Volcanic hazard of Vesuvius. Italy, Bull. B.R.G.M., 4(2): 169-179.
Rosi, M., Santacroce, R. and Sheridan, M.F., 1987. Volcanic hazard, Cap. 5. Quaderni de "La Ricerca Scientifica C.N.R., Monografia 114, 8, "Somma- Vesuvius", R. Santacroce (Editor), pp. 197-220.
Santacroce, R., 1983. A general model for the behaviour of the Somma-Vesuvius volcanic Com- plex. J. Volcanol. Geotherm. Res., 17: 237-248.
Scandone, R., 1977. I1 rischio da colata di lava e im- plicazioni socio-economiche, Atti del Convegno: I Vulcani Attivi dell'Area Napoletana, Napoli, pp. 103-106.
Scandone, R., Iannone, F. and Mastrolorenzo, G., 1986. Stima dei parametri dinamici dell'eruzione del 1944 del Vesuvio. CNR-Boll. GNV, Roma, pp. 487 -503.
Sheridan, M.F. and Malin, M.C., 1983. Application of computer assisted mapping to volcanic hazard evaluation of surge eruptions: Vulcano, Lipari
EXPLOSIVE ACTIVITY AT VESUVIUS: MODELS FOR EXPECTED TEPHRA FALLOUT 341
and Vesuvius. J. Volcanol. Geotherm. Res., 17: 187-202.
Sheridan, M.F., Barberi, F., Rosi, M. and Santacroce, R., 1981. A model of plinian eruptions of Vesuvius. Nature, 289: 282-285.
Sparks, R.S.J., 1986. The dimensions and dynamics of volcanic eruption columns. Bull. Volcanol., 48: 3-16.
Wilson, L., Sparks, R.S.J., Huang, T.C. and Watkins, N.D., 1978. The control of volcanic column height by eruption energetics and Dynamics. J. Geophys. Res., 83: 1829-1836.
Wilson, L. and Walker, G.P.L., 1987. Explosive volcanic eruptions - VI. Ejecta dispersal in pli- nian eruptions: the control of eruption conditions and atmospheric properties. Geophys. J.R. Astron. Soc., 89: 657-679.
Woods, A.W., 1988. The fluid dynamics and ther- modynamics of eruption columns. Bull. Volcanol., 50: 169-193.
By comput ing the va lue of the cons tant R 1 by Wilson and W a lk e r (1987) model for a par-
t i cu la r va lue of b o and u o at collapse, it is so possible to know the genera l law re l a t ing the ini t ia l radius to velocity a t collapse (for con- s tan t R 2, R3, etc.). F r o m the def ini t ion of R 1, it follows:
2 5 2 R1 = gbo/u2o _ 7r gbo~ o
;nz - const. (6)
F r o m eq. (6) a re la t ion be tween ini t ia l co lumn rad ius and mass e rupt ion ra te at collapse can be derived:
in = KlbSo/2 (7)
Appendix: the column collapse where:
The input p a r a m e t e r s to the e rup t ion column model of Wilson and Walke r (1987) are: the in- i t ial gas f ract ion ng o (or the ini t ia l co lumn den- si ty f~o) the ini t ial a i r dens i ty 0ao, the ini t ial co lumn rad ius bo, the ini t ial veloci ty u o (or the mass e rup t ion r a t e m), the ini t ia l t e m p e r a t u r e s of the column 0 o and of the a i r 0ao, the air en- t r a i n m e n t coefficient k, the ini t ia l a i r pressure Po, the specific hea t s of par t ic les nl, gas (H20) ng, and a tmosphere na, and the g rav i ty cons- t an t g. By these va lues dimensionless number s can be bui l t as:
K1 = 7rl3oX/g/R 1 (8)
In a bi- logari thmic scale, eq. (7) resu l t s in a s t r a igh t line wi th slope 5/2 (curves a in Fig. 3). The in te rcept va lue of curves a of F igure 3 depends obviously upon R 2, R3, etc.. Keep ing the ini t ia l t e m p e r a t u r e cons tant ( that is R 3 = const.), and va ry ing the ini t ial co lumn densi ty /30, the total collapse condit ion becomes:
f2(R1, R 2) = const.
0 o R1 = gbo/u2, R2 = (/~o - Q a o ) / ~ o , R3 = 0a ~ , etc.
The to ta l co lumn collapse condit ion can be ex- pressed as:
f ( R 1, R 2, R 3 . . .) = const.
I f only b o and u o are var iable , t ha t is /3 o = const. (i.e. R 2 = const.), 0 o = const., 0ao = const. (i.e. R 3 = const.), etc., the collapse condi t ion reduces to:
or, equivalent ly :
R1 = RI(R2) (9)
The re la t ion be tween R 1 and R 2 can be found by the model of Wilson and W a lk e r (1987). For gas content be tween 0.1% and 17%, eq. (9) can be approx ima ted by:
a l a 2 R1 - + - - (10)
R 2 R 2
fl(R1) = const. (i.e. R 1 -- const.) (5) where a I = - 0 . 2 3 7 and a 2 = 0.289 (number of
342 G. MACEDONIO ET AL
simulations 20, correlation coeffi- cient = -0.9987). Lower gas content are unrealistic, while for higher values, column col- lapse does not occur, since the initial density of the column is lower than that of the air. With eq. (10), eq. (8) can be rewritten:
x/ g
K 1 = 7r(~o - Oao ) a l ( f3o - ~ a o ) / ~ o + a 2
In the table, values of K 1 are reported for dif- ferent gas contents.


![Farmers G Instructio Fallout r Given IS] ions on d? - DigitalOcean](https://static.documents.pub/doc/80x56/631e23815ff22fc745068f19/farmers-g-instructio-fallout-r-given-is-ions-on-d-digitalocean.jpg)