

NASA Satellites Help Lift Cloud of Uncertainty on Climate Change2007 American Geophysical Union Fall Meeting
PanelistsDr. Graeme Stephens, principal investigator, CloudSat mission; university professor, Colorado State University, Fort Collins, Colo.Dr Jen Kay, postdoctoral fellow, National Center for Atmospheric Research, Boulder, Colo. John Haynes, Ph.D. student, Department of Atmospheric Sciences, Colorado State University
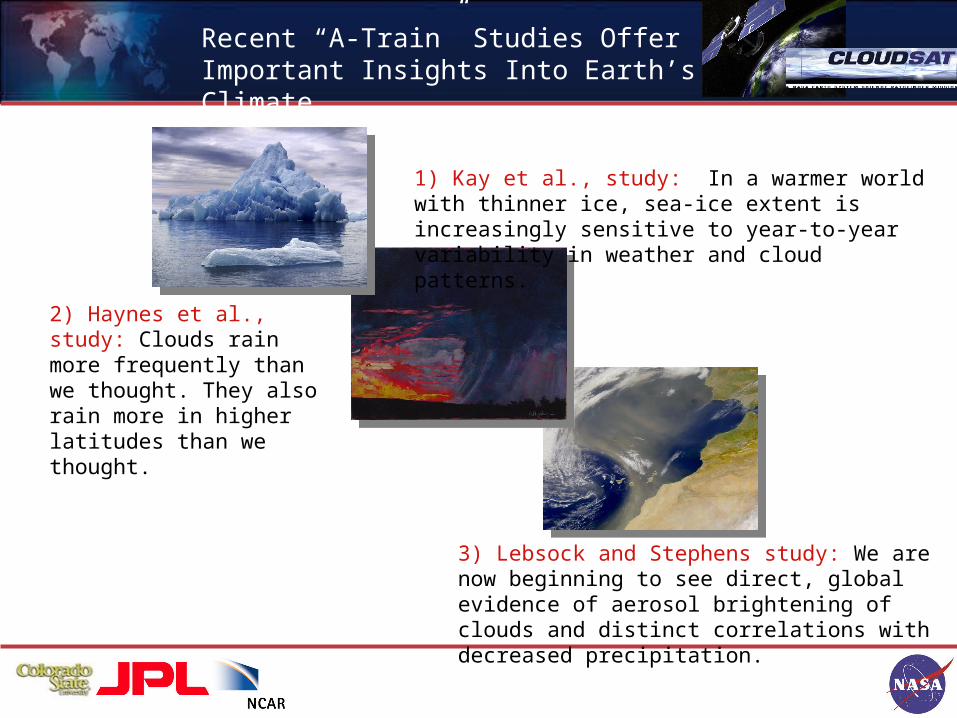
Recent “A-Train” Studies Offer Important Insights Into Earth’s Climate
1) Kay et al., study: In a warmer world with thinner ice, sea-ice extent is increasingly sensitive to year-to-year variability in weather and cloud patterns.
2) Haynes et al., study: Clouds rain more frequently than we thought. They also rain more in higher latitudes than we thought.
3) Lebsock and Stephens study: We are now beginning to see direct, global evidence of aerosol brightening of clouds and distinct correlations with decreased precipitation.

The new A-Train observations tell us much more about weather and climate-sensitive processes than can possibly be gleaned from any one instrument alone.
The “A-Train” Gives Us Unprecedented Capabilities For Observing Earth

A fraction of these pulses reflect back
while others continue downward, some
being absorbed and thus lost
The CloudSat radar measures the time
delay and magnitude of the reflected signal
Viewing Earth Actively Has Become the New Paradigm for Earth Observations
What makes CloudSat’s radar special is its sensitivity - it is able to see both small cloud particles as well as larger raindrops and snowflakes.

Example of CloudSat ‘quicklook’ data taken directly from the CloudSat data processing center (http://cloudsat.cira.colostate.edu)
30km
1400 km
CloudSat Gives Us Radar Views of Weatheron Scales Not Seen Before

Lidar Backscatter
RadarReflection
Relative Humidity
MLS
CALIPSO
CloudSat
Polar Clouds Were Difficult To Observe Before CloudSat and CALIPSO
The synergy of A-Train measurements - data sources have been collected and co-located through the A-Train data depot - poster A53D-1433; (Kempler et al.) and also at the CloudSat Data Processing Center.
South Pole, June 2007

The Disappearance Act of 2007
New Record Minimum - Sept. 2007
Sea Ice Minimum Extent Time Series
Source: National Snow and Ice Data Center

These Arctic cloud reductions are associated with
anomalous weather patterns.
The increase in sunshine could melt 0.3 meters of ice or warm
the surface ocean by 2.4 degrees Kelvin.
Kay et al. (2007)
A-Train Data Reveal Dramatic Reductions in 2007 Melt Season Cloudiness

MODIS - June 2, 2007
Thinning Sea Ice is Vulnerable to Year-to-Year Weather Variability
The summer 2007 observed cloud decreases are anomalous but not unprecedented.

How Often Does it Rain (Over the Oceans) ?
The global mean value is ~0.13, i.e., on average, about 13 percent of the clouds observed over our oceans at any time are producing rain. This fraction is much higher than
previously speculated (0.08).
The Fraction of Oceanic Clouds That Precipitate
DJF
Haynes et al., 2007

The Dreary Extra-Tropics
The new results suggest that it rains more (in amount as shown) and frequency(not shown) than other
observations indicate or is predicted by climate models, especially in the winter season.
Total Seasonally Accumulated Precipitation
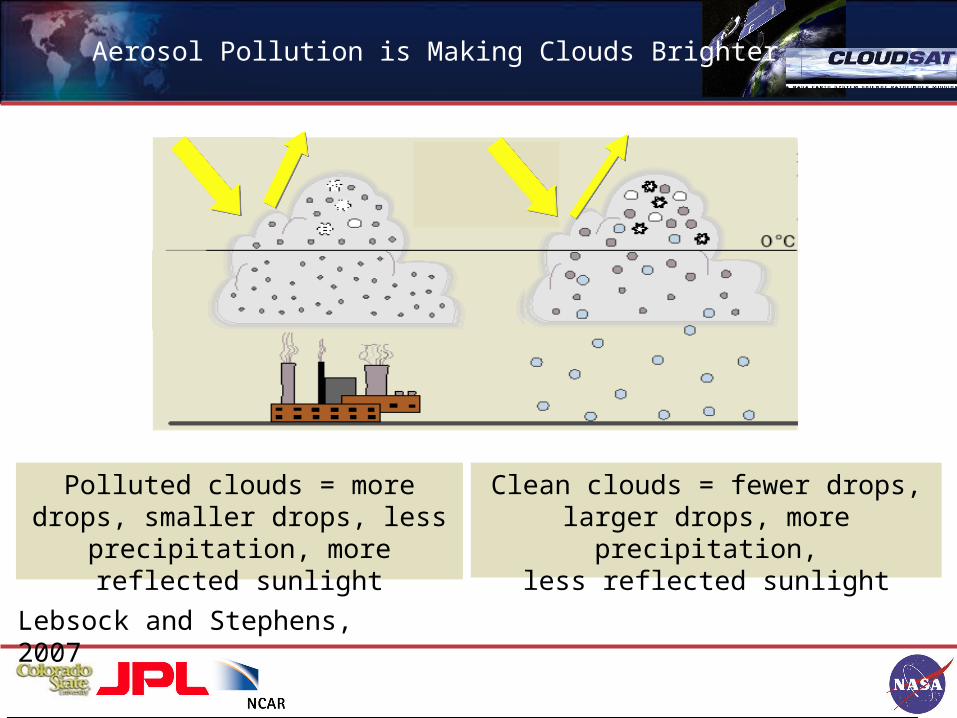
Aerosol Pollution is Making Clouds Brighter
Lebsock and Stephens, 2007
Clean clouds = fewer drops,larger drops, more precipitation,
less reflected sunlight
Polluted clouds = more drops, smaller drops, less precipitation,
more reflected sunlight

A simple example of the Twomey effect - the tracks of ships below the clouds appear in clouds through the ship effluents that act as an enhanced source of cloud condensation nuclei.
Pollution Fingerprints in Clouds and Rain
€
Reflected Sunlight → total amount of water
particle size
2) Changes to Precipitation
Two Principle Influences in ‘Warm’ (Liquid Water) Clouds:
1) Changes to Cloud Reflection (Twomey Effect)

Cloud Reflectivity
0
5
10
15
20
25
30
35
0.05 0.15 0.25 0.35 0.45
Aerosol Index
Cloud Albedo (%)
All Clouds
Non-Raining Clouds
Raining Clouds
It’s not just the smaller particle sizes of polluted
clouds that determine increases in reflected solar
radiation.
Raining clouds in high aerosol air are thicker, wetter and
more reflective.
Dark Clouds Do Have a Bright Lining
More Aerosol

Probability of Precipitation
0
1
2
3
4
5
6
7
8
0.05 0.15 0.25 0.35 0.45
Aerosol Index
% of Warm Clouds
The probability of precipitation decreases dramatically as aerosols increase - this has been hypothesized for a long time but now it is confirmed with observations.
More Aerosol
It Also Rains Less in High Aerosol Air

The new observations collected from CloudSat combined with other A-Train
observations are beginning to shed new understanding on importantclimate processes.
These new observations tell us about:
1. Cloud changes in the polar regions, and the effects of these changes on the energy balance of the Arctic, their relation to weather changes and their role in sea ice change.
2. How frequently clouds rain and how much rain falls over the global oceans - thus offering insight into processes critical to the cycling of fresh water.
3. How properties of clouds AND precipitation together change with increasing aerosol, thus offering new insights into how aerosol might indirectly affect climate.
Summary

Backups

Probability of
Precipitation
Aerosol Index
% of Warm Clouds
No Precipitation Certain Precipitation
Water and Particle Size Properties of Warm Clouds From A-Train Data

The aerosol forcing factors of climate are highly uncertain and aerosol indirect effects are most uncertain of all.
IPCC, 2007

CloudSatAMSR-E
1300 km (800 mi)

These radiation differences alone could melt ~0.3 meters of sea ice and increase ocean mixed layer temperatures by ~1.6 degrees Kelvin.
Radiation Calculations by T. L’Ecuyer (CSU).
2007-2006 Cloud and Surface Radiation Differences


