1 Solvent Recovery and Recycle John Gawalt Jaired Re Department of Chemical Engineering Virginia Polytechnic Institute and State University Submitted: November 20, 2015 Revised: December 13, 2015
Transcript
1
Solvent Recovery and Recycle
John Gawalt
Jaired Re
Department of Chemical Engineering Virginia Polytechnic Institute and State University
Submitted: November 20, 2015 Revised: December 13, 2015
2
Acknowledgements
We are extremely grateful for the opportunity to revise our design report. The completion of our
project would not have been possible without the continued support and guidance our professor,
Dr. Bortner, and his teaching assistants. We would also like to thank Dr. Liu for his exceptional
training in ASPEN Plus, and for providing us with relevant engineering heuristics necessary for
i. Economics ........................................................................................................................... 7
a. Delivered Equipment Cost ................................................................................................................ 7
b. Fixed Capital Investment ................................................................................................................... 7
c. Total Product Cost ............................................................................................................................. 7
d. Working Capital Investment (WCI) ................................................................................................... 7
e. Total Capital Investment (TCI) ........................................................................................................... 7
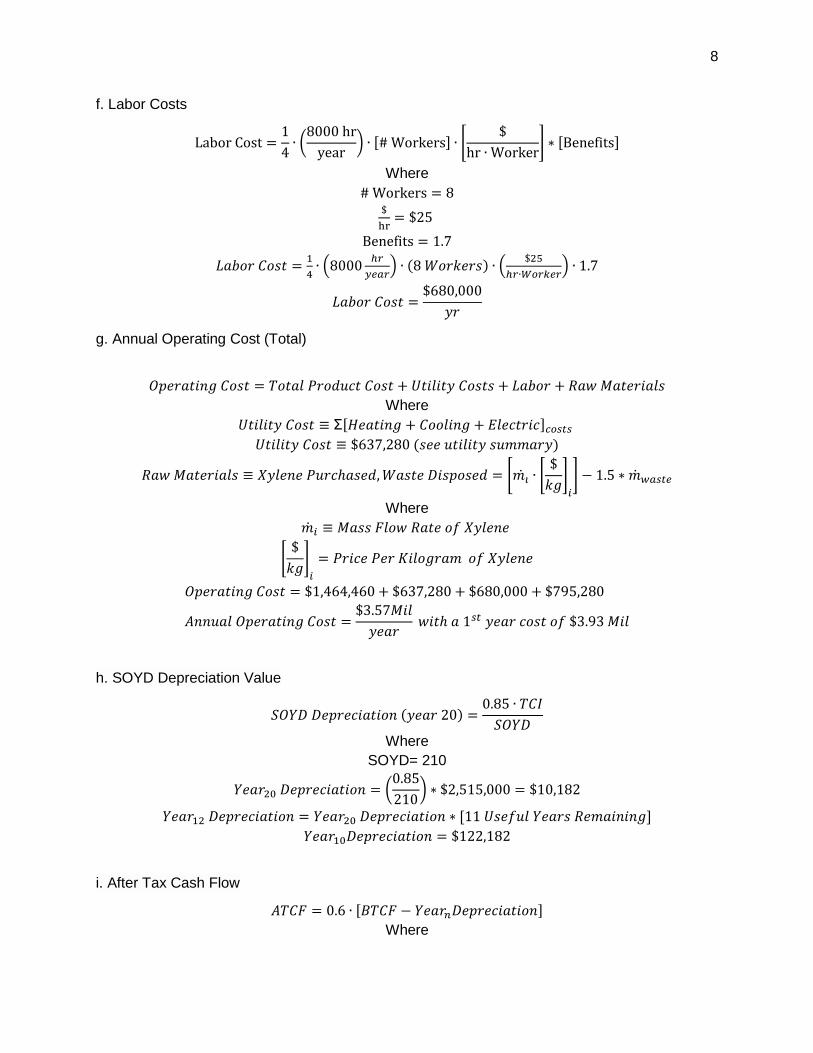
f. Labor Costs ......................................................................................................................................... 8
g. Annual Operating Cost (Total) ........................................................................................................... 8
h. SOYD Depreciation Value .................................................................................................................. 8
i. After Tax Cash Flow ............................................................................................................................ 8
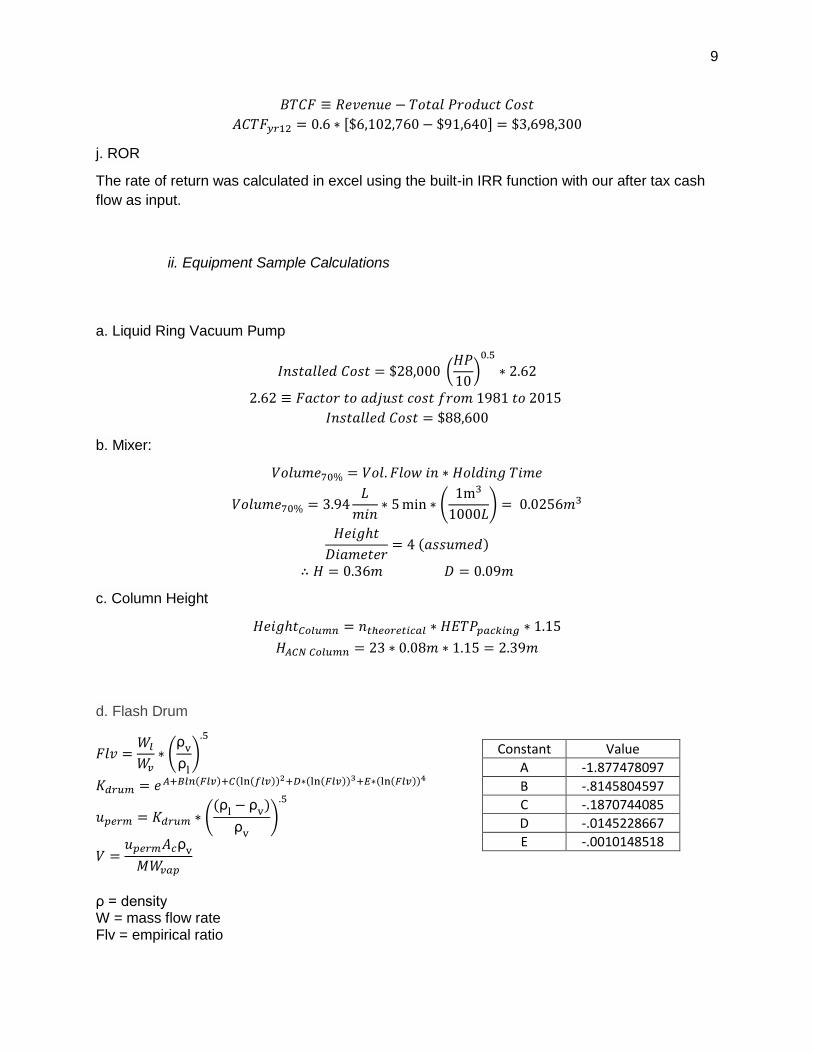
j. ROR ..................................................................................................................................................... 9
ii. Equipment Sample Calculations ......................................................................................... 9
a. Liquid Ring Vacuum Pump ................................................................................................................ 9
b. Mixer: ................................................................................................................................................ 9
c. Column Height ................................................................................................................................... 9
d. Flash Drum ........................................................................................................................................ 9
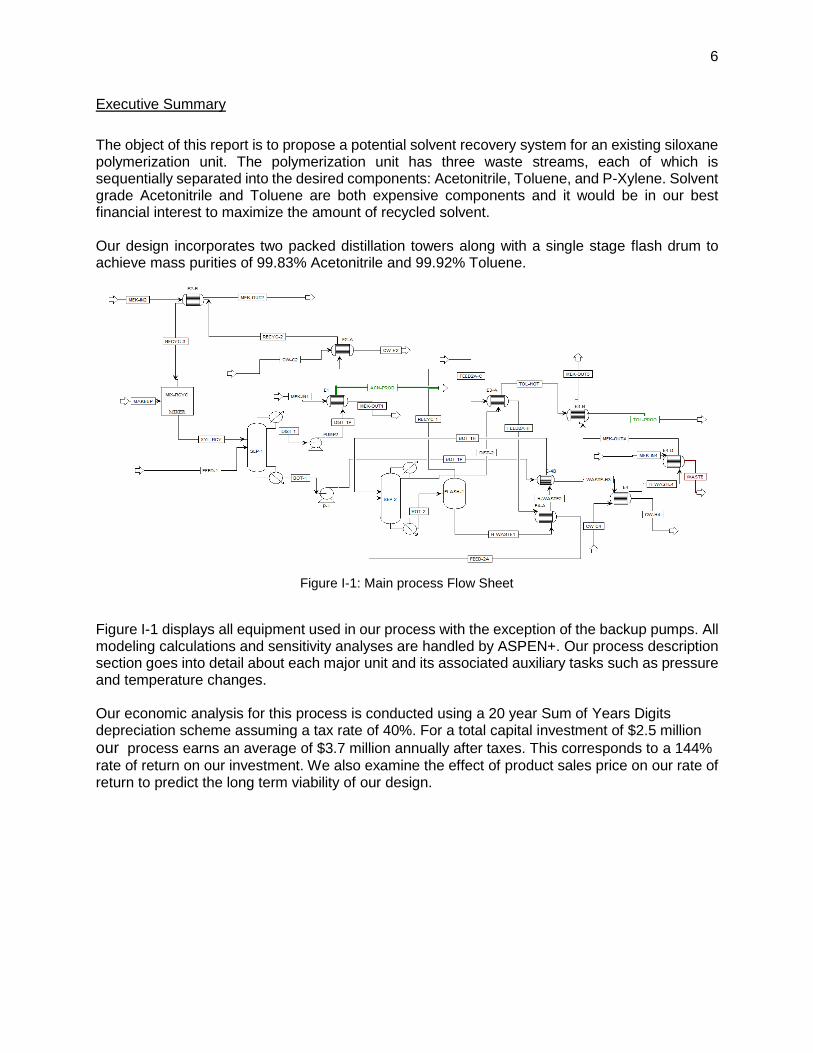
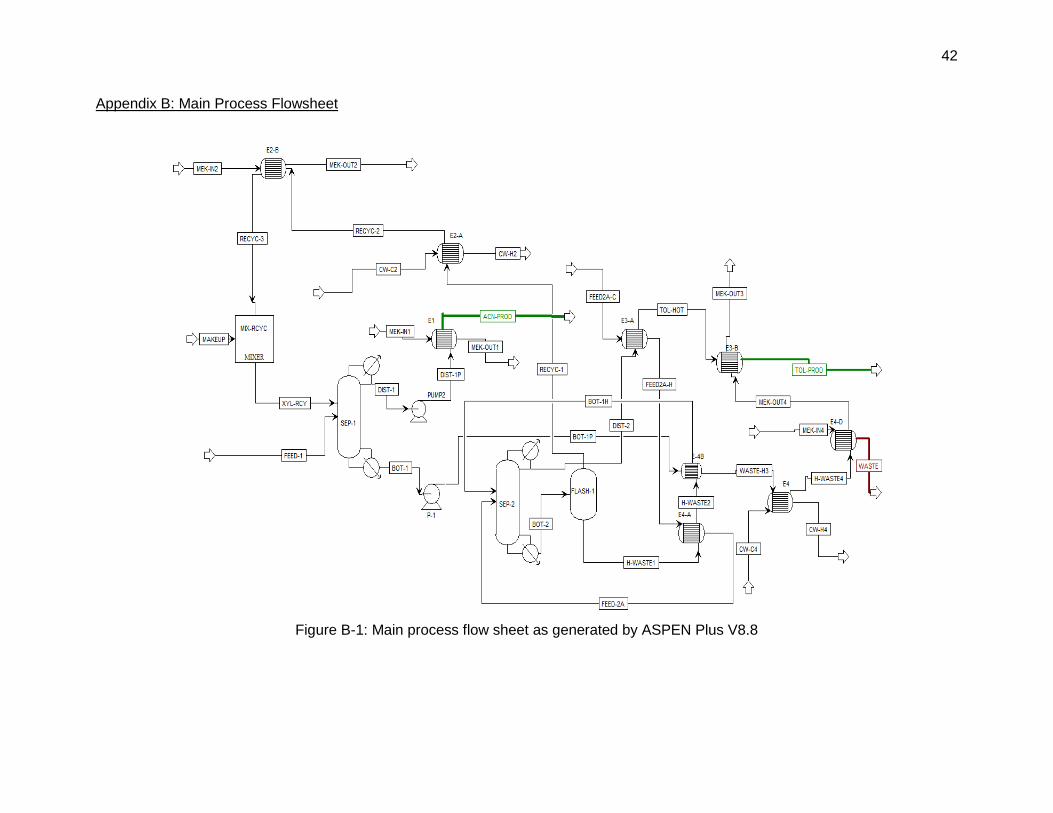
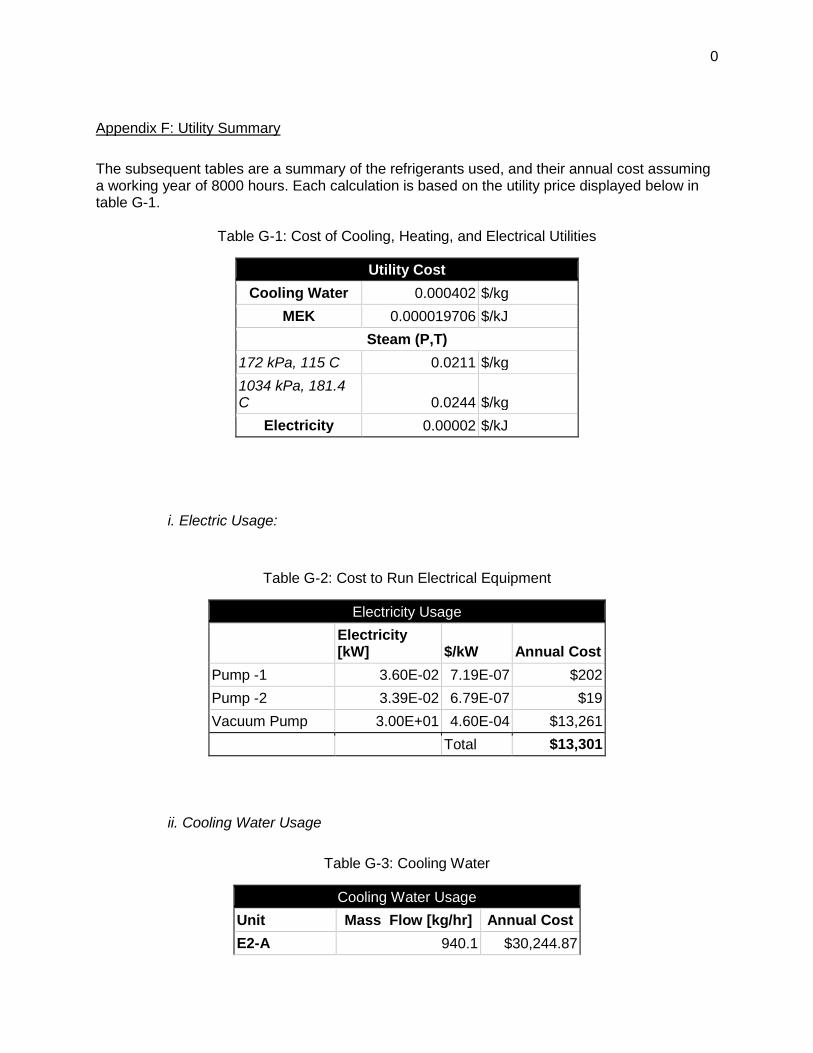
The object of this report is to propose a potential solvent recovery system for an existing siloxane polymerization unit. The polymerization unit has three waste streams, each of which is sequentially separated into the desired components: Acetonitrile, Toluene, and P-Xylene. Solvent grade Acetonitrile and Toluene are both expensive components and it would be in our best financial interest to maximize the amount of recycled solvent. Our design incorporates two packed distillation towers along with a single stage flash drum to achieve mass purities of 99.83% Acetonitrile and 99.92% Toluene.
Figure I-1 displays all equipment used in our process with the exception of the backup pumps. All modeling calculations and sensitivity analyses are handled by ASPEN+. Our process description section goes into detail about each major unit and its associated auxiliary tasks such as pressure and temperature changes. Our economic analysis for this process is conducted using a 20 year Sum of Years Digits depreciation scheme assuming a tax rate of 40%. For a total capital investment of $2.5 million
our process earns an average of $3.7 million annually after taxes. This corresponds to a 144% rate of return on our investment. We also examine the effect of product sales price on our rate of return to predict the long term viability of our design.
Figure I-1: Main process Flow Sheet
7
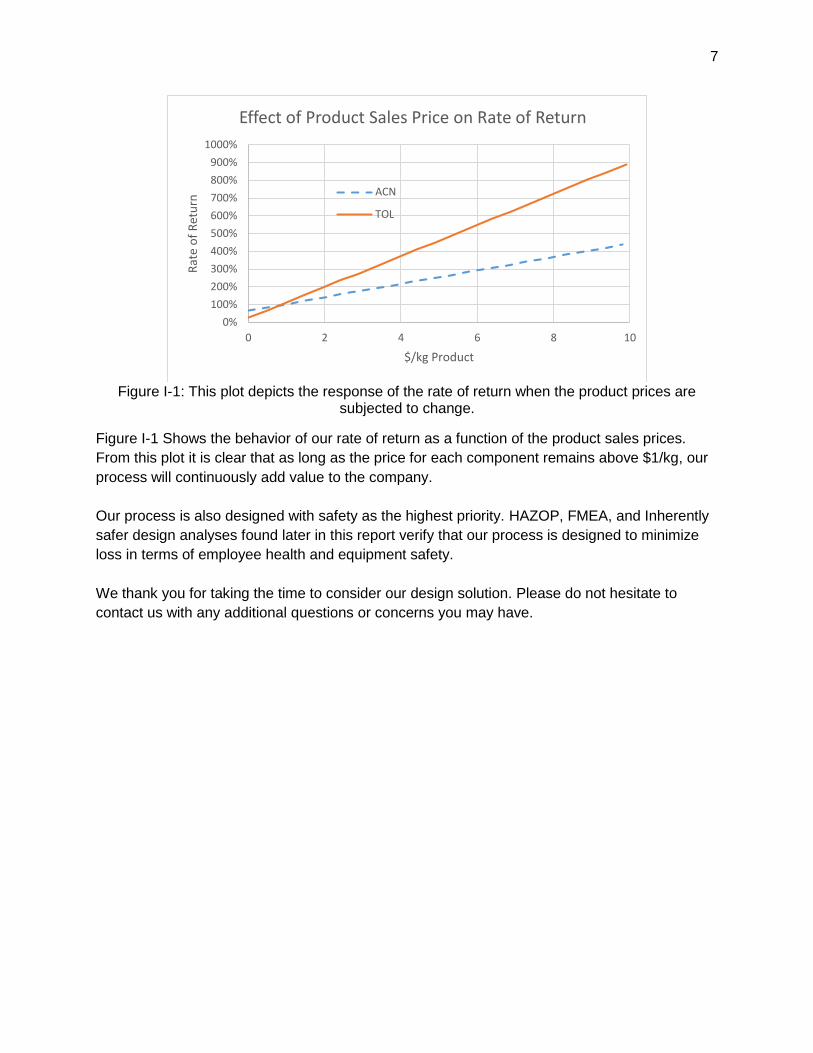
Figure I-1: This plot depicts the response of the rate of return when the product prices are
subjected to change.
Figure I-1 Shows the behavior of our rate of return as a function of the product sales prices.
From this plot it is clear that as long as the price for each component remains above $1/kg, our
process will continuously add value to the company.
Our process is also designed with safety as the highest priority. HAZOP, FMEA, and Inherently
safer design analyses found later in this report verify that our process is designed to minimize
loss in terms of employee health and equipment safety.
We thank you for taking the time to consider our design solution. Please do not hesitate to
contact us with any additional questions or concerns you may have.
0%
100%
200%
300%
400%
500%
600%
700%
800%
900%
1000%
0 2 4 6 8 10
Rat
e o
f R
etu
rn
$/kg Product
Effect of Product Sales Price on Rate of Return
ACN
TOL
8
1. Introduction
The formation of siloxane based polymers takes place in solution with strong solvents such as acetonitrile and toluene. When the polymerization is complete, the solvents must be separated once more before they can be reintroduced to the system. This is the basic idea behind our design: to minimize financial losses due to wasted solvent. Acetonitrile is very prevalent in the chemical industry and is commonly used as a solvent for liquid-liquid or liquid-solid extraction. The major benefit of acetonitrile as a solvent is that it can dissolve both organic and inorganic materials. Similarly, toluene is commonly used in industry as an organic solvent, or gasoline additive. Our design is aimed at returning solvents to the polymerization unit to save on raw material cost for each of these solvents.
9
2. Process Description
i. P&ID
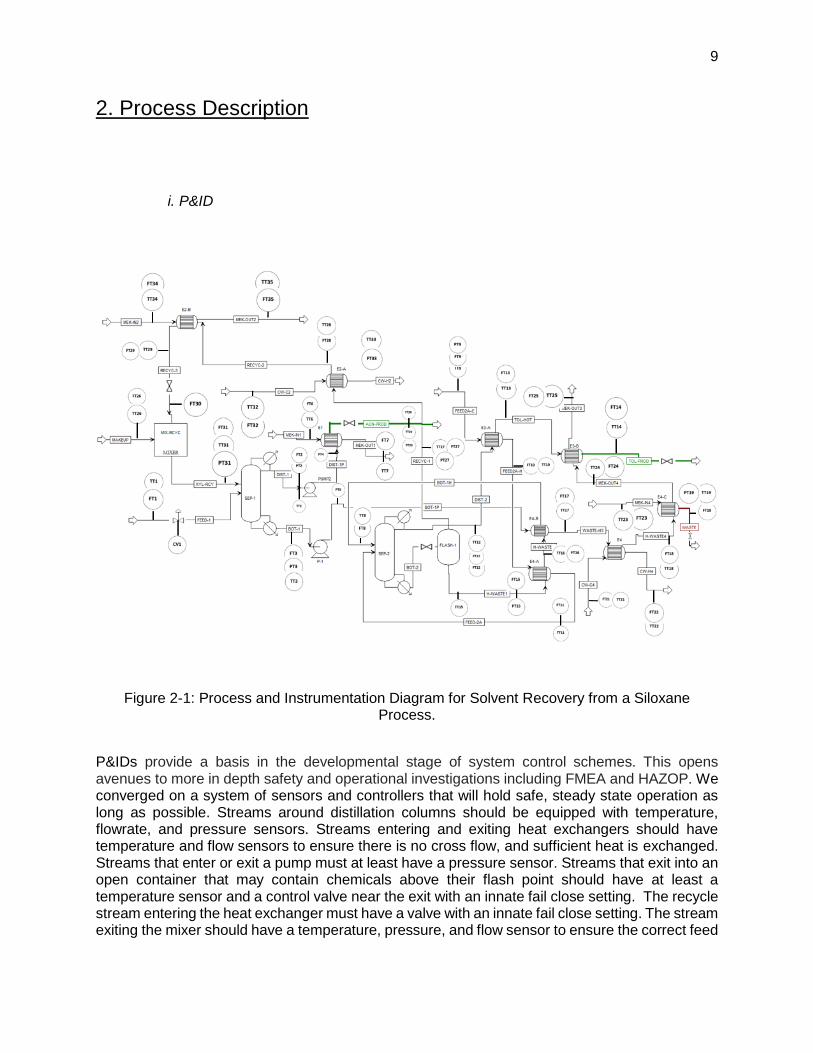
Figure 2-1: Process and Instrumentation Diagram for Solvent Recovery from a Siloxane
Process.
P&IDs provide a basis in the developmental stage of system control schemes. This opens avenues to more in depth safety and operational investigations including FMEA and HAZOP. We converged on a system of sensors and controllers that will hold safe, steady state operation as long as possible. Streams around distillation columns should be equipped with temperature, flowrate, and pressure sensors. Streams entering and exiting heat exchangers should have temperature and flow sensors to ensure there is no cross flow, and sufficient heat is exchanged. Streams that enter or exit a pump must at least have a pressure sensor. Streams that exit into an open container that may contain chemicals above their flash point should have at least a temperature sensor and a control valve near the exit with an innate fail close setting. The recycle stream entering the heat exchanger must have a valve with an innate fail close setting. The stream exiting the mixer should have a temperature, pressure, and flow sensor to ensure the correct feed
10
specifications are met. All additional sensors are added to facilitate quick, efficient troubleshooting when an issue arises.
ii. Critical Streams
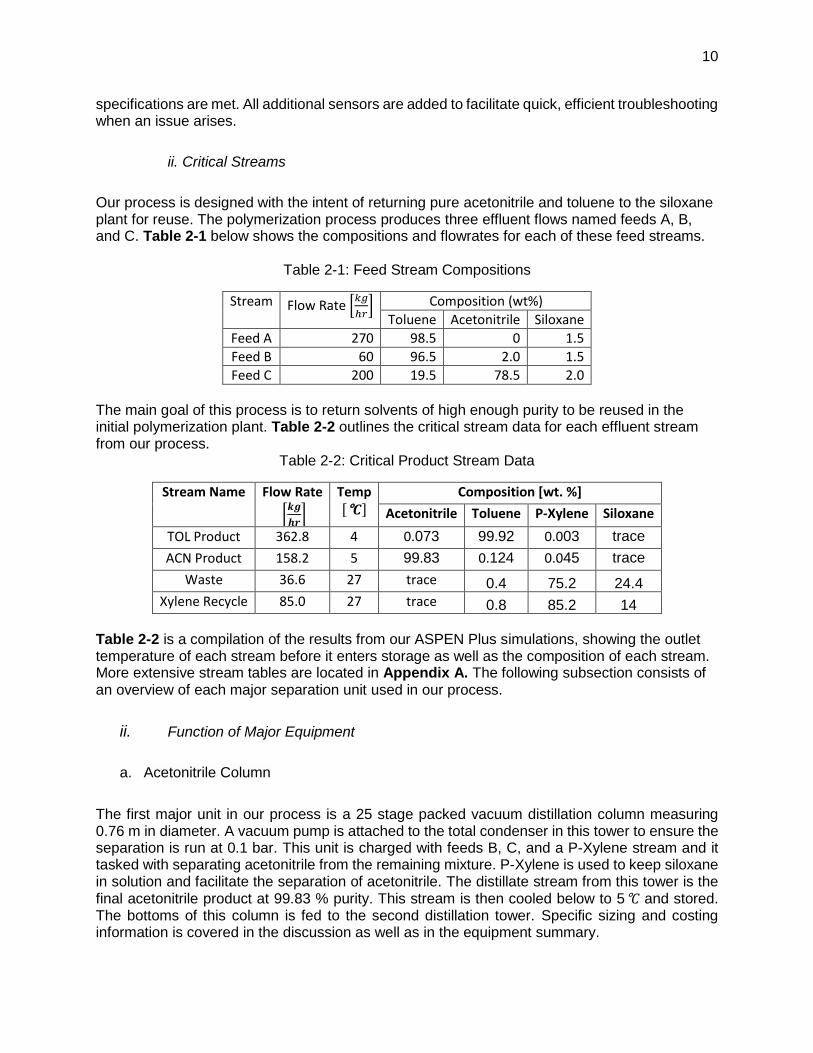
Our process is designed with the intent of returning pure acetonitrile and toluene to the siloxane plant for reuse. The polymerization process produces three effluent flows named feeds A, B, and C. Table 2-1 below shows the compositions and flowrates for each of these feed streams.
Table 2-1: Feed Stream Compositions
Stream Flow Rate [𝑘𝑔
ℎ𝑟] Composition (wt%)
Toluene Acetonitrile Siloxane
Feed A 270 98.5 0 1.5
Feed B 60 96.5 2.0 1.5
Feed C 200 19.5 78.5 2.0
The main goal of this process is to return solvents of high enough purity to be reused in the initial polymerization plant. Table 2-2 outlines the critical stream data for each effluent stream from our process.
Table 2-2: Critical Product Stream Data
Stream Name Flow Rate
[𝒌𝒈
𝒉𝒓]
Temp [°𝑪]
Composition [wt. %]
Acetonitrile Toluene P-Xylene Siloxane
TOL Product 362.8 4 0.073 99.92 0.003 trace
ACN Product 158.2 5 99.83 0.124 0.045 trace
Waste 36.6 27 trace 0.4 75.2 24.4
Xylene Recycle 85.0 27 trace 0.8 85.2 14
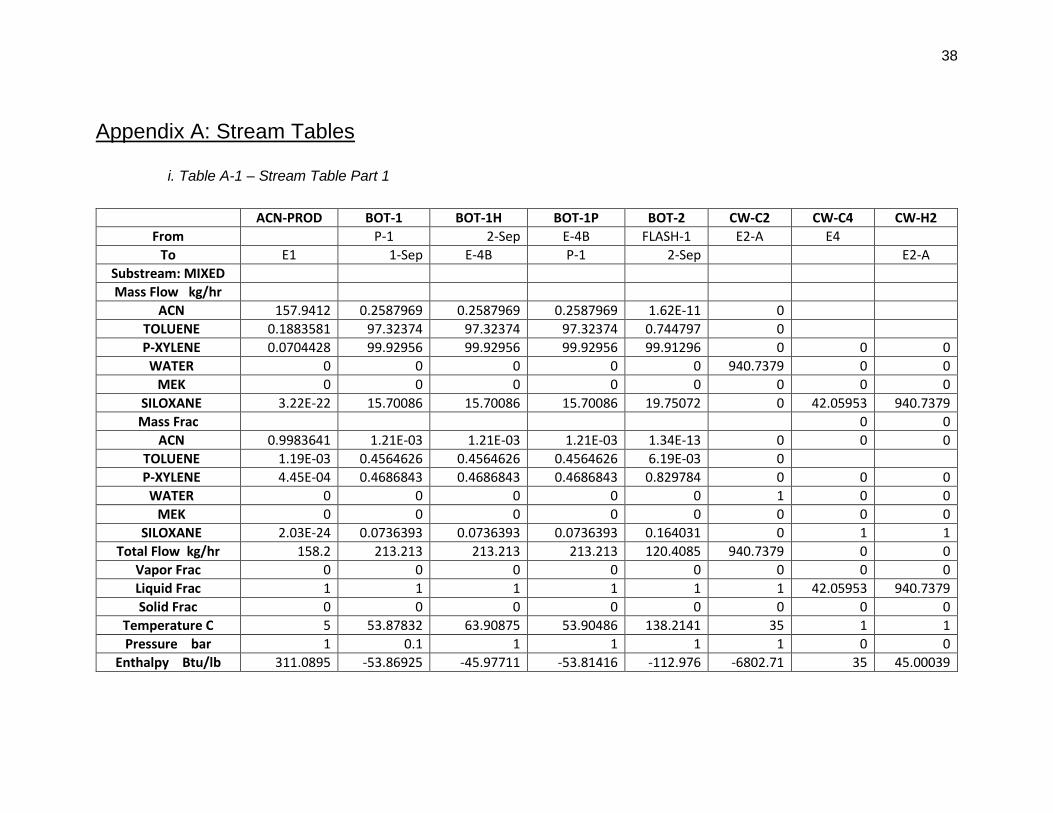
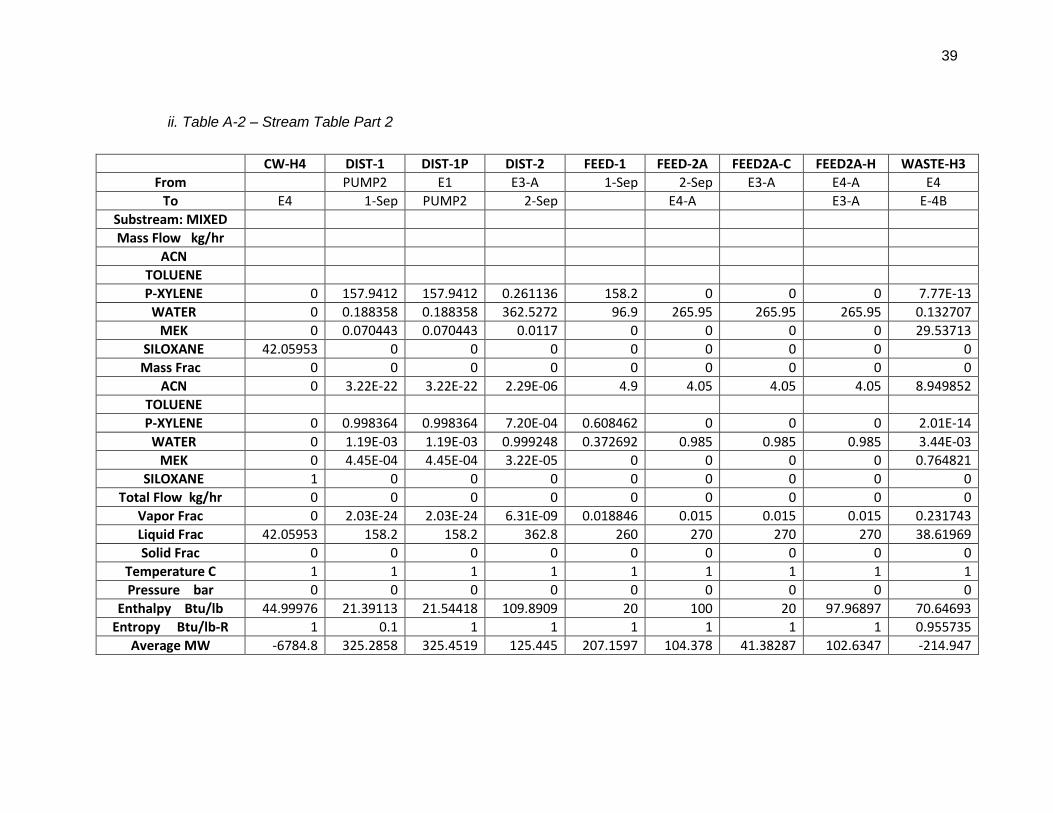
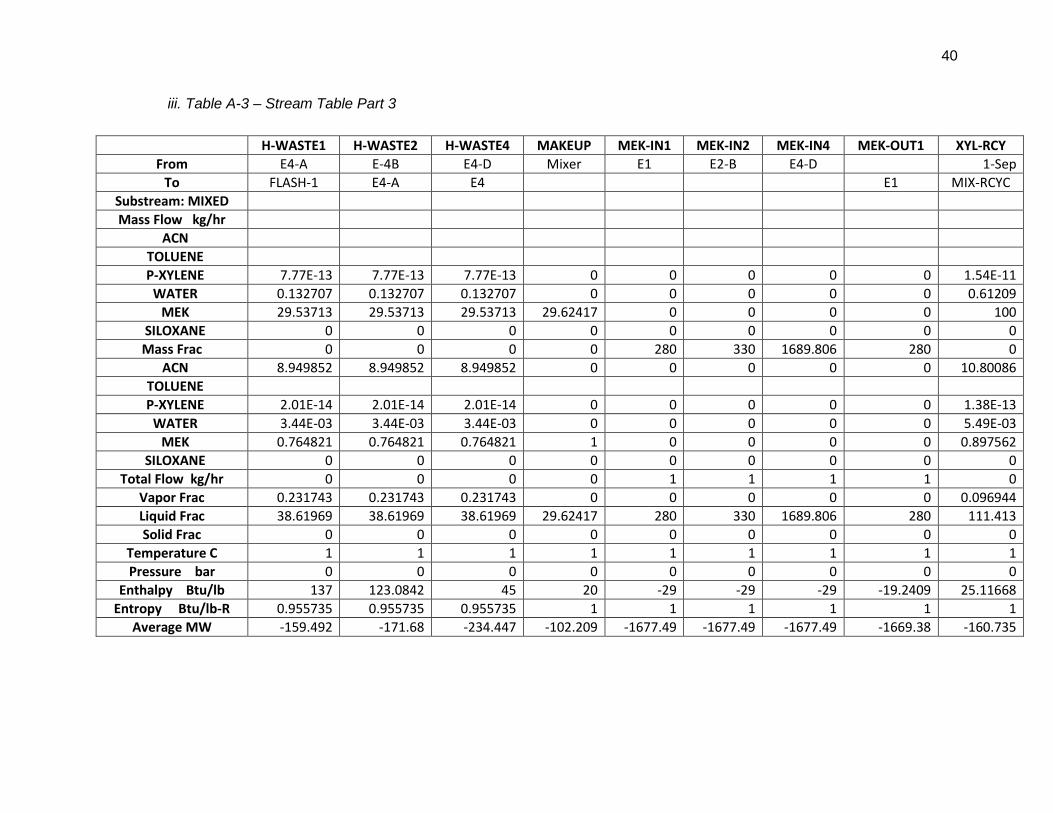
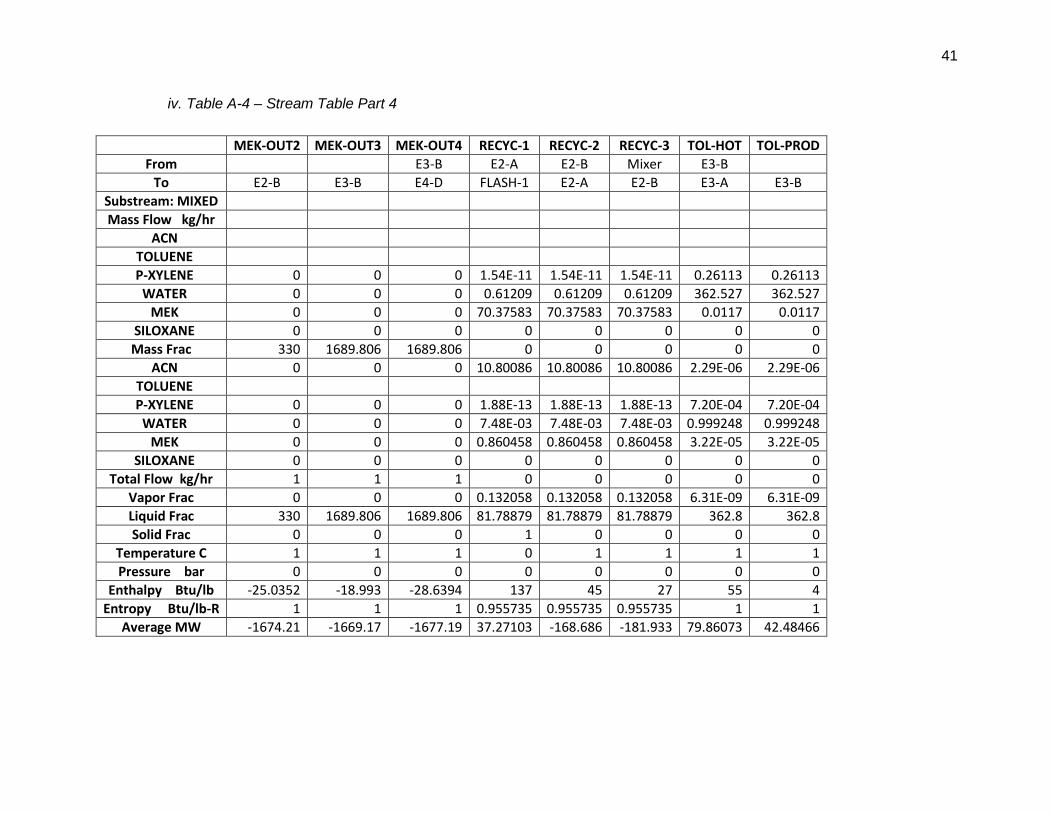
Table 2-2 is a compilation of the results from our ASPEN Plus simulations, showing the outlet temperature of each stream before it enters storage as well as the composition of each stream. More extensive stream tables are located in Appendix A. The following subsection consists of an overview of each major separation unit used in our process.
ii. Function of Major Equipment
a. Acetonitrile Column
The first major unit in our process is a 25 stage packed vacuum distillation column measuring 0.76 m in diameter. A vacuum pump is attached to the total condenser in this tower to ensure the separation is run at 0.1 bar. This unit is charged with feeds B, C, and a P-Xylene stream and it tasked with separating acetonitrile from the remaining mixture. P-Xylene is used to keep siloxane in solution and facilitate the separation of acetonitrile. The distillate stream from this tower is the final acetonitrile product at 99.83 % purity. This stream is then cooled below to 5°𝐶 and stored. The bottoms of this column is fed to the second distillation tower. Specific sizing and costing information is covered in the discussion as well as in the equipment summary.
11
b. Toluene Column
Toluene is separated at atmospheric pressure in a 24 stage packed column with a diameter of 0.6m. This column is charged with the bottoms flow out of column one as well as feed A on stages 15 and 8 respectively. This column produces a distillate stream composed of 99.92% toluene.
Similar to the column before, the toluene product is cooled below it’s to a temperature of 27°𝐶 before being sent to storage. The bottom stream is comprised primarily of p-xylene and siloxane. This stream is fed to a flash drum to return xylene to the process.
c. Flash Drum
Our flash drum operates near the vaporization point of P-Xylene at a temperature of ##### °𝐶 and a vapor fraction of 0.72 entering the drum. Siloxane is an undesired waste product and must be make up no more than 25% of any stream to avoid solid formation within the system. We desire to recover as much of our separating agent as possible, therefore our flash drum is designed to dispose a waste stream containing 24.5% siloxane. We discuss the details of sizing and costing in Section 3.
12
3. Separation Tasks: Sizing and Costs
The separations are carried out in the order most fitting to that laid out by the separation heuristics. The goal of these separation processes is to yield the highest purity acetonitrile and toluene streams while minimizing both cost and waste. Acetonitrile has the lowest boiling point and is separated first, followed by toluene and finally p-xylene.
i. ACN Column
a. Binary Analysis and Operating Pressure
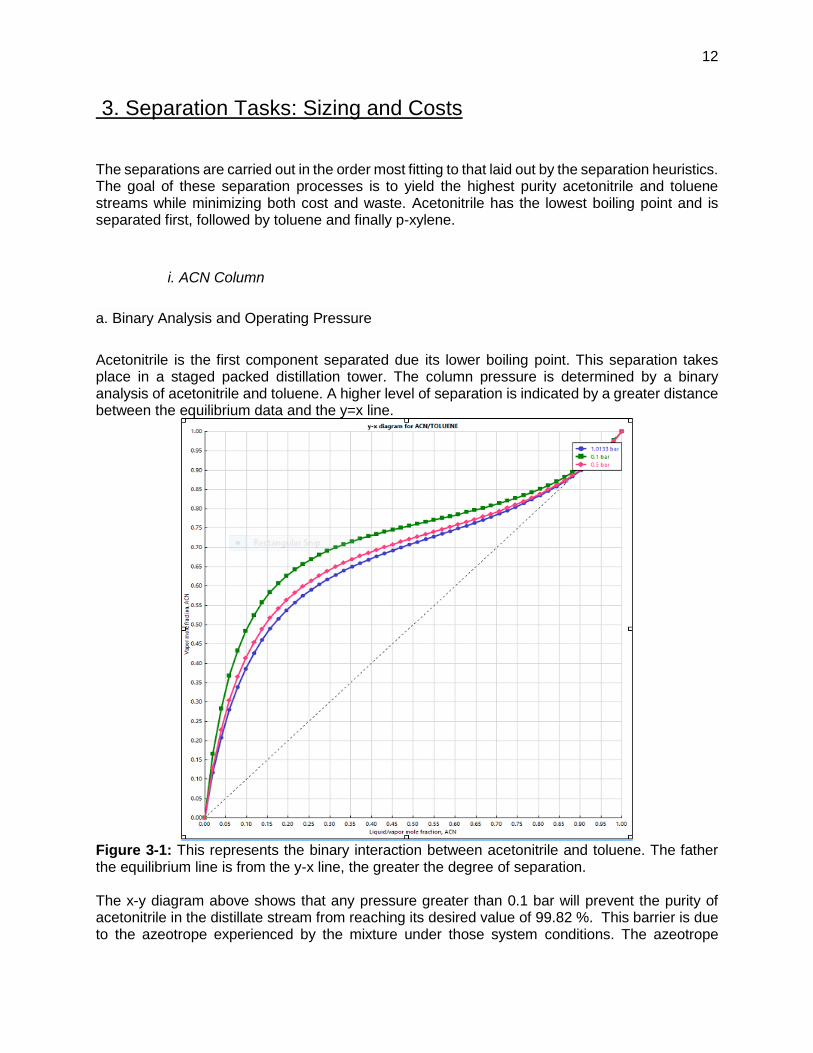
Acetonitrile is the first component separated due its lower boiling point. This separation takes place in a staged packed distillation tower. The column pressure is determined by a binary analysis of acetonitrile and toluene. A higher level of separation is indicated by a greater distance between the equilibrium data and the y=x line.
Figure 3-1: This represents the binary interaction between acetonitrile and toluene. The father the equilibrium line is from the y-x line, the greater the degree of separation. The x-y diagram above shows that any pressure greater than 0.1 bar will prevent the purity of acetonitrile in the distillate stream from reaching its desired value of 99.82 %. This barrier is due to the azeotrope experienced by the mixture under those system conditions. The azeotrope
13
composition is raised by adding P-Xylene. Xylene functions as a separating agent, increasing the relative volatility of acetonitrile while simultaneously entraining siloxane in the liquid phase. In order to achieve a vacuum of 0.1 bar, our design uses a liquid ring vacuum pump attached to the total condenser. Sizing information for the vacuum pump is located in Section 4.
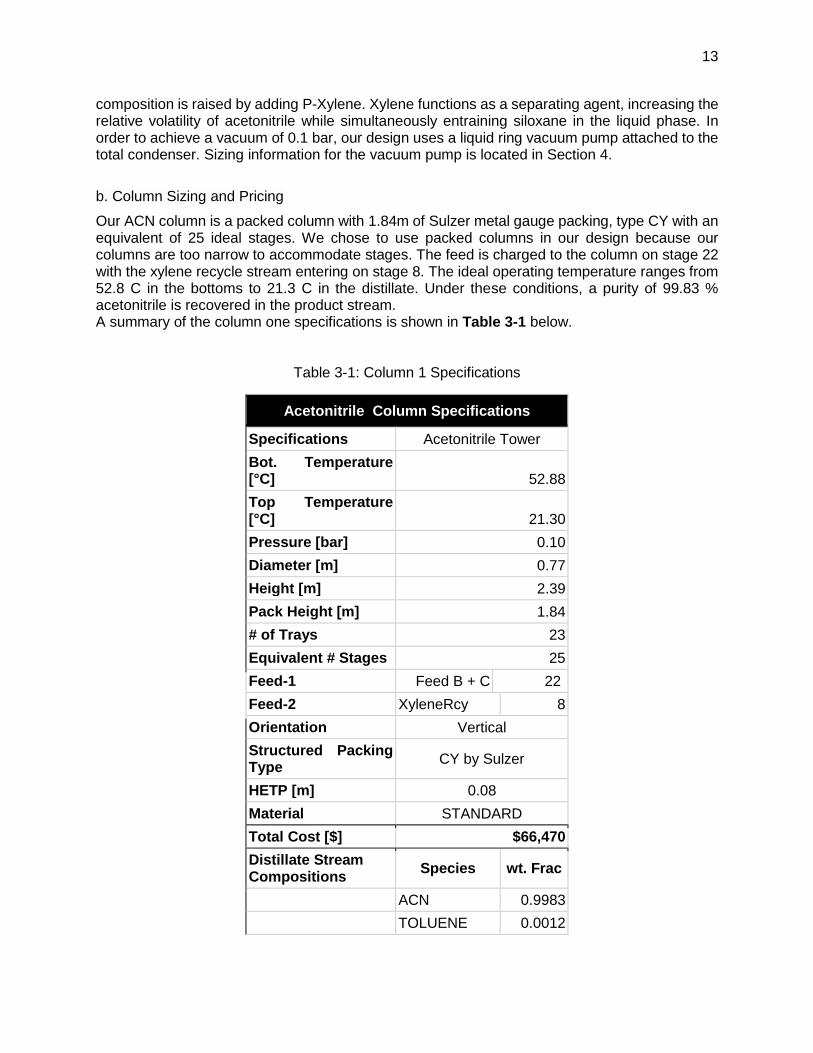
b. Column Sizing and Pricing
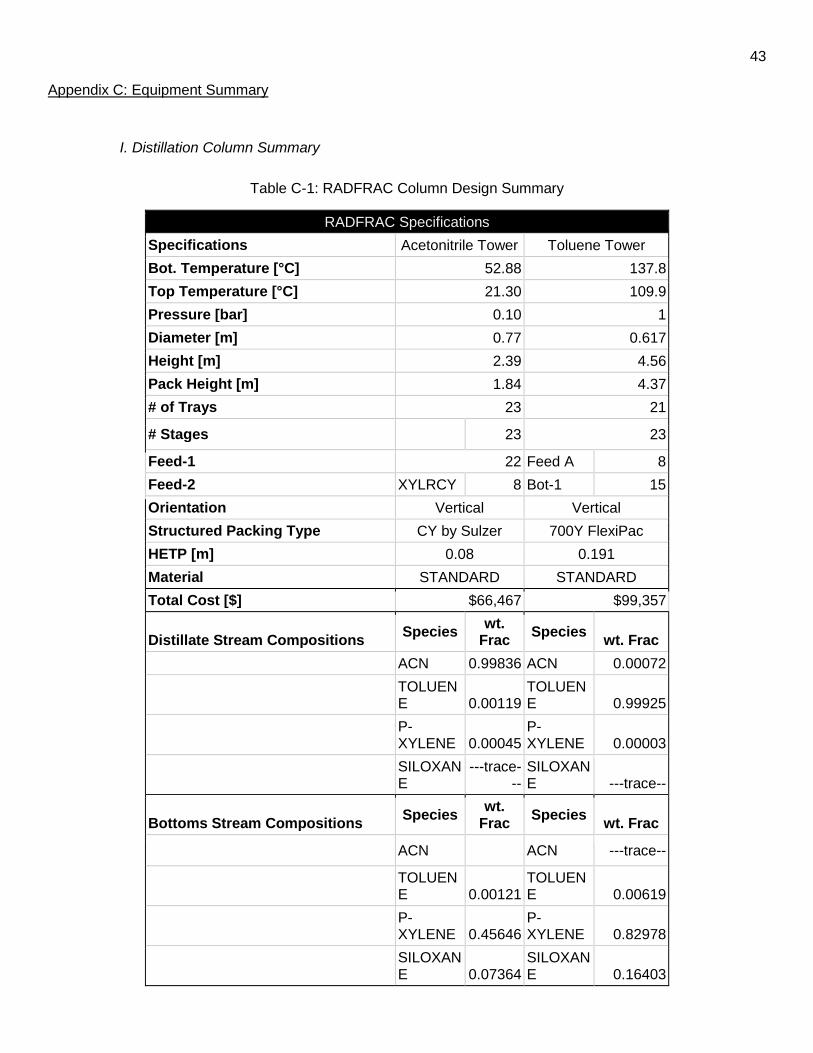
Our ACN column is a packed column with 1.84m of Sulzer metal gauge packing, type CY with an equivalent of 25 ideal stages. We chose to use packed columns in our design because our columns are too narrow to accommodate stages. The feed is charged to the column on stage 22 with the xylene recycle stream entering on stage 8. The ideal operating temperature ranges from 52.8 C in the bottoms to 21.3 C in the distillate. Under these conditions, a purity of 99.83 % acetonitrile is recovered in the product stream. A summary of the column one specifications is shown in Table 3-1 below.
Table 3-1: Column 1 Specifications
Acetonitrile Column Specifications
Specifications Acetonitrile Tower
Bot. Temperature [°C] 52.88
Top Temperature [°C] 21.30
Pressure [bar] 0.10
Diameter [m] 0.77
Height [m] 2.39
Pack Height [m] 1.84
# of Trays 23
Equivalent # Stages 25
Feed-1 Feed B + C 22
Feed-2 XyleneRcy 8
Orientation Vertical
Structured Packing Type
CY by Sulzer
HETP [m] 0.08
Material STANDARD
Total Cost [$] $66,470
Distillate Stream Compositions
Species wt. Frac
ACN 0.9983
TOLUENE 0.0012
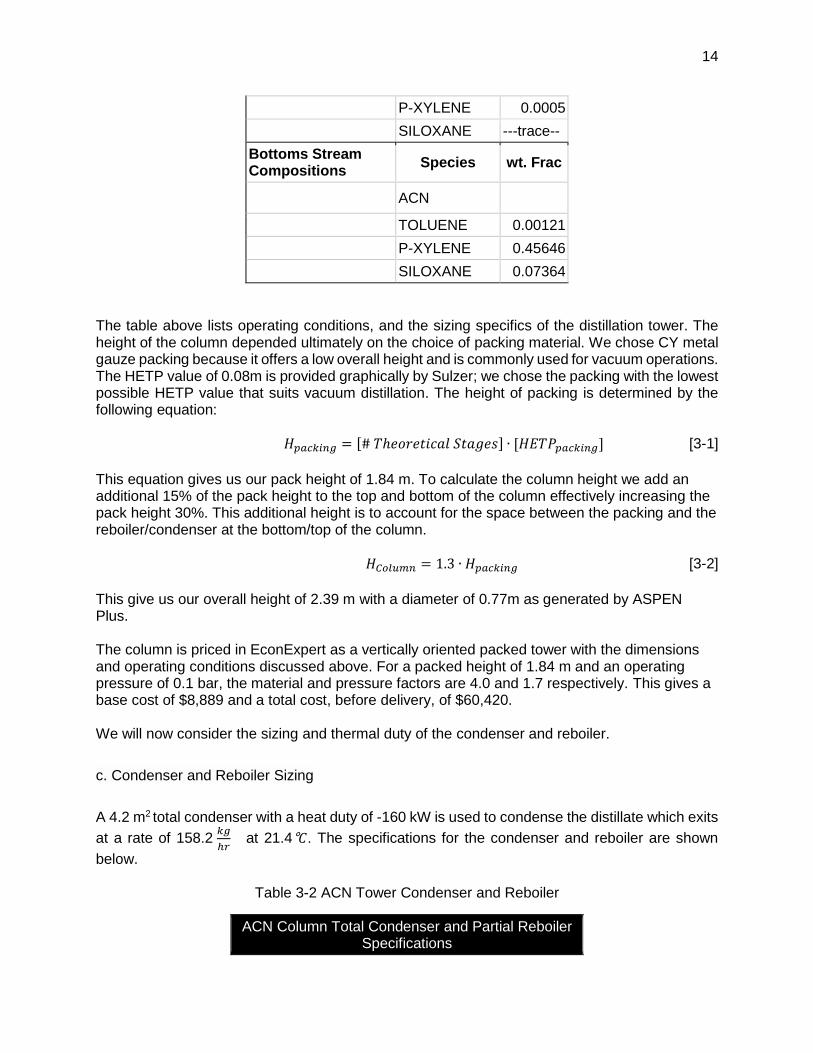
14
P-XYLENE 0.0005
SILOXANE ---trace--
Bottoms Stream Compositions
Species wt. Frac
ACN
TOLUENE 0.00121
P-XYLENE 0.45646
SILOXANE 0.07364
The table above lists operating conditions, and the sizing specifics of the distillation tower. The height of the column depended ultimately on the choice of packing material. We chose CY metal gauze packing because it offers a low overall height and is commonly used for vacuum operations. The HETP value of 0.08m is provided graphically by Sulzer; we chose the packing with the lowest possible HETP value that suits vacuum distillation. The height of packing is determined by the following equation:
This equation gives us our pack height of 1.84 m. To calculate the column height we add an additional 15% of the pack height to the top and bottom of the column effectively increasing the pack height 30%. This additional height is to account for the space between the packing and the reboiler/condenser at the bottom/top of the column.
𝐻𝐶𝑜𝑙𝑢𝑚𝑛 = 1.3 ∙ 𝐻𝑝𝑎𝑐𝑘𝑖𝑛𝑔 [3-2]
This give us our overall height of 2.39 m with a diameter of 0.77m as generated by ASPEN Plus. The column is priced in EconExpert as a vertically oriented packed tower with the dimensions and operating conditions discussed above. For a packed height of 1.84 m and an operating pressure of 0.1 bar, the material and pressure factors are 4.0 and 1.7 respectively. This gives a base cost of $8,889 and a total cost, before delivery, of $60,420. We will now consider the sizing and thermal duty of the condenser and reboiler.
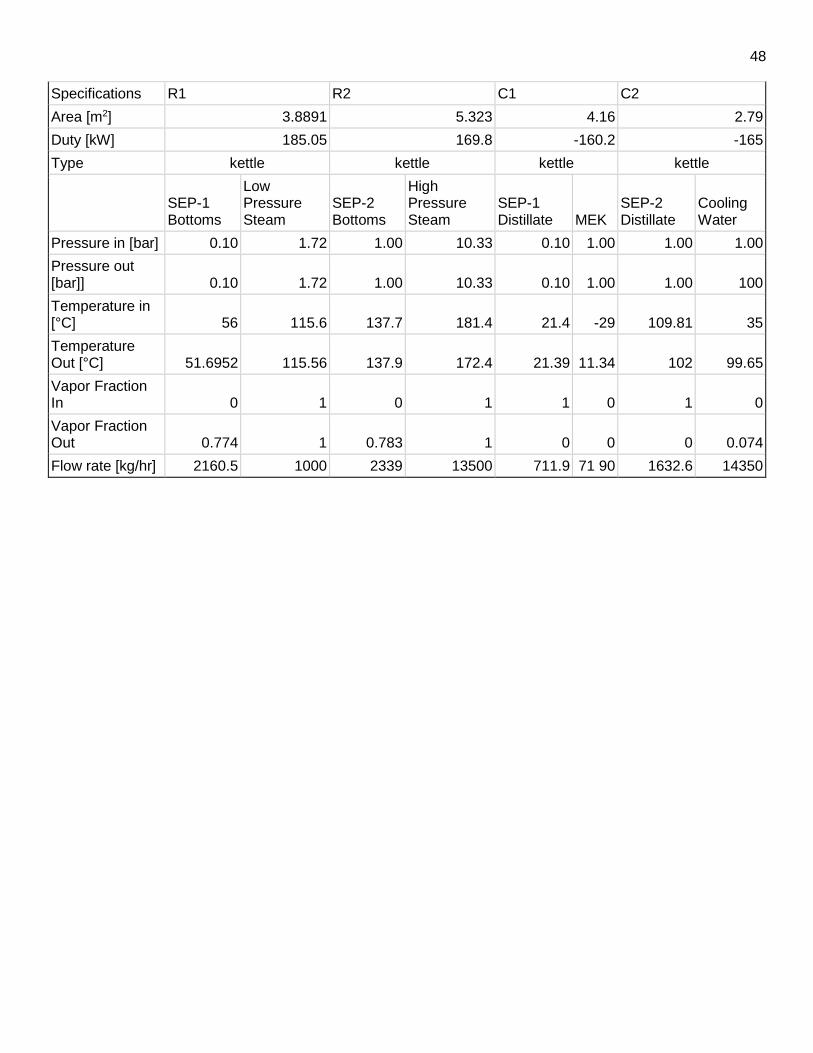
c. Condenser and Reboiler Sizing
A 4.2 m2 total condenser with a heat duty of -160 kW is used to condense the distillate which exits
at a rate of 158.2 𝑘𝑔
ℎ𝑟 at 21.4°𝐶. The specifications for the condenser and reboiler are shown
below.
Table 3-2 ACN Tower Condenser and Reboiler
ACN Column Total Condenser and Partial Reboiler Specifications
15
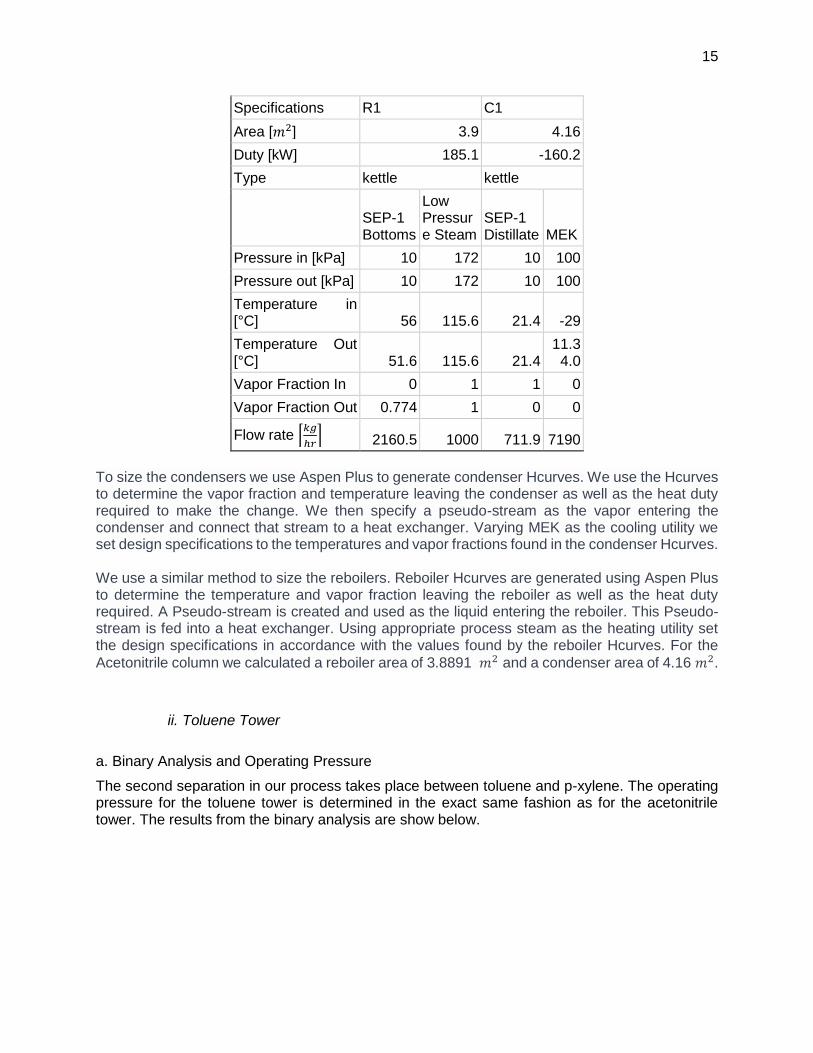
Specifications R1 C1
Area [𝑚2] 3.9 4.16
Duty [kW] 185.1 -160.2
Type kettle kettle
SEP-1 Bottoms
Low Pressure Steam
SEP-1 Distillate MEK
Pressure in [kPa] 10 172 10 100
Pressure out [kPa] 10 172 10 100
Temperature in [°C] 56 115.6 21.4 -29
Temperature Out [°C] 51.6 115.6 21.4
11.34.0
Vapor Fraction In 0 1 1 0
Vapor Fraction Out 0.774 1 0 0
Flow rate [𝑘𝑔
ℎ𝑟] 2160.5 1000 711.9 7190
To size the condensers we use Aspen Plus to generate condenser Hcurves. We use the Hcurves to determine the vapor fraction and temperature leaving the condenser as well as the heat duty required to make the change. We then specify a pseudo-stream as the vapor entering the condenser and connect that stream to a heat exchanger. Varying MEK as the cooling utility we set design specifications to the temperatures and vapor fractions found in the condenser Hcurves. We use a similar method to size the reboilers. Reboiler Hcurves are generated using Aspen Plus to determine the temperature and vapor fraction leaving the reboiler as well as the heat duty required. A Pseudo-stream is created and used as the liquid entering the reboiler. This Pseudo-stream is fed into a heat exchanger. Using appropriate process steam as the heating utility set the design specifications in accordance with the values found by the reboiler Hcurves. For the
Acetonitrile column we calculated a reboiler area of 3.8891 𝑚2 and a condenser area of 4.16 𝑚2.
ii. Toluene Tower
a. Binary Analysis and Operating Pressure
The second separation in our process takes place between toluene and p-xylene. The operating pressure for the toluene tower is determined in the exact same fashion as for the acetonitrile tower. The results from the binary analysis are show below.
16
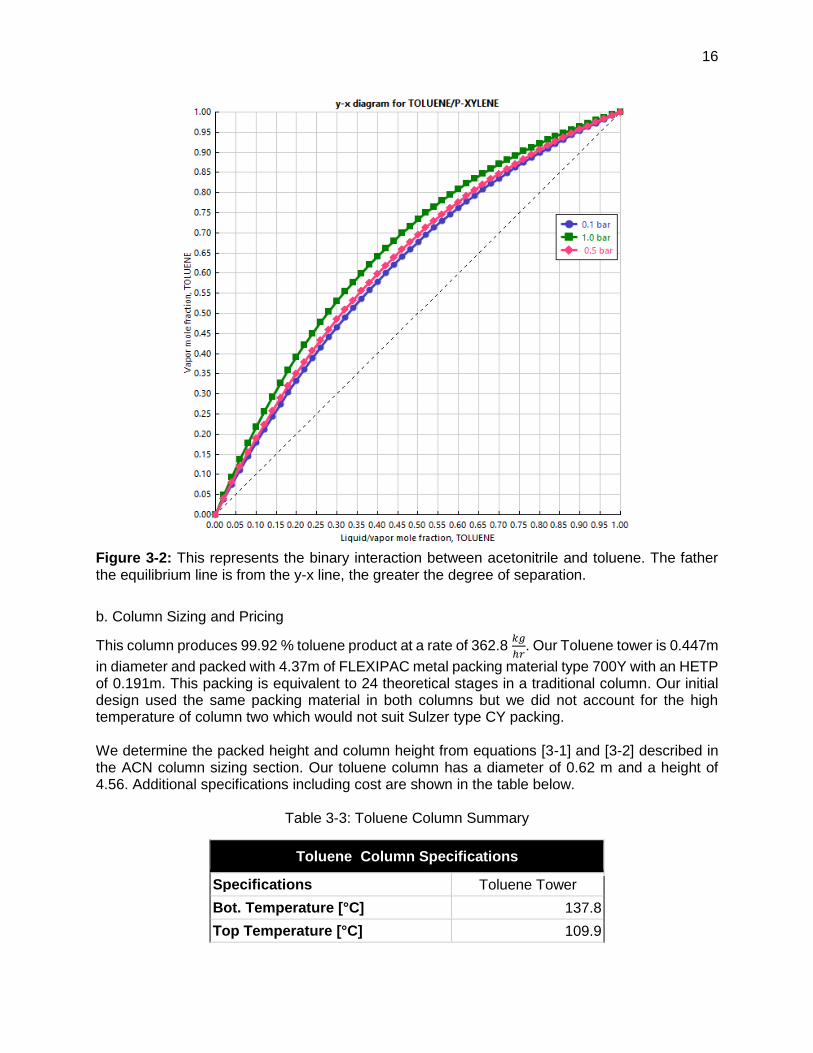
Figure 3-2: This represents the binary interaction between acetonitrile and toluene. The father the equilibrium line is from the y-x line, the greater the degree of separation.
b. Column Sizing and Pricing
This column produces 99.92 % toluene product at a rate of 362.8 𝑘𝑔
ℎ𝑟. Our Toluene tower is 0.447m
in diameter and packed with 4.37m of FLEXIPAC metal packing material type 700Y with an HETP of 0.191m. This packing is equivalent to 24 theoretical stages in a traditional column. Our initial design used the same packing material in both columns but we did not account for the high temperature of column two which would not suit Sulzer type CY packing. We determine the packed height and column height from equations [3-1] and [3-2] described in the ACN column sizing section. Our toluene column has a diameter of 0.62 m and a height of 4.56. Additional specifications including cost are shown in the table below.
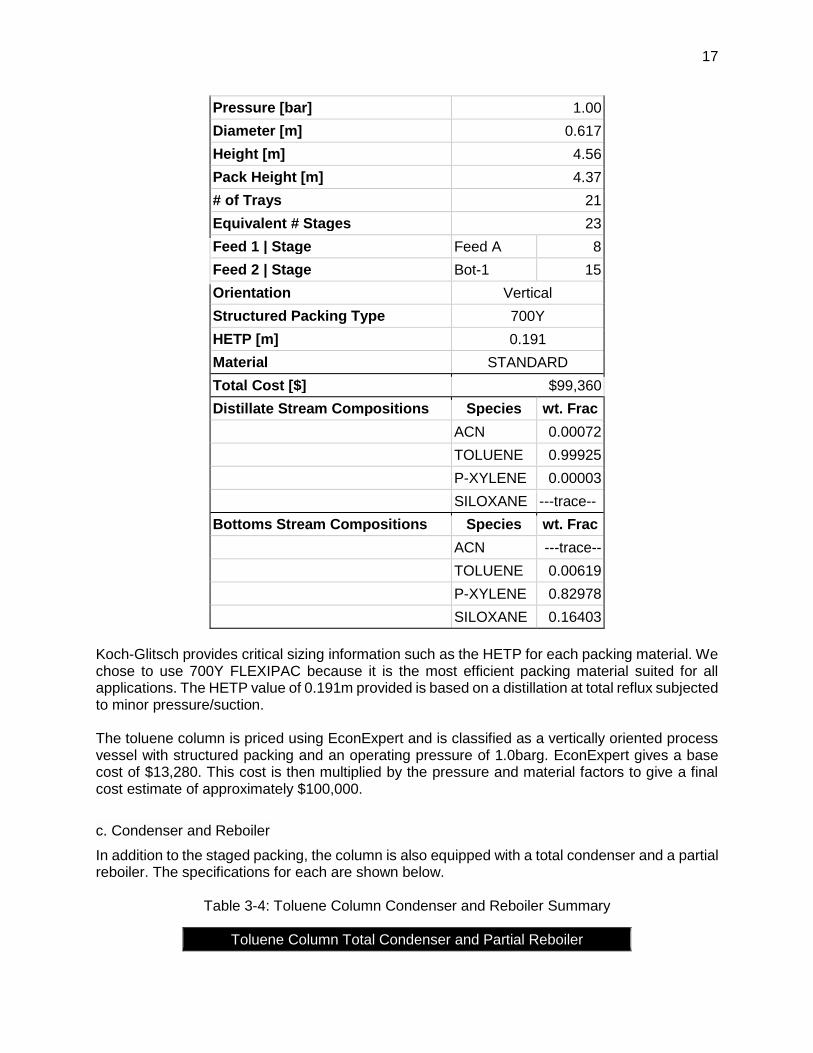
Table 3-3: Toluene Column Summary
Toluene Column Specifications
Specifications Toluene Tower
Bot. Temperature [°C] 137.8
Top Temperature [°C] 109.9
17
Pressure [bar] 1.00
Diameter [m] 0.617
Height [m] 4.56
Pack Height [m] 4.37
# of Trays 21
Equivalent # Stages 23
Feed 1 | Stage Feed A 8
Feed 2 | Stage Bot-1 15
Orientation Vertical
Structured Packing Type 700Y
HETP [m] 0.191
Material STANDARD
Total Cost [$] $99,360
Distillate Stream Compositions Species wt. Frac
ACN 0.00072
TOLUENE 0.99925
P-XYLENE 0.00003
SILOXANE ---trace--
Bottoms Stream Compositions Species wt. Frac
ACN ---trace--
TOLUENE 0.00619
P-XYLENE 0.82978
SILOXANE 0.16403
Koch-Glitsch provides critical sizing information such as the HETP for each packing material. We chose to use 700Y FLEXIPAC because it is the most efficient packing material suited for all applications. The HETP value of 0.191m provided is based on a distillation at total reflux subjected to minor pressure/suction. The toluene column is priced using EconExpert and is classified as a vertically oriented process vessel with structured packing and an operating pressure of 1.0barg. EconExpert gives a base cost of $13,280. This cost is then multiplied by the pressure and material factors to give a final cost estimate of approximately $100,000.
c. Condenser and Reboiler
In addition to the staged packing, the column is also equipped with a total condenser and a partial reboiler. The specifications for each are shown below.
Table 3-4: Toluene Column Condenser and Reboiler Summary
Toluene Column Total Condenser and Partial Reboiler
18
Specifications R2 C2
Area [m2] 5.323 2.79
Duty [kW] 169.825 -165
Type kettle kettle
SEP-2 Bottoms
High Pressure Steam
SEP-2 Distillate
Cooling Water
Pressure in [kPa] 100 1033 100 100
Pressure out [kPa] 100 1033 100 100
Temperature in [°C] 137.7 181.4 109.81 35
Temperature Out [°C] 137.9 172.4 102 99.65
Vapor Fraction In 0 1 1 0
Vapor Fraction Out 0.783 1 0 0.074
Flow rate [kg/hr] 2339 13500 1632.6 2000
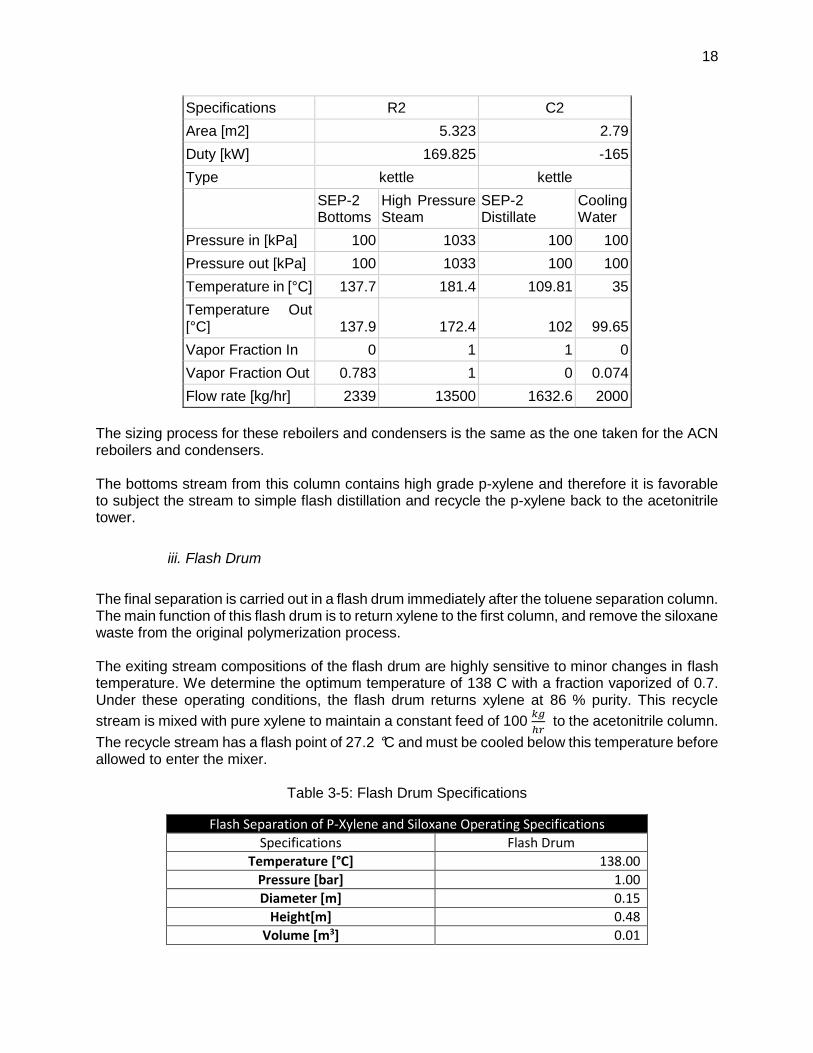
The sizing process for these reboilers and condensers is the same as the one taken for the ACN reboilers and condensers. The bottoms stream from this column contains high grade p-xylene and therefore it is favorable to subject the stream to simple flash distillation and recycle the p-xylene back to the acetonitrile tower.
iii. Flash Drum
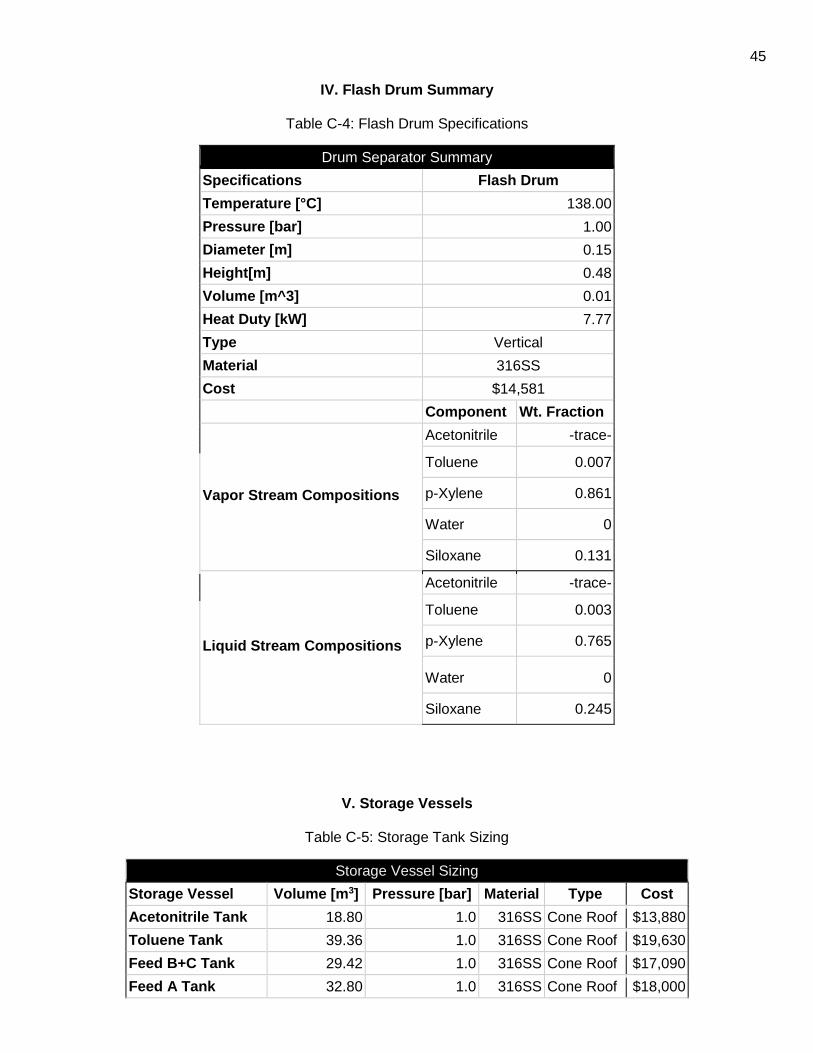
The final separation is carried out in a flash drum immediately after the toluene separation column. The main function of this flash drum is to return xylene to the first column, and remove the siloxane waste from the original polymerization process. The exiting stream compositions of the flash drum are highly sensitive to minor changes in flash temperature. We determine the optimum temperature of 138 C with a fraction vaporized of 0.7. Under these operating conditions, the flash drum returns xylene at 86 % purity. This recycle
stream is mixed with pure xylene to maintain a constant feed of 100 𝑘𝑔
ℎ𝑟 to the acetonitrile column.
The recycle stream has a flash point of 27.2 °C and must be cooled below this temperature before allowed to enter the mixer.
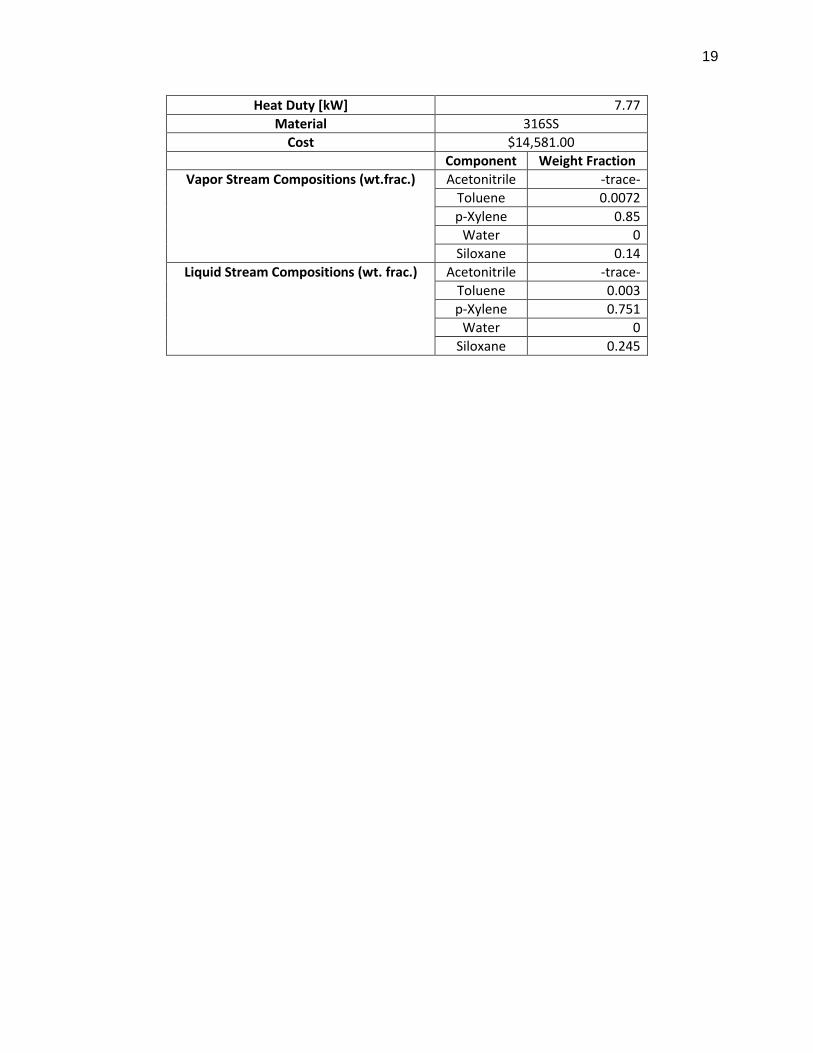
Table 3-5: Flash Drum Specifications
Flash Separation of P-Xylene and Siloxane Operating Specifications
In addition to the three main separation tasks several auxiliary units are incorporated in this process including:
i. Vacuum Pump ii. Positive Displacement Pumps iii. Reflux Drums iv. Mixer – Motionless, Open Air v. Heat Exchangers vi. Storage Tanks vii. Material of Construction Analysis
i. Vacuum Pump
The separation carried out in the first column requires a sub-atmospheric pressure determined by our VLE binary analysis to be 0.1 bar. To pull the vacuum we chose to use a liquid ring pump because they are easy to maintain. Liquid ring pumps only have one moving part, leaving the majority of the mechanical duty to the fluid. To determine the power required to drive the pump we consult pump performance curves provided by Aerstin and Street (1978). The performance curve plots horse power and volume flow rate of the pump versus the suction head. Our design
requires 0.9 bar of suction at a volume flow rate of 5.1 𝐿
𝑚𝑖𝑛 yielding a 20.4 kW power requirement.
The equation below is used to calculate the purchase cost of the liquid-ring pump.
𝐼𝑛𝑠𝑡𝑎𝑙𝑙𝑒𝑑 𝐶𝑜𝑠𝑡𝑠 = $28,000 [𝐻𝑃
10]
0.5∙ [
1956
745] [4-1]
In the above equation HP represents the power supplied to the fluid in horsepower. The second term in the equation is a corrective factor which adjusts the costs to the proper year. 1956 is the cost index for the current year, 745 was the cost index in 1981. These calculations yield a final estimated pump cost of $88,600. Table 4-1 below displays the results of the pump sizing and costing analysis.
Table 4-1: Vacuum Pump Summary
Vacuum Pump
Specification Vacuum
Type Liquid Ring
Power [kW] 20.4
Flowrate [l/min] 5.1
Pressure in [bar] 1.00
Pressure out [bar] 0.10
Cost [$] $88,574
Material Stainless Steel
Table 4-1 is a summary of the sizing and costing analysis conducted for the vacuum pump. We double this cost in our economic analysis to purchase a backup pump that would allow for
21
continuous production during primary pump maintenance or failure. Stainless Steel and bronze are the materials of choice for liquid-ring pumps as suggested by Aerstin and Street.
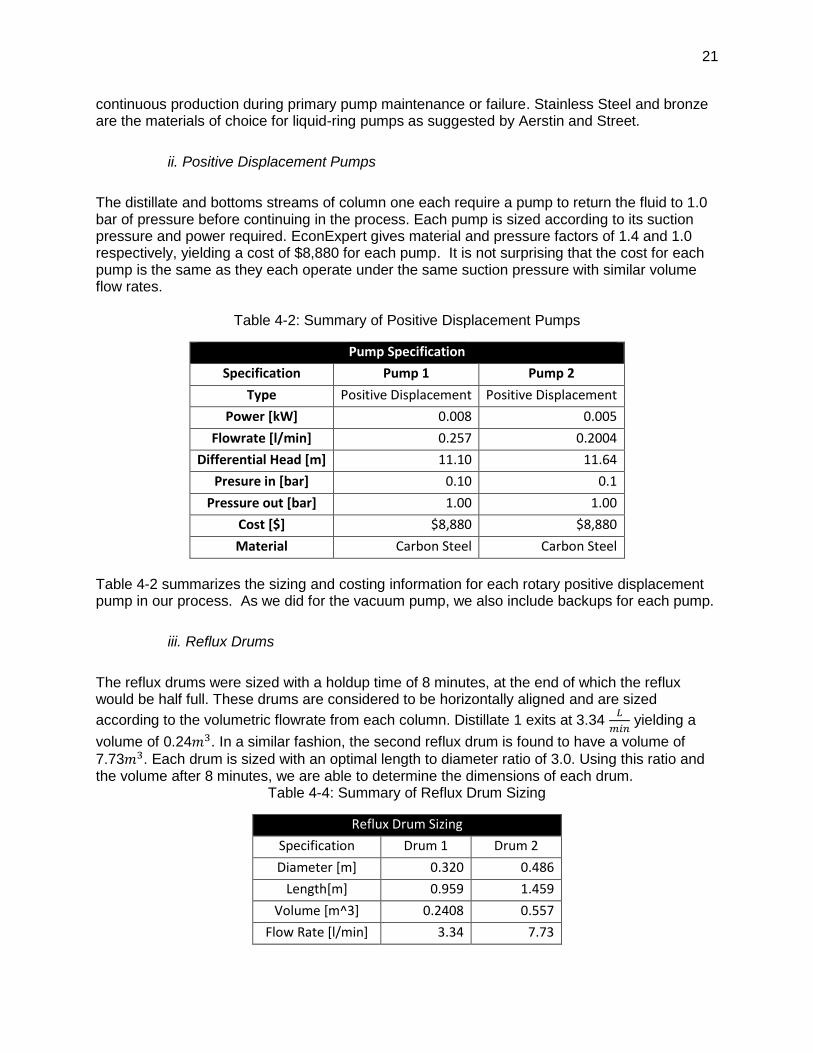
ii. Positive Displacement Pumps
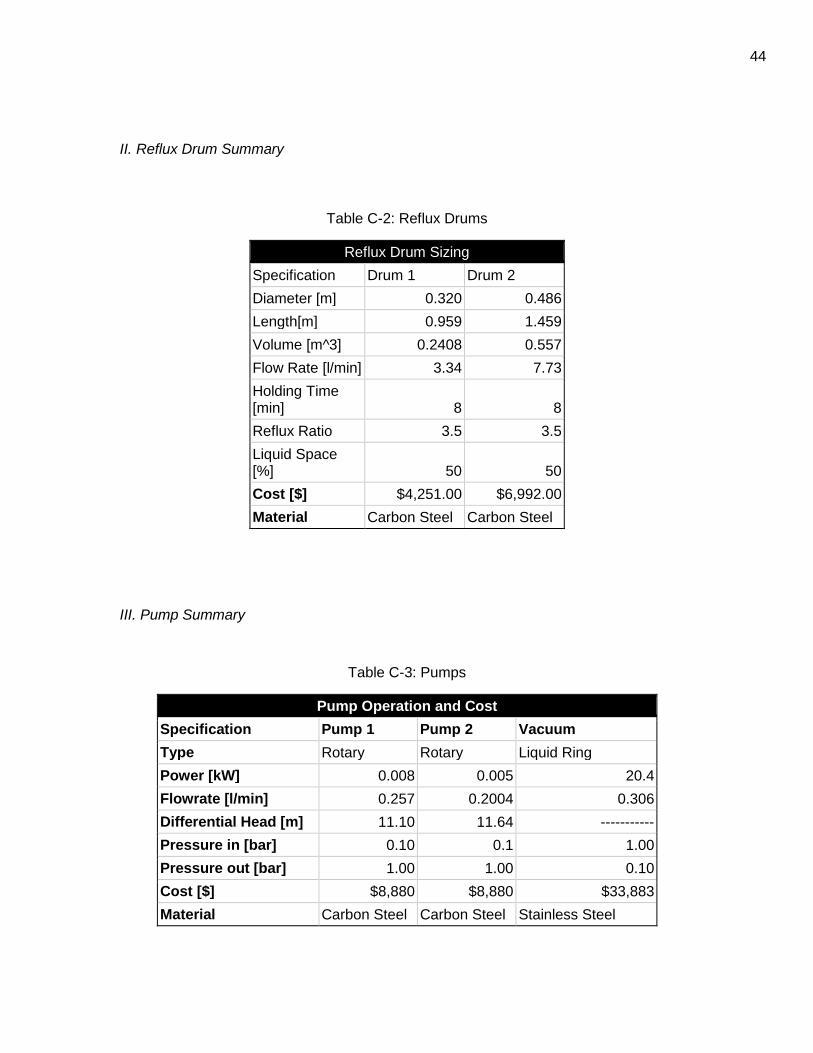
The distillate and bottoms streams of column one each require a pump to return the fluid to 1.0 bar of pressure before continuing in the process. Each pump is sized according to its suction pressure and power required. EconExpert gives material and pressure factors of 1.4 and 1.0 respectively, yielding a cost of $8,880 for each pump. It is not surprising that the cost for each pump is the same as they each operate under the same suction pressure with similar volume flow rates.
Table 4-2: Summary of Positive Displacement Pumps
Pump Specification
Specification Pump 1 Pump 2
Type Positive Displacement Positive Displacement
Power [kW] 0.008 0.005
Flowrate [l/min] 0.257 0.2004
Differential Head [m] 11.10 11.64
Presure in [bar] 0.10 0.1
Pressure out [bar] 1.00 1.00
Cost [$] $8,880 $8,880
Material Carbon Steel Carbon Steel
Table 4-2 summarizes the sizing and costing information for each rotary positive displacement pump in our process. As we did for the vacuum pump, we also include backups for each pump.
iii. Reflux Drums
The reflux drums were sized with a holdup time of 8 minutes, at the end of which the reflux would be half full. These drums are considered to be horizontally aligned and are sized
according to the volumetric flowrate from each column. Distillate 1 exits at 3.34 𝐿
𝑚𝑖𝑛 yielding a
volume of 0.24𝑚3. In a similar fashion, the second reflux drum is found to have a volume of
7.73𝑚3. Each drum is sized with an optimal length to diameter ratio of 3.0. Using this ratio and the volume after 8 minutes, we are able to determine the dimensions of each drum.
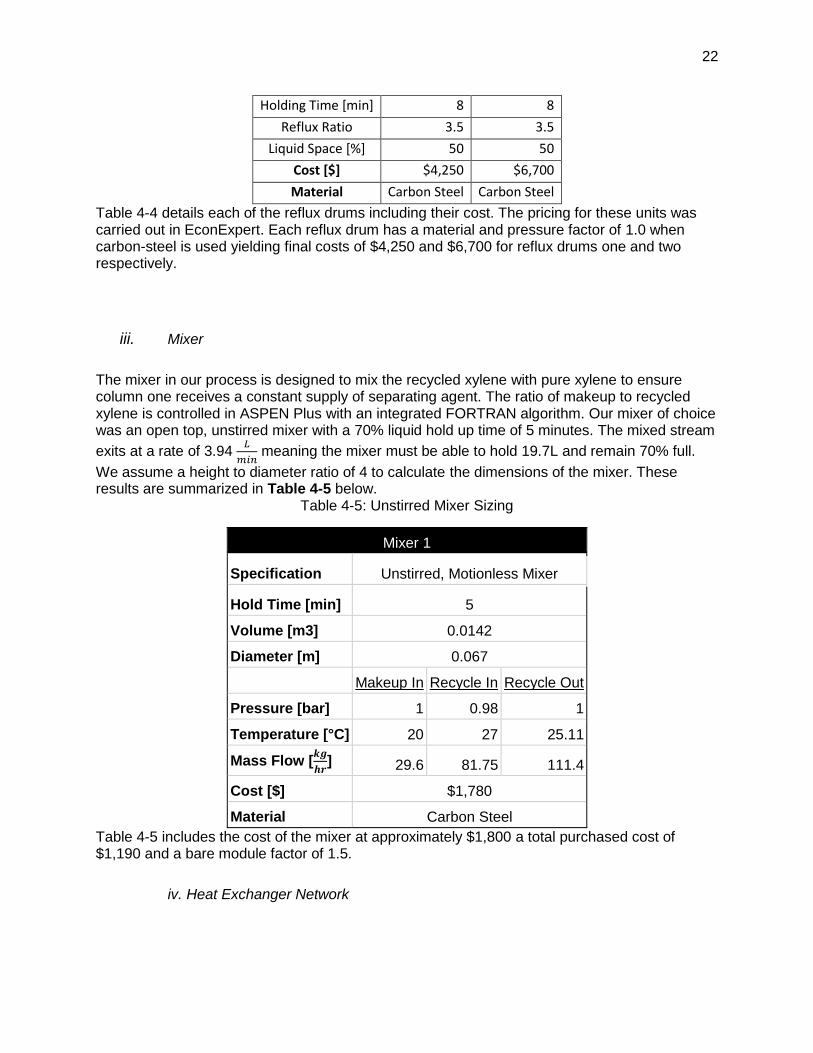
Table 4-4: Summary of Reflux Drum Sizing
Reflux Drum Sizing
Specification Drum 1 Drum 2
Diameter [m] 0.320 0.486
Length[m] 0.959 1.459
Volume [m^3] 0.2408 0.557
Flow Rate [l/min] 3.34 7.73
22
Holding Time [min] 8 8
Reflux Ratio 3.5 3.5
Liquid Space [%] 50 50
Cost [$] $4,250 $6,700
Material Carbon Steel Carbon Steel
Table 4-4 details each of the reflux drums including their cost. The pricing for these units was carried out in EconExpert. Each reflux drum has a material and pressure factor of 1.0 when carbon-steel is used yielding final costs of $4,250 and $6,700 for reflux drums one and two respectively.
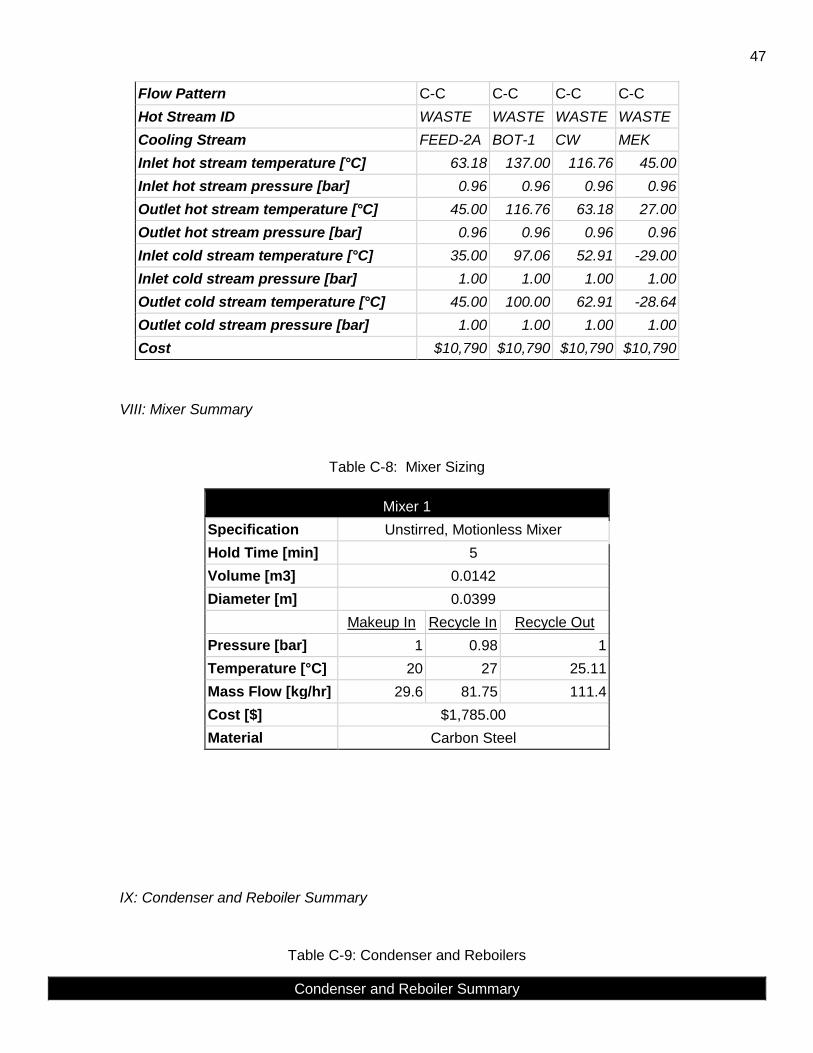
iii. Mixer
The mixer in our process is designed to mix the recycled xylene with pure xylene to ensure column one receives a constant supply of separating agent. The ratio of makeup to recycled xylene is controlled in ASPEN Plus with an integrated FORTRAN algorithm. Our mixer of choice was an open top, unstirred mixer with a 70% liquid hold up time of 5 minutes. The mixed stream
exits at a rate of 3.94 𝐿
𝑚𝑖𝑛 meaning the mixer must be able to hold 19.7L and remain 70% full.
We assume a height to diameter ratio of 4 to calculate the dimensions of the mixer. These results are summarized in Table 4-5 below.
Table 4-5: Unstirred Mixer Sizing
Mixer 1
Specification Unstirred, Motionless Mixer
Hold Time [min] 5
Volume [m3] 0.0142
Diameter [m] 0.067
Makeup In Recycle In Recycle Out
Pressure [bar] 1 0.98 1
Temperature [°C] 20 27 25.11
Mass Flow [𝒌𝒈
𝒉𝒓] 29.6 81.75 111.4
Cost [$] $1,780
Material Carbon Steel
Table 4-5 includes the cost of the mixer at approximately $1,800 a total purchased cost of $1,190 and a bare module factor of 1.5.
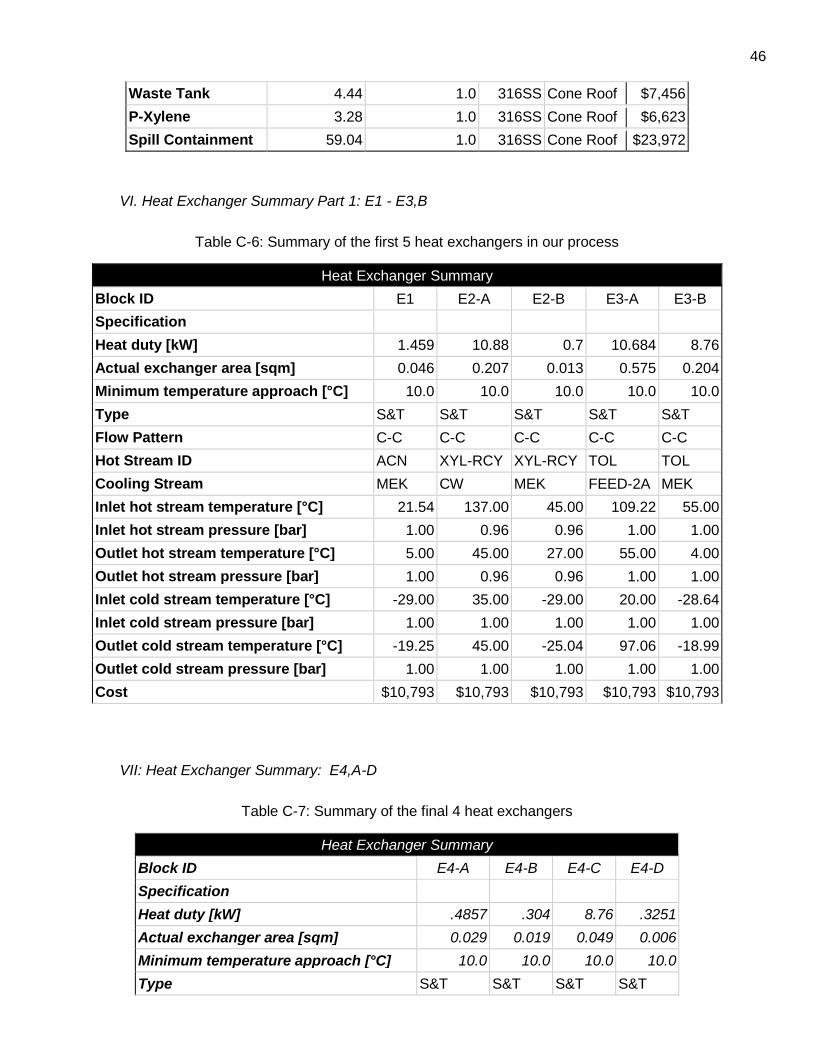
iv. Heat Exchanger Network
23
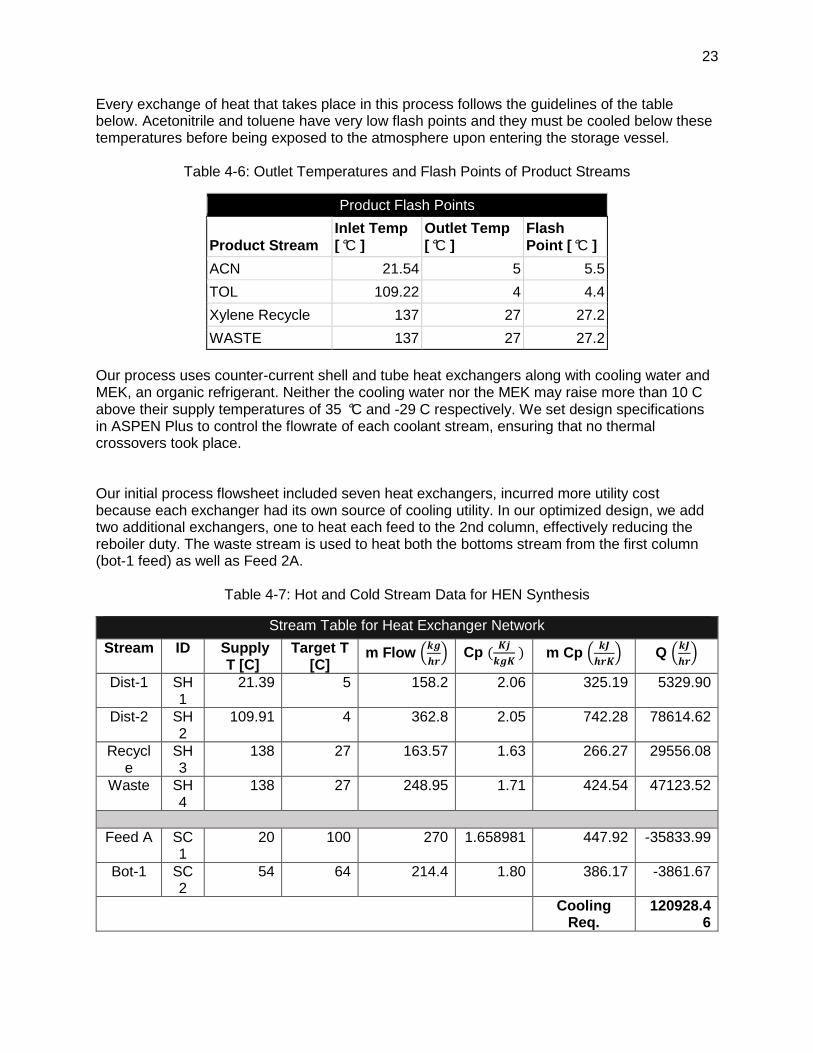
Every exchange of heat that takes place in this process follows the guidelines of the table below. Acetonitrile and toluene have very low flash points and they must be cooled below these temperatures before being exposed to the atmosphere upon entering the storage vessel.
Table 4-6: Outlet Temperatures and Flash Points of Product Streams
Product Flash Points
Product Stream
Inlet Temp
[°C ]
Outlet Temp
[°C ]
Flash
Point [°C ]
ACN 21.54 5 5.5
TOL 109.22 4 4.4
Xylene Recycle 137 27 27.2
WASTE 137 27 27.2
Our process uses counter-current shell and tube heat exchangers along with cooling water and MEK, an organic refrigerant. Neither the cooling water nor the MEK may raise more than 10 C above their supply temperatures of 35 °C and -29 C respectively. We set design specifications in ASPEN Plus to control the flowrate of each coolant stream, ensuring that no thermal crossovers took place. Our initial process flowsheet included seven heat exchangers, incurred more utility cost because each exchanger had its own source of cooling utility. In our optimized design, we add two additional exchangers, one to heat each feed to the 2nd column, effectively reducing the reboiler duty. The waste stream is used to heat both the bottoms stream from the first column (bot-1 feed) as well as Feed 2A.
Table 4-7: Hot and Cold Stream Data for HEN Synthesis
Stream Table for Heat Exchanger Network
Stream ID Supply T [C]
Target T [C]
m Flow (𝒌𝒈
𝒉𝒓) Cp (
𝑲𝒋
𝒌𝒈𝑲 ) m Cp (
𝒌𝑱
𝒉𝒓𝑲) Q (
𝒌𝑱
𝒉𝒓)
Dist-1 SH1
21.39 5 158.2 2.06 325.19 5329.90
Dist-2 SH2
109.91 4 362.8 2.05 742.28 78614.62
Recycle
SH3
138 27 163.57 1.63 266.27 29556.08
Waste SH4
138 27 248.95 1.71 424.54 47123.52
Feed A SC1
20 100 270 1.658981 447.92 -35833.99
Bot-1 SC2
54 64 214.4 1.80 386.17 -3861.67
Cooling Req.
120928.46
24
Table 4-7 shows the supply and target temperatures of each stream integrated in our heat exchanger network. Our integrated network reduces the cooling required in the system by using the Feed A and Bot-1 to remove 40MJ/hr from the hot streams. This value is determined by summing the total cooling provided by streams SC1 and SC2. It is impossible to cool SH1 with any process stream without violating minimum approach temperatures. A simplified version of our heat exchanger network is shown below in Figure 4-1.
Figure 4-1: This figure depicts our simplified heat exchanger network. The inlet and outlet
temperatures of each stream are displayed in Table 4-7. The cooling utilities, CW and MEK, are available at temperature rages of [35°𝐶 𝑡𝑜 45°𝐶] and [−29°𝐶 𝑡𝑜 − 19°𝐶] respectively.
After completing the HEN we verify our results by comparing the heat duties of the reboilers and condensers after heat integration. These results are outlined in table 4-8 below.
Table 4-8: Reboiler and Condenser Heat Duty Comparison
The toluene column experienced the largest benefit from the heat integration process, reducing the heat duty approximately 40 kW. Specific information about each heat exchanger is located in Appendix C.
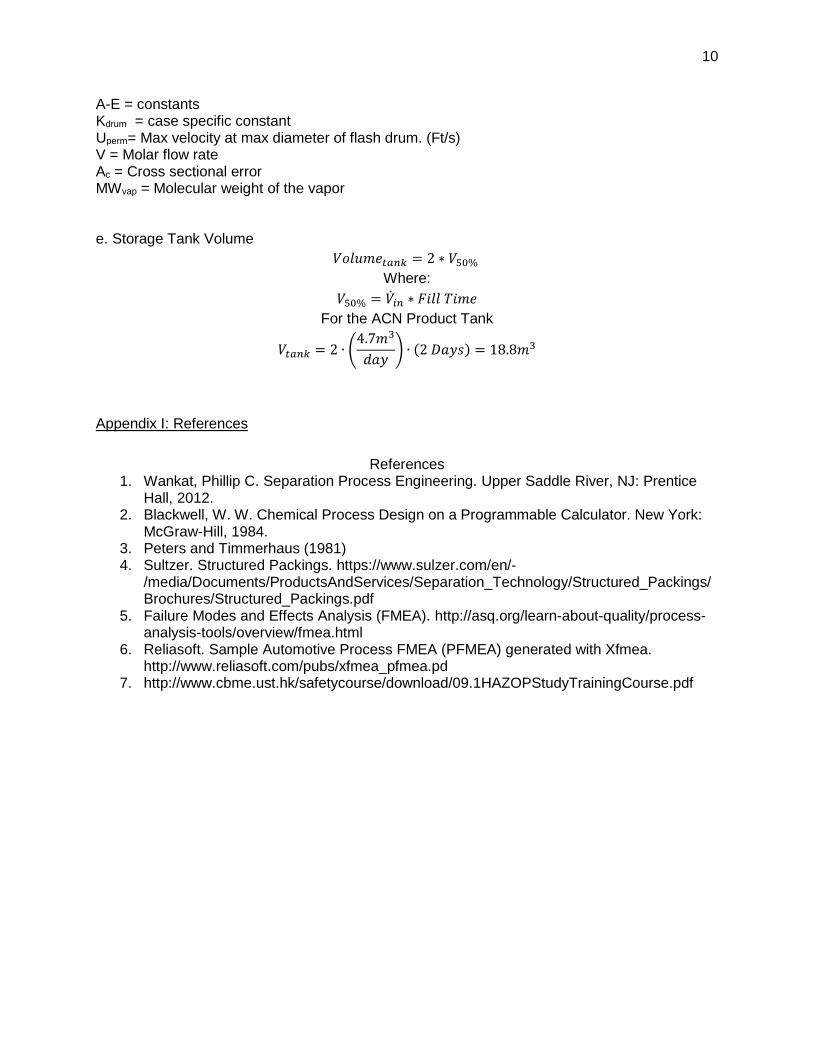
v. Storage Tanks
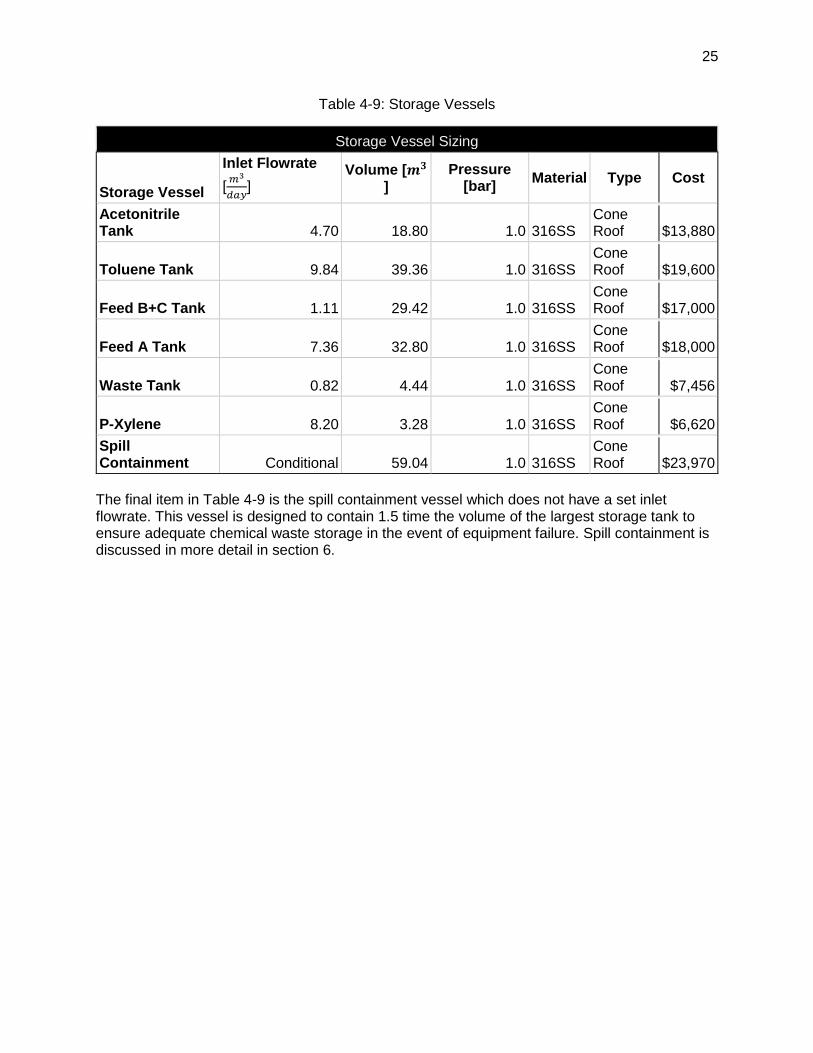
The cost and size of a storage vessel is directly related to the inlet flowrate, and the desired fill time. Our tanks are designed to reach 50% of their maximum volume after 48 hours of continuous production. To calculate the required volume, we simply multiply the hourly inlet flowrate by 96 hrs to acquire the volume at max capacity.
25
Table 4-9: Storage Vessels
Storage Vessel Sizing
Storage Vessel
Inlet Flowrate
[𝑚3
𝑑𝑎𝑦]
Volume [𝒎𝟑 ]
Pressure [bar]
Material Type Cost
Acetonitrile Tank 4.70 18.80 1.0 316SS
Cone Roof $13,880
Toluene Tank 9.84 39.36 1.0 316SS Cone Roof $19,600
Feed B+C Tank 1.11 29.42 1.0 316SS Cone Roof $17,000
Feed A Tank 7.36 32.80 1.0 316SS Cone Roof $18,000
Waste Tank 0.82 4.44 1.0 316SS Cone Roof $7,456
P-Xylene 8.20 3.28 1.0 316SS Cone Roof $6,620
Spill Containment Conditional 59.04 1.0 316SS
Cone Roof $23,970
The final item in Table 4-9 is the spill containment vessel which does not have a set inlet flowrate. This vessel is designed to contain 1.5 time the volume of the largest storage tank to ensure adequate chemical waste storage in the event of equipment failure. Spill containment is discussed in more detail in section 6.
26
5. Process Economics
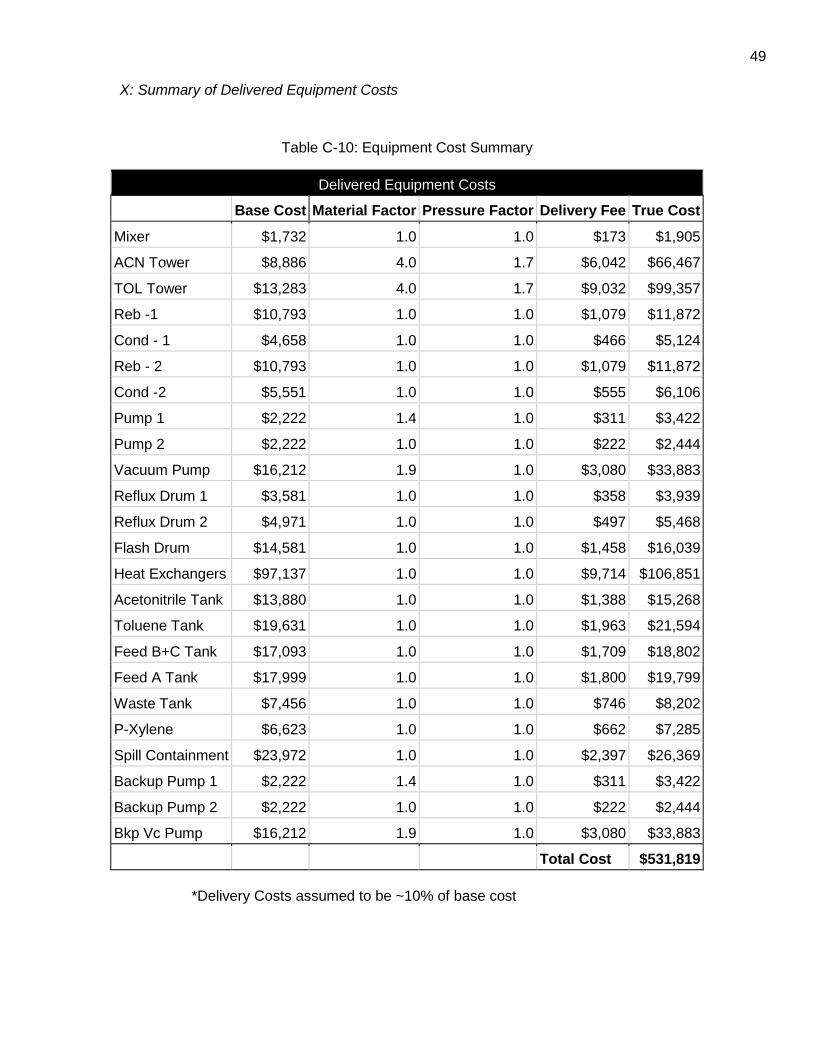
i. Delivered Equipment Cos
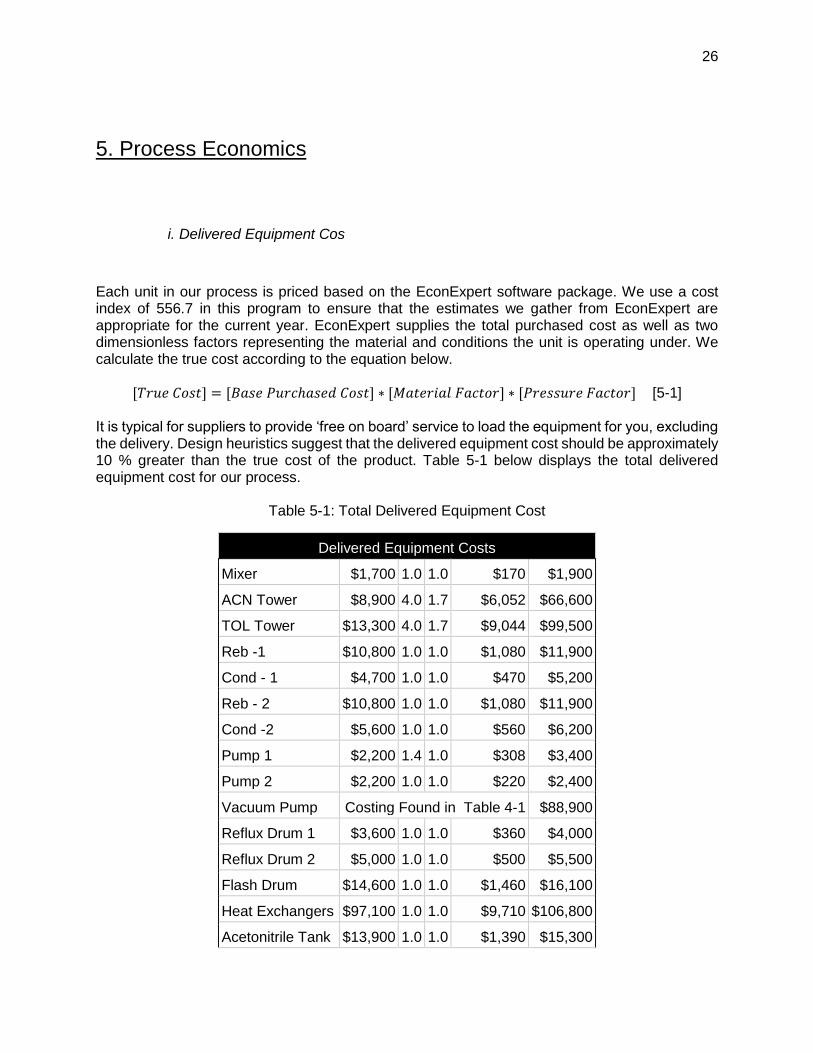
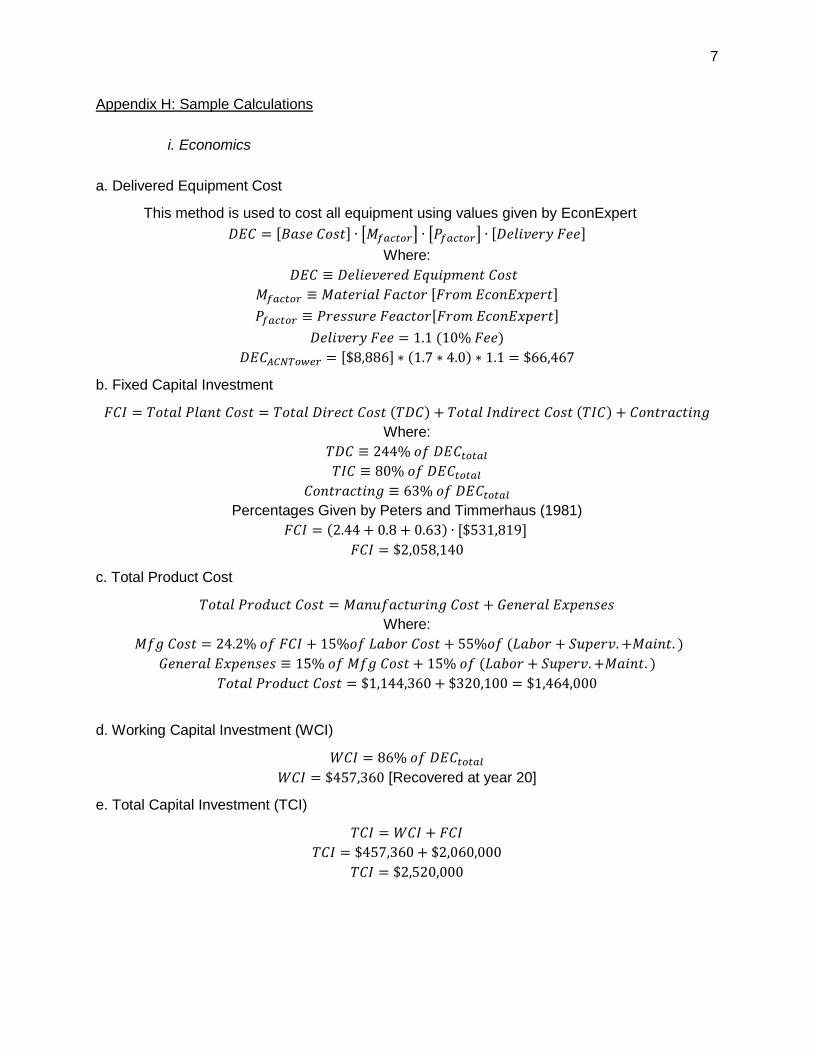
Each unit in our process is priced based on the EconExpert software package. We use a cost index of 556.7 in this program to ensure that the estimates we gather from EconExpert are appropriate for the current year. EconExpert supplies the total purchased cost as well as two dimensionless factors representing the material and conditions the unit is operating under. We calculate the true cost according to the equation below.
[𝑇𝑟𝑢𝑒 𝐶𝑜𝑠𝑡] = [𝐵𝑎𝑠𝑒 𝑃𝑢𝑟𝑐ℎ𝑎𝑠𝑒𝑑 𝐶𝑜𝑠𝑡] ∗ [𝑀𝑎𝑡𝑒𝑟𝑖𝑎𝑙 𝐹𝑎𝑐𝑡𝑜𝑟] ∗ [𝑃𝑟𝑒𝑠𝑠𝑢𝑟𝑒 𝐹𝑎𝑐𝑡𝑜𝑟] [5-1] It is typical for suppliers to provide ‘free on board’ service to load the equipment for you, excluding the delivery. Design heuristics suggest that the delivered equipment cost should be approximately 10 % greater than the true cost of the product. Table 5-1 below displays the total delivered equipment cost for our process.
Table 5-1: Total Delivered Equipment Cost
Delivered Equipment Costs
Mixer $1,700 1.0 1.0 $170 $1,900
ACN Tower $8,900 4.0 1.7 $6,052 $66,600
TOL Tower $13,300 4.0 1.7 $9,044 $99,500
Reb -1 $10,800 1.0 1.0 $1,080 $11,900
Cond - 1 $4,700 1.0 1.0 $470 $5,200
Reb - 2 $10,800 1.0 1.0 $1,080 $11,900
Cond -2 $5,600 1.0 1.0 $560 $6,200
Pump 1 $2,200 1.4 1.0 $308 $3,400
Pump 2 $2,200 1.0 1.0 $220 $2,400
Vacuum Pump Costing Found in Table 4-1 $88,900
Reflux Drum 1 $3,600 1.0 1.0 $360 $4,000
Reflux Drum 2 $5,000 1.0 1.0 $500 $5,500
Flash Drum $14,600 1.0 1.0 $1,460 $16,100
Heat Exchangers $97,100 1.0 1.0 $9,710 $106,800
Acetonitrile Tank $13,900 1.0 1.0 $1,390 $15,300
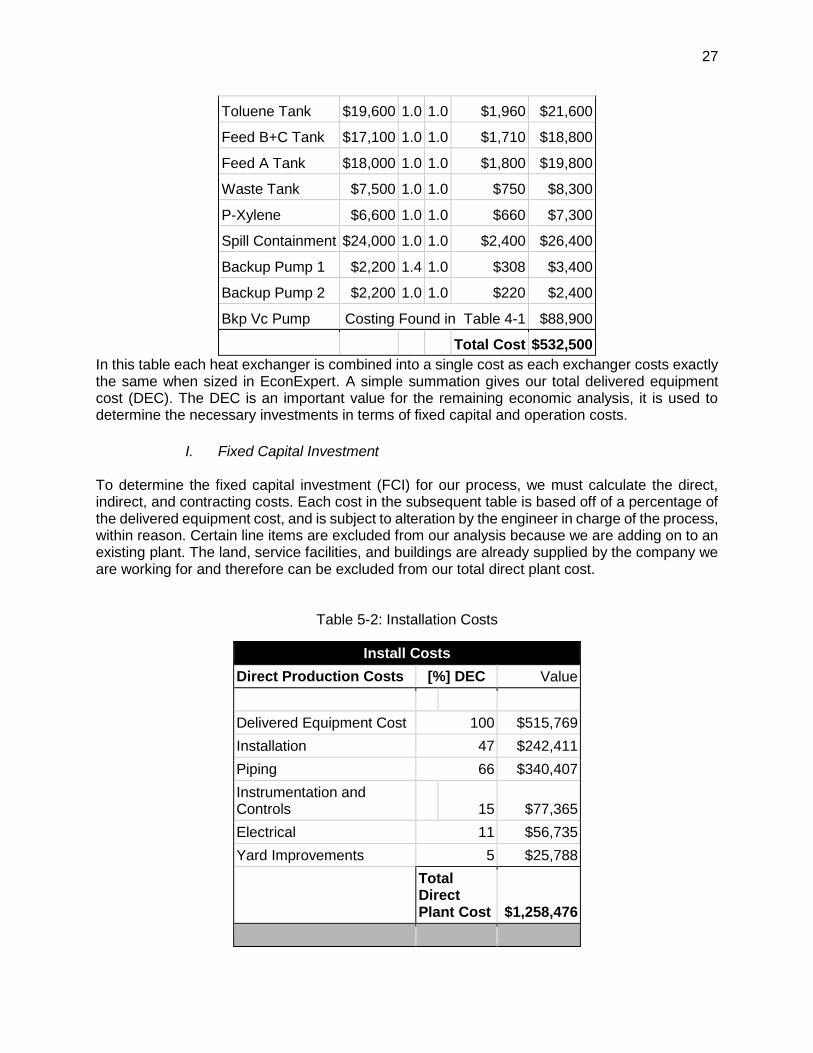
27
Toluene Tank $19,600 1.0 1.0 $1,960 $21,600
Feed B+C Tank $17,100 1.0 1.0 $1,710 $18,800
Feed A Tank $18,000 1.0 1.0 $1,800 $19,800
Waste Tank $7,500 1.0 1.0 $750 $8,300
P-Xylene $6,600 1.0 1.0 $660 $7,300
Spill Containment $24,000 1.0 1.0 $2,400 $26,400
Backup Pump 1 $2,200 1.4 1.0 $308 $3,400
Backup Pump 2 $2,200 1.0 1.0 $220 $2,400
Bkp Vc Pump Costing Found in Table 4-1 $88,900
Total Cost $532,500
In this table each heat exchanger is combined into a single cost as each exchanger costs exactly the same when sized in EconExpert. A simple summation gives our total delivered equipment cost (DEC). The DEC is an important value for the remaining economic analysis, it is used to determine the necessary investments in terms of fixed capital and operation costs.
I. Fixed Capital Investment To determine the fixed capital investment (FCI) for our process, we must calculate the direct, indirect, and contracting costs. Each cost in the subsequent table is based off of a percentage of the delivered equipment cost, and is subject to alteration by the engineer in charge of the process, within reason. Certain line items are excluded from our analysis because we are adding on to an existing plant. The land, service facilities, and buildings are already supplied by the company we are working for and therefore can be excluded from our total direct plant cost.
Table 5-2: Installation Costs
Install Costs
Direct Production Costs [%] DEC Value
Delivered Equipment Cost 100 $515,769
Installation 47 $242,411
Piping 66 $340,407
Instrumentation and Controls 15 $77,365
Electrical 11 $56,735
Yard Improvements 5 $25,788
Total Direct Plant Cost $1,258,476
28
Indirect Costs [%] DEC Value
Engineering Supervision 35 $180,519
Construction Expenses 45 $232,096
Total Indirect $412,615
Other [%] DEC Value
Contractor's Fee 21 $108,311
Contingency 42 $216,623
Total Other $324,934
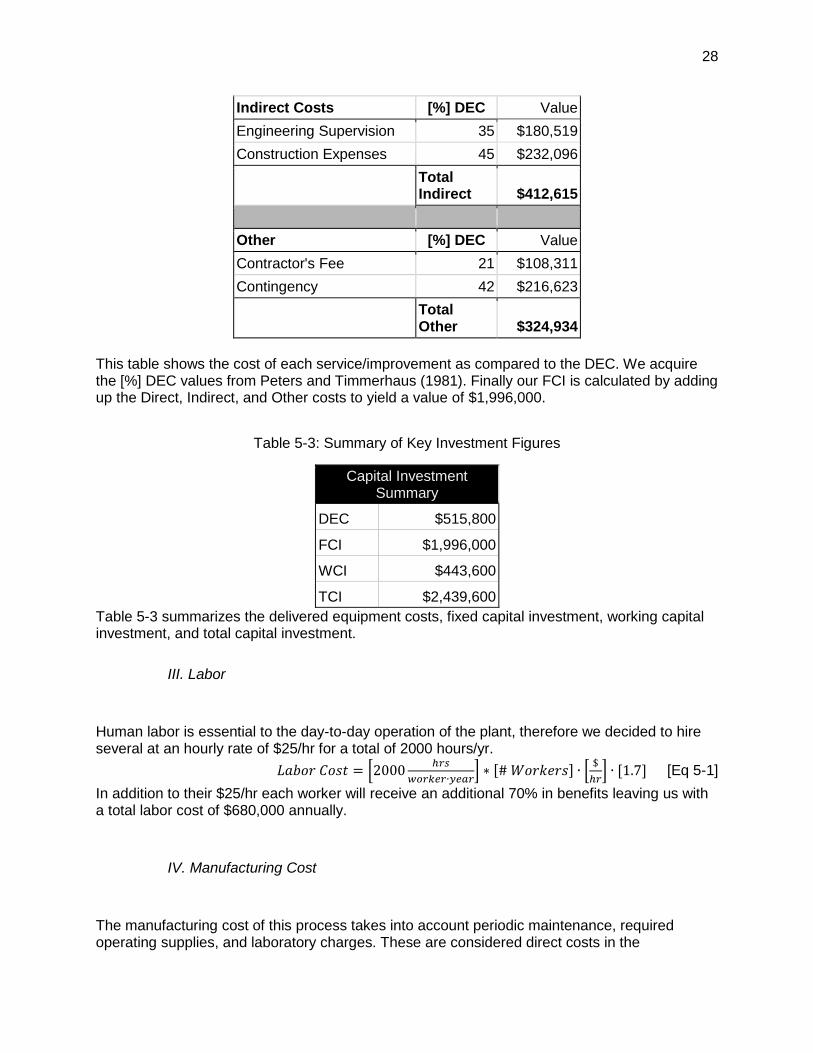
This table shows the cost of each service/improvement as compared to the DEC. We acquire the [%] DEC values from Peters and Timmerhaus (1981). Finally our FCI is calculated by adding up the Direct, Indirect, and Other costs to yield a value of $1,996,000.
Table 5-3: Summary of Key Investment Figures
Capital Investment Summary
DEC $515,800
FCI $1,996,000
WCI $443,600
TCI $2,439,600
Table 5-3 summarizes the delivered equipment costs, fixed capital investment, working capital investment, and total capital investment.
III. Labor
Human labor is essential to the day-to-day operation of the plant, therefore we decided to hire several at an hourly rate of $25/hr for a total of 2000 hours/yr.
𝐿𝑎𝑏𝑜𝑟 𝐶𝑜𝑠𝑡 = [2000ℎ𝑟𝑠
𝑤𝑜𝑟𝑘𝑒𝑟∙𝑦𝑒𝑎𝑟] ∗ [# 𝑊𝑜𝑟𝑘𝑒𝑟𝑠] ∙ [
$
ℎ𝑟] ∙ [1.7] [Eq 5-1]
In addition to their $25/hr each worker will receive an additional 70% in benefits leaving us with a total labor cost of $680,000 annually.
IV. Manufacturing Cost
The manufacturing cost of this process takes into account periodic maintenance, required operating supplies, and laboratory charges. These are considered direct costs in the
29
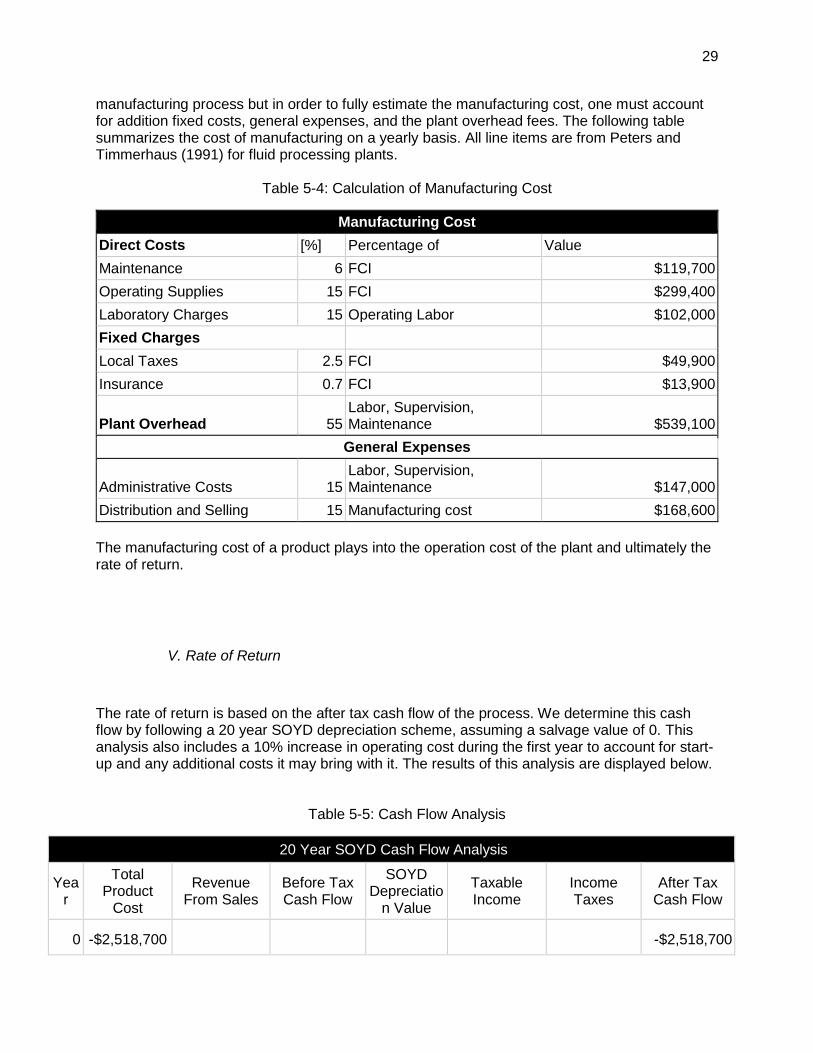
manufacturing process but in order to fully estimate the manufacturing cost, one must account for addition fixed costs, general expenses, and the plant overhead fees. The following table summarizes the cost of manufacturing on a yearly basis. All line items are from Peters and Timmerhaus (1991) for fluid processing plants.
Distribution and Selling 15 Manufacturing cost $168,600
The manufacturing cost of a product plays into the operation cost of the plant and ultimately the rate of return.
V. Rate of Return
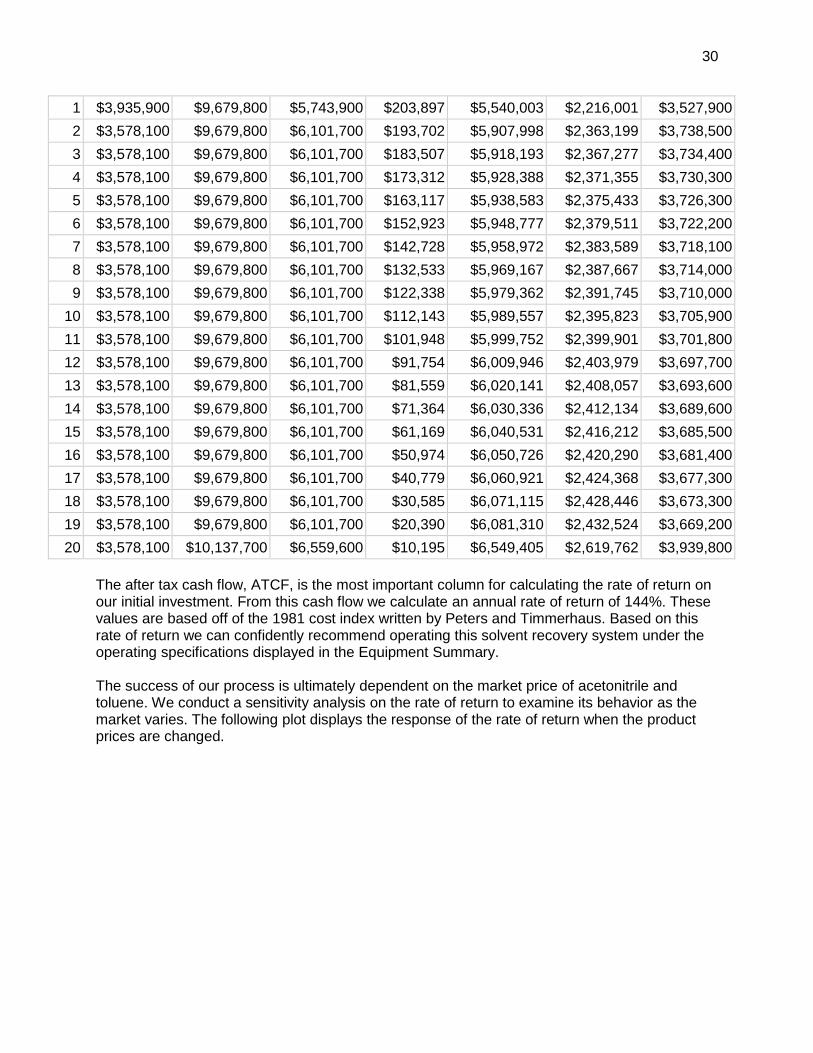
The rate of return is based on the after tax cash flow of the process. We determine this cash flow by following a 20 year SOYD depreciation scheme, assuming a salvage value of 0. This analysis also includes a 10% increase in operating cost during the first year to account for start-up and any additional costs it may bring with it. The results of this analysis are displayed below.
The after tax cash flow, ATCF, is the most important column for calculating the rate of return on our initial investment. From this cash flow we calculate an annual rate of return of 144%. These values are based off of the 1981 cost index written by Peters and Timmerhaus. Based on this rate of return we can confidently recommend operating this solvent recovery system under the operating specifications displayed in the Equipment Summary. The success of our process is ultimately dependent on the market price of acetonitrile and toluene. We conduct a sensitivity analysis on the rate of return to examine its behavior as the market varies. The following plot displays the response of the rate of return when the product prices are changed.
31
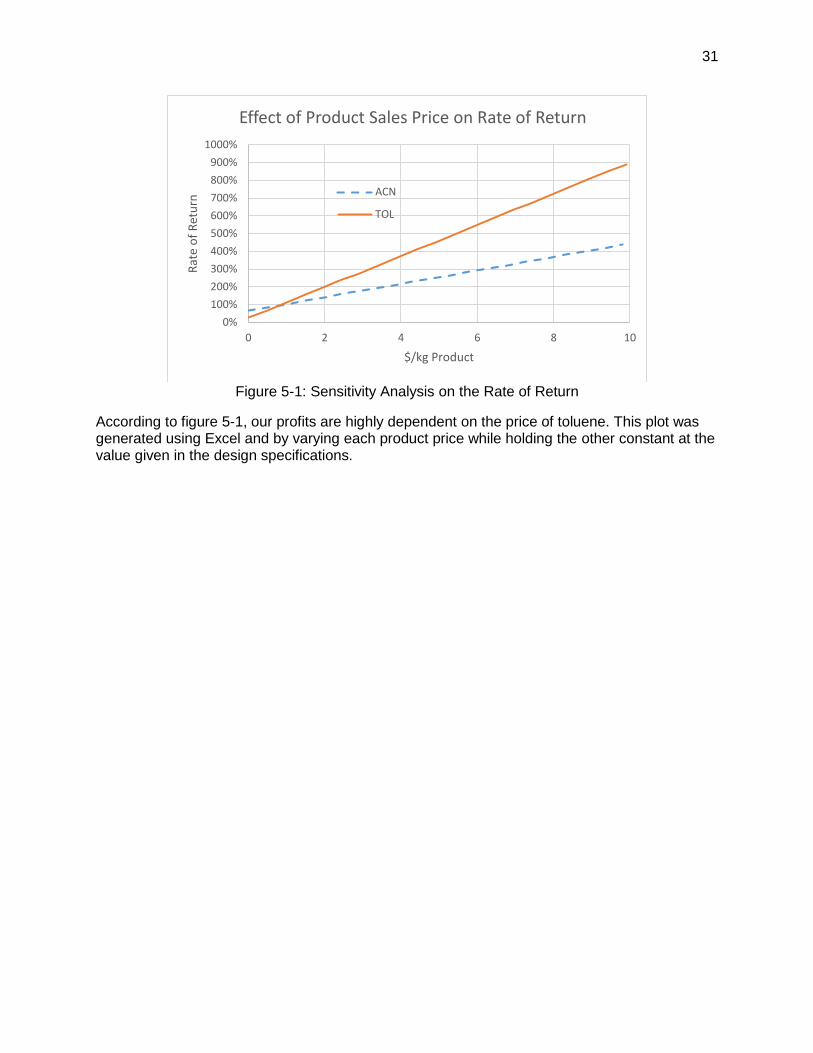
Figure 5-1: Sensitivity Analysis on the Rate of Return
According to figure 5-1, our profits are highly dependent on the price of toluene. This plot was generated using Excel and by varying each product price while holding the other constant at the value given in the design specifications.
0%
100%
200%
300%
400%
500%
600%
700%
800%
900%
1000%
0 2 4 6 8 10
Rat
e o
f R
etu
rn
$/kg Product
Effect of Product Sales Price on Rate of Return
ACN
TOL
32
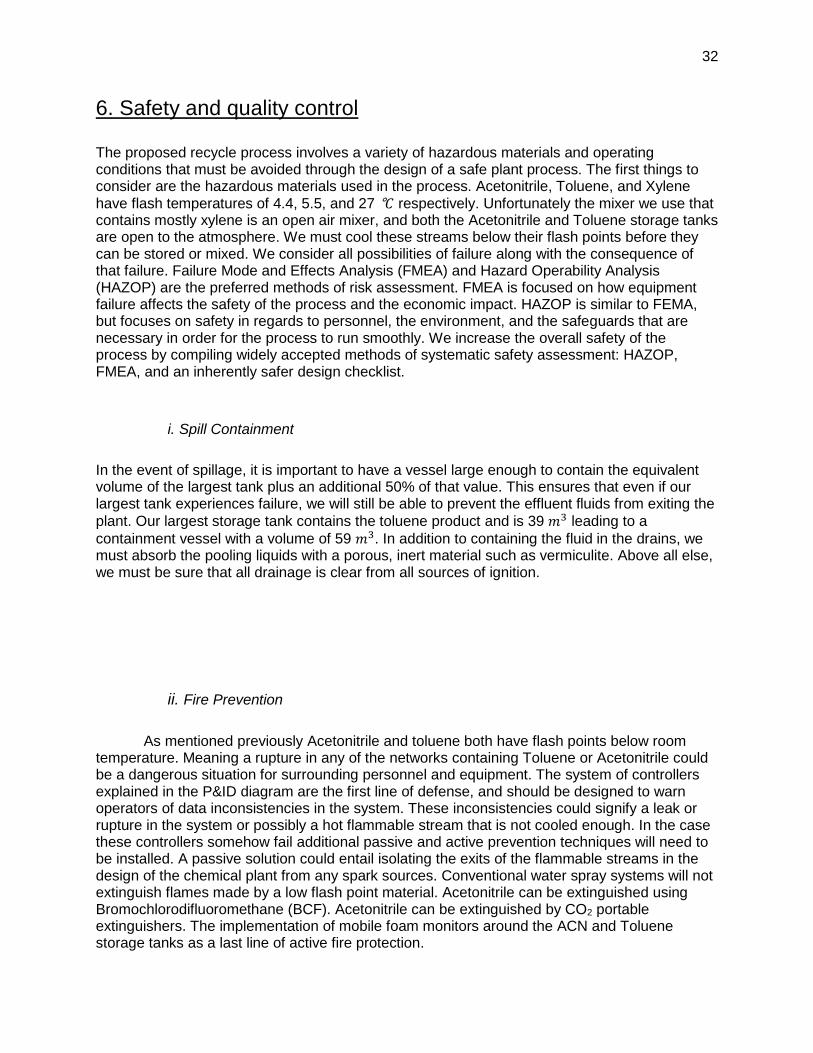
6. Safety and quality control
The proposed recycle process involves a variety of hazardous materials and operating conditions that must be avoided through the design of a safe plant process. The first things to consider are the hazardous materials used in the process. Acetonitrile, Toluene, and Xylene
have flash temperatures of 4.4, 5.5, and 27 °𝐶 respectively. Unfortunately the mixer we use that contains mostly xylene is an open air mixer, and both the Acetonitrile and Toluene storage tanks are open to the atmosphere. We must cool these streams below their flash points before they can be stored or mixed. We consider all possibilities of failure along with the consequence of that failure. Failure Mode and Effects Analysis (FMEA) and Hazard Operability Analysis (HAZOP) are the preferred methods of risk assessment. FMEA is focused on how equipment failure affects the safety of the process and the economic impact. HAZOP is similar to FEMA, but focuses on safety in regards to personnel, the environment, and the safeguards that are necessary in order for the process to run smoothly. We increase the overall safety of the process by compiling widely accepted methods of systematic safety assessment: HAZOP, FMEA, and an inherently safer design checklist.
i. Spill Containment
In the event of spillage, it is important to have a vessel large enough to contain the equivalent volume of the largest tank plus an additional 50% of that value. This ensures that even if our largest tank experiences failure, we will still be able to prevent the effluent fluids from exiting the
plant. Our largest storage tank contains the toluene product and is 39 𝑚3 leading to a
containment vessel with a volume of 59 𝑚3. In addition to containing the fluid in the drains, we must absorb the pooling liquids with a porous, inert material such as vermiculite. Above all else, we must be sure that all drainage is clear from all sources of ignition.
ii. Fire Prevention
As mentioned previously Acetonitrile and toluene both have flash points below room temperature. Meaning a rupture in any of the networks containing Toluene or Acetonitrile could be a dangerous situation for surrounding personnel and equipment. The system of controllers explained in the P&ID diagram are the first line of defense, and should be designed to warn operators of data inconsistencies in the system. These inconsistencies could signify a leak or rupture in the system or possibly a hot flammable stream that is not cooled enough. In the case these controllers somehow fail additional passive and active prevention techniques will need to be installed. A passive solution could entail isolating the exits of the flammable streams in the design of the chemical plant from any spark sources. Conventional water spray systems will not extinguish flames made by a low flash point material. Acetonitrile can be extinguished using Bromochlorodifluoromethane (BCF). Acetonitrile can be extinguished by CO2 portable extinguishers. The implementation of mobile foam monitors around the ACN and Toluene storage tanks as a last line of active fire protection.
33
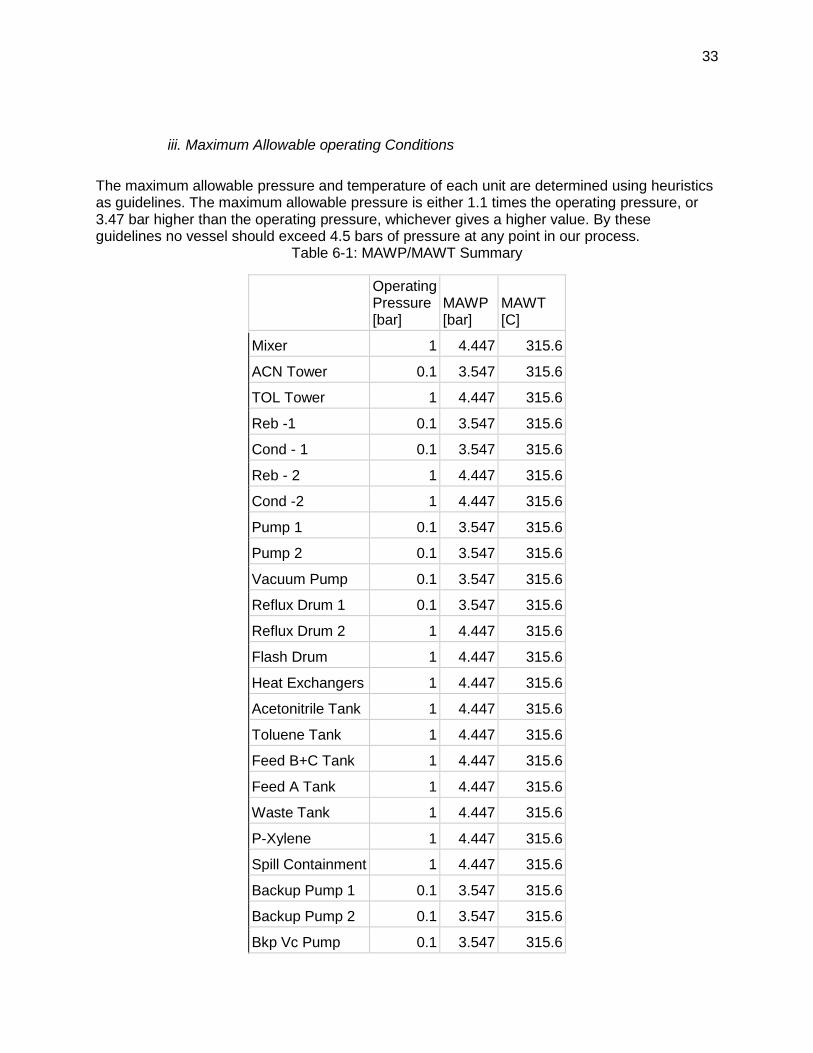
iii. Maximum Allowable operating Conditions
The maximum allowable pressure and temperature of each unit are determined using heuristics as guidelines. The maximum allowable pressure is either 1.1 times the operating pressure, or 3.47 bar higher than the operating pressure, whichever gives a higher value. By these guidelines no vessel should exceed 4.5 bars of pressure at any point in our process.
Table 6-1: MAWP/MAWT Summary
Operating Pressure [bar]
MAWP [bar]
MAWT [C]
Mixer 1 4.447 315.6
ACN Tower 0.1 3.547 315.6
TOL Tower 1 4.447 315.6
Reb -1 0.1 3.547 315.6
Cond - 1 0.1 3.547 315.6
Reb - 2 1 4.447 315.6
Cond -2 1 4.447 315.6
Pump 1 0.1 3.547 315.6
Pump 2 0.1 3.547 315.6
Vacuum Pump 0.1 3.547 315.6
Reflux Drum 1 0.1 3.547 315.6
Reflux Drum 2 1 4.447 315.6
Flash Drum 1 4.447 315.6
Heat Exchangers 1 4.447 315.6
Acetonitrile Tank 1 4.447 315.6
Toluene Tank 1 4.447 315.6
Feed B+C Tank 1 4.447 315.6
Feed A Tank 1 4.447 315.6
Waste Tank 1 4.447 315.6
P-Xylene 1 4.447 315.6
Spill Containment 1 4.447 315.6
Backup Pump 1 0.1 3.547 315.6
Backup Pump 2 0.1 3.547 315.6
Bkp Vc Pump 0.1 3.547 315.6
34
Table 6-1 above displays the maximum limits for each unit. The maximum temperature for each
unit is the same because no unit exceed the limit of 315.6 C given by the design heuristic. The
MAWP is very important to plant safety. The understanding of this limit helps reduce the chance
of explosion due to overpressure.
iv. HAZOP
List of chemicals involved in the proposed process are as follows:
Acetonitrile (ACN)
MethylEthylKetone (MEK)
Siloxane
Toluene
Water
P-Xylene
Potential Hazards: Three of the main components that are being separated, Toluene, Acetonitrile, and p-Xylene, are exposed to temperatures above their flash points during the recycling process. Separation processes are also innately are run at high temperatures, relative to room temperature, to ensure sharp separations. Two of these components, Toluene and Acetonitrile have flash points of 5 and 4 °C respectively which are well below room temperature. Analysis Boundaries:
1. Incidents that occur during the repair or maintenance process are not included. 2. Feeds enter the recycle process directly from the siloxane polymerization plant at a set
steady flow rate that is closed from the atmosphere. 3. Cooling water and MEK flow rates are driven by gravity, and tuned using a control valve. 4. Stead-state operation 5. Equipment is well built and use as designed 6. Operators are properly trained 7. Procedures are clearly written 8. Maintenance and inspections are performed routinely
Analysis Results: Strict enforcement of MSDS approved PPE, proper and relevant operator training as well as an emphasis on workplace safety. Any stream containing a material above its flash point must have temperature sensors as well as a pressure or a flow rate sensor to ensure there is no leak. Streams around heat exchangers should also be equipped with temperature and flow sensors to ensure there is no cross flow and the correct amount of heat is being exchanged. Extensive tables for the HAZOP analysis are located in Appendix –D
v. Personal Protective Equipment
The safety data sheets described above outline the PPE requirements for all personnel who could potentially come in contact with hazardous materials. To ensure proper operator safety we require that gloves, insulated boots, full body suits, and safety glasses must be worn at all times. In the event that an operator must handle the materials directly, they are required to adorn addition protective equipment such as a self-contained respirator or breathing apparatus
35
Acetonitrile
Acetonitrile is highly flammable in its vapor state, and is flammable under room temperature at atmospheric pressure. Acetonitrile may also cause serious eye and skin irritation as well as toxic effects when inhaled or ingested. The use of personal protective equipment such as safety glasses, breathing apparatus, gloves, and lab coats should be required. If personnel’s eyes come in contact, rinse out eye for at least 15 minutes. If personnel’s skin comes in contact with Acetonitrile wash the afflicted area with soap and water for at least 15 minutes. In the case of serious inhalation evacuate the afflicted personnel to a safe area with haste. Loosen any tight clothing collar, tie, belt or waistband. If breathing is difficult, administer oxygen. If the victim is not breathing, preform CPR (WARNING: It may be hazardous to the person providing aid to give mouth-to-mouth resuscitation when the inhaled material is toxic, In this case use a bag valve mask). In case of ingestion do not induce vomiting unless directed to do so by a medical professional. Never give anything by mouth to an unconscious person. Loosen any tight clothing and get medical attention if any symptoms appear. The storage of acetonitrile must be in a tight ventilated container that is isolated from any heat or spark sources. In case of spill avoid contamination into the environment, and upgrade the level of personal protective equipment to a full body suit, self-contained breathing apparatus, vapor respirator, boots, and gloves. Provide exhaust ventilation or other engineering controls to keep the airborne concentrations of vapors below their respective threshold limit value. Ensure that eyewash stations and safety showers are proximal to the work-station location. Toluene Toluene is highly flammable as a vapor, hazardous to aquatic life, a skin irritant, can incur serious eye and organ damage, and may cause death if inhaled. Personal protective equipment such as a breathing apparatus, gloves, and eyewear should be required in operations involving toluene. If skin comes in contact with toluene the MSDS procedure states to wash the affected area with soap and water for at least 20 minutes. If personnel’s eyes come in contact, rinse out eye for at least 15 minutes, and seek medical attention immediately. In the case of serious inhalation evacuate the afflicted personnel to a safe area with haste. Loosen any tight clothing collar, tie, belt or waistband. If breathing is difficult, administer oxygen. If the victim is not breathing, preform CPR (WARNING: It may be hazardous to the person providing aid to give mouth-to-mouth resuscitation when the inhaled material is toxic, In this case use a bag valve mask). In case of ingestion do not induce vomiting unless directed to do so by a medical professional. Never give anything by mouth to an unconscious person. Loosen any tight clothing and get medical attention if any symptoms appear. Toluene needs to be stored in a sealed, well ventilated storage vessel that is isolated from any ignition sources. Drains and surface water must be protected from potential spills to avoid contamination. In case of spill avoid contamination into the environment, and upgrade the level of personal protective equipment to a full body suit, self-contained breathing apparatus, vapor respirator, boots, and gloves. Non sparking materials must be used in the cleanup of toluene. Provide exhaust ventilation or other engineering controls to keep the airborne concentrations of
36
vapors below their respective threshold limit value. Ensure that eyewash stations and safety showers are proximal to the work-station location. P-Xylene The MSDS lists p-xylene as a flammable liquid and vapor, hazardous to aquatic life, and harmful when in contact with skin and eyes, and has a toxicity when inhaled or ingested. In case of contact with eyes flush with plenty of water for at least 15 minutes and seek medical attention if serious irritation persists. In the case of skin contact flush the afflicted area with an excess of water. Cover skin with an emollient, and remove any contaminated clothing and shoes. Thoroughly wash clothing and shoes before reuse. In the case of serious inhalation evacuate the afflicted personnel to a safe area with haste. Loosen any tight clothing collar, tie, belt or waistband. If breathing is difficult, administer oxygen. If the victim is not breathing, preform CPR (WARNING: It may be hazardous to the person providing aid to give mouth-to-mouth resuscitation when the inhaled material is toxic, In this case use a bag valve mask). In case of ingestion do not induce vomiting unless directed to do so by a medical professional. Never give anything by mouth to an unconscious person. Loosen any tight clothing and get medical attention if any symptoms appear. P-Xylene should be stored in a sealed, well ventilated storage vessel that is isolated from any ignition sources. Drains and surface water must be protected from potential spills to avoid contamination. In case of spill avoid contamination into the environment, and upgrade the level of personal protective equipment to a full body suit, self-contained breathing apparatus, vapor respirator, boots, and gloves. Non sparking materials must be used in the cleanup of p-xylene. Provide exhaust ventilation or other engineering controls to keep the airborne concentrations of vapors below their respective threshold limit value. Ensure that eyewash stations and safety showers are proximal to the work-station location
7. Conclusion
The recovery of solvents, toluene and acetonitrile, from a polymerization plant is best carried out using two distillation towers and one flash drum. Our process utilizes the packed columns to separate out the solvents independently while the flash drum separates the waste from recycled separating agent. The results from or HAZOP and FMEA analyses allow us to confidently present a safe design for the solvent recovery. Not only is our process efficient, it also generates a large savings value. Our process generates a 144% rate of return on a total investment of $2.52 million with an annual after tax cash flow of approximately $3.7 million. Sensitivity analysis on the rate of return determined that our process will remain profitable as long as the pure component prices remain above $1 per kilogram. If further adjustments were to be made to our design, we would recommend integration of the column one feed into our heat exchanger network. Thank you for the opportunity to work on this design project, feel free to contact us with any question or concerns you may have.
Base Cost Material Factor Pressure Factor Delivery Fee True Cost
Mixer $1,732 1.0 1.0 $173 $1,905
ACN Tower $8,886 4.0 1.7 $6,042 $66,467
TOL Tower $13,283 4.0 1.7 $9,032 $99,357
Reb -1 $10,793 1.0 1.0 $1,079 $11,872
Cond - 1 $4,658 1.0 1.0 $466 $5,124
Reb - 2 $10,793 1.0 1.0 $1,079 $11,872
Cond -2 $5,551 1.0 1.0 $555 $6,106
Pump 1 $2,222 1.4 1.0 $311 $3,422
Pump 2 $2,222 1.0 1.0 $222 $2,444
Vacuum Pump $16,212 1.9 1.0 $3,080 $33,883
Reflux Drum 1 $3,581 1.0 1.0 $358 $3,939
Reflux Drum 2 $4,971 1.0 1.0 $497 $5,468
Flash Drum $14,581 1.0 1.0 $1,458 $16,039
Heat Exchangers $97,137 1.0 1.0 $9,714 $106,851
Acetonitrile Tank $13,880 1.0 1.0 $1,388 $15,268
Toluene Tank $19,631 1.0 1.0 $1,963 $21,594
Feed B+C Tank $17,093 1.0 1.0 $1,709 $18,802
Feed A Tank $17,999 1.0 1.0 $1,800 $19,799
Waste Tank $7,456 1.0 1.0 $746 $8,202
P-Xylene $6,623 1.0 1.0 $662 $7,285
Spill Containment $23,972 1.0 1.0 $2,397 $26,369
Backup Pump 1 $2,222 1.4 1.0 $311 $3,422
Backup Pump 2 $2,222 1.0 1.0 $222 $2,444
Bkp Vc Pump $16,212 1.9 1.0 $3,080 $33,883
Total Cost $531,819
*Delivery Costs assumed to be ~10% of base cost
50
Appendix D: FMEA Summary
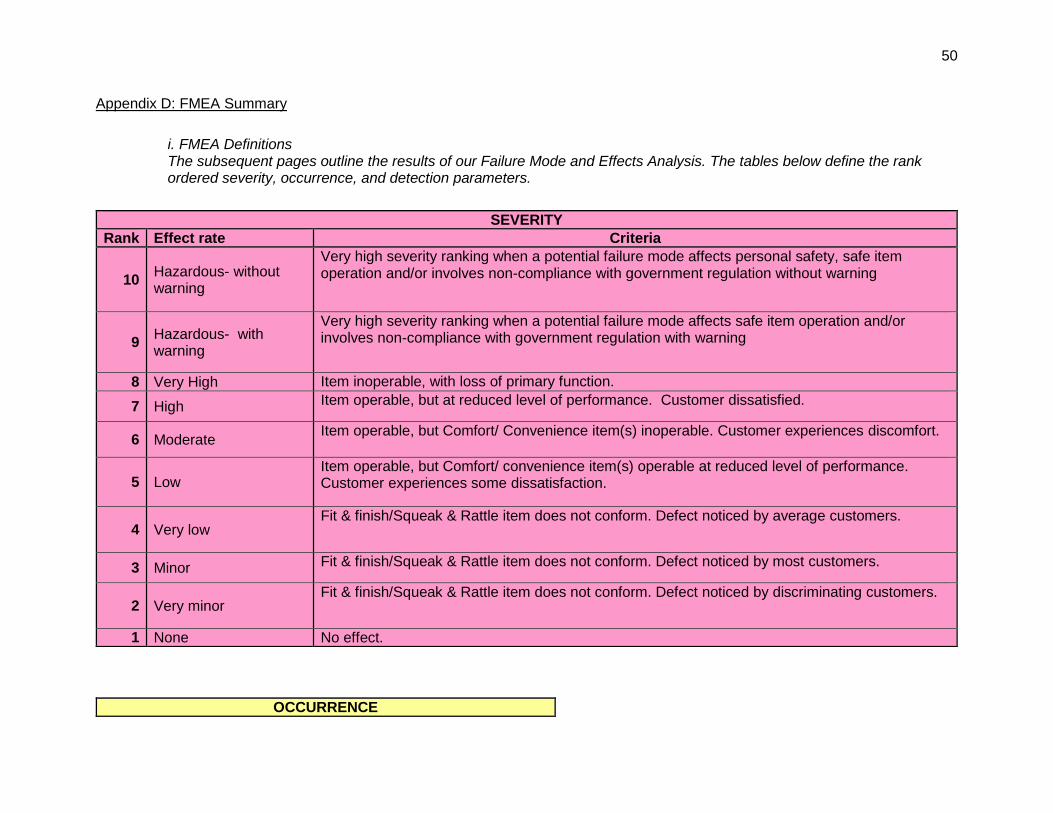
i. FMEA Definitions The subsequent pages outline the results of our Failure Mode and Effects Analysis. The tables below define the rank ordered severity, occurrence, and detection parameters.
SEVERITY
Rank Effect rate Criteria
10 Hazardous- without warning
Very high severity ranking when a potential failure mode affects personal safety, safe item operation and/or involves non-compliance with government regulation without warning
9 Hazardous- with warning
Very high severity ranking when a potential failure mode affects safe item operation and/or involves non-compliance with government regulation with warning
8 Very High Item inoperable, with loss of primary function.
7 High Item operable, but at reduced level of performance. Customer dissatisfied.
5 Low Item operable, but Comfort/ convenience item(s) operable at reduced level of performance. Customer experiences some dissatisfaction.
4 Very low Fit & finish/Squeak & Rattle item does not conform. Defect noticed by average customers.
3 Minor Fit & finish/Squeak & Rattle item does not conform. Defect noticed by most customers.
2 Very minor Fit & finish/Squeak & Rattle item does not conform. Defect noticed by discriminating customers.
1 None No effect.
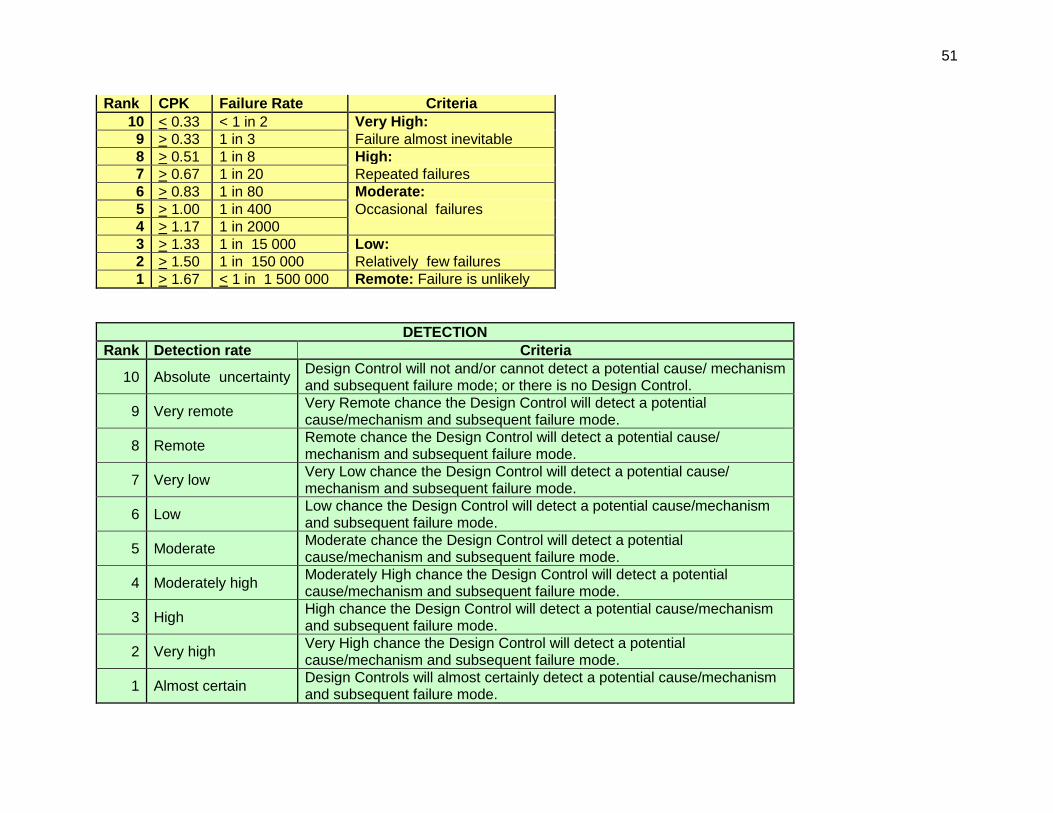
OCCURRENCE
51
Rank CPK Failure Rate Criteria
10 < 0.33 < 1 in 2 Very High:
9 > 0.33 1 in 3 Failure almost inevitable
8 > 0.51 1 in 8 High:
7 > 0.67 1 in 20 Repeated failures
6 > 0.83 1 in 80 Moderate:
5 > 1.00 1 in 400 Occasional failures
4 > 1.17 1 in 2000
3 > 1.33 1 in 15 000 Low:
2 > 1.50 1 in 150 000 Relatively few failures
1 > 1.67 < 1 in 1 500 000 Remote: Failure is unlikely
DETECTION
Rank Detection rate Criteria
10 Absolute uncertainty Design Control will not and/or cannot detect a potential cause/ mechanism and subsequent failure mode; or there is no Design Control.
9 Very remote Very Remote chance the Design Control will detect a potential cause/mechanism and subsequent failure mode.
8 Remote Remote chance the Design Control will detect a potential cause/ mechanism and subsequent failure mode.
7 Very low Very Low chance the Design Control will detect a potential cause/ mechanism and subsequent failure mode.
6 Low Low chance the Design Control will detect a potential cause/mechanism and subsequent failure mode.
5 Moderate Moderate chance the Design Control will detect a potential cause/mechanism and subsequent failure mode.
4 Moderately high Moderately High chance the Design Control will detect a potential cause/mechanism and subsequent failure mode.
3 High High chance the Design Control will detect a potential cause/mechanism and subsequent failure mode.
2 Very high Very High chance the Design Control will detect a potential cause/mechanism and subsequent failure mode.
1 Almost certain Design Controls will almost certainly detect a potential cause/mechanism and subsequent failure mode.
52
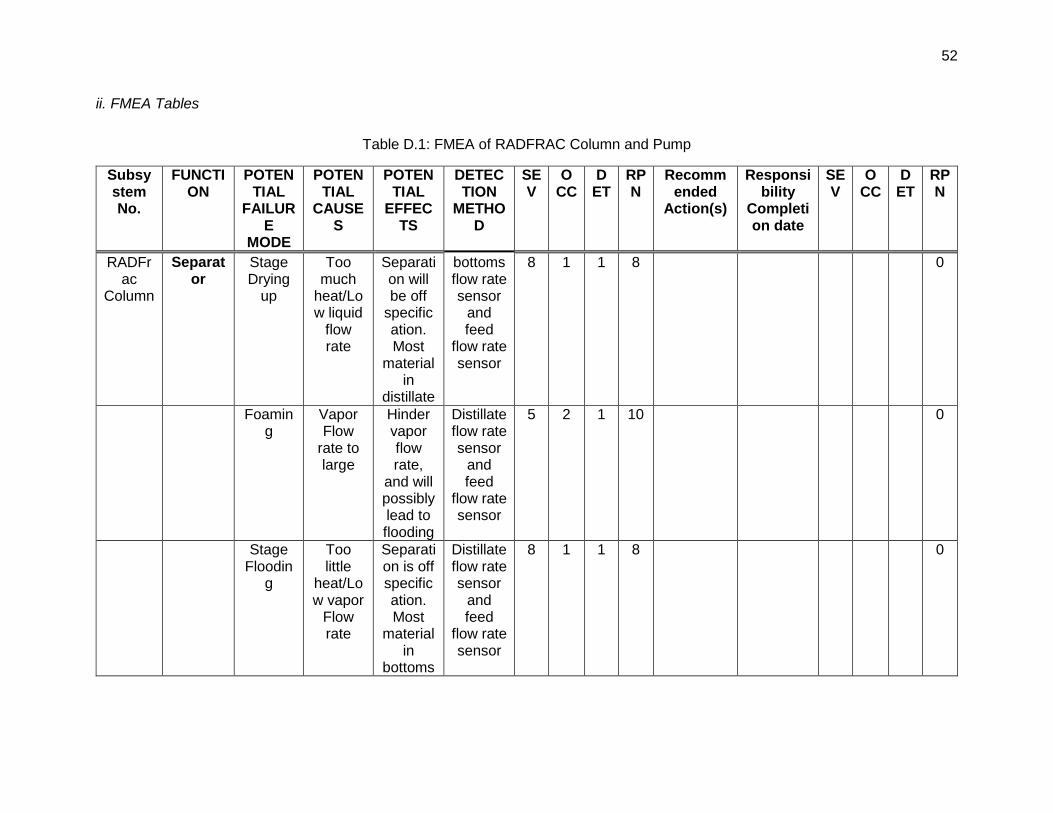
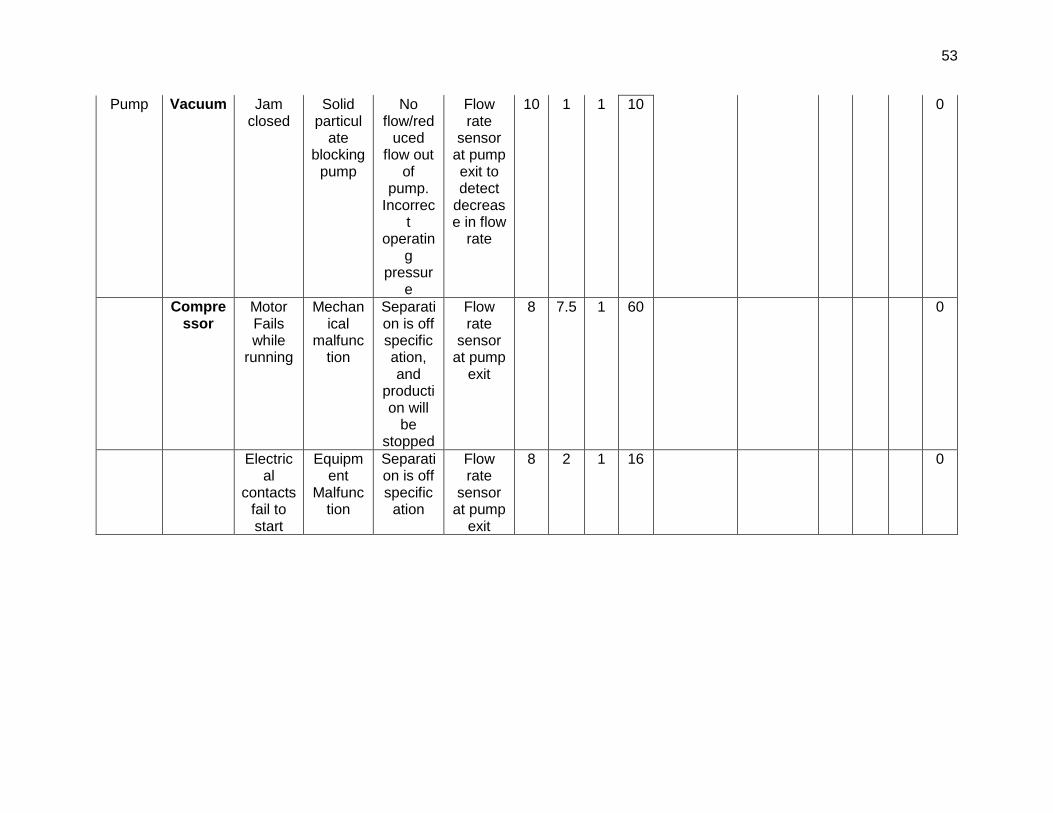
ii. FMEA Tables
Table D.1: FMEA of RADFRAC Column and Pump
Subsystem No.
FUNCTION
POTENTIAL
FAILURE
MODE
POTENTIAL
CAUSES
POTENTIAL
EFFECTS
DETECTION
METHOD
SEV
OCC
DET
RPN
Recommended
Action(s)
Responsibility
Completion date
SEV
OCC
DET
RPN
RADFrac
Column
Separator
Stage Drying
up
Too much
heat/Low liquid
flow rate
Separation will be off
specification. Most
material in
distillate
bottoms flow rate sensor
and feed
flow rate sensor
8 1 1 8 0
Foaming
Vapor Flow
rate to large
Hinder vapor flow rate,
and will possibly lead to flooding
Distillate flow rate sensor
and feed
flow rate sensor
5 2 1 10 0
Stage Floodin
g
Too little
heat/Low vapor
Flow rate
Separation is off specification. Most
material in
bottoms
Distillate flow rate sensor
and feed
flow rate sensor
8 1 1 8 0
53
Pump Vacuum Jam closed
Solid particul
ate blocking
pump
No flow/red
uced flow out
of pump.
Incorrect
operating
pressure
Flow rate
sensor at pump exit to detect
decrease in flow
rate
10 1 1 10 0
Compressor
Motor Fails while
running
Mechanical
malfunction
Separation is off specification, and
production will
be stopped
Flow rate
sensor at pump
exit
8 7.5 1 60 0
Electrical
contacts fail to start
Equipment
Malfunction
Separation is off specific
ation
Flow rate
sensor at pump
exit
8 2 1 16 0
54
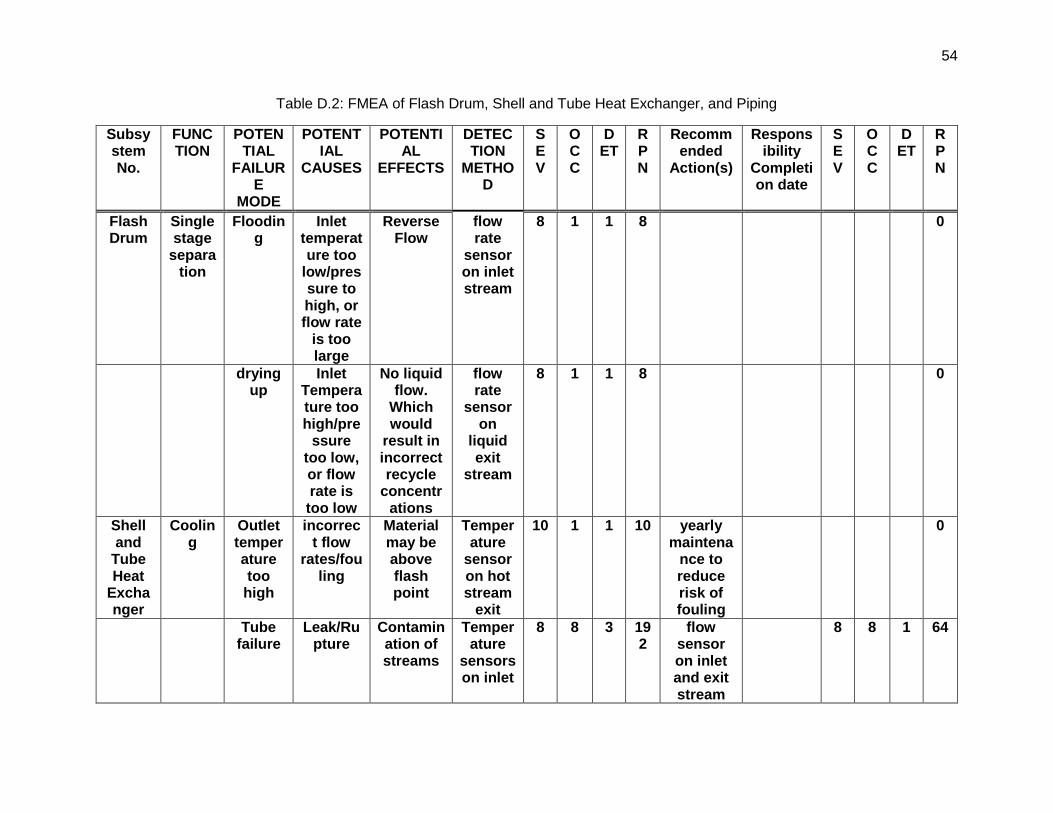
Table D.2: FMEA of Flash Drum, Shell and Tube Heat Exchanger, and Piping
Subsystem No.
FUNCTION
POTENTIAL
FAILURE
MODE
POTENTIAL
CAUSES
POTENTIAL
EFFECTS
DETECTION
METHOD
SEV
OCC
DET
RPN
Recommended
Action(s)
Responsibility
Completion date
SEV
OCC
DET
RPN
Flash Drum
Single stage
separation
Flooding
Inlet temperature too
low/pressure to high, or flow rate
is too large
Reverse Flow
flow rate
sensor on inlet stream
8 1 1 8 0
drying up
Inlet Temperature too high/pre
ssure too low, or flow rate is too low
No liquid flow.
Which would
result in incorrect recycle
concentrations
flow rate
sensor on
liquid exit
stream
8 1 1 8 0
Shell and
Tube Heat
Exchanger
Cooling
Outlet temperature too high
incorrect flow
rates/fouling
Material may be above flash point
Temperature
sensor on hot stream
exit
10 1 1 10 yearly maintena
nce to reduce risk of fouling
0
Tube failure
Leak/Rupture
Contamination of streams
Temperature
sensors on inlet
8 8 3 192
flow sensor on inlet and exit stream
8 8 1 64
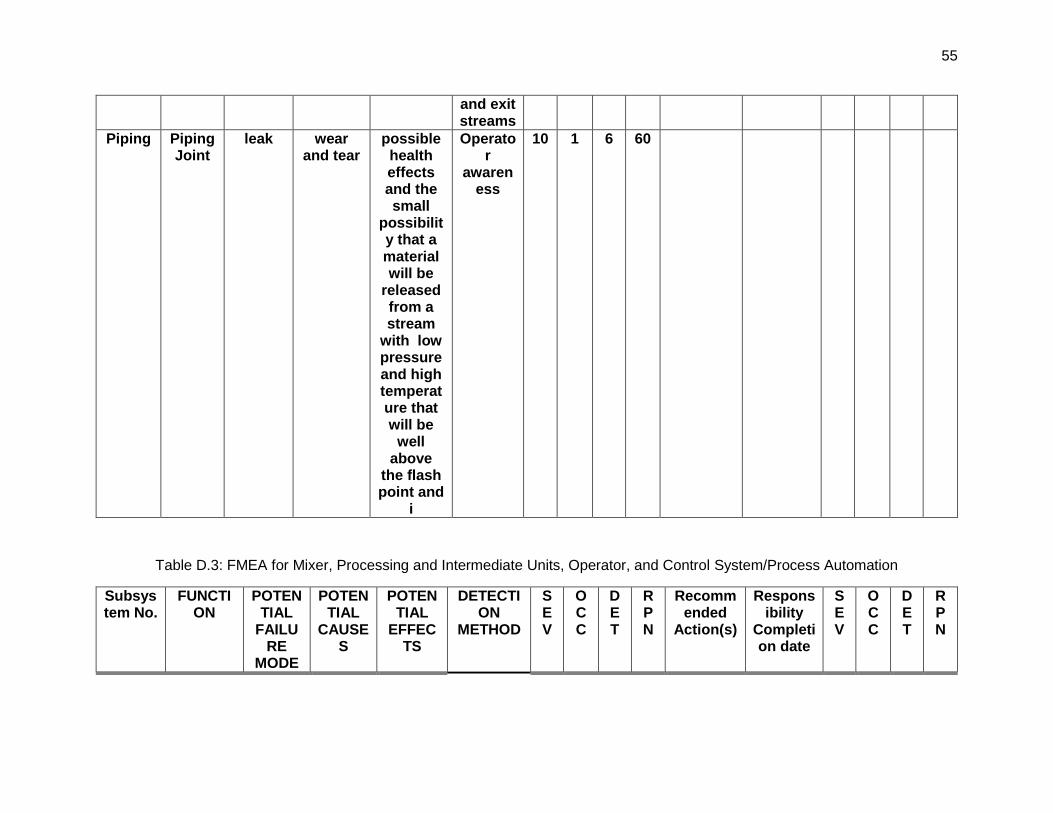
55
and exit streams
Piping Piping Joint
leak wear and tear
possible health effects and the small
possibility that a material will be
released from a stream
with low pressure and high temperature that will be
well above
the flash point and
i
Operator
awareness
10 1 6 60
Table D.3: FMEA for Mixer, Processing and Intermediate Units, Operator, and Control System/Process Automation
Subsystem No.
FUNCTION
POTENTIAL
FAILURE
MODE
POTENTIAL
CAUSES
POTENTIAL
EFFECTS
DETECTION
METHOD
SEV
OCC
DET
RPN
Recommended
Action(s)
Responsibility
Completion date
SEV
OCC
DET
RPN
56
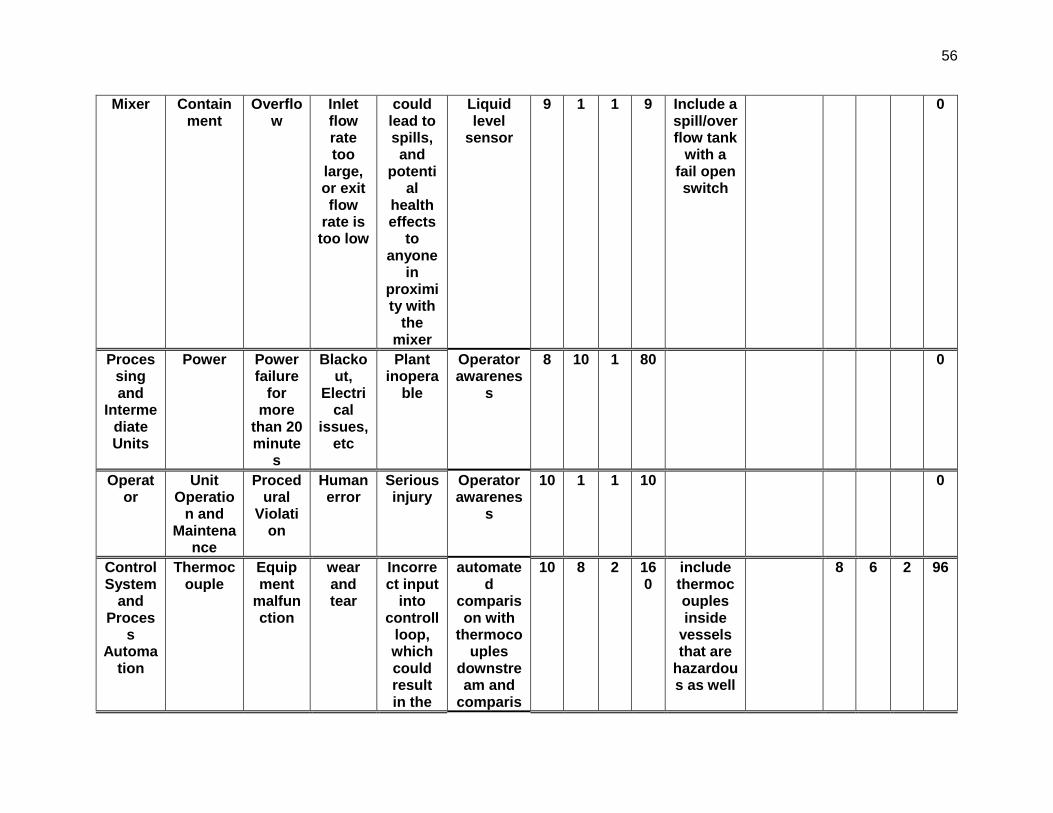
Mixer Containment
Overflow
Inlet flow rate too
large, or exit flow
rate is too low
could lead to spills, and
potential
health effects
to anyone
in proximity with
the mixer
Liquid level
sensor
9 1 1 9 Include a spill/overflow tank
with a fail open switch
0
Processing and
Intermediate Units
Power Power failure
for more
than 20 minute
s
Blackout,
Electrical
issues, etc
Plant inopera
ble
Operator awarenes
s
8 10 1 80 0
Operator
Unit Operatio
n and Maintena
nce
Procedural
Violation
Human error
Serious injury
Operator awarenes
s
10 1 1 10 0
Control System
and Proces
s Automa
tion
Thermocouple
Equipment
malfunction
wear and tear
Incorrect input
into controll
loop, which could result in the
automated
comparison with
thermocouples
downstream and
comparis
10 8 2 160
include thermocouples inside
vessels that are
hazardous as well
8 6 2 96
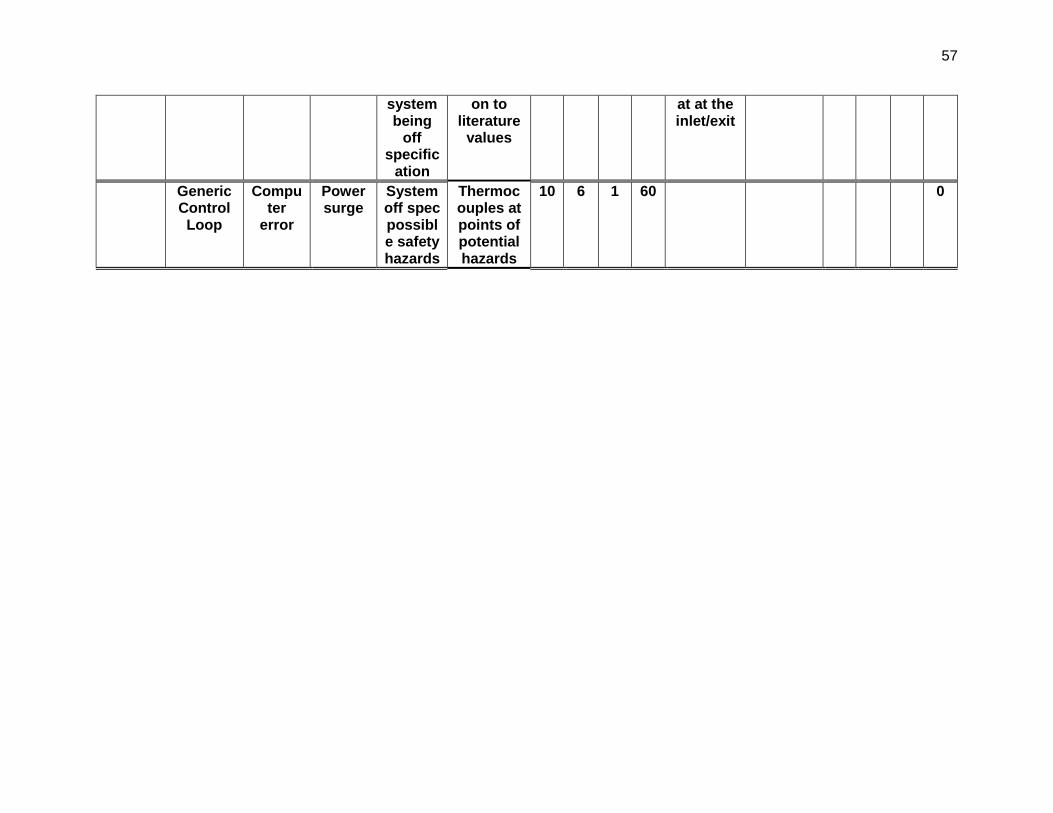
57
system being
off specific
ation
on to literature
values
at at the inlet/exit
Generic Control Loop
Computer
error
Power surge
System off spec possible safety hazards
Thermocouples at points of potential hazards
10 6 1 60 0
58
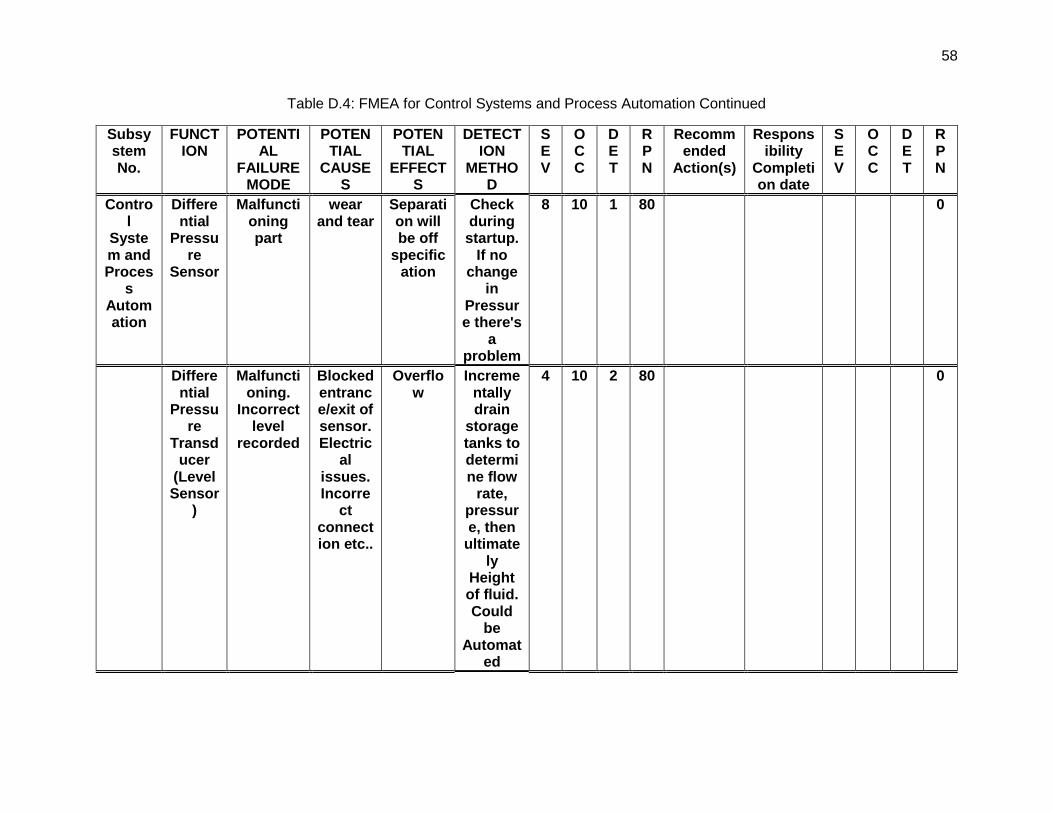
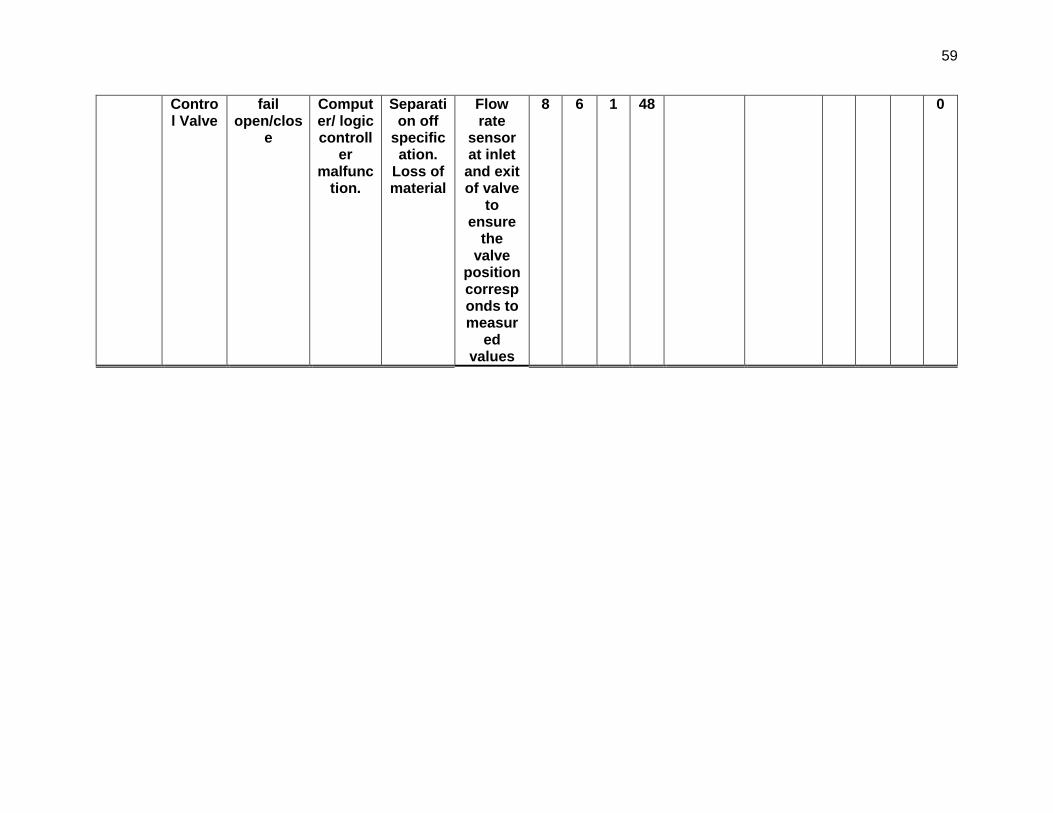
Table D.4: FMEA for Control Systems and Process Automation Continued
Subsystem No.
FUNCTION
POTENTIAL
FAILURE MODE
POTENTIAL
CAUSES
POTENTIAL
EFFECTS
DETECTION
METHOD
SEV
OCC
DET
RPN
Recommended
Action(s)
Responsibility
Completion date
SEV
OCC
DET
RPN
Control
System and Proces
s Automation
Differential
Pressure
Sensor
Malfunctioning part
wear and tear
Separation will be off
specification
Check during startup.
If no change
in Pressure there's
a problem
8 10 1 80 0
Differential
Pressure
Transducer
(Level Sensor
)
Malfunctioning.
Incorrect level
recorded
Blocked entrance/exit of sensor. Electric
al issues. Incorre
ct connection etc..
Overflow
Incrementally drain
storage tanks to determine flow
rate, pressure, then
ultimately
Height of fluid. Could
be Automat
ed
4 10 2 80 0
59
Control Valve
fail open/clos
e
Computer/ logic controll
er malfunc
tion.
Separation off
specification.
Loss of material
Flow rate
sensor at inlet and exit of valve
to ensure
the valve
position corresponds to measur
ed values
8 6 1 48 0
60
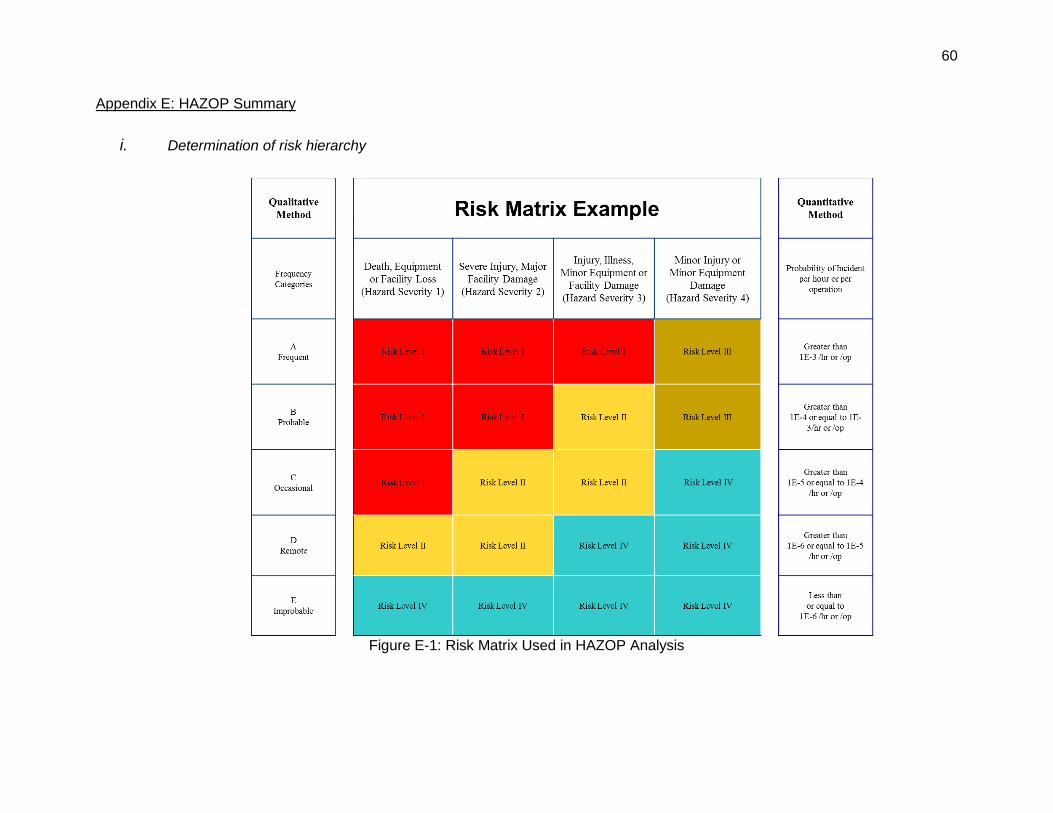
Appendix E: HAZOP Summary
i. Determination of risk hierarchy
Figure E-1: Risk Matrix Used in HAZOP Analysis
61
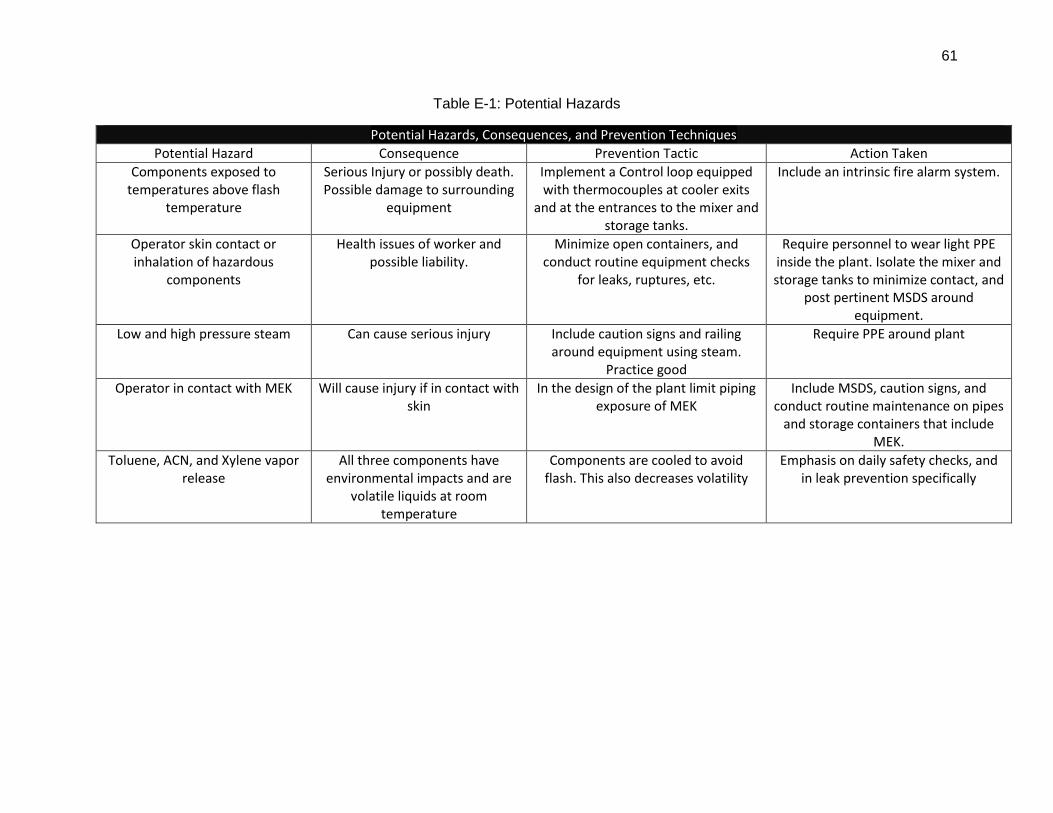
Table E-1: Potential Hazards
Potential Hazards, Consequences, and Prevention Techniques
Potential Hazard Consequence Prevention Tactic Action Taken
Components exposed to temperatures above flash
temperature
Serious Injury or possibly death. Possible damage to surrounding
equipment
Implement a Control loop equipped with thermocouples at cooler exits
and at the entrances to the mixer and storage tanks.
Include an intrinsic fire alarm system.
Operator skin contact or inhalation of hazardous
components
Health issues of worker and possible liability.
Minimize open containers, and conduct routine equipment checks
for leaks, ruptures, etc.
Require personnel to wear light PPE inside the plant. Isolate the mixer and storage tanks to minimize contact, and
post pertinent MSDS around equipment.
Low and high pressure steam Can cause serious injury Include caution signs and railing around equipment using steam.
Practice good
Require PPE around plant
Operator in contact with MEK Will cause injury if in contact with skin
In the design of the plant limit piping exposure of MEK
Include MSDS, caution signs, and conduct routine maintenance on pipes
and storage containers that include MEK.
Toluene, ACN, and Xylene vapor release
All three components have environmental impacts and are
volatile liquids at room temperature
Components are cooled to avoid flash. This also decreases volatility
Emphasis on daily safety checks, and in leak prevention specifically
62
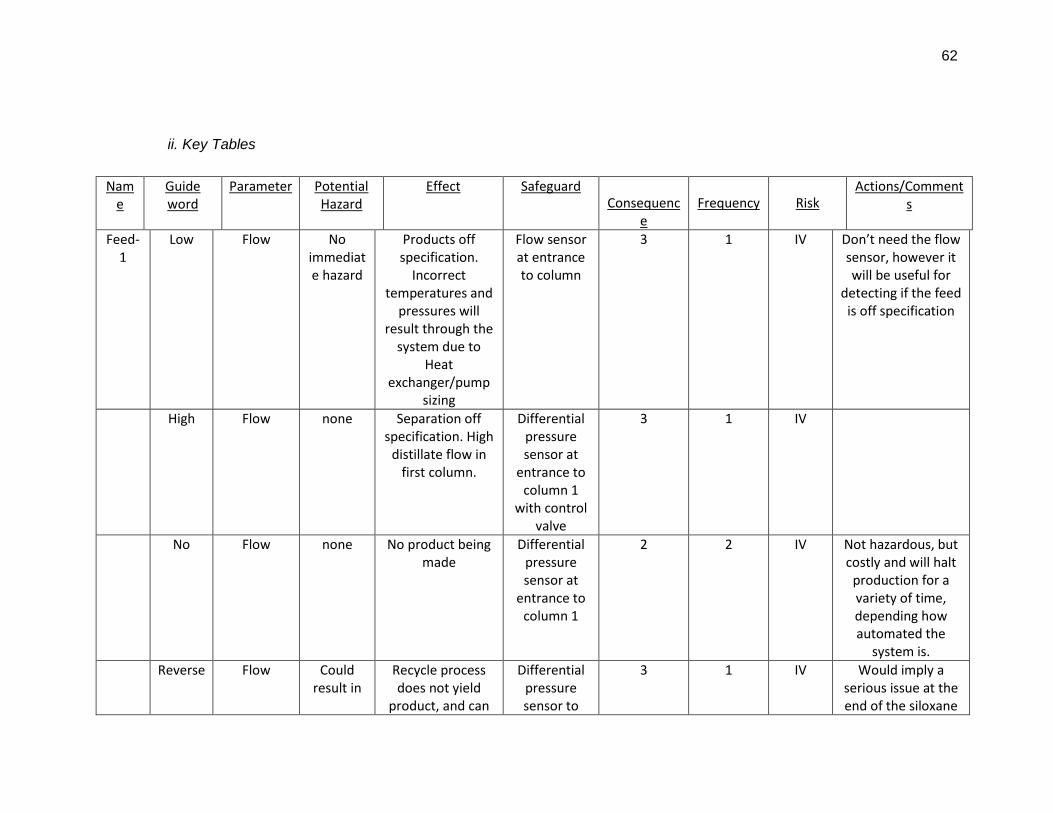
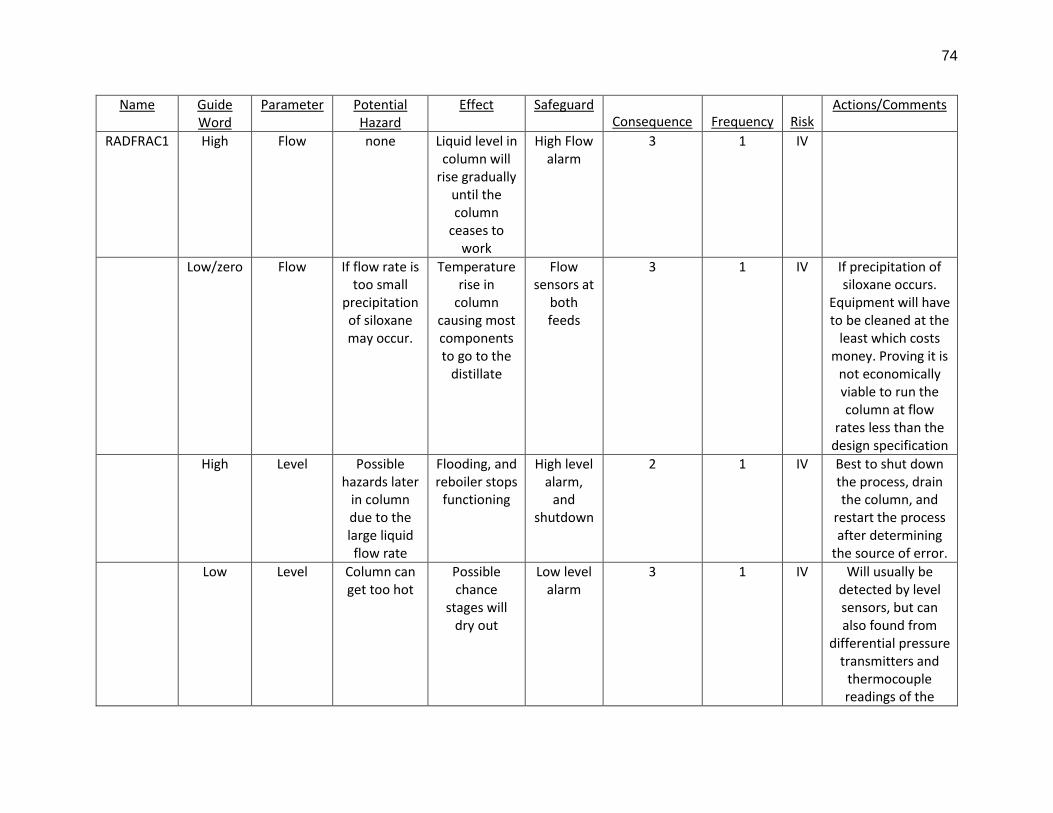
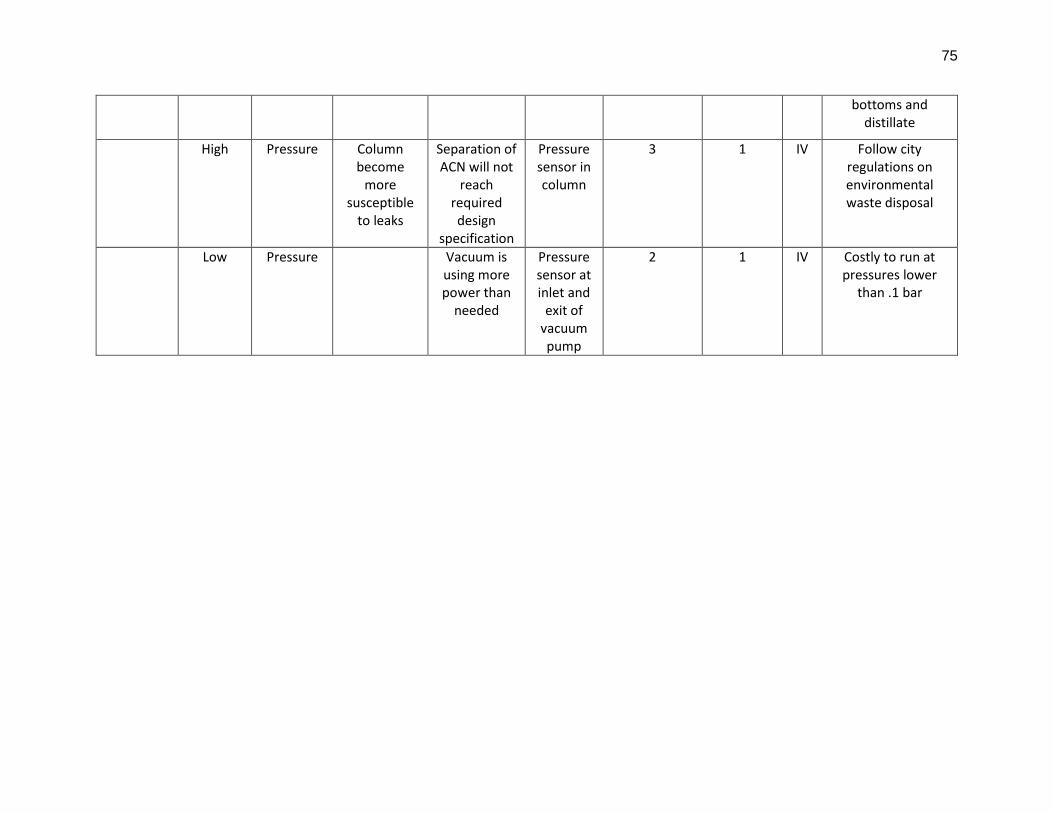
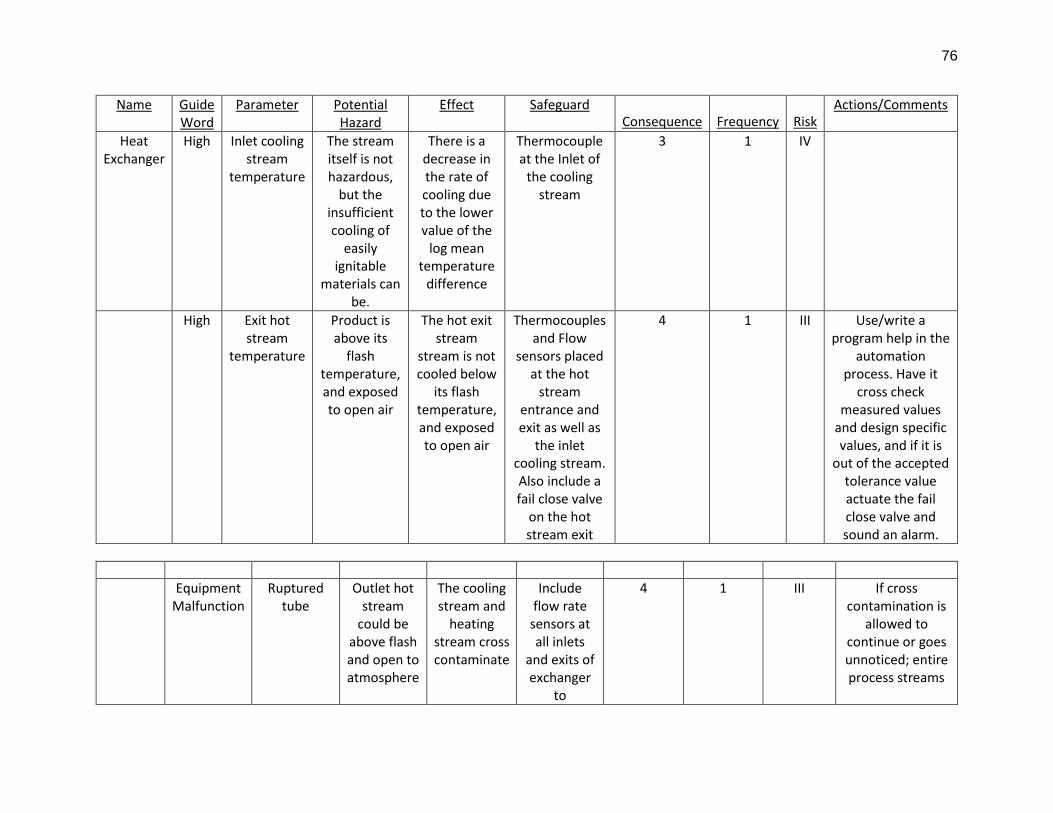
ii. Key Tables
Name
Guide word
Parameter Potential Hazard
Effect Safeguard Consequenc
e
Frequency
Risk
Actions/Comments
Feed-1
Low Flow No immediate hazard
Products off specification.
Incorrect temperatures and
pressures will result through the
system due to Heat
exchanger/pump sizing
Flow sensor at entrance to column
3 1 IV Don’t need the flow sensor, however it will be useful for
detecting if the feed is off specification
High Flow none Separation off specification. High
distillate flow in first column.
Differential pressure sensor at
entrance to column 1
with control valve
3 1 IV
No Flow none No product being made
Differential pressure sensor at
entrance to column 1
2 2 IV Not hazardous, but costly and will halt
production for a variety of time, depending how automated the
system is.
Reverse Flow Could result in
Recycle process does not yield
product, and can
Differential pressure sensor to
3 1 IV Would imply a serious issue at the end of the siloxane
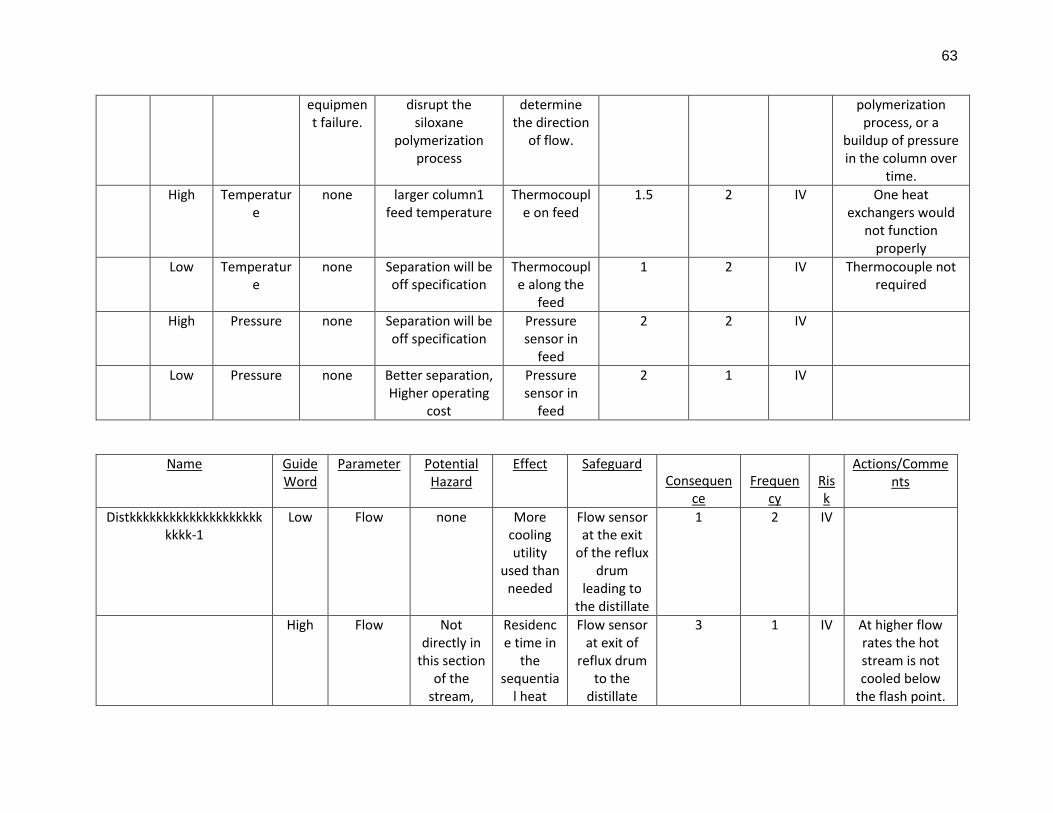
63
equipment failure.
disrupt the siloxane
polymerization process
determine the direction
of flow.
polymerization process, or a
buildup of pressure in the column over
time.
High Temperature
none larger column1 feed temperature
Thermocouple on feed
1.5 2 IV One heat exchangers would
not function properly
Low Temperature
none Separation will be off specification
Thermocouple along the
feed
1 2 IV Thermocouple not required
High Pressure none Separation will be off specification
3 1 IV At higher flow rates the hot stream is not cooled below
the flash point.
64
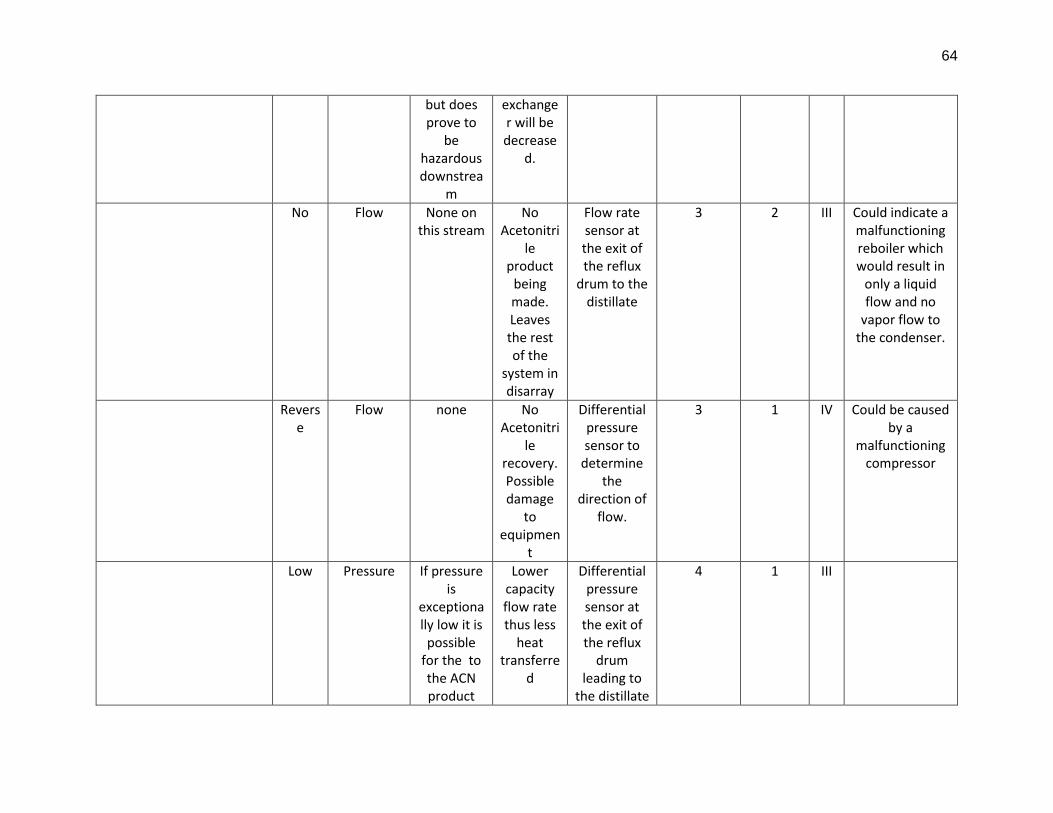
but does prove to
be hazardous downstrea
m
exchanger will be decrease
d.
No Flow None on this stream
No Acetonitri
le product
being made. Leaves the rest of the
system in disarray
Flow rate sensor at the exit of the reflux
drum to the distillate
3 2 III Could indicate a malfunctioning reboiler which would result in
only a liquid flow and no
vapor flow to the condenser.
Reverse
Flow none No Acetonitri
le recovery. Possible damage
to equipmen
t
Differential pressure sensor to
determine the
direction of flow.
3 1 IV Could be caused by a
malfunctioning compressor
Low Pressure If pressure is
exceptionally low it is
possible for the to the ACN product
Lower capacity flow rate thus less
heat transferre
d
Differential pressure sensor at the exit of the reflux
drum leading to
the distillate
4 1 III
65
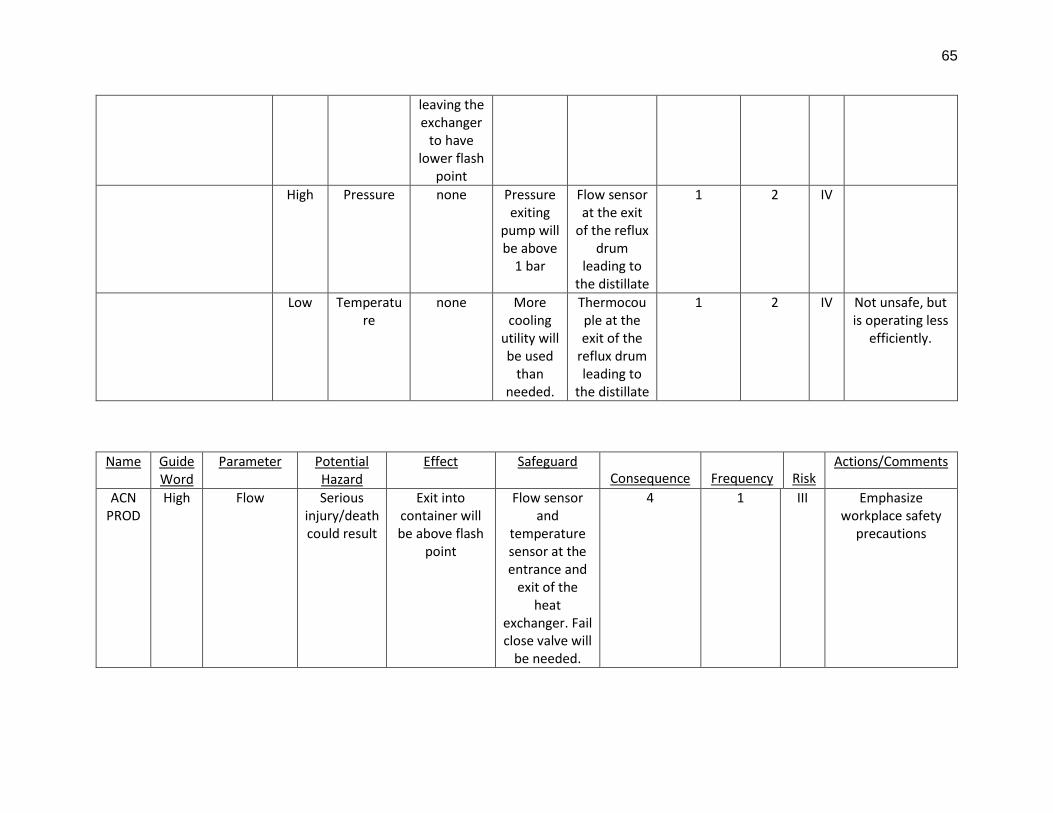
leaving the exchanger
to have lower flash
point
High Pressure none Pressure exiting
pump will be above
1 bar
Flow sensor at the exit
of the reflux drum
leading to the distillate
1 2 IV
Low Temperature
none More cooling
utility will be used
than needed.
Thermocouple at the exit of the
reflux drum leading to
the distillate
1 2 IV Not unsafe, but is operating less
efficiently.
Name Guide Word
Parameter Potential Hazard
Effect Safeguard Consequence
Frequency
Risk
Actions/Comments
ACN PROD
High Flow Serious injury/death could result
Exit into container will be above flash
point
Flow sensor and
temperature sensor at the entrance and
exit of the heat
exchanger. Fail close valve will
be needed.
4 1 III Emphasize workplace safety
precautions
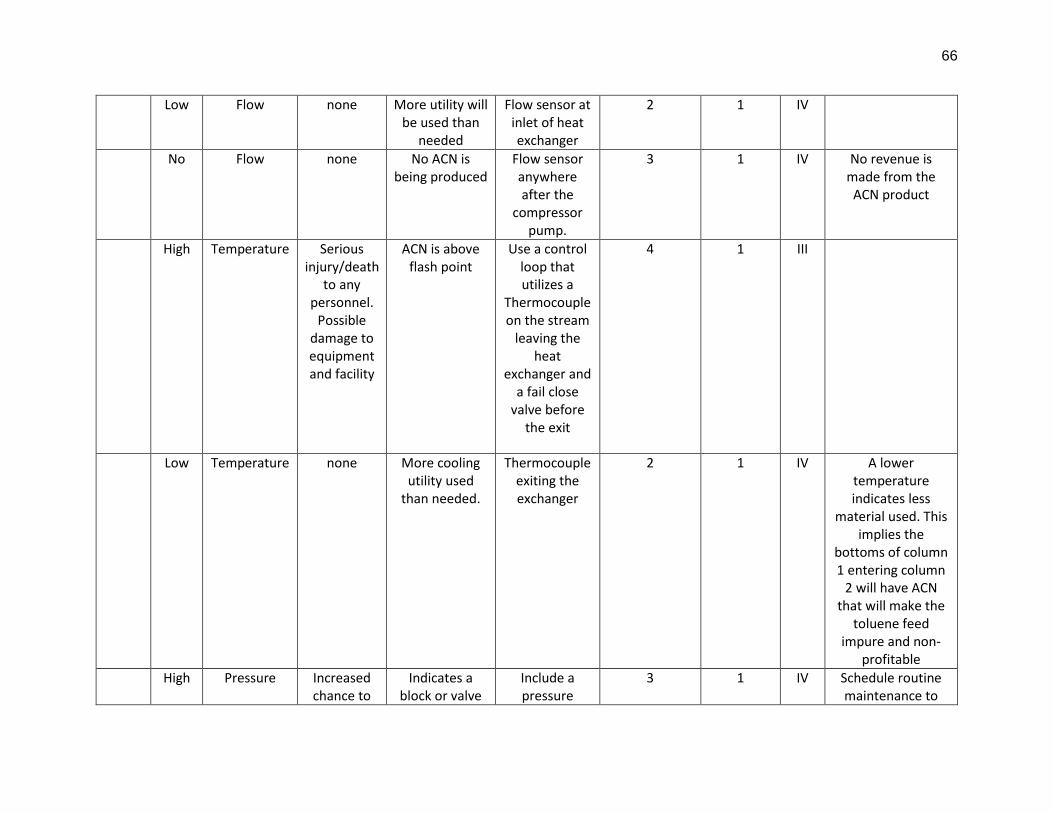
66
Low Flow none More utility will be used than
needed
Flow sensor at inlet of heat exchanger
2 1 IV
No Flow none No ACN is being produced
Flow sensor anywhere after the
compressor pump.
3 1 IV No revenue is made from the
ACN product
High Temperature Serious injury/death
to any personnel.
Possible damage to equipment and facility
ACN is above flash point
Use a control loop that utilizes a
Thermocouple on the stream
leaving the heat
exchanger and a fail close
valve before the exit
4 1 III
Low Temperature none More cooling utility used
than needed.
Thermocouple exiting the exchanger
2 1 IV A lower temperature indicates less
material used. This implies the
bottoms of column 1 entering column
2 will have ACN that will make the
toluene feed impure and non-
profitable
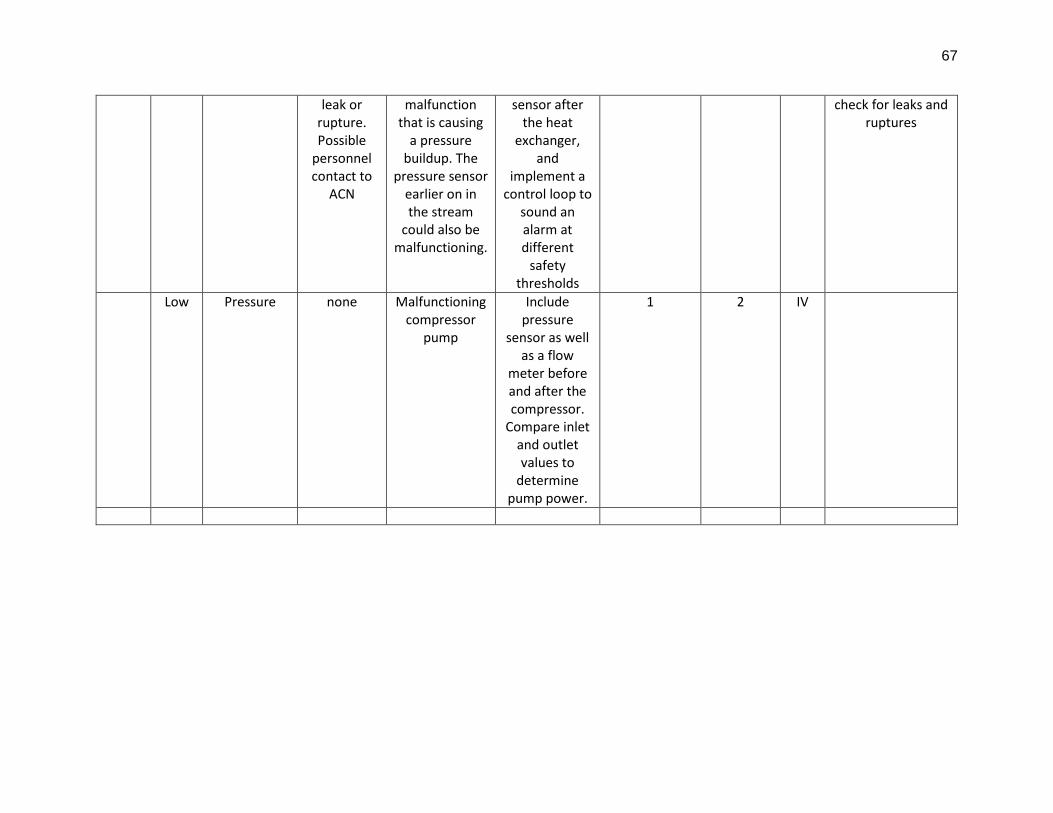
High Pressure Increased chance to
Indicates a block or valve
Include a pressure
3 1 IV Schedule routine maintenance to
67
leak or rupture. Possible
personnel contact to
ACN
malfunction that is causing
a pressure buildup. The
pressure sensor earlier on in the stream
could also be malfunctioning.
sensor after the heat
exchanger, and
implement a control loop to
sound an alarm at different
safety thresholds
check for leaks and ruptures
Low Pressure none Malfunctioning compressor
pump
Include pressure
sensor as well as a flow
meter before and after the compressor.
Compare inlet and outlet values to
determine pump power.
1 2 IV
68
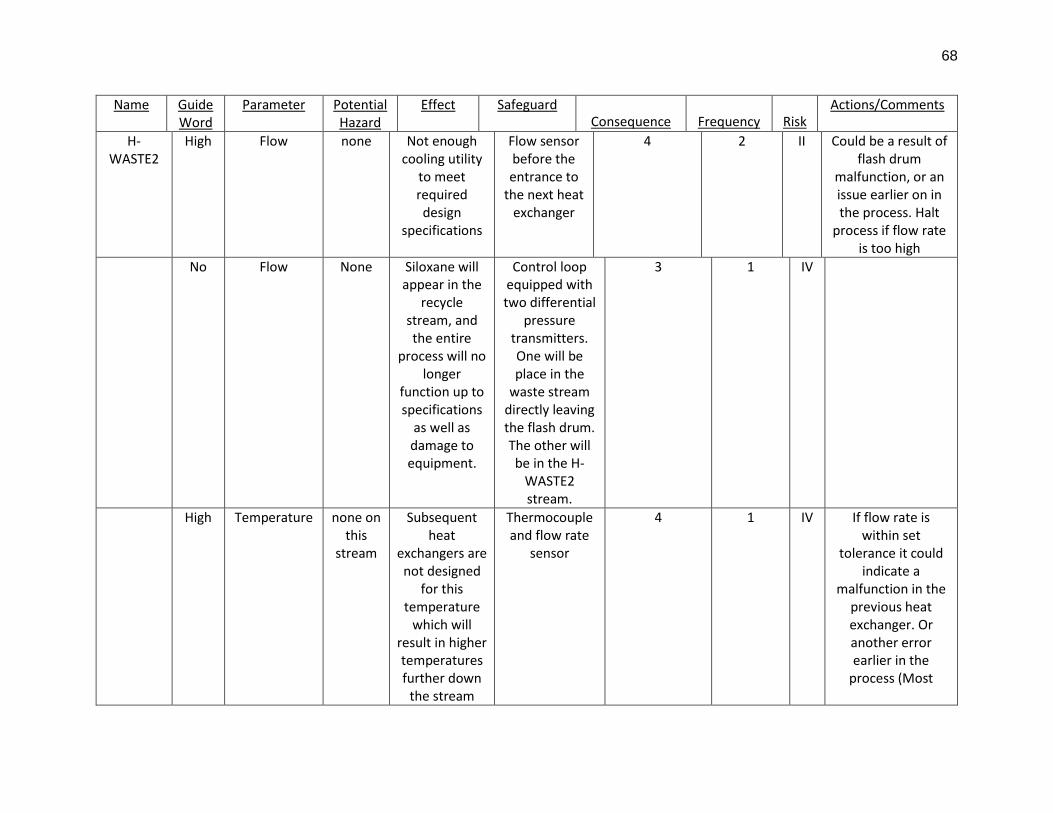
Name Guide Word
Parameter Potential Hazard
Effect Safeguard Consequence
Frequency
Risk
Actions/Comments
H- WASTE2
High Flow none Not enough cooling utility
to meet required design
specifications
Flow sensor before the entrance to
the next heat exchanger
4 2 II Could be a result of flash drum
malfunction, or an issue earlier on in the process. Halt
process if flow rate is too high
No Flow None Siloxane will appear in the
recycle stream, and the entire
process will no longer
function up to specifications
as well as damage to equipment.
Control loop equipped with two differential
pressure transmitters. One will be place in the
waste stream directly leaving the flash drum. The other will be in the H-
WASTE2 stream.
3 1 IV
High Temperature none on this
stream
Subsequent heat
exchangers are not designed
for this temperature
which will result in higher temperatures further down
the stream
Thermocouple and flow rate
sensor
4 1 IV If flow rate is within set
tolerance it could indicate a
malfunction in the previous heat exchanger. Or another error earlier in the
process (Most
69
Likely condenser malfunction).
70
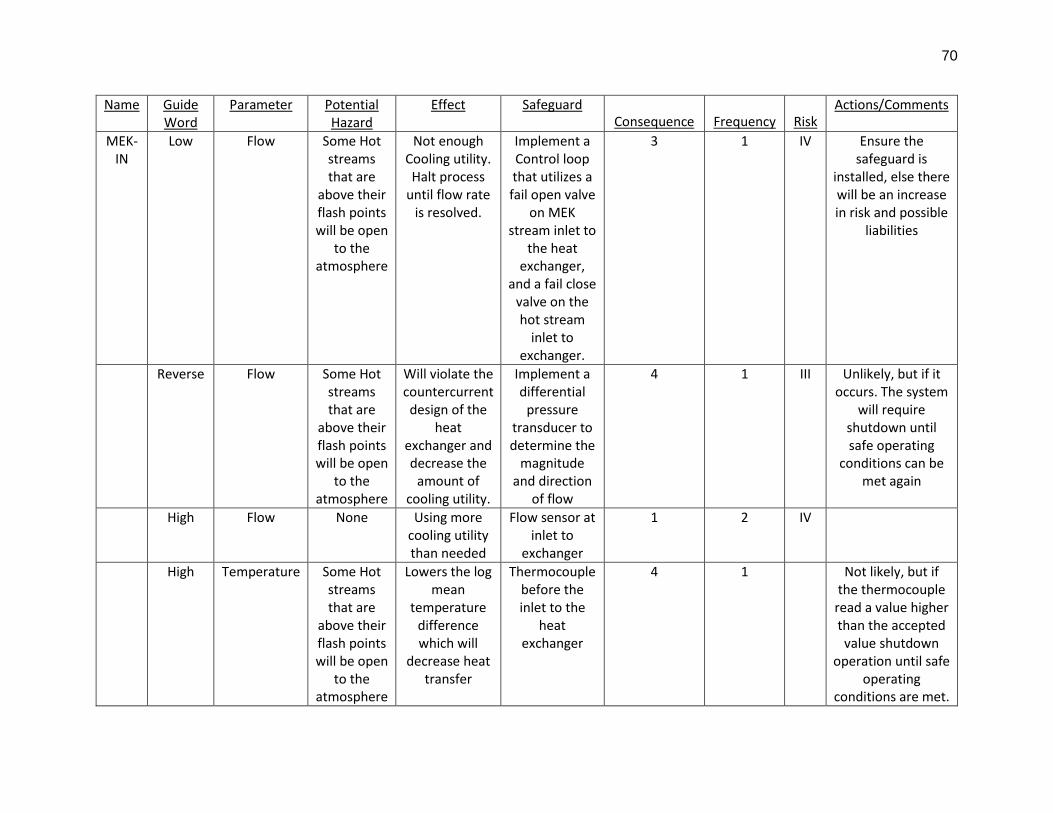
Name Guide Word
Parameter Potential Hazard
Effect Safeguard Consequence
Frequency
Risk
Actions/Comments
MEK-IN
Low Flow Some Hot streams that are
above their flash points will be open
to the atmosphere
Not enough Cooling utility. Halt process
until flow rate is resolved.
Implement a Control loop that utilizes a fail open valve
on MEK stream inlet to
the heat exchanger,
and a fail close valve on the hot stream
inlet to exchanger.
3 1 IV Ensure the safeguard is
installed, else there will be an increase in risk and possible
liabilities
Reverse Flow Some Hot streams that are
above their flash points will be open
to the atmosphere
Will violate the countercurrent design of the
heat exchanger and decrease the
amount of cooling utility.
Implement a differential
pressure transducer to determine the
magnitude and direction
of flow
4 1 III Unlikely, but if it occurs. The system
will require shutdown until safe operating
conditions can be met again
High Flow None Using more cooling utility than needed
Flow sensor at inlet to
exchanger
1 2 IV
High Temperature Some Hot streams that are
above their flash points will be open
to the atmosphere
Lowers the log mean
temperature difference which will
decrease heat transfer
Thermocouple before the inlet to the
heat exchanger
4 1 Not likely, but if the thermocouple
read a value higher than the accepted value shutdown
operation until safe operating
conditions are met.
71
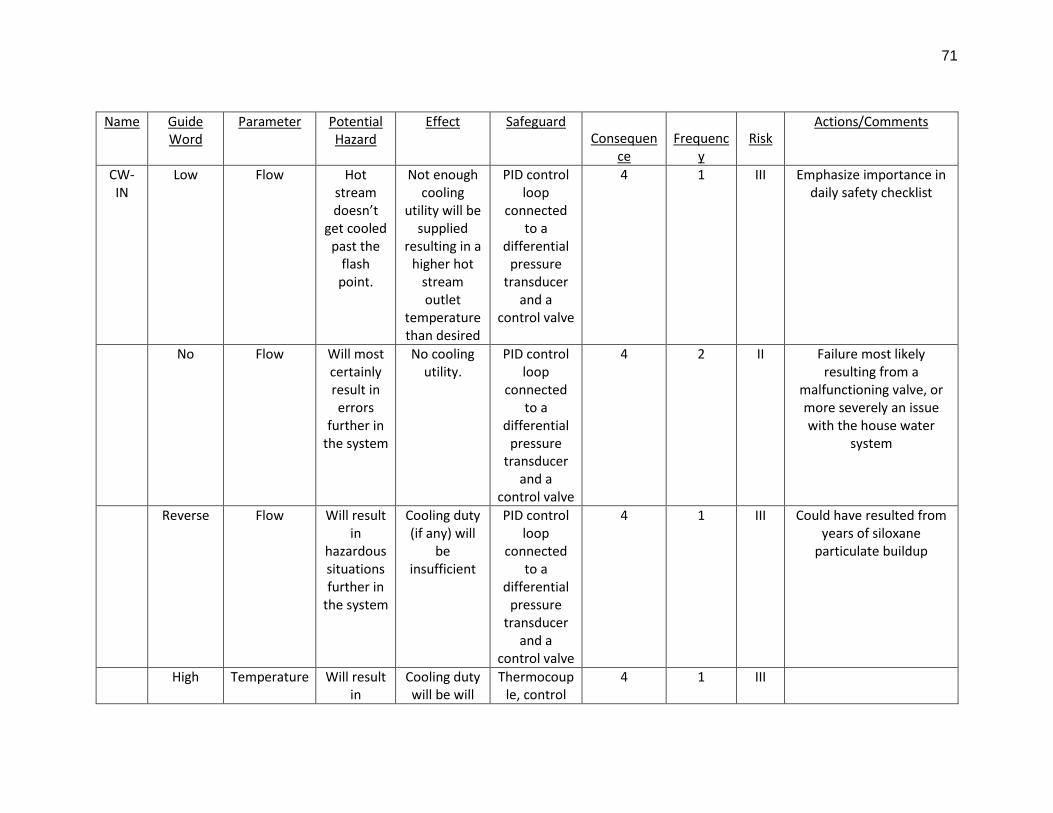
Name Guide Word
Parameter Potential Hazard
Effect Safeguard Consequen
ce
Frequenc
y
Risk
Actions/Comments
CW-IN
Low Flow Hot stream doesn’t
get cooled past the
flash point.
Not enough cooling
utility will be supplied
resulting in a higher hot
stream outlet
temperature than desired
PID control loop
connected to a
differential pressure
transducer and a
control valve
4 1 III Emphasize importance in daily safety checklist
No Flow Will most certainly result in errors
further in the system
No cooling utility.
PID control loop
connected to a
differential pressure
transducer and a
control valve
4 2 II Failure most likely resulting from a
malfunctioning valve, or more severely an issue with the house water
system
Reverse Flow Will result in
hazardous situations further in
the system
Cooling duty (if any) will
be insufficient
PID control loop
connected to a
differential pressure
transducer and a
control valve
4 1 III Could have resulted from years of siloxane
particulate buildup
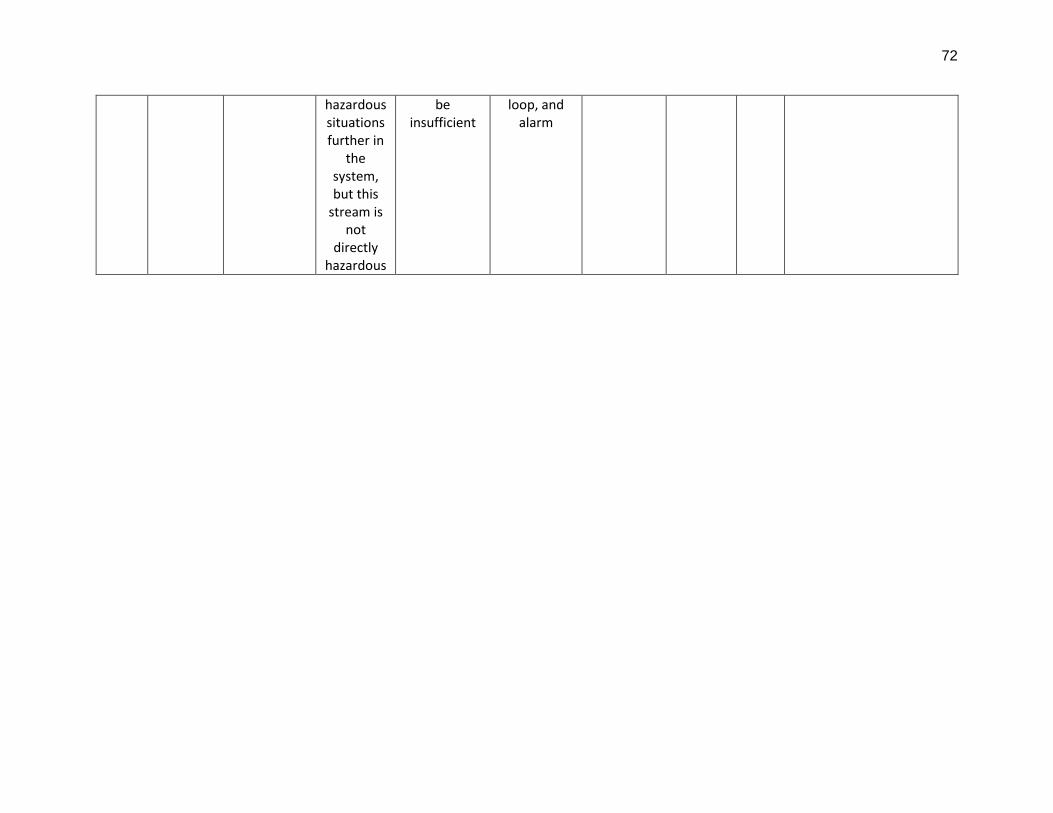
High Temperature Will result in
Cooling duty will be will
Thermocouple, control
4 1 III
72
hazardous situations further in
the system, but this
stream is not
directly hazardous
be insufficient
loop, and alarm
73
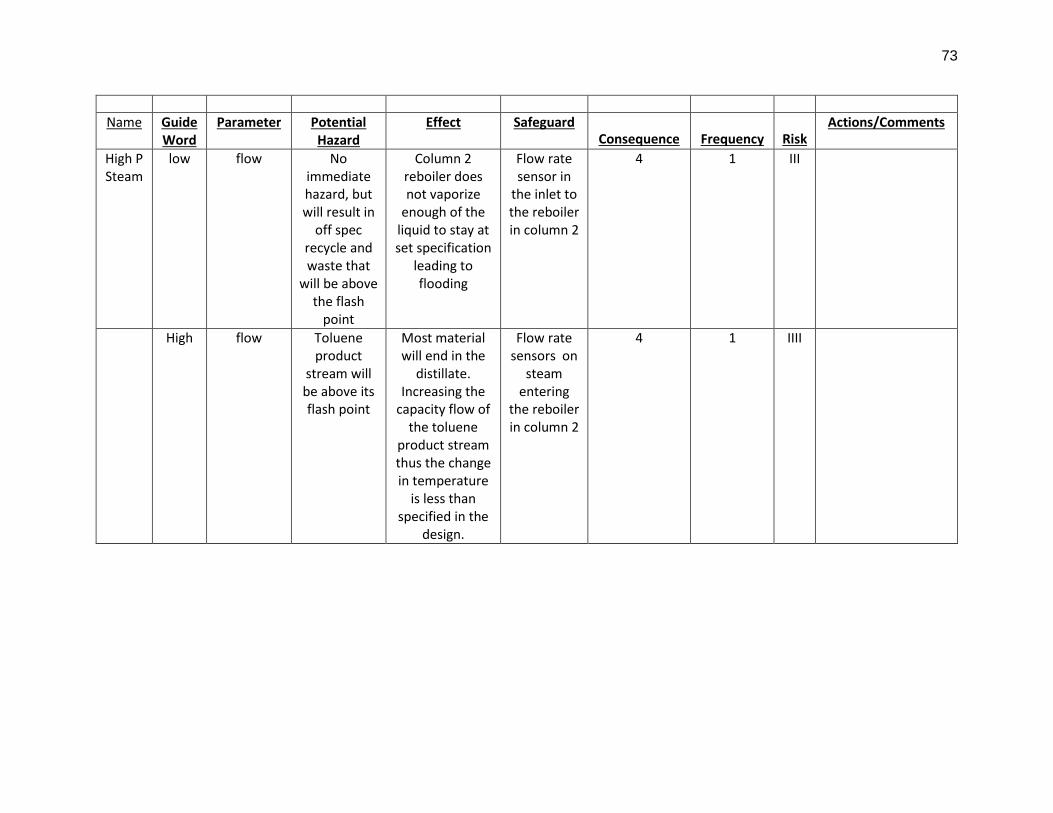
Name Guide Word
Parameter Potential Hazard
Effect Safeguard Consequence
Frequency
Risk
Actions/Comments
High P Steam
low flow No immediate hazard, but will result in
off spec recycle and waste that
will be above the flash
point
Column 2 reboiler does not vaporize
enough of the liquid to stay at set specification
leading to flooding
Flow rate sensor in
the inlet to the reboiler in column 2
4 1 III
High flow Toluene product
stream will be above its flash point
Most material will end in the
distillate. Increasing the
capacity flow of the toluene
product stream thus the change in temperature
is less than specified in the
design.
Flow rate sensors on
steam entering
the reboiler in column 2
4 1 IIII
74
Name Guide Word
Parameter Potential Hazard
Effect Safeguard Consequence
Frequency
Risk
Actions/Comments
RADFRAC1 High Flow none Liquid level in column will
rise gradually until the column
ceases to work
High Flow alarm
3 1 IV
Low/zero Flow If flow rate is too small
precipitation of siloxane may occur.
Temperature rise in
column causing most components to go to the
distillate
Flow sensors at
both feeds
3 1 IV If precipitation of siloxane occurs.
Equipment will have to be cleaned at the
least which costs money. Proving it is
not economically viable to run the column at flow
rates less than the design specification
High Level Possible hazards later
in column due to the large liquid flow rate
Flooding, and reboiler stops
functioning
High level alarm,
and shutdown
2 1 IV Best to shut down the process, drain the column, and
restart the process after determining
the source of error. Low Level Column can
get too hot Possible chance
stages will dry out
Low level alarm
3 1 IV Will usually be detected by level sensors, but can also found from
differential pressure transmitters and
thermocouple readings of the
75
bottoms and distillate
High Pressure Column become
more susceptible
to leaks
Separation of ACN will not
reach required design
specification
Pressure sensor in column
3 1 IV Follow city regulations on environmental waste disposal
Low Pressure Vacuum is using more power than
needed
Pressure sensor at inlet and
exit of vacuum pump
2 1 IV Costly to run at pressures lower
than .1 bar
76
Name Guide Word
Parameter Potential Hazard
Effect Safeguard Consequence
Frequency
Risk
Actions/Comments
Heat Exchanger
High Inlet cooling stream
temperature
The stream itself is not hazardous,
but the insufficient cooling of
easily ignitable
materials can be.
There is a decrease in the rate of cooling due to the lower value of the
log mean temperature
difference
Thermocouple at the Inlet of
the cooling stream
3 1 IV
High Exit hot stream
temperature
Product is above its
flash temperature, and exposed to open air
The hot exit stream
stream is not cooled below
its flash temperature, and exposed to open air
Thermocouples and Flow
sensors placed at the hot
stream entrance and exit as well as
the inlet cooling stream. Also include a fail close valve
on the hot stream exit
4 1 III Use/write a program help in the
automation process. Have it
cross check measured values
and design specific values, and if it is
out of the accepted tolerance value actuate the fail close valve and sound an alarm.
Equipment Malfunction
Ruptured tube
Outlet hot stream
could be above flash and open to atmosphere
The cooling stream and
heating stream cross contaminate
Include flow rate
sensors at all inlets
and exits of exchanger
to
4 1 III If cross contamination is
allowed to continue or goes unnoticed; entire process streams
77
determine if there is crossover
0
Appendix F: Utility Summary
The subsequent tables are a summary of the refrigerants used, and their annual cost assuming a working year of 8000 hours. Each calculation is based on the utility price displayed below in table G-1.
Table G-1: Cost of Cooling, Heating, and Electrical Utilities
Utility Cost
Cooling Water 0.000402 $/kg
MEK 0.000019706 $/kJ
Steam (P,T)
172 kPa, 115 C 0.0211 $/kg
1034 kPa, 181.4 C 0.0244 $/kg
Electricity 0.00002 $/kJ
i. Electric Usage:
Table G-2: Cost to Run Electrical Equipment
Electricity Usage
Electricity [kW] $/kW Annual Cost
Pump -1 3.60E-02 7.19E-07 $202
Pump -2 3.39E-02 6.79E-07 $19
Vacuum Pump 3.00E+01 4.60E-04 $13,261
Total $13,301
ii. Cooling Water Usage
Table G-3: Cooling Water
Cooling Water Usage
Unit Mass Flow [kg/hr] Annual Cost
E2-A 940.1 $30,244.87
1
E4-C 29.2 $932.64
Condenser 2 2000 $64,320.00
Total $95,497.51
iii. MEK Usage
Table G-4: MethylEthylKetone Usage
MEK Usages
Unit kW Required
Annual Energy Consumption (kJ)
Cost of MEK True Cost
E1 1.4 40320000 $794 $3,971
E2-B 0.7 20160000 $397. $1,588
E3-B 8.76 252288000 $4,970 $19,880
ED-4 0.325 9360000 $184 $737
Cond 1 160 4608000000 $90,777 $363,110
Total $389,288
iv. Steam Usage
Table G-5: Steam Consumption
Steam Usage
Unit Steam Flow [kg/hr] Cost [$/kg] Annual Cost
Reboiler 1 300 0.0211 $50,640
Reboiler 2 300 0.0244 $58,560
Flash Drum 12.35 0.0244 $2,411
Total Cost $111,611
2
Appendix G: Inherently Safer Design Checklist
I. Minimize
A. Inventory Reduction (Calibri body)
1. Can hazardous raw materials inventory be reduced?
No. All profit comes from the recycling of hazardous materials back into the
process.
2. Can in-process storage and inventory be reduced?
No. Already taken into consideration
3. Can finished product inventory be reduced?
No.
B. Process Considerations
1. Can the use of alternate equipment with reduced hazardous material
inventory requirement be done? Such as:
a) Continuous in-line mixers in place of mixing vessels
Yes. It would be costly, and would severely alter the process
b) Compact heat exchangers (higher heat transfer area per unit
volume) in place of shell-and tube
No. The flow rate is too high for a feasible compact exchanger.
c) Combine unit operations (such as reactive distillation in place of
separate reactor with multi-column fractionation train; installing
internal reboilers or heat exchangers) to reduce overall system
volume
No. No stream would provide adequate heat duty to replace a
reboiler.
2. Has piping been designed for reducing the piping diameters?
Will be considered in later design. The only exception being the gravity
driven cooling streams.
3. Can pipeline inventory be reduced by using the hazardous material as a
gas rather than a liquid (e.g., chlorine)?
No.
4. Can process conditions be changed to reduce production of hazardous waste or by-products?
No. The process is currently operating at the minimum allowable concentration of p-xylene in the waste.
II. Substitute
3
A. Is it possible to completely eliminate hazardous raw materials, process
intermediates, or by-products by using an alternative process or chemistry?
No. The process is chemical specific.
B. Is it possible to completely eliminate in-process solvents and flammable heat
transfer media by changing chemistry or processing conditions?
No. The addition of p-xylene is needed to separate toluene from acetonitrile.
C. Is it possible to substitute less hazardous raw materials?
No.
III. Moderate
A. Is it possible to limit the supply pressure of raw materials to less than the maximum
allowable working pressure of the vessels they are delivered to?
No. All pressures are set and decreasing pressure would just tax the system
further.
B. Is it possible to make reaction conditions (temperature, pressure) less severe by
using a catalyst, or a better catalyst?
No. Already taken into consideration with the addition of p-xylene to increase the
ease of separation.
C. Can the process be operated at less severe conditions?
No. All temperatures and pressures are set to meet separation specifications.
D. Is it possible to dilute hazardous raw materials to reduce the hazard potential?
No.
E. Is it possible to design operating conditions such that materials that become
unstable at elevated temperatures or freeze at low temperatures heating and
cooling medium will not be operating in those ranges?
No. Sharp Separation, in this case, can only be achieved at elevated temperatures.
F. Can process conditions be changed to avoid handling flammable liquids above
their flash points?
Yes. The changes have already been implemented.
G. Is equipment designed to totally contain the materials that might be present inside
at ambient temperature or the maximum attainable process temperature (i.e.,
higher maximum allowable working temperature to accommodate loss of cooling,
simplify reliance of external systems such as refrigeration systems to control
temperature such that vapor pressure is less than equipment design pressure)?
Yes.
H. For processes handling flammable materials, is it possible to design the layout to
minimize the number and size of confined areas and to limit the potential for
serious overpressure in the event of a loss of containment and subsequent
ignition?
Yes. Will be a major consideration in plant design.
I. Can process units be located to eliminate or minimize adverse effects from
adjacent hazardous installations?
Yes. Install splash guards on drains to reduce contamination. Isolate the exits of
the high volatility liquids in one section to reduce risk to the rest of plant.
J. Can process units be designed to limit the magnitude of process deviations:
Yes. Already taken into consideration.
4
K. Can hazardous material liquid spill be prevented from entering drainage
system/sewer?
Yes. Install splash guards over waste water gutters. All flammable stream
exits/containment should be at a lower height than the rest of the process to reduce
contamination.
L. For flammable materials, can spills be directed away from the storage vessel to
reduce the risk of a boiling liquid expanding vapor explosion (BLEVE) in the event
of a fire?
Yes. Design the plant on a slight incline, and implement different levels of drains.
M. Passive safety design is preferred. Can passive design be implemented? For
example, to prevent or reduce fire damage, an active method is automatic water
spray actuated by flame or heat detector; a procedural method by having an
operator turn on the water spray, or passive method by using fire insulation.
Yes. Can see implications an implementations in the P&ID diagram.
IV. Simplify
A. Can equipment be designed such that it is difficult or impossible to create a
potential hazardous situation due to an operating or maintenance error? Such as:
1. Easy operation of valves designed to prevent inadvertent errors
Yes. Most of the valve actuators will be run autonomously.
2. Simplified control displays
Yes. Will be a consideration when deciding on the control software to use.
3. Operate at lower pressure to limit release
No.
4. Operate at lower temperature to prevent run away reactions or material
failure
Not possible. All temperatures are set to meet design specifications.
5. Use passive rather than active controls
Yes. Currently implementing both.
6. Use buried or shielded tanks
Yes. Already taken into consideration.
7. Use fail-safe controls if utilities are lost
Yes. Fail open valves on cooling utilities, and fail close valves on streams
entering the atmosphere containing liquids above their flash point.
8. Limit the complexity and degree of instrumentation redundancy
Yes. There are some instrumentation redundancies, but these
redundancies help locate errors quickly.
9. Use refrigerated storage vs. pressurized storage
Yes. Already taken into consideration.
10. Minimize connections, paths and number of flanges in hazardous
processes
Yes. Needs to be considered in further design.
11. Use fewer bends in piping
Yes. Should be considered later in the design process.
5
12. Use expansion loops in piping rather than bellows
Yes. Space is not an issue, so an expansion loop should be used.
13. Design into the process, equipment isolation mechanism for maintenance
Yes. Already taken into consideration, but should still be investigated
further as the design evolves.
14. Limit manual operations such as filter cleaning, manual sampling, hose
handling for loading/unloading operations, etc.
Yes. The process is automated as much as possible.
15. Design vessels for full vacuum eliminating risk of vessel collapse
Yes. Already taken into consideration, i.e. of the vacuum pump.
16. Design both shell and tube side of heat exchangers to contain the
maximum attainable pressure, eliminating the need for pressure relief
Yes.
17. Can the equipment be designed to make incorrect assembly impossible?
Use equipment that clearly identifies status
B. Can passive leak-limiting technology be used to limit potential loss of containment?
Some examples include the following:
We are not at this point in the design process. A leak of a stream containing
a liquid above its flash point is still a serious safety concern, thus this
section should be taken into further consideration at a later point.
1. Blowout resistant gaskets
Yes.
2. Increasing wall strength
Yes.
3. Using fewer seams and joints
Yes.
4. Providing extra corrosion/erosion allowance
No. None of the materials used are considered very corrosive.
5. Reducing vibration
Yes. Should at least be considered
6. Minimizing the use of open-ended, quick-opening valves
Yes.
7. Eliminating open-ended, quick-opening valves in hazardous service
Yes.
8. Improving valve seating reliability
Yes.
9. Eliminating unnecessary expansion joints, hoses, and rupture disks
ρ = density W = mass flow rate Flv = empirical ratio
Constant Value
A -1.877478097
B -.8145804597
C -.1870744085
D -.0145228667
E -.0010148518
10
A-E = constants Kdrum = case specific constant Uperm= Max velocity at max diameter of flash drum. (Ft/s) V = Molar flow rate Ac = Cross sectional error MWvap = Molecular weight of the vapor e. Storage Tank Volume
𝑉𝑜𝑙𝑢𝑚𝑒𝑡𝑎𝑛𝑘 = 2 ∗ 𝑉50%
Where:
𝑉50% = �̇�𝑖𝑛 ∗ 𝐹𝑖𝑙𝑙 𝑇𝑖𝑚𝑒
For the ACN Product Tank
𝑉𝑡𝑎𝑛𝑘 = 2 ∙ (4.7𝑚3
𝑑𝑎𝑦) ∙ (2 𝐷𝑎𝑦𝑠) = 18.8𝑚3
Appendix I: References
References 1. Wankat, Phillip C. Separation Process Engineering. Upper Saddle River, NJ: Prentice
Hall, 2012. 2. Blackwell, W. W. Chemical Process Design on a Programmable Calculator. New York: