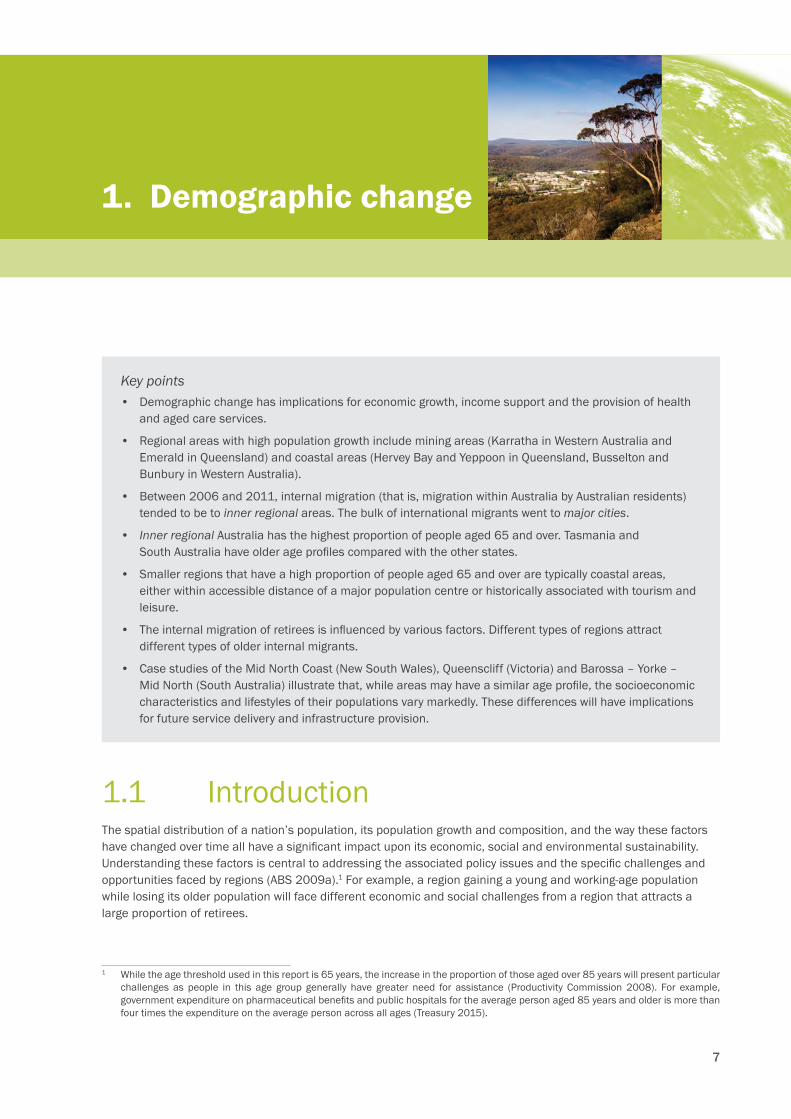
7 1. Demographic change Key points • Demographic change has implications for economic growth, income support and the provision of health and aged care services. • Regional areas with high population growth include mining areas (Karratha in Western Australia and Emerald in Queensland) and coastal areas (Hervey Bay and Yeppoon in Queensland, Busselton and Bunbury in Western Australia). • Between 2006 and 2011, internal migration (that is, migration within Australia by Australian residents) tended to be to inner regional areas. The bulk of international migrants went to major cities. • Inner regional Australia has the highest proportion of people aged 65 and over. Tasmania and South Australia have older age profiles compared with the other states. • Smaller regions that have a high proportion of people aged 65 and over are typically coastal areas, either within accessible distance of a major population centre or historically associated with tourism and leisure. • The internal migration of retirees is influenced by various factors. Different types of regions attract different types of older internal migrants. • Case studies of the Mid North Coast (New South Wales), Queenscliff (Victoria) and Barossa – Yorke – Mid North (South Australia) illustrate that, while areas may have a similar age profile, the socioeconomic characteristics and lifestyles of their populations vary markedly. These differences will have implications for future service delivery and infrastructure provision. 1.1 Introduction The spatial distribution of a nation’s population, its population growth and composition, and the way these factors have changed over time all have a significant impact upon its economic, social and environmental sustainability. Understanding these factors is central to addressing the associated policy issues and the specific challenges and opportunities faced by regions (ABS 2009a). 1 For example, a region gaining a young and working-age population while losing its older population will face different economic and social challenges from a region that attracts a large proportion of retirees. 1 While the age threshold used in this report is 65 years, the increase in the proportion of those aged over 85 years will present particular challenges as people in this age group generally have greater need for assistance (Productivity Commission 2008). For example, government expenditure on pharmaceutical benefits and public hospitals for the average person aged 85 years and older is more than four times the expenditure on the average person across all ages (Treasury 2015).
Transcript
7
1. Demographic change
Key points• Demographic change has implications for economic growth, income support and the provision of health
and aged care services.
• Regional areas with high population growth include mining areas (Karratha in Western Australia and Emerald in Queensland) and coastal areas (Hervey Bay and Yeppoon in Queensland, Busselton and Bunbury in Western Australia).
• Between 2006 and 2011, internal migration (that is, migration within Australia by Australian residents) tended to be to inner regional areas. The bulk of international migrants went to major cities.
• Inner regional Australia has the highest proportion of people aged 65 and over. Tasmania and South Australia have older age profiles compared with the other states.
• Smaller regions that have a high proportion of people aged 65 and over are typically coastal areas, either within accessible distance of a major population centre or historically associated with tourism and leisure.
• The internal migration of retirees is influenced by various factors. Different types of regions attract different types of older internal migrants.
• Case studies of the Mid North Coast (New South Wales), Queenscliff (Victoria) and Barossa – Yorke – Mid North (South Australia) illustrate that, while areas may have a similar age profile, the socioeconomic characteristics and lifestyles of their populations vary markedly. These differences will have implications for future service delivery and infrastructure provision.
1.1 IntroductionThe spatial distribution of a nation’s population, its population growth and composition, and the way these factors have changed over time all have a significant impact upon its economic, social and environmental sustainability. Understanding these factors is central to addressing the associated policy issues and the specific challenges and opportunities faced by regions (ABS 2009a).1 For example, a region gaining a young and working-age population while losing its older population will face different economic and social challenges from a region that attracts a large proportion of retirees.
1 While the age threshold used in this report is 65 years, the increase in the proportion of those aged over 85 years will present particular challenges as people in this age group generally have greater need for assistance (Productivity Commission 2008). For example, government expenditure on pharmaceutical benefits and public hospitals for the average person aged 85 years and older is more than four times the expenditure on the average person across all ages (Treasury 2015).
8
State of Regional Australia 2015 Progress in Australian Regions
This chapter comprises two main sections. The first section discusses recent trends in two important indicators of demographic change: population growth and internal migration.
The second section provides a more detailed analysis of population ageing in Australia’s regions. It explores regional variation in the characteristics of ageing populations by examining three specific areas as case studies: the Mid North Coast of New South Wales, Queenscliff in Victoria and the Barossa – Yorke – Mid North in South Australia.
Remoteness Classes and SUAs, in combination with other geographic units based on data availability and fitness for purpose, are used to analyse the data.
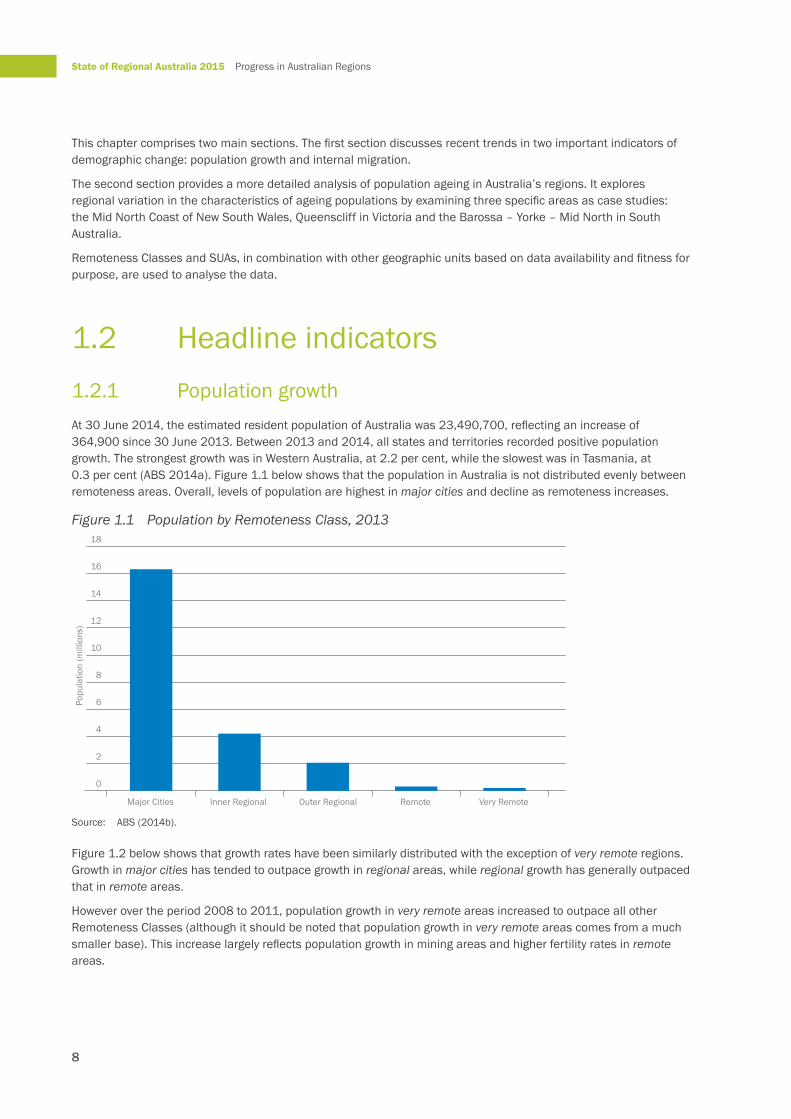
1.2 Headline indicators1.2.1 Population growthAt 30 June 2014, the estimated resident population of Australia was 23,490,700, reflecting an increase of 364,900 since 30 June 2013. Between 2013 and 2014, all states and territories recorded positive population growth. The strongest growth was in Western Australia, at 2.2 per cent, while the slowest was in Tasmania, at 0.3 per cent (ABS 2014a). Figure 1.1 below shows that the population in Australia is not distributed evenly between remoteness areas. Overall, levels of population are highest in major cities and decline as remoteness increases.
Figure 1.1 Population by Remoteness Class, 2013
Source: ABS (2014b).
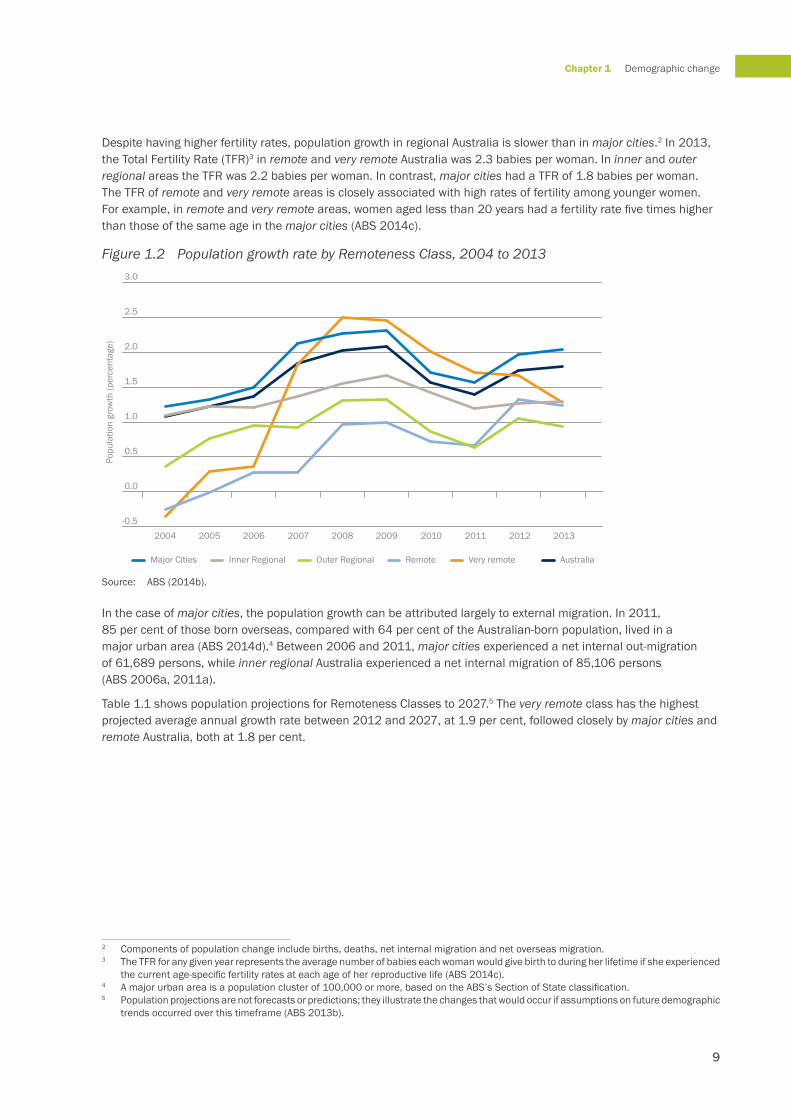
Figure 1.2 below shows that growth rates have been similarly distributed with the exception of very remote regions. Growth in major cities has tended to outpace growth in regional areas, while regional growth has generally outpaced that in remote areas.
However over the period 2008 to 2011, population growth in very remote areas increased to outpace all other Remoteness Classes (although it should be noted that population growth in very remote areas comes from a much smaller base). This increase largely reflects population growth in mining areas and higher fertility rates in remote areas.
0
2
4
6
8
10
12
14
16
18
Very RemoteRemoteOuter RegionalInner RegionalMajor Cities
Popu
latio
n (m
illio
ns)
9
Chapter 1 Demographic change
Despite having higher fertility rates, population growth in regional Australia is slower than in major cities.2 In 2013, the Total Fertility Rate (TFR)3 in remote and very remote Australia was 2.3 babies per woman. In inner and outer regional areas the TFR was 2.2 babies per woman. In contrast, major cities had a TFR of 1.8 babies per woman. The TFR of remote and very remote areas is closely associated with high rates of fertility among younger women. For example, in remote and very remote areas, women aged less than 20 years had a fertility rate five times higher than those of the same age in the major cities (ABS 2014c).
Figure 1.2 Population growth rate by Remoteness Class, 2004 to 2013
Source: ABS (2014b).
In the case of major cities, the population growth can be attributed largely to external migration. In 2011, 85 per cent of those born overseas, compared with 64 per cent of the Australian-born population, lived in a major urban area (ABS 2014d).4 Between 2006 and 2011, major cities experienced a net internal out-migration of 61,689 persons, while inner regional Australia experienced a net internal migration of 85,106 persons (ABS 2006a, 2011a).
Table 1.1 shows population projections for Remoteness Classes to 2027.5 The very remote class has the highest projected average annual growth rate between 2012 and 2027, at 1.9 per cent, followed closely by major cities and remote Australia, both at 1.8 per cent.
2 Components of population change include births, deaths, net internal migration and net overseas migration.3 The TFR for any given year represents the average number of babies each woman would give birth to during her lifetime if she experienced
the current age-specific fertility rates at each age of her reproductive life (ABS 2014c).4 A major urban area is a population cluster of 100,000 or more, based on the ABS’s Section of State classification.5 Population projections are not forecasts or predictions; they illustrate the changes that would occur if assumptions on future demographic
trends occurred over this timeframe (ABS 2013b).
-0.5
0.0
0.5
1.0
1.5
2.0
2.5
3.0
2004 2005 2006 2007 2008 2009 2010 2011 2012 2013
Major Cities Inner Regional Outer Regional Very remoteRemote Australia
Popu
latio
n gr
owth
(per
cent
age)
10
State of Regional Australia 2015 Progress in Australian Regions
Table 1.1 Population projections by Remoteness Class, 2012–20272012 2017 2022 2027 2012–2027 2012–2027
Source: ABS (2015).Note: Customised projections prepared for the Australian Government Department of Social Services by the ABS.
Analysis of current population growth at the SUA level reveals that many high-growth urban areas are in regional locations. Table 1.2 shows that of the 10 SUAs that experienced the highest population growth rate between 2001 and 2013, eight were outside the major cities. This may be attributable to the fact that populations in regional SUAs have grown from a smaller base, and therefore, small movements in the absolute population translate to relatively high growth rates.
The only two SUAs within major cities were Ellenbrook in Greater Perth, Western Australia, and Melton in Melbourne, Victoria. Ellenbrook was established in 1992 as a new development on the outskirts of Perth. It comprises planned villages that have developed rapidly over subsequent decades (City of Swan 2014). Melton in Victoria has grown from being a small town outside Melbourne on the road to Ballarat to being part of the greater capital city area within commuting distance of the city, reflecting its status as an urban growth corridor of greater Melbourne. The extent of this growth is illustrated by the fact that the Melton City Council is currently proposing to establish 11 new suburbs (City of Melton 2014).
Table 1.2 Population growth, top 10 Significant Urban Areas, 2001–2013Significant Urban Area 2001 2013 Change 2001–2013 Percentage change 2001–2013
Regional SUAs with high population growth include mining areas such as Karratha in Western Australia and Emerald in Queensland.
Other SUAs with high growth include coastal areas such as Hervey Bay and Yeppoon in Queensland, Busselton and Bunbury in Western Australia, Torquay in Victoria, and Highfields, just outside the regional city of Toowoomba, also in Queensland. The growth in Highfields is similar to Melton’s in that it is the result of spillover population on the edge of a large and growing centre.
11
Chapter 1 Demographic change
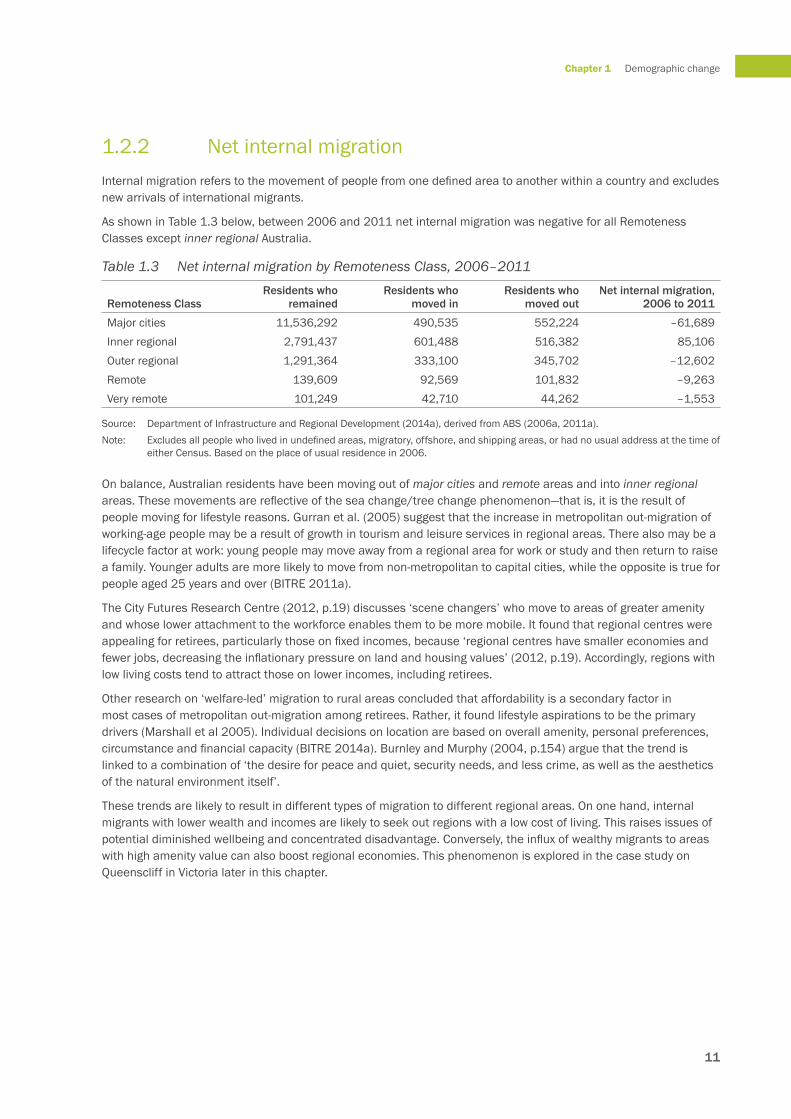
1.2.2 Net internal migrationInternal migration refers to the movement of people from one defined area to another within a country and excludes new arrivals of international migrants.
As shown in Table 1.3 below, between 2006 and 2011 net internal migration was negative for all Remoteness Classes except inner regional Australia.
Table 1.3 Net internal migration by Remoteness Class, 2006–2011
Source: Department of Infrastructure and Regional Development (2014a), derived from ABS (2006a, 2011a).Note: Excludes all people who lived in undefined areas, migratory, offshore, and shipping areas, or had no usual address at the time of
either Census. Based on the place of usual residence in 2006.
On balance, Australian residents have been moving out of major cities and remote areas and into inner regional areas. These movements are reflective of the sea change/tree change phenomenon—that is, it is the result of people moving for lifestyle reasons. Gurran et al. (2005) suggest that the increase in metropolitan out-migration of working-age people may be a result of growth in tourism and leisure services in regional areas. There also may be a lifecycle factor at work: young people may move away from a regional area for work or study and then return to raise a family. Younger adults are more likely to move from non-metropolitan to capital cities, while the opposite is true for people aged 25 years and over (BITRE 2011a).
The City Futures Research Centre (2012, p.19) discusses ‘scene changers’ who move to areas of greater amenity and whose lower attachment to the workforce enables them to be more mobile. It found that regional centres were appealing for retirees, particularly those on fixed incomes, because ‘regional centres have smaller economies and fewer jobs, decreasing the inflationary pressure on land and housing values’ (2012, p.19). Accordingly, regions with low living costs tend to attract those on lower incomes, including retirees.
Other research on ‘welfare-led’ migration to rural areas concluded that affordability is a secondary factor in most cases of metropolitan out-migration among retirees. Rather, it found lifestyle aspirations to be the primary drivers (Marshall et al 2005). Individual decisions on location are based on overall amenity, personal preferences, circumstance and financial capacity (BITRE 2014a). Burnley and Murphy (2004, p.154) argue that the trend is linked to a combination of ‘the desire for peace and quiet, security needs, and less crime, as well as the aesthetics of the natural environment itself’.
These trends are likely to result in different types of migration to different regional areas. On one hand, internal migrants with lower wealth and incomes are likely to seek out regions with a low cost of living. This raises issues of potential diminished wellbeing and concentrated disadvantage. Conversely, the influx of wealthy migrants to areas with high amenity value can also boost regional economies. This phenomenon is explored in the case study on Queenscliff in Victoria later in this chapter.
12
State of Regional Australia 2015 Progress in Australian Regions
1.3 Current issue: ageing in Australia’s regions
1.3.1 The age profilePopulation ageing generally refers to a greater concentration of older residents and a rise in average or median age.
Population ageing in Australia has been caused by a combination of two factors (Productivity Commission 2008). First, lower fertility rates since the 1960s have led to slower growth in younger-age cohorts overall. In 2013, the TFR in Australia was 1.9 babies per woman, compared with three or above between 1946 and 1965. Since 1976, TFR has been below the replacement level, which is estimated to be around 2.1 babies per woman (ABS 2014c).
Secondly, increased longevity has led to growth in the number and proportion of people in older age groups. In the decade to 2013, life expectancy at birth rose by 2.3 years for males (to 80.1 years) and 1.5 years for females (to 84.3 years) (ABS 2014e).
As a result of this increased longevity, the number of people aged 65 and over is expected to increase from 13.4 per cent of the population in June 2007 to 25.3 per cent by 2047. Over the same period, the cohort aged 85 years and above is expected to increase from 1.7 to 5.6 per cent (Productivity Commission 2008).
Hugo (2014) discusses the types of non-metropolitan regions with concentrations of older people. They include coastal resort towns, inland areas with high natural amenity, inland areas near larger cities in which retirees can live without job and commuting considerations, country towns where former farmers move to town and essentially age in place, and agricultural areas beyond the commuting distance of cities. The final category tends to have older age structure due to the out-migration of young people (Hugo 2014).
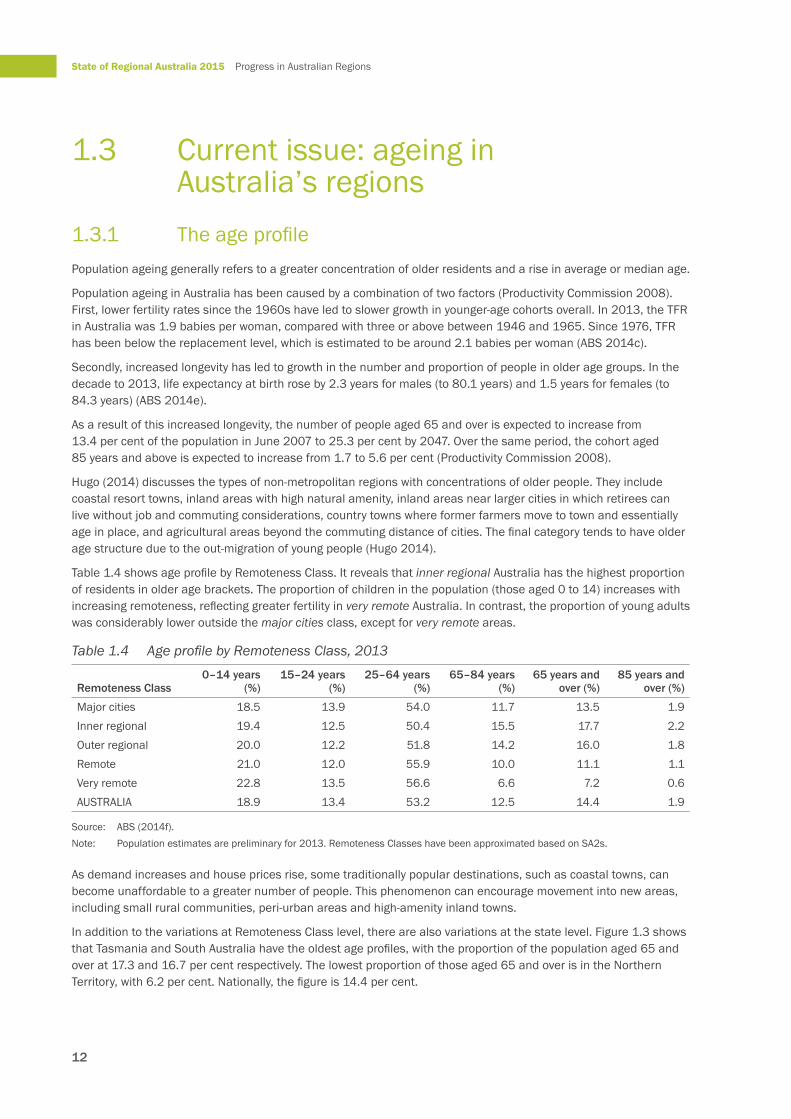
Table 1.4 shows age profile by Remoteness Class. It reveals that inner regional Australia has the highest proportion of residents in older age brackets. The proportion of children in the population (those aged 0 to 14) increases with increasing remoteness, reflecting greater fertility in very remote Australia. In contrast, the proportion of young adults was considerably lower outside the major cities class, except for very remote areas.
Source: ABS (2014f).Note: Population estimates are preliminary for 2013. Remoteness Classes have been approximated based on SA2s.
As demand increases and house prices rise, some traditionally popular destinations, such as coastal towns, can become unaffordable to a greater number of people. This phenomenon can encourage movement into new areas, including small rural communities, peri-urban areas and high-amenity inland towns.
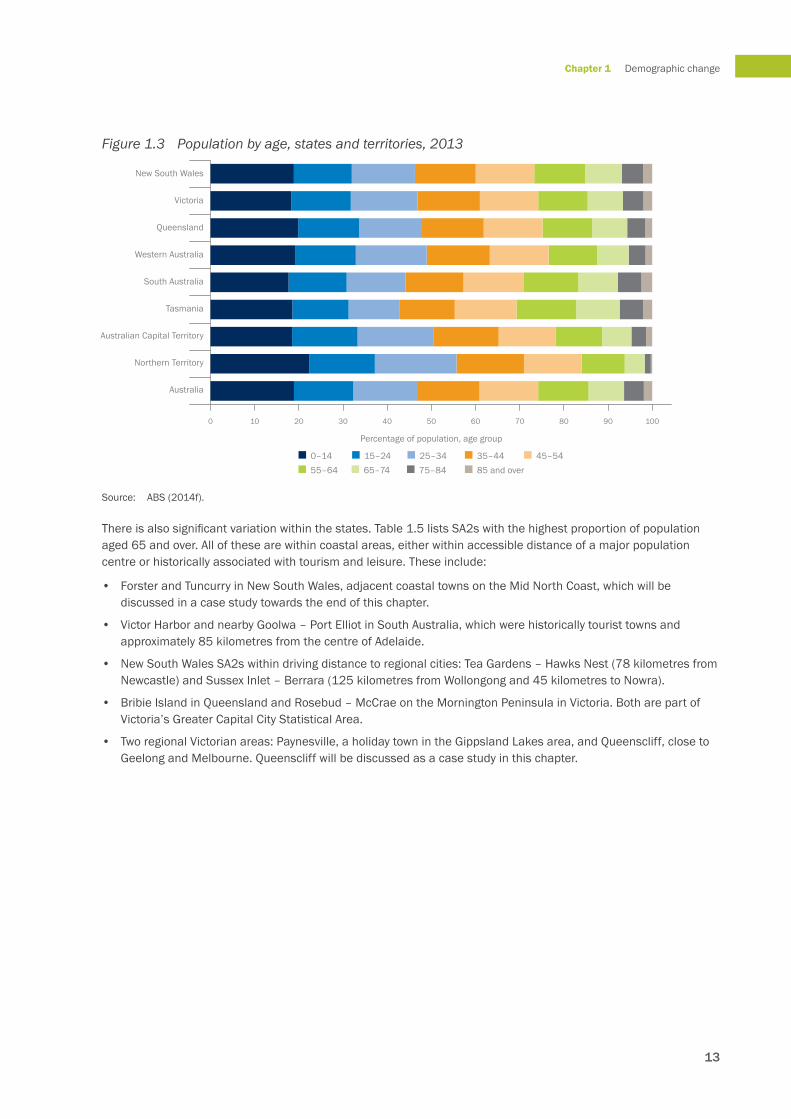
In addition to the variations at Remoteness Class level, there are also variations at the state level. Figure 1.3 shows that Tasmania and South Australia have the oldest age profiles, with the proportion of the population aged 65 and over at 17.3 and 16.7 per cent respectively. The lowest proportion of those aged 65 and over is in the Northern Territory, with 6.2 per cent. Nationally, the figure is 14.4 per cent.
13
Chapter 1 Demographic change
Figure 1.3 Population by age, states and territories, 2013
Source: ABS (2014f).
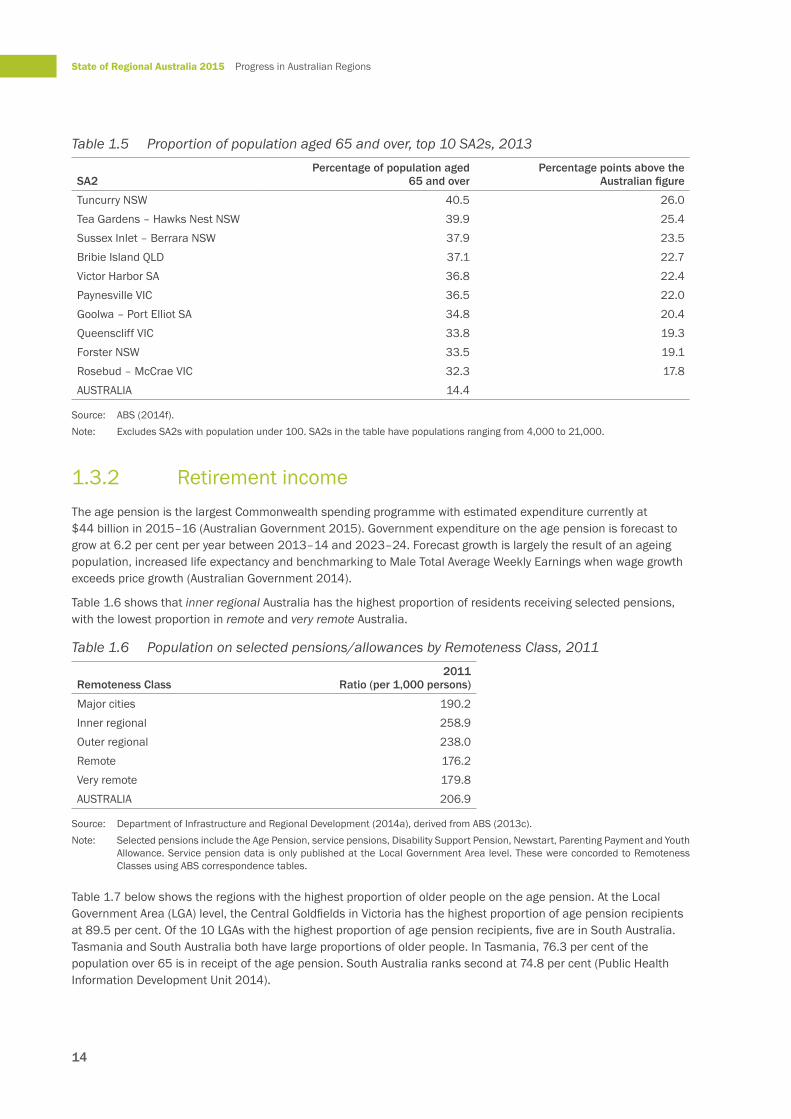
There is also significant variation within the states. Table 1.5 lists SA2s with the highest proportion of population aged 65 and over. All of these are within coastal areas, either within accessible distance of a major population centre or historically associated with tourism and leisure. These include:
• Forster and Tuncurry in New South Wales, adjacent coastal towns on the Mid North Coast, which will be discussed in a case study towards the end of this chapter.
• Victor Harbor and nearby Goolwa – Port Elliot in South Australia, which were historically tourist towns and approximately 85 kilometres from the centre of Adelaide.
• New South Wales SA2s within driving distance to regional cities: Tea Gardens – Hawks Nest (78 kilometres from Newcastle) and Sussex Inlet – Berrara (125 kilometres from Wollongong and 45 kilometres to Nowra).
• Bribie Island in Queensland and Rosebud – McCrae on the Mornington Peninsula in Victoria. Both are part of Victoria’s Greater Capital City Statistical Area.
• Two regional Victorian areas: Paynesville, a holiday town in the Gippsland Lakes area, and Queenscliff, close to Geelong and Melbourne. Queenscliff will be discussed as a case study in this chapter.
0 10 20 30 40 50 60 70 80 90 100
New South Wales
Victoria
Queensland
Western Australia
South Australia
Tasmania
Australian Capital Territory
Northern Territory
Australia
Percentage of population, age group
0–1485 and over
15–24 25–34 35–44 45–5455–64 65–74 75–84
14
State of Regional Australia 2015 Progress in Australian Regions
Table 1.5 Proportion of population aged 65 and over, top 10 SA2s, 2013
Source: ABS (2014f).Note: Excludes SA2s with population under 100. SA2s in the table have populations ranging from 4,000 to 21,000.
1.3.2 Retirement incomeThe age pension is the largest Commonwealth spending programme with estimated expenditure currently at $44 billion in 2015–16 (Australian Government 2015). Government expenditure on the age pension is forecast to grow at 6.2 per cent per year between 2013–14 and 2023–24. Forecast growth is largely the result of an ageing population, increased life expectancy and benchmarking to Male Total Average Weekly Earnings when wage growth exceeds price growth (Australian Government 2014).
Table 1.6 shows that inner regional Australia has the highest proportion of residents receiving selected pensions, with the lowest proportion in remote and very remote Australia.
Table 1.6 Population on selected pensions/allowances by Remoteness Class, 2011
Remoteness Class2011
Ratio (per 1,000 persons)
Major cities 190.2 Inner regional 258.9 Outer regional 238.0 Remote 176.2 Very remote 179.8 AUSTRALIA 206.9
Source: Department of Infrastructure and Regional Development (2014a), derived from ABS (2013c).Note: Selected pensions include the Age Pension, service pensions, Disability Support Pension, Newstart, Parenting Payment and Youth
Allowance. Service pension data is only published at the Local Government Area level. These were concorded to Remoteness Classes using ABS correspondence tables.
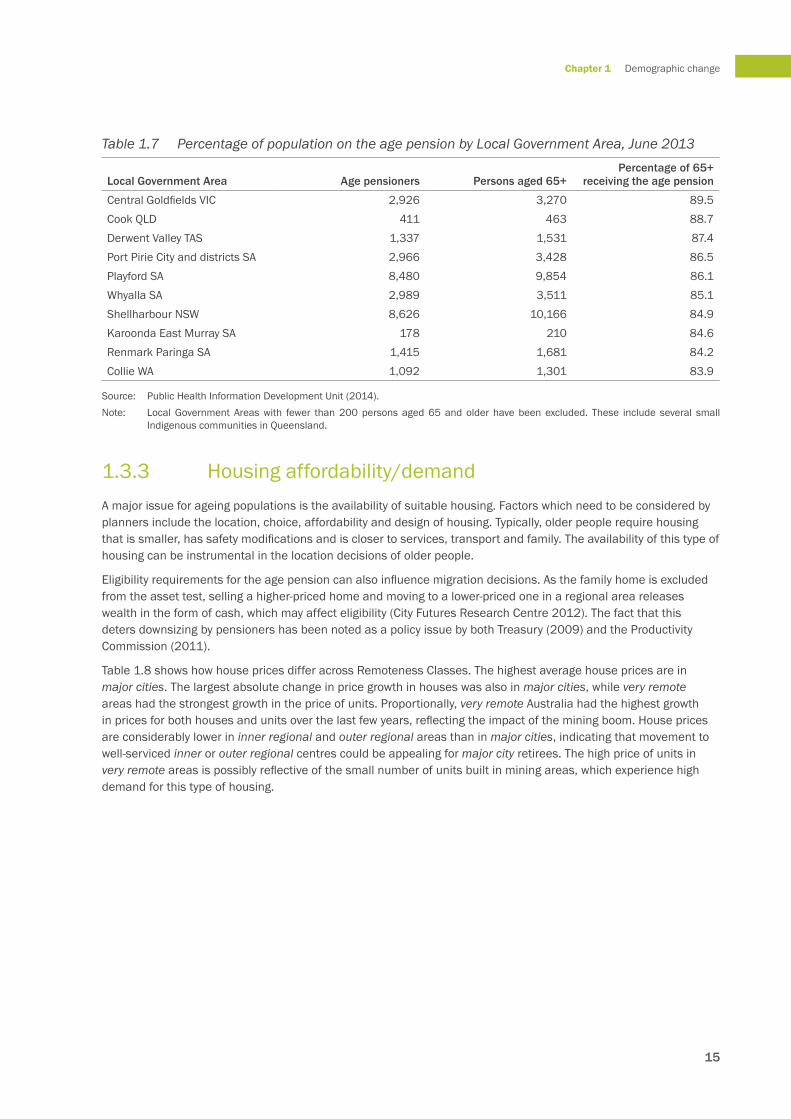
Table 1.7 below shows the regions with the highest proportion of older people on the age pension. At the Local Government Area (LGA) level, the Central Goldfields in Victoria has the highest proportion of age pension recipients at 89.5 per cent. Of the 10 LGAs with the highest proportion of age pension recipients, five are in South Australia. Tasmania and South Australia both have large proportions of older people. In Tasmania, 76.3 per cent of the population over 65 is in receipt of the age pension. South Australia ranks second at 74.8 per cent (Public Health Information Development Unit 2014).
15
Chapter 1 Demographic change
Table 1.7 Percentage of population on the age pension by Local Government Area, June 2013
Local Government Area Age pensioners Persons aged 65+Percentage of 65+
receiving the age pension
Central Goldfields VIC 2,926 3,270 89.5Cook QLD 411 463 88.7Derwent Valley TAS 1,337 1,531 87.4Port Pirie City and districts SA 2,966 3,428 86.5Playford SA 8,480 9,854 86.1Whyalla SA 2,989 3,511 85.1Shellharbour NSW 8,626 10,166 84.9Karoonda East Murray SA 178 210 84.6Renmark Paringa SA 1,415 1,681 84.2Collie WA 1,092 1,301 83.9
Source: Public Health Information Development Unit (2014).Note: Local Government Areas with fewer than 200 persons aged 65 and older have been excluded. These include several small
Indigenous communities in Queensland.
1.3.3 Housing affordability/demandA major issue for ageing populations is the availability of suitable housing. Factors which need to be considered by planners include the location, choice, affordability and design of housing. Typically, older people require housing that is smaller, has safety modifications and is closer to services, transport and family. The availability of this type of housing can be instrumental in the location decisions of older people.
Eligibility requirements for the age pension can also influence migration decisions. As the family home is excluded from the asset test, selling a higher-priced home and moving to a lower-priced one in a regional area releases wealth in the form of cash, which may affect eligibility (City Futures Research Centre 2012). The fact that this deters downsizing by pensioners has been noted as a policy issue by both Treasury (2009) and the Productivity Commission (2011).
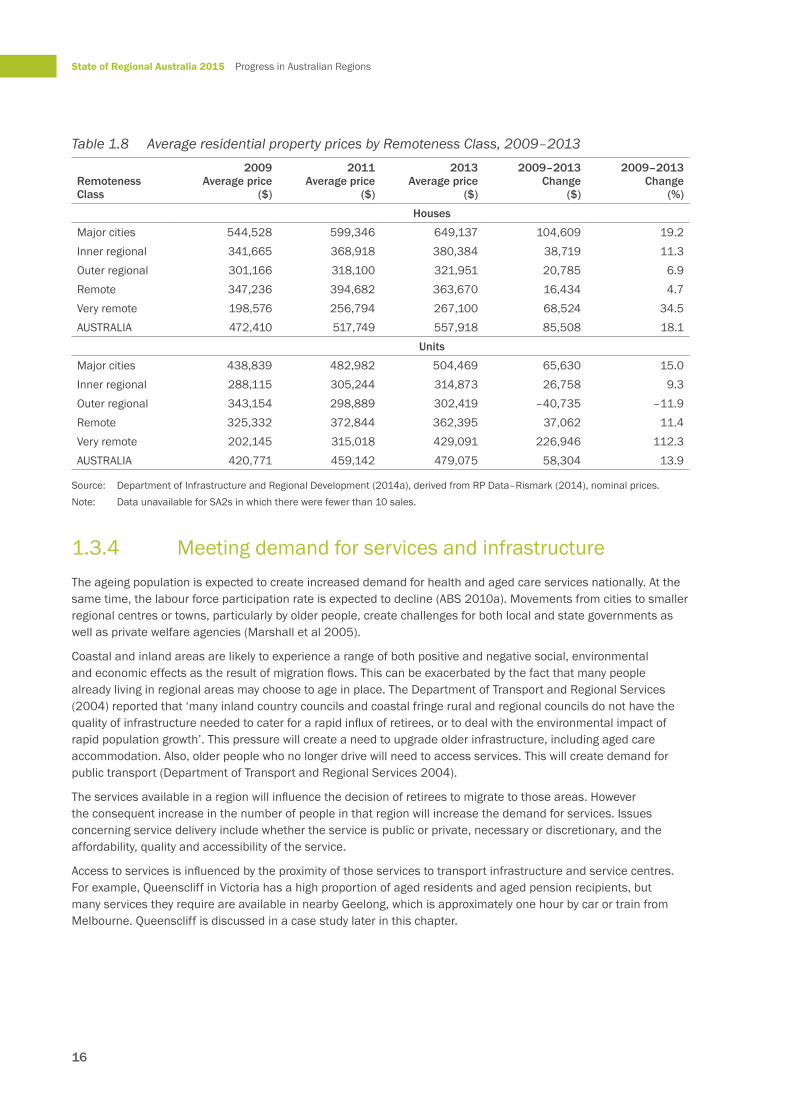
Table 1.8 shows how house prices differ across Remoteness Classes. The highest average house prices are in major cities. The largest absolute change in price growth in houses was also in major cities, while very remote areas had the strongest growth in the price of units. Proportionally, very remote Australia had the highest growth in prices for both houses and units over the last few years, reflecting the impact of the mining boom. House prices are considerably lower in inner regional and outer regional areas than in major cities, indicating that movement to well-serviced inner or outer regional centres could be appealing for major city retirees. The high price of units in very remote areas is possibly reflective of the small number of units built in mining areas, which experience high demand for this type of housing.
16
State of Regional Australia 2015 Progress in Australian Regions
Table 1.8 Average residential property prices by Remoteness Class, 2009–2013
Source: Department of Infrastructure and Regional Development (2014a), derived from RP Data–Rismark (2014), nominal prices. Note: Data unavailable for SA2s in which there were fewer than 10 sales.
1.3.4 Meeting demand for services and infrastructureThe ageing population is expected to create increased demand for health and aged care services nationally. At the same time, the labour force participation rate is expected to decline (ABS 2010a). Movements from cities to smaller regional centres or towns, particularly by older people, create challenges for both local and state governments as well as private welfare agencies (Marshall et al 2005).
Coastal and inland areas are likely to experience a range of both positive and negative social, environmental and economic effects as the result of migration flows. This can be exacerbated by the fact that many people already living in regional areas may choose to age in place. The Department of Transport and Regional Services (2004) reported that ‘many inland country councils and coastal fringe rural and regional councils do not have the quality of infrastructure needed to cater for a rapid influx of retirees, or to deal with the environmental impact of rapid population growth’. This pressure will create a need to upgrade older infrastructure, including aged care accommodation. Also, older people who no longer drive will need to access services. This will create demand for public transport (Department of Transport and Regional Services 2004).
The services available in a region will influence the decision of retirees to migrate to those areas. However the consequent increase in the number of people in that region will increase the demand for services. Issues concerning service delivery include whether the service is public or private, necessary or discretionary, and the affordability, quality and accessibility of the service.
Access to services is influenced by the proximity of those services to transport infrastructure and service centres. For example, Queenscliff in Victoria has a high proportion of aged residents and aged pension recipients, but many services they require are available in nearby Geelong, which is approximately one hour by car or train from Melbourne. Queenscliff is discussed in a case study later in this chapter.
17
Chapter 1 Demographic change
1.3.5 Age dependency ratioThe age dependency ratio is the number of people aged 65 and over as a percentage of working-age people (those aged between 15 and 64). A higher age dependency ratio means that there are fewer people of working age relative to the older, non-working population. The age dependency ratio provides an indication of the age structure of a region.
Population ageing will result in a higher ratio of the elderly compared with those of traditional working age. This trend is evident in the fact that the number of people aged between 15 and 64 for every person aged 65 and over has fallen from 7.3 in 1974–75 to an estimated 4.5 today. This figure is projected to nearly halve again to 2.7 by 2054–55 (Treasury 2015).
A higher dependency ratio could potentially result in labour shortages, as there may be insufficient numbers of workers. There is also the possibility of reduced productivity growth as the result of a diminished productive population. Although this is not a specifically regional issue given that income taxes are collected federally, a higher age dependency ratio can result in increased pressures on government finances and productivity.
However, this age group may also provide opportunities for local economies in terms of bringing wealth (retirement savings and superannuation) to spend in a region.
There may be a challenge in finding qualified workers to boost the working-age population and reduce the age dependency ratio in some regional areas. However, the services that will be required in any one region will depend upon the profile of the older people within that region (for example, their level of wealth and health needs).
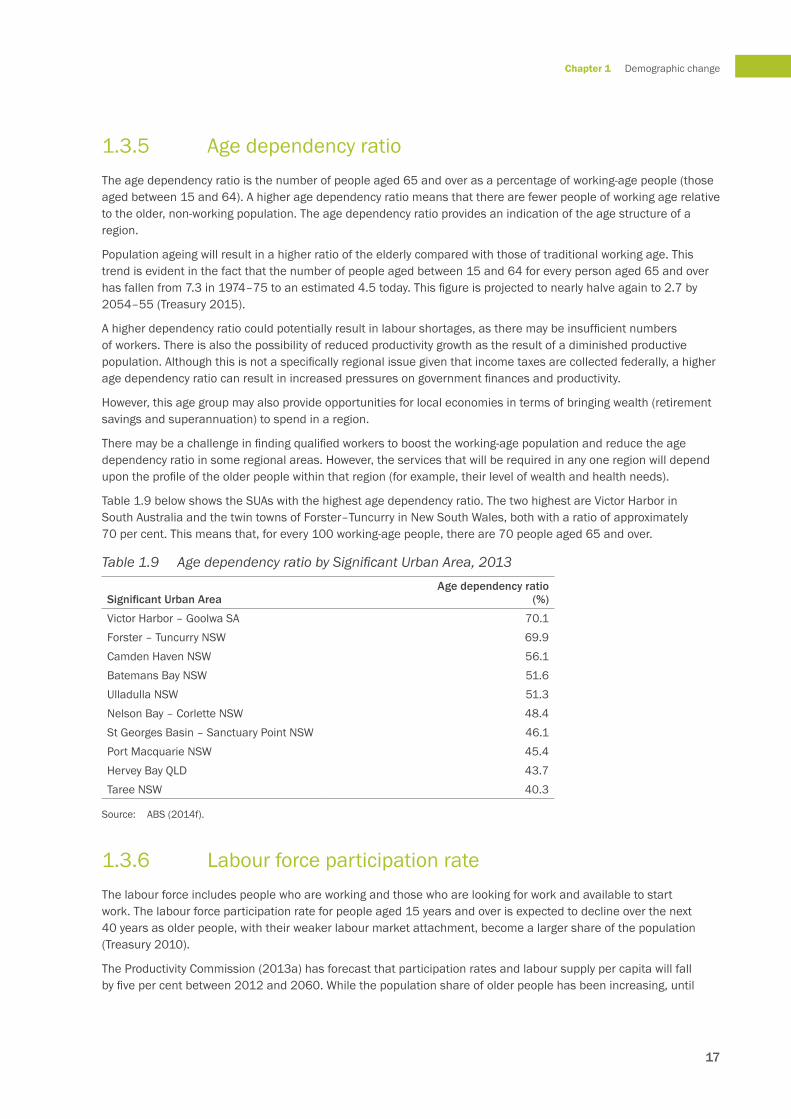
Table 1.9 below shows the SUAs with the highest age dependency ratio. The two highest are Victor Harbor in South Australia and the twin towns of Forster–Tuncurry in New South Wales, both with a ratio of approximately 70 per cent. This means that, for every 100 working-age people, there are 70 people aged 65 and over.
Table 1.9 Age dependency ratio by Significant Urban Area, 2013
Significant Urban AreaAge dependency ratio
(%)
Victor Harbor – Goolwa SA 70.1Forster – Tuncurry NSW 69.9Camden Haven NSW 56.1Batemans Bay NSW 51.6Ulladulla NSW 51.3Nelson Bay – Corlette NSW 48.4St Georges Basin – Sanctuary Point NSW 46.1Port Macquarie NSW 45.4Hervey Bay QLD 43.7Taree NSW 40.3
Source: ABS (2014f).
1.3.6 Labour force participation rateThe labour force includes people who are working and those who are looking for work and available to start work. The labour force participation rate for people aged 15 years and over is expected to decline over the next 40 years as older people, with their weaker labour market attachment, become a larger share of the population (Treasury 2010).
The Productivity Commission (2013a) has forecast that participation rates and labour supply per capita will fall by five per cent between 2012 and 2060. While the population share of older people has been increasing, until
18
State of Regional Australia 2015 Progress in Australian Regions
recently the rising level of workforce participation by older people was able to offset this. However, participation rates for older people in the last few years have levelled off (Kent 2014).
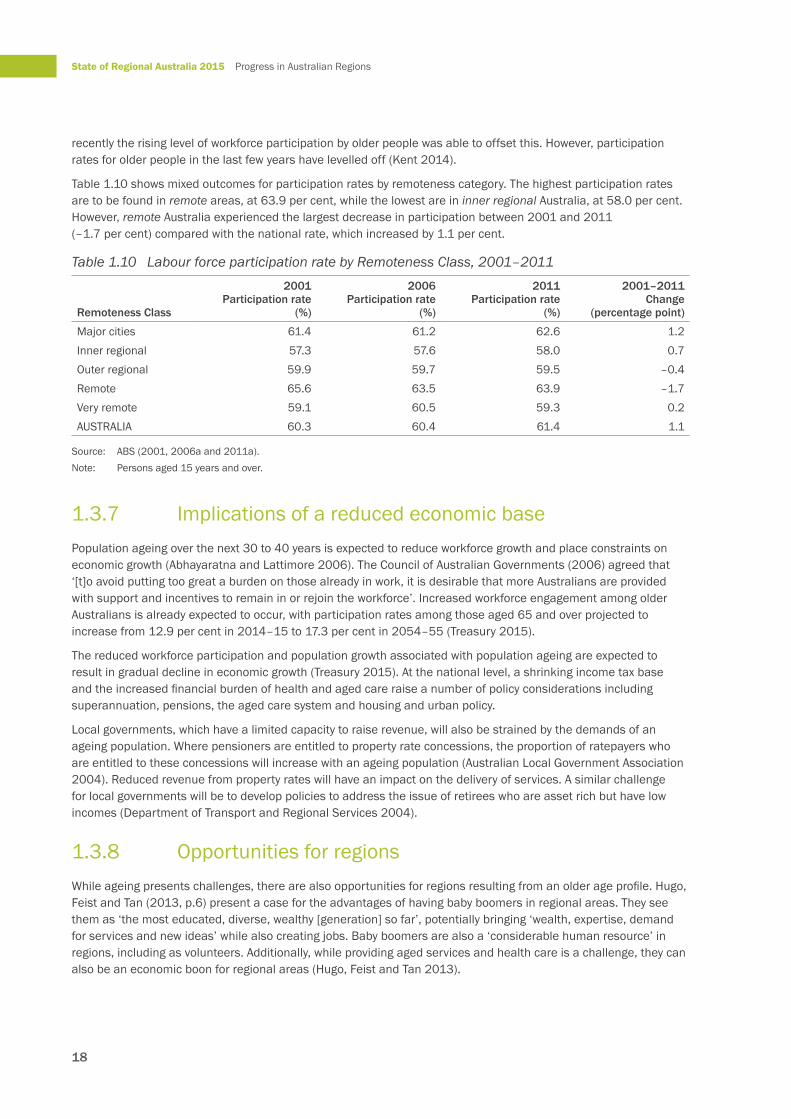
Table 1.10 shows mixed outcomes for participation rates by remoteness category. The highest participation rates are to be found in remote areas, at 63.9 per cent, while the lowest are in inner regional Australia, at 58.0 per cent. However, remote Australia experienced the largest decrease in participation between 2001 and 2011 (–1.7 per cent) compared with the national rate, which increased by 1.1 per cent.
Table 1.10 Labour force participation rate by Remoteness Class, 2001–2011
Source: ABS (2001, 2006a and 2011a).Note: Persons aged 15 years and over.
1.3.7 Implications of a reduced economic basePopulation ageing over the next 30 to 40 years is expected to reduce workforce growth and place constraints on economic growth (Abhayaratna and Lattimore 2006). The Council of Australian Governments (2006) agreed that ‘[t]o avoid putting too great a burden on those already in work, it is desirable that more Australians are provided with support and incentives to remain in or rejoin the workforce’. Increased workforce engagement among older Australians is already expected to occur, with participation rates among those aged 65 and over projected to increase from 12.9 per cent in 2014–15 to 17.3 per cent in 2054–55 (Treasury 2015).
The reduced workforce participation and population growth associated with population ageing are expected to result in gradual decline in economic growth (Treasury 2015). At the national level, a shrinking income tax base and the increased financial burden of health and aged care raise a number of policy considerations including superannuation, pensions, the aged care system and housing and urban policy.
Local governments, which have a limited capacity to raise revenue, will also be strained by the demands of an ageing population. Where pensioners are entitled to property rate concessions, the proportion of ratepayers who are entitled to these concessions will increase with an ageing population (Australian Local Government Association 2004). Reduced revenue from property rates will have an impact on the delivery of services. A similar challenge for local governments will be to develop policies to address the issue of retirees who are asset rich but have low incomes (Department of Transport and Regional Services 2004).
1.3.8 Opportunities for regionsWhile ageing presents challenges, there are also opportunities for regions resulting from an older age profile. Hugo, Feist and Tan (2013, p.6) present a case for the advantages of having baby boomers in regional areas. They see them as ‘the most educated, diverse, wealthy [generation] so far’, potentially bringing ‘wealth, expertise, demand for services and new ideas’ while also creating jobs. Baby boomers are also a ‘considerable human resource’ in regions, including as volunteers. Additionally, while providing aged services and health care is a challenge, they can also be an economic boon for regional areas (Hugo, Feist and Tan 2013).
19
Chapter 1 Demographic change
1.4 Case studiesThe following case studies explore the characteristics of three regions with ageing populations. The regions are notably different in terms of amenity, size, wealth and income. They are the Mid North Coast SA4 in New South Wales, Queenscliff in Victoria and the Barossa – Yorke – Mid North SA4 in South Australia. The studies illustrate the range of factors that are taken into consideration—for example, income, housing affordability and service availability—when people choose a place to which to retire.
The variations seen in the three regions indicate that different types of regions appeal to people with different socioeconomic characteristics. These differences have implications for local economies and create both benefits and challenges for the communities concerned. Strategies that are flexible and tailored for each region will be required to address the anticipated effects of demographic trends.
Two of the regions selected for case studies on this issue—the Mid North Coast in New South Wales and Barossa – Yorke – Mid North in South Australia—exhibit considerable internal variation. They also differ from one another in that the Mid North Coast region contains a number of larger centres, while the Barossa – Yorke – Mid North region has only one large centre.
1.4.1 Case Study 1
The Mid North Coast
CharacteristicsThe Mid North Coast SA4 is located in New South Wales, approximately halfway between south–east Queensland and the Sydney–Newcastle region.
In 2011 the Mid North Coast had the lowest real median weekly household income of all SA4s ($774) when compared with the national figure of $1,234 (Department of Infrastructure and Regional Development 2014a).
The broader SA4 region contains a number of SUAs. The three SUAs within the SA4 that will be the focus of this case study are Port Macquarie, Forster–Tuncurry and Taree. Some data will be presented at the SA2 level to illustrate further variation within the region.
Port Macquarie is a coastal town with a relatively high population (44,108). It enjoys good access to higher order services such as Port Macquarie Base Hospital as well as the campuses of Charles Sturt University, and the Port Macquarie campus of University of Newcastle. Taree (population 26,531) is on the Manning River, close to but not on the coast. Forster and Tuncurry (population 20,543) are adjacent coastal towns, 305 kilometres or under three and a half hours drive from Sydney.
The SA4 region is also a popular tourist destination. In 2012–13, after Sydney and Melbourne, the coastal region north of Newcastle to Coffs Harbour was the third most visited location for domestic visitors in the year to September 2014. Within this region, Port Macquarie – East was the SA2 most visited in terms of both the number of domestic visitors and the number of nights stayed (Tourism Research Australia 2013, 2014).
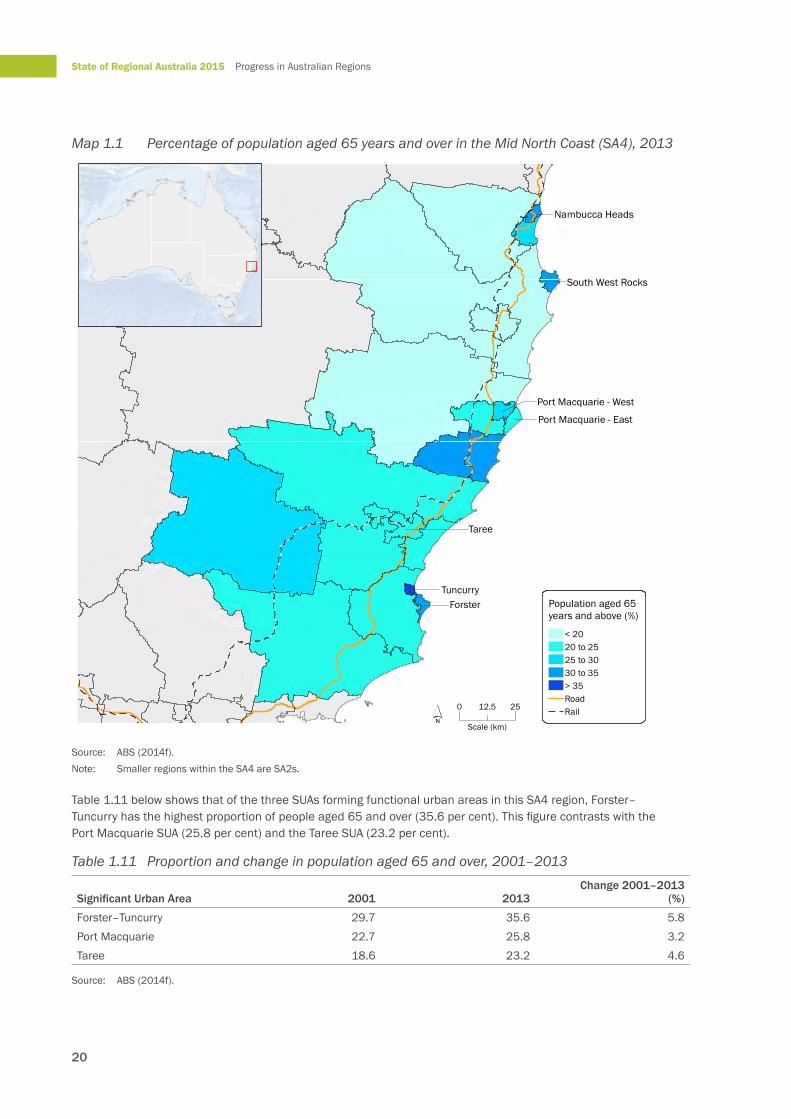
Proportion of the population aged 65 years or olderMap 1.1 shows the proportion of the population aged 65 years or older within the each of the three SA2 sub-regions of the Mid North Coast SA4. Map 1.1 reveals that much of the Mid North Coast has an older age profile. The Australian proportion is only 14.4 per cent, less than half of some regions in this area. The older age profile is particularly pronounced in the focus area of Forster–Tuncurry where more than 30 per cent of its population is aged 65 and over.
20
State of Regional Australia 2015 Progress in Australian Regions
Map 1.1 Percentage of population aged 65 years and over in the Mid North Coast (SA4), 2013
Source: ABS (2014f). Note: Smaller regions within the SA4 are SA2s.
Table 1.11 below shows that of the three SUAs forming functional urban areas in this SA4 region, Forster–Tuncurry has the highest proportion of people aged 65 and over (35.6 per cent). This figure contrasts with the Port Macquarie SUA (25.8 per cent) and the Taree SUA (23.2 per cent).
Table 1.11 Proportion and change in population aged 65 and over, 2001–2013
Percentage of population aged 65 years and over in the Mid North Coast (SA4), 2013
21
Chapter 1 Demographic change
However, between 2001 and 2013, the proportion of Forster’s population aged 65 years and over increased by 6.6 per cent in contrast with Tuncurry’s, which increased by 4.4 per cent in the same period.
Labour force participation rateAn indicator of economic activity is the labour force participation rate. Table 1.12 shows that while the participation rate increased in Port Macquarie between 2001 and 2011, it decreased in both Forster–Tuncurry (–1.2 per cent) and Taree (–2.3 per cent). However, while Taree had the greater decrease, Forster–Tuncurry’s participation rate was 8.2 percentage points lower than that of Taree.
Table 1.12 Labour force participation rate, Mid North Coast SUAs, 2001, 2006 and 2011Significant Urban Area 2001 2006 2011 Change 2001–2011
Source: ABS (2001, 2006a and 2011a). Note: Persons aged 15 years and over.
Source of incomeRelated to the participation rate is source of income. Data on age pension recipients is available only at LGA level. Table 1.13 shows that all three LGAs in the area have very high proportions of residents in receipt of the age pension. The Great Lakes LGA, which includes Forster–Tuncurry, has the lowest percentage of age pensioners (75.6 per cent).
Table 1.13 Age pension recipients, Mid North Coast Local Government Areas, 2013
Local Government Area Age pensionersPersons aged 65 years
Source: Public Health Information Development Unit (2014).
The three SUAs also have quite different age dependency ratios. Forster–Tuncurry’s is particularly high at 69.9 per cent compared with Port Macquarie (45.4 per cent) and Taree (40.3 per cent) (ABS 2014f). These differences suggest that future service delivery requirements in each of these SUAs will differ.
House pricesHouse prices are indicative of the wealth of individuals in a region and their level of resources. The average house price for the Mid North Coast in 2013 was $367,949. However, Table 1.14 shows that at the SUA level, between 2009 and 2013 the Port Macquarie SUA experienced the highest growth in house prices (11 per cent) compared with Forster–Tuncurry and Taree (four per cent and five per cent respectively).
When analysed at the SA2 level, within Port Macquarie the growth was particularly concentrated in the SA2 of Port Macquarie West (at 16 per cent), the rate of which is more than double that of the Mid North Coast SA4 as a whole.
22
State of Regional Australia 2015 Progress in Australian Regions
Table 1.14 House prices, Mid North Coast SA4, 2009–2013
Source of internal migrationCensus data shows that between 2006 and 2011 the largest source of internal migrants for Forster–Tuncurry was from areas in New South Wales outside SUAs (1,150). The second-largest source of internal migrants was the Sydney SUA (1,141). These two SUAs (areas in New South Wales outside SUAs and Sydney) were also the largest source of internal migrants for the Port Macquarie and Taree SUAs.
People who are moving from the Sydney SUA may be migrating to the Mid North Coast SA4 to free capital tied up in their housing. For retirees, the choice to move to the Mid North Coast is also likely to reflect their ability to live in a high-amenity area now that they are no longer constrained by employment considerations. Internal migration to the Mid North Coast suggests migration to a lower-cost area with high natural amenity.
ConclusionsOverall, the Mid North Coast region has an ageing population, with both a high proportion of its population aged 65 and over and a low workforce participation rate. In addition, there is a relatively high dependency on the age pension. Furthermore, the SA2 with the highest house prices, Port Macquarie West, also has one of the highest proportions of population aged 65 and over. This indicates that there is a deliberate shift to a high-amenity area for those who are able to afford to do so. Because the area is well serviced and has relatively high house prices, its ageing population is less likely to face the same infrastructure and service challenges as areas that have lower wealth profiles, suggested by the lower house prices and access to fewer services.
1.4.2 Case Study 2
Queenscliff
CharacteristicsThe SA2 of Queenscliff is on the Bellarine Peninsula in southern Victoria and has a population of 4,155 (ABS 2014f). It is a former 1880s seaside resort that declined in the 1960s. However, it began to experience an increase in population from the 1990s.
Queenscliff lies within the SA4 of Geelong and the SUA of Ocean Grove – Point Lonsdale. The area enjoys two main advantages. Firstly, its proximity to Geelong (31 kilometres away) provides easy access to a major service centre. Secondly, Geelong is only 75 kilometres from Melbourne.
23
Chapter 1 Demographic change
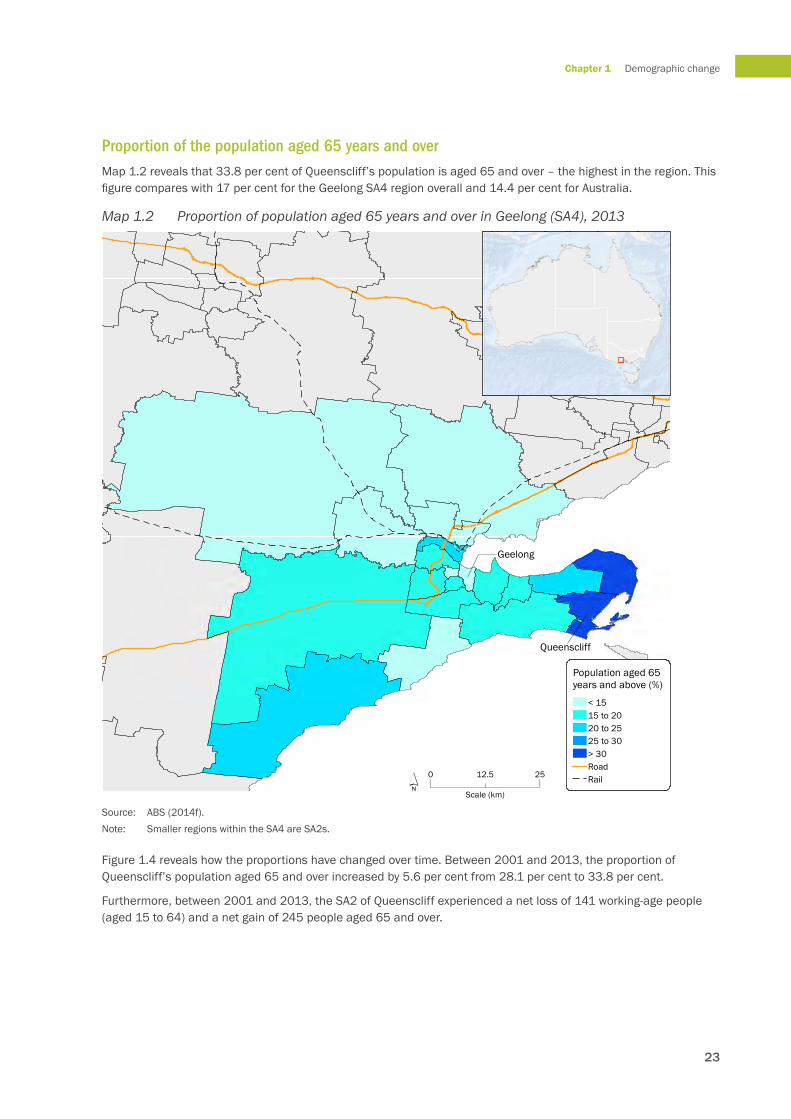
Proportion of the population aged 65 years and overMap 1.2 reveals that 33.8 per cent of Queenscliff’s population is aged 65 and over – the highest in the region. This figure compares with 17 per cent for the Geelong SA4 region overall and 14.4 per cent for Australia.
Map 1.2 Proportion of population aged 65 years and over in Geelong (SA4), 2013
Source: ABS (2014f). Note: Smaller regions within the SA4 are SA2s.
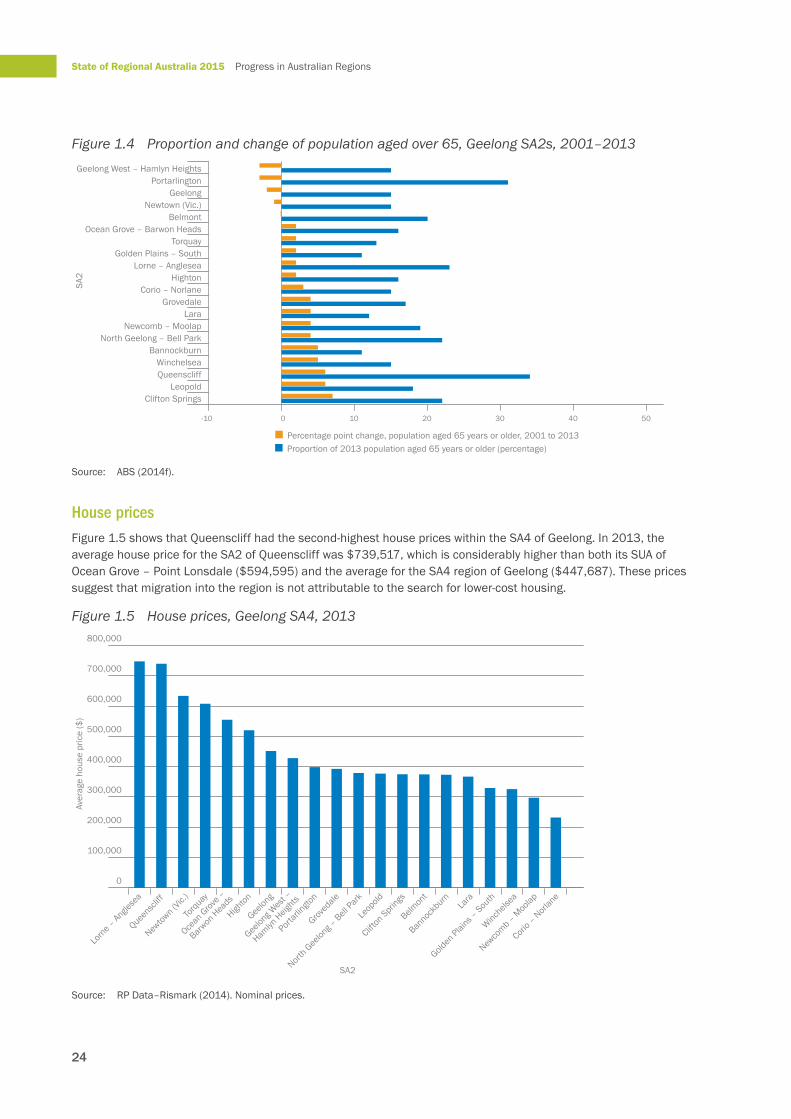
Figure 1.4 reveals how the proportions have changed over time. Between 2001 and 2013, the proportion of Queenscliff’s population aged 65 and over increased by 5.6 per cent from 28.1 per cent to 33.8 per cent.
Furthermore, between 2001 and 2013, the SA2 of Queenscliff experienced a net loss of 141 working-age people (aged 15 to 64) and a net gain of 245 people aged 65 and over.
Queenscliff
Geelong
0 2512.5
Scale (km)´
Population aged 65 years and above (%)
< 1515 to 2020 to 2525 to 30> 30RoadRail
Percentage of population aged 65 years and over in Geelong (SA4), 2013
24
State of Regional Australia 2015 Progress in Australian Regions
Figure 1.4 Proportion and change of population aged over 65, Geelong SA2s, 2001–2013
Source: ABS (2014f).
House pricesFigure 1.5 shows that Queenscliff had the second-highest house prices within the SA4 of Geelong. In 2013, the average house price for the SA2 of Queenscliff was $739,517, which is considerably higher than both its SUA of Ocean Grove – Point Lonsdale ($594,595) and the average for the SA4 region of Geelong ($447,687). These prices suggest that migration into the region is not attributable to the search for lower-cost housing.
Figure 1.5 House prices, Geelong SA4, 2013
Source: RP Data–Rismark (2014). Nominal prices.
-10 0 10 20 30 40 50
Geelong West – Hamlyn HeightsPortarlington
GeelongNewtown (Vic.)
BelmontOcean Grove – Barwon Heads
TorquayGolden Plains – South
Lorne – AngleseaHighton
Corio – NorlaneGrovedale
LaraNewcomb – Moolap
North Geelong – Bell ParkBannockburn
WinchelseaQueenscliff
LeopoldClifton Springs
Proportion of 2013 population aged 65 years or older (percentage)Percentage point change, population aged 65 years or older, 2001 to 2013
SA2
0
100,000
200,000
300,000
400,000
500,000
600,000
700,000
800,000
Corio –
Norlan
e
Newco
mb – Moo
lap
Winchels
ea
Golden
Plains –
South
Lara
Bannoc
kburn
Belmon
t
Clifton
Springs
Leop
old
North Gee
long –
Bell Park
Groved
ale
Portarl
ington
Geelon
g Wes
t –
Hamlyn
Heights
Geelon
g
Highton
Ocean
Grove –
Barwon
Heads
Torqu
ay
Newtow
n (Vic.
)
Queensc
liff
Lorne –
Anglese
a
SA2
Aver
age
hous
e pr
ice
($)
25
Chapter 1 Demographic change
Labour force participation rateWithin the Geelong SA4, the SA2s of Portarlington (41.9 per cent) and Queenscliff (47.7 per cent) had the lowest labour force participation rates. The participation rate for Geelong was 59.4 per cent (ABS 2001, 2006a and 2011a).
In combination with Queenscliff’s high house prices, its low participation rate suggests that people of high wealth and low attachment to the workforce move to the area that has high natural amenity in addition to the advantage of proximity to Melbourne and Geelong and the services they provide.
Age dependency ratioIn 2013 the age dependency ratio for Queenscliff was 65.1 per cent (ABS 2014f). The age dependency ratio for the Geelong SA4 region is less than half that of Queenscliff, at 26.5 per cent. However, given that Queenscliff is part of the larger functional area of Geelong, with its attendant workforce and services, its high age dependency ratio may not necessarily pose the problem that the figures suggest.
Source of incomeThe percentage of those who are aged 65 and over and in receipt of the age pension in the Borough of Queenscliffe6 is 58.8 per cent. The figure is considerably lower than the figure of 70.9 per cent for Victoria (Public Health Information Development Unit 2014). This suggests that Queenscliff has a comparatively larger number of self-funded retirees compared with the rest of the state.
Source of internal migrationBetween 2006 and 2011 the major source of internal migrants to the Ocean Grove – Point Lonsdale SUA, in which Queenscliff lies, was Melbourne (2,008 persons), followed by nearby Geelong (882 persons). As Melbourne and Geelong are larger urban areas with a high level of services, migration is unlikely to be attributable to a desire to be closer to services. It is more likely to be because internal migrants are seeking other amenity values—for example, landscape—while retaining reasonable proximity to services.
ConclusionsGiven that house prices are much higher in Ocean Grove – Point Lonsdale compared with Geelong, it is likely that retirees have migrated for lifestyle rather than economic reasons.
Because Queenscliff is well serviced by transport infrastructure links to both Geelong and Melbourne, has a high wealth profile suggested by its house prices and relatively low reliance on the age pension, its ageing population is less likely to pose an economic challenge for the region.
6 The Borough of Queenscliffe is a very small local government area of 11 square kilometres, encompassing Queenscliff, Point Lonsdale and Swan Bay (Borough of Queenscliffe 2013).
26
State of Regional Australia 2015 Progress in Australian Regions
1.4.3 Case Study 3
Barossa – Yorke – Mid North
CharacteristicsThe Barossa – Yorke – Mid North SA4 covers the Yorke Peninsula and the area of South Australia from immediately north of Adelaide to Peterborough and its surrounds.
The region has a population of 109,188, mostly comprising smaller towns. Port Pirie is by far the largest centre (14,319 people in 2013)7 and is considerably smaller than Port Macquarie in the Mid North Coast (44,180). Some of the region’s comparatively larger towns include Nuriootpa, Kadina and Wallaroo.
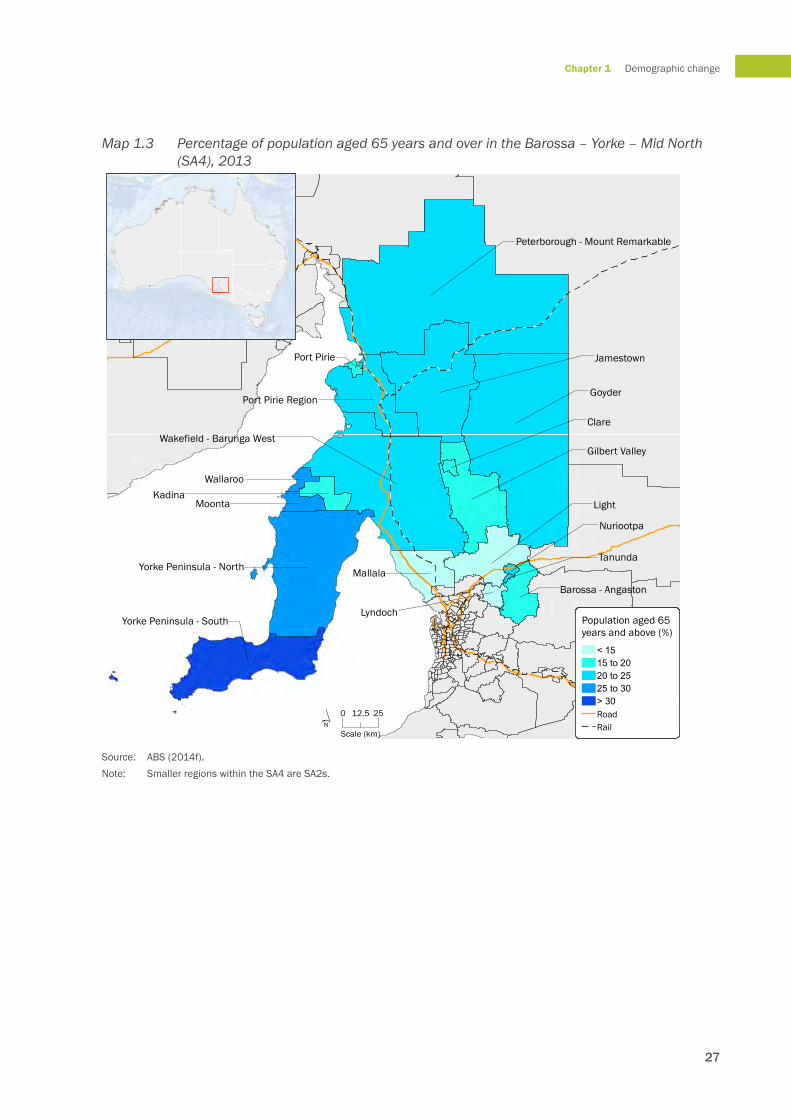
Proportion of the population aged over 65 yearsMap 1.3 shows the variation in ageing populations in SA2s within the Barossa – Yorke – Mid North region. SA2s with particularly high proportions of those aged 65 years and over include North and South Yorke Peninsula, Moonta, Wallaroo and Peterborough – Mount Remarkable. These SA2s have between 25 and 31 per cent of their population aged 65 and over compared with the Australian proportion of 14.4 per cent.
The SA2s with the lowest proportion of older people are Light, Mallala and Lyndoch, which are also those closest to Adelaide. The larger proportion of working age people is likely to relate to the commutable distance between these SA2s and Adelaide.
7 Refers to both the SA2 and SUA.
27
Chapter 1 Demographic change
Map 1.3 Percentage of population aged 65 years and over in the Barossa – Yorke – Mid North (SA4), 2013
Source: ABS (2014f). Note: Smaller regions within the SA4 are SA2s.
Peterborough - Mount Remarkable
Yorke Peninsula - South
Yorke Peninsula - North
Moonta
Wallaroo
Clare
Port Pirie
Goyder
Jamestown
Light
Wakefield - Barunga West
Mallala
Gilbert Valley
Port Pirie Region
Kadina
Barossa - Angaston
Lyndoch
Nuriootpa
Tanunda
0 2512.5
Scale (km)´
Population aged 65 years and above (%)
< 1515 to 2020 to 2525 to 30> 30RoadRail
Percentage of population aged 65 years and over in Barossa York Mid North (SA2), 2013
28
State of Regional Australia 2015 Progress in Australian Regions
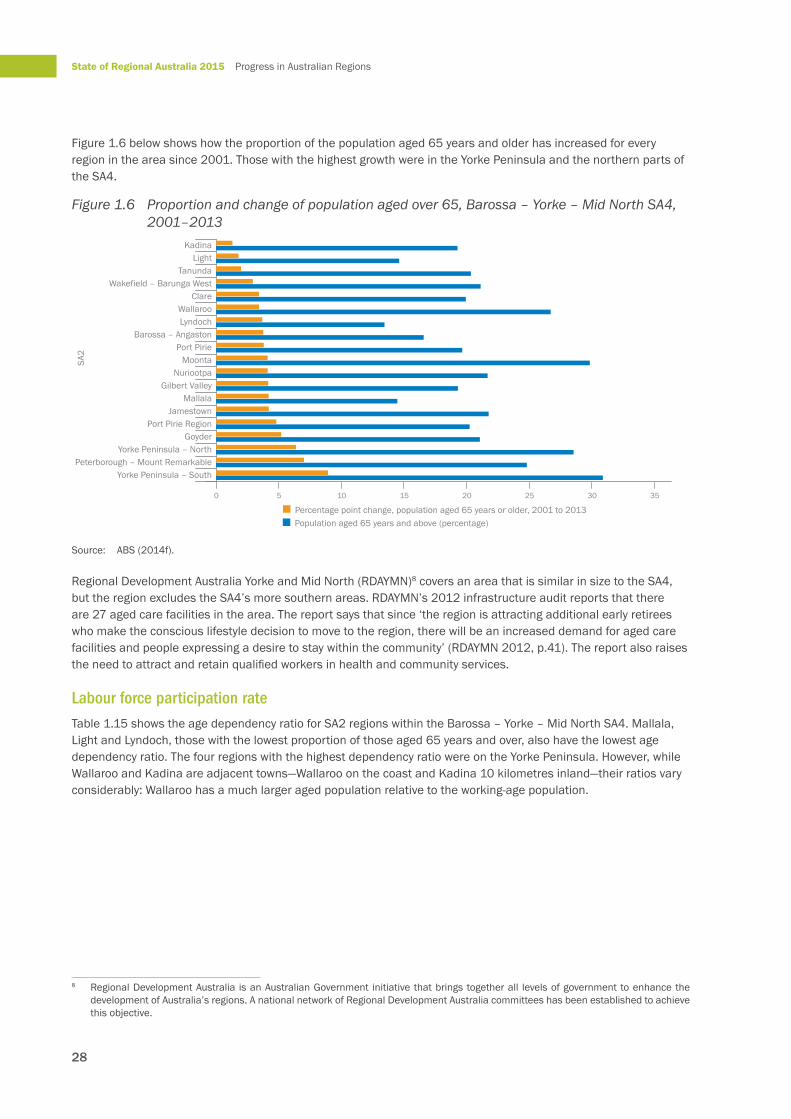
Figure 1.6 below shows how the proportion of the population aged 65 years and older has increased for every region in the area since 2001. Those with the highest growth were in the Yorke Peninsula and the northern parts of the SA4.
Figure 1.6 Proportion and change of population aged over 65, Barossa – Yorke – Mid North SA4, 2001–2013
Source: ABS (2014f).
Regional Development Australia Yorke and Mid North (RDAYMN)8 covers an area that is similar in size to the SA4, but the region excludes the SA4’s more southern areas. RDAYMN’s 2012 infrastructure audit reports that there are 27 aged care facilities in the area. The report says that since ‘the region is attracting additional early retirees who make the conscious lifestyle decision to move to the region, there will be an increased demand for aged care facilities and people expressing a desire to stay within the community’ (RDAYMN 2012, p.41). The report also raises the need to attract and retain qualified workers in health and community services.
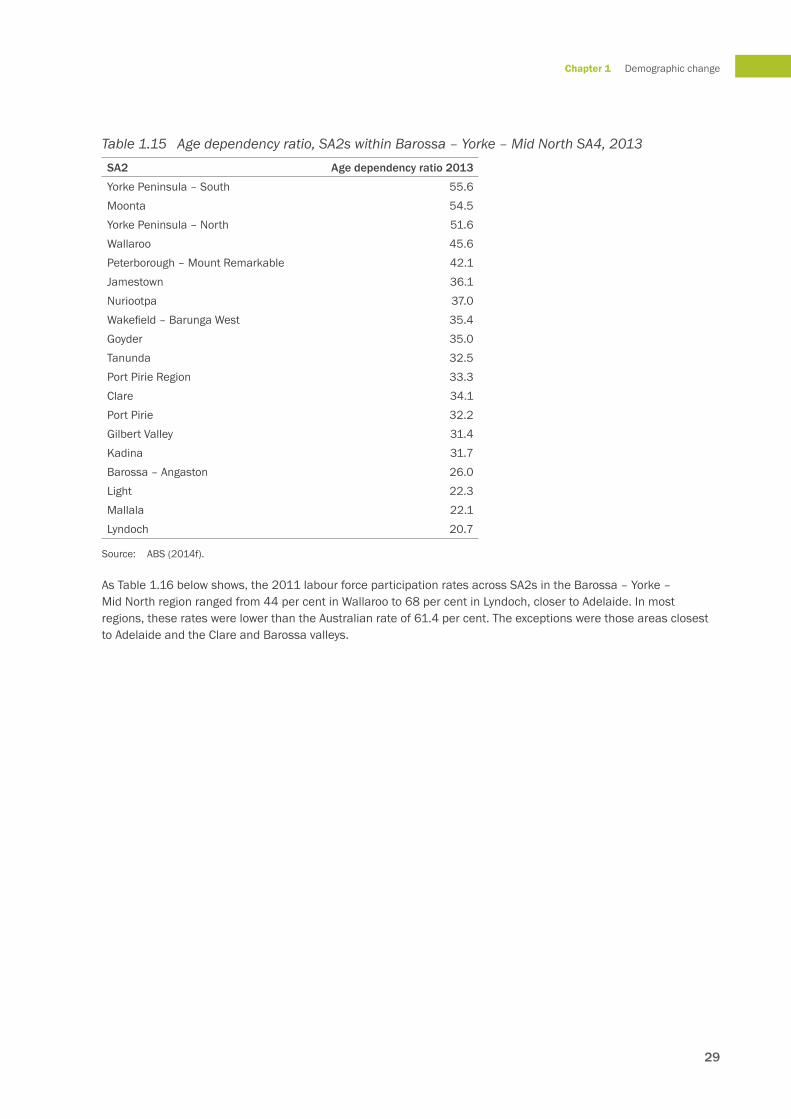
Labour force participation rateTable 1.15 shows the age dependency ratio for SA2 regions within the Barossa – Yorke – Mid North SA4. Mallala, Light and Lyndoch, those with the lowest proportion of those aged 65 years and over, also have the lowest age dependency ratio. The four regions with the highest dependency ratio were on the Yorke Peninsula. However, while Wallaroo and Kadina are adjacent towns—Wallaroo on the coast and Kadina 10 kilometres inland—their ratios vary considerably: Wallaroo has a much larger aged population relative to the working-age population.
8 Regional Development Australia is an Australian Government initiative that brings together all levels of government to enhance the development of Australia’s regions. A national network of Regional Development Australia committees has been established to achieve this objective.
0 5 10 15 20 25 30 35
KadinaLight
TanundaWakefield – Barunga West
ClareWallarooLyndoch
Barossa – AngastonPort Pirie
MoontaNuriootpa
Gilbert ValleyMallala
JamestownPort Pirie Region
GoyderYorke Peninsula – North
Peterborough – Mount RemarkableYorke Peninsula – South
Population aged 65 years and above (percentage)Percentage point change, population aged 65 years or older, 2001 to 2013
SA2
29
Chapter 1 Demographic change
Table 1.15 Age dependency ratio, SA2s within Barossa – Yorke – Mid North SA4, 2013SA2 Age dependency ratio 2013
Yorke Peninsula – South 55.6 Moonta 54.5 Yorke Peninsula – North 51.6 Wallaroo 45.6 Peterborough – Mount Remarkable 42.1 Jamestown 36.1 Nuriootpa 37.0 Wakefield – Barunga West 35.4 Goyder 35.0 Tanunda 32.5 Port Pirie Region 33.3 Clare 34.1 Port Pirie 32.2 Gilbert Valley 31.4 Kadina 31.7 Barossa – Angaston 26.0 Light 22.3 Mallala 22.1 Lyndoch 20.7
Source: ABS (2014f).
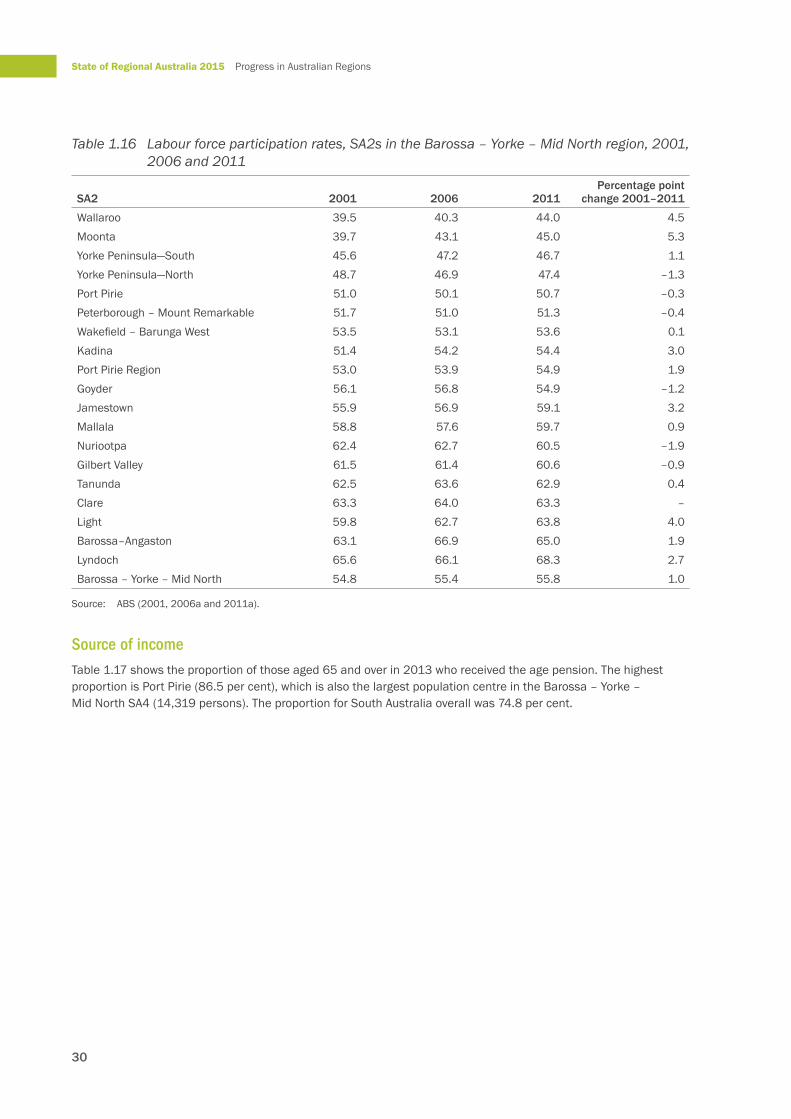
As Table 1.16 below shows, the 2011 labour force participation rates across SA2s in the Barossa – Yorke – Mid North region ranged from 44 per cent in Wallaroo to 68 per cent in Lyndoch, closer to Adelaide. In most regions, these rates were lower than the Australian rate of 61.4 per cent. The exceptions were those areas closest to Adelaide and the Clare and Barossa valleys.
30
State of Regional Australia 2015 Progress in Australian Regions
Table 1.16 Labour force participation rates, SA2s in the Barossa – Yorke – Mid North region, 2001, 2006 and 2011
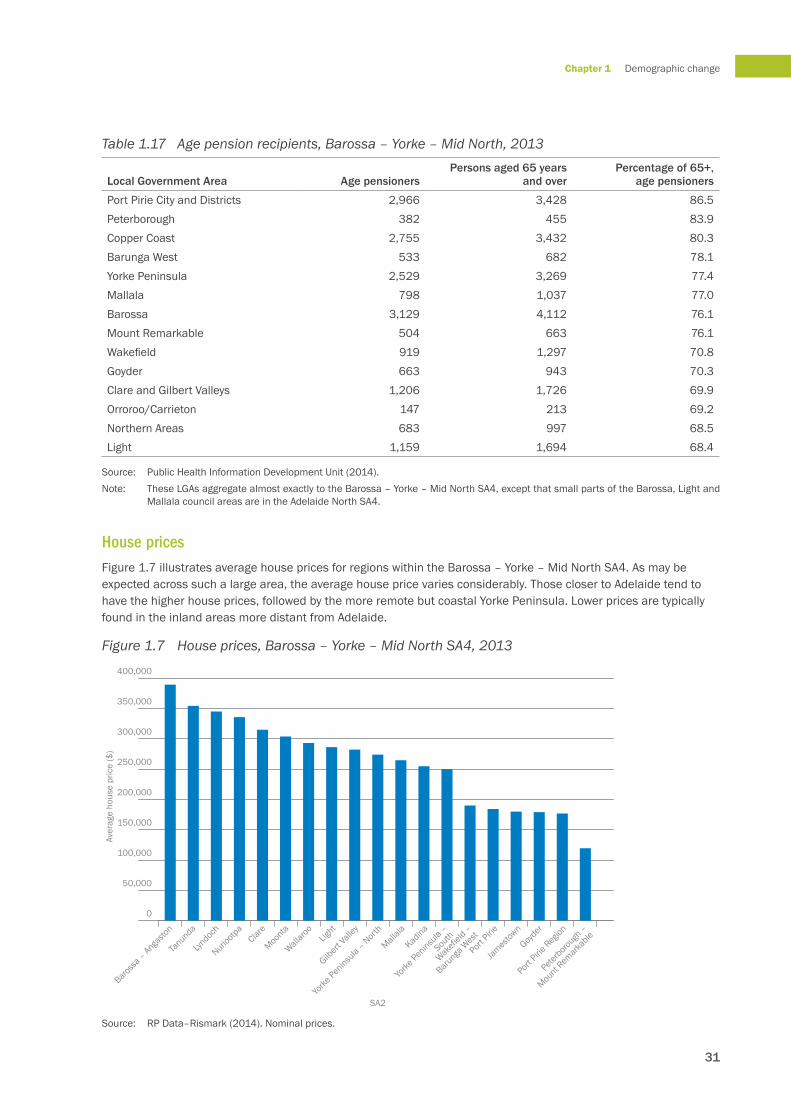
Source of income Table 1.17 shows the proportion of those aged 65 and over in 2013 who received the age pension. The highest proportion is Port Pirie (86.5 per cent), which is also the largest population centre in the Barossa – Yorke – Mid North SA4 (14,319 persons). The proportion for South Australia overall was 74.8 per cent.
Local Government Area Age pensionersPersons aged 65 years
and overPercentage of 65+,
age pensioners
Port Pirie City and Districts 2,966 3,428 86.5Peterborough 382 455 83.9Copper Coast 2,755 3,432 80.3Barunga West 533 682 78.1Yorke Peninsula 2,529 3,269 77.4Mallala 798 1,037 77.0Barossa 3,129 4,112 76.1Mount Remarkable 504 663 76.1Wakefield 919 1,297 70.8Goyder 663 943 70.3Clare and Gilbert Valleys 1,206 1,726 69.9Orroroo/Carrieton 147 213 69.2Northern Areas 683 997 68.5Light 1,159 1,694 68.4
Source: Public Health Information Development Unit (2014).Note: These LGAs aggregate almost exactly to the Barossa – Yorke – Mid North SA4, except that small parts of the Barossa, Light and
Mallala council areas are in the Adelaide North SA4.
House pricesFigure 1.7 illustrates average house prices for regions within the Barossa – Yorke – Mid North SA4. As may be expected across such a large area, the average house price varies considerably. Those closer to Adelaide tend to have the higher house prices, followed by the more remote but coastal Yorke Peninsula. Lower prices are typically found in the inland areas more distant from Adelaide.
Figure 1.7 House prices, Barossa – Yorke – Mid North SA4, 2013
0
50,000
100,000
150,000
200,000
250,000
300,000
350,000
400,000
Peterboro
ugh –
Mount R
emark
able
Port Pirie
Region
Goyder
James
town
Port Pirie
Wakefi
eld –
Barunga
Wes
t
Yorke
Peninsu
la –
South
Kadina
Mallala
Yorke
Peninsu
la – Nort
h
Gilbert
Valle
yLig
ht
Wallaro
o
Moonta
Clare
Nuriootp
a
Lyndoc
h
Tanunda
Baross
a – Anga
ston
SA2
Aver
age
hous
e pr
ice
($)
Source: RP Data–Rismark (2014). Nominal prices.
32
State of Regional Australia 2015 Progress in Australian Regions
ConclusionsIn 2013, the SA2 of Port Pirie in the Barossa – Yorke – Mid North SA4 had an average house price of $184,135. The LGA of Port Pirie also had the highest proportion of residents aged 65 and over who are in receipt of the age pension. The challenges faced by residents in a region within the SA4 with lower wealth and income combined with less access to services will be different to those faced by residents in a region who are closer to Adelaide and hold greater wealth in the form of housing. This is partly because those with higher wealth are more likely to be able to afford to travel to access services, and the quality of services tends to be higher with greater population.
1.4.4 Comparison between the Mid North Coast, Queenscliff and Barossa – Yorke – Mid North
The case studies in this chapter illustrate that, although areas may have a similar age profile, they can be quite different on other indicators. Accordingly, they face different challenges.
In particular, on three indicators—house prices, percentage of age pension recipients and proximity to a major population centre—the experience of these ageing populations vary widely. The average house price in the Mid North Coast SA4 in 2013 was $367,949, which is slightly less than half of the 2013 average house price for Queenscliff ($739,517). Even the SA2s with the highest average house prices in the Mid North Coast SA4 were under $500,000. All of the regions within Barossa – Yorke – Mid North SA4 had average house prices below $400,000. This suggests that greater average wealth is held by Queenscliff residents.
Furthermore, the size of a population can also act as an indicator of service availability. Residents of Port Pirie, the largest centre in the Barossa – Yorke – Mid North SA4 with a population of 14,319, will be likely to have access to fewer services than those in the much larger Port Macquarie (44,180).
Port Pire contrasts with Queenscliff, which also has a small population and a high proportion of people aged 65 and over. Queenscliff benefits from a likely higher than average wealth and its proximity to Geelong and Melbourne, which means that its older residents are likely to have greater access to services, retain existing links to family and friends and experience greater social inclusion.
Different again is the SA2 of the Yorke Peninsula, which is remote at 240 kilometres from the nearest centre in Port Pirie, which itself has a population of only 14,319. The size of the population combined with its relative isolation suggest that the challenges its ageing population will face will be different from those in areas closer to larger centres, and that alternative modes of service delivery may have to be considered.
Age pension rates also vary between populations. Among residents aged 65 and over, 58.8 per cent received the age pension in Queenscliff’s local government area, while the councils containing Port Macquarie, Forster–Tuncurry and Taree had rates between 75 and 80 per cent. In the Barossa – Yorke – Mid North region, the age pension rate ranged from 68 to 87 per cent. This difference indicates both higher income and higher wealth in Queenscliff compared with the other case study regions: there are fewer people aged 65 and over in Queenscliff who qualify for the age pension, which is determined by a combination of assets and income.
The three case studies illustrate that ageing populations in regional Australia do not form a homogenous group. Regions will face different challenges as their populations age and areas with similar age profiles can vary widely in other characteristics. Regions such as Queenscliff, with its high wealth and proximity to Geelong, may find that it faces different challenges than a small, isolated region in the Yorke Peninsula. To address the needs of these different populations, consideration will need to be given to their particular circumstances, taking into account factors such as income, wealth, housing affordability and ease of access to services.
33
Chapter 1 Demographic change
1.5 ConclusionPopulation ageing continues to be a major policy issue because of its implications for productivity and economic growth, the provision of services and the pressures on government revenue.
Populations aged 65 years and over are highest in inner regional (17.7 per cent) and outer regional (16.0 per cent) Australia, compared with 13.5 per cent in major cities. Very remote regions have a much younger age profile (7.2 per cent), potentially due to higher fertility rates.
In addition, the 10 regions with the highest proportion of population aged 65 years and over were in regional areas, although two fell into their states’ broader greater capital city statistical areas. In these 10 regions, older people accounted for approximately one third or more of the population. They were also all coastal areas within accessible distance of a major population centre or in areas that historically have been associated with tourism and leisure—for example, Foster and Tuncurry in New South Wales, Paynesville and Queenscliff in Victoria and Victor Harbor and Goolwa – Port Elliot in South Australia. This settlement pattern suggests a trend of older Australians who have the means to do so choosing to spend their retirements in coastal regional Australia.
An older population presents challenges that include the location of age-specific services such as health care and the supply of suitable housing. In addition, lower mobility associated with ageing will require considerations around public transport infrastructure. This will be a particularly difficult issue for remote and outer regional communities where small populations and long distances to services will make affordable transport options difficult to fund and provide. However, there are also opportunities for regions to capitalise on retirees who have both wealth and income.
The case studies for the Mid North Coast in New South Wales, Queenscliff in Victoria and Barossa – Yorke – Mid North in South Australia have highlighted that not only does the proportion of older people in regions vary, but the experiences, challenges and opportunities that face regions with an older age profile also vary greatly depending on factors such as proximity to services and older people’s resources.
For example, a remote region where the age profile reflects ageing in place and the exit of younger people may face problems with welfare dependency, lack of affordable housing and access to services. A region with high-income or high-wealth retirees who have moved into the area for lifestyle reasons may face different pressures in the form of competition for housing, housing price inflation, demand for infrastructure and accessibility, and ensuring local services meet growing demand. Spatial planning will assist in counteracting the future risks and also exploit the potential opportunities associated with an ageing population.