Anchorage Water & Wastewater Utility employs more than 280 professionals whose core purpose is to safeguard the health and welfare of the public and the environment. Utility employees have a passionate commitment to excellence in daily operations, providing safe and reliable water and wastewater services today and into the future. We deliver over 8 billion gallons of water from Eklutna Lake and other pristine sources through the course of the year. We collect and treat nearly 30 million gallons of sewage each day to protect public health and maintain habitat for fish and aquatic wildlife. We tend to the Utility’s infrastructure: 1,600 miles of buried water and sewer pipelines, as well as many valves, pump stations, reservoirs, well houses, and treatment facilities. We perform emergency repairs when necessary, with an operations staff at the ready 24 hours every day, so that water is available for your use at your convenience, in the quality and quantity you need. Cool, refreshing, safe, and reliable, there is clearly no better bargain than tap water provided by Anchorage Water & Wastewater Utility, where we are investing to ensure reliable service, safeguard public health, and protect the environment, long into the future! - Mark Corsentino, P.E., General Manager, Anchorage Water & Wastewater Utility Anchorage Water & Wastewater Utility Complies With All Drinking Water Regulations There were no violations of any Maximum Contaminant Levels or Treatment Techniques during the last required sampling period for all regulated and unregulated contaminants. The Alaska Department of Environmental Conservation issued violations for failure to monitor for some contaminants. Subsequent monitoring has demonstrated compliance with all regulations. Anchorage School District elementary students take a break & enjoy a refreshing drink from AWWU's H20 2GO water trailer during Little Orienting Day at Bartlett High School. Anchorage 2019 Drinking Water Quality Report
Transcript
Anchorage Water & Wastewater Utility employs more than 280 professionals whose core purpose is to safeguard the health and welfare of the public and the environment. Utility employees have a passionate commitment to excellence in daily operations, providing safe and reliable water and wastewater services today and into the future.
We deliver over 8 billion gallons of water from Eklutna Lake and other pristine sources through the course of the year. We collect and treat nearly 30 million gallons of sewage each day to protect public health and maintain habitat for fish and aquatic wildlife.
We tend to the Utility’s infrastructure: 1,600 miles of buried water and sewer pipelines, as well as many valves, pump stations, reservoirs, well houses, and treatment facilities. We perform emergency repairs when necessary, with an operations staff at the ready 24
hours every day, so that water is available for your use at your convenience, in the quality and quantity you need.
Cool, refreshing, safe, and reliable, there is clearly no better bargain than tap water provided by Anchorage Water & Wastewater Utility, where we are investing to ensure reliable service, safeguard public health, and protect the environment, long into the future!
- Mark Corsentino, P.E., General Manager, Anchorage Water & Wastewater Utility
Anchorage Water & Wastewater Utility Complies With All Drinking Water Regulations There were no violations of any Maximum Contaminant Levels or Treatment Techniques during the last required sampling period for all regulated and unregulated contaminants. The Alaska Department of Environmental Conservation issued violations for failure to monitor for some contaminants. Subsequent monitoring has demonstrated compliance with all regulations.
Anchorage School District elementary students take a break & enjoy a refreshing drink from AWWU's H20 2GO water trailer during Little Orienting Day at Bartlett High School.
Anchorage 2019 Drinking Water Quality Report
Anchorage Water & Wastewater Utility water samples are collected routinely from source waters, individual homes, and points throughout the distribution system to ensure quality. Certified laboratories verify the water always meets required federal and Alaska standards.
AWWU services over 7,400 fire hydrants year-round.
About This Report - Anchorage Water & Wastewater Utility is pleased to present you with its annual Drinking Water Quality Report, also known as the Consumer Confidence Report. This 2019 report is about 2018 water quality.
The U.S. Environmental Protection Agency (EPA) and the State of Alaska Department of Environmental Conservation (ADEC) require all water agencies to produce for its customers an annual report about the previous year’s drinking water quality.
AWWU’s annual Drinking Water Quality Report includes details where your water comes from, and what it contains. The Utility’s commitment to water quality excellence results in the production of drinking water that meets and/or exceeds all state and federal drinking water standards for 2018. Your Utility safeguards your public water supplies, and is pleased to report; AWWU has never violated a maximum contaminant level or any other water quality standard.
AWWU ensures safe and reliable drinking water with use of efficient and state-of-the-art technology operations. This Water Quality Report contains results of both federal and Alaska regulated drinking water tests, as well as other drinking water information.
For more information about your water, contact AWWU’s Water Quality Section at (907) 751-2217, or email [email protected]. Please include “Water Quality Report” in the subject line.
To receive a written report by mail, request one by phone at (907) 786-5613.
In 2018 ….. Average daily customer water demand was
22.25 million gallons of water from Ship Creek, Anchorage – Eagle River wells, and Eklutna.
AWWU Produced 8.41 billion gallons of drinking water from Eklutna, Ship Creek and Anchorage – Eagle River wells.
Eklutna Lake provided 91 percent of the drinking water for Anchorage and Eagle River.
Ship Creek and Anchorage - Eagle River wells provided 9 percent of customer’s drinking water.
AWWU Maintains ….. a six mile pipeline to deliver water by gravity from Eklutna Lake to Eklutna Water Treatment Facility.
AWWU Operates ….. and maintains 845 miles of water distribution and transmission mains in Anchorage, Eagle River, and Girdwood.
Anchorage Drinking Water Sources Eklutna Lake Anchorage’s predominant water source is 875 feet above sea level and sits in a Chugach Mountain Range valley.
Eklutna Lake rests below glacial surrounded mountain peaks, within Alaska’s Chugach State Park, part of a 119 square mile watershed. With 16 miles of shoreline, 7 miles in length, and 1.1 miles wide, the lake is 4.94 square miles in size and holds 366,048 acre-feet of water. The lake averages 120 feet deep, with a maximum depth of 200 feet.
Ship Creek Watershed The creek’s headwaters descend from Ship Lake at 2,700 feet and drains 117 square miles. The creeks upper 15 miles, and secondary source water for Anchorage, are within and protected from development by Chugach State Park.
Anchorage Well Water AWWU operates 10 active wells in Anchorage and Chugiak-Eagle River which draw water from several large, deep, cold, and naturally filtered aquifers. These wells provide additional drinking water in times of increased demand.
AWWU is committed to delivering the highest quality water through source water protection, excellent operations, state-of-the-art treatment and continuous monitoring. This report summarizes information, from
2018 and earlier, verifying the Municipality of Anchorage’s drinking water exceeds all state and federal health-protective standards.
Anchorage, Eagle River and northern communities in the Municipality receive drinking water primarily from the Eklutna Water Treatment Facility, which can be supplemented with water from the Ship Creek Water Treatment Facility and blended with high quality groundwater from several wells.
The treatment process, continuously monitored by AWWU water treatment operators, ensures your drinking water is disinfected. Naturally filtered well water requires less treatment and is also disinfected prior to distribution.
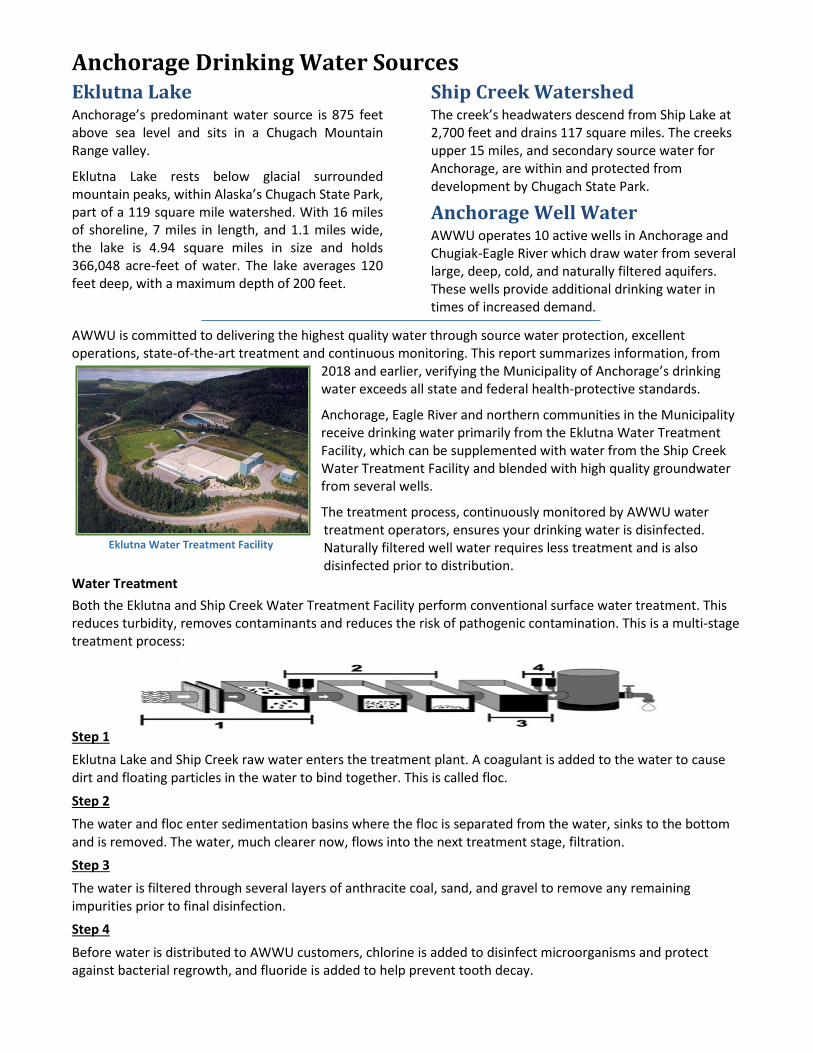
Water Treatment Both the Eklutna and Ship Creek Water Treatment Facility perform conventional surface water treatment. This reduces turbidity, removes contaminants and reduces the risk of pathogenic contamination. This is a multi-stage treatment process:
Step 1 Eklutna Lake and Ship Creek raw water enters the treatment plant. A coagulant is added to the water to cause dirt and floating particles in the water to bind together. This is called floc.
Step 2 The water and floc enter sedimentation basins where the floc is separated from the water, sinks to the bottom and is removed. The water, much clearer now, flows into the next treatment stage, filtration. Step 3 The water is filtered through several layers of anthracite coal, sand, and gravel to remove any remaining impurities prior to final disinfection. Step 4 Before water is distributed to AWWU customers, chlorine is added to disinfect microorganisms and protect against bacterial regrowth, and fluoride is added to help prevent tooth decay.
Eklutna Water Treatment Facility
Important Health Information -- Anchorage Public Water System #2210906
How To Read The Tables Data presented in this report is from the most recent testing done in accordance with regulations and presented as required by the US Environmental Protection Agency Consumer Confidence Report Rule (40 CFR 141.153 and 141.154). Some of the data, though representative of the water quality, is more than one year old. The State of Alaska requires AWWU to monitor for certain contaminants less than once a year because the typically low concentrations of these contaminants are not expected to vary significantly from year to year. The range includes all Anchorage source waters.
Some people may be more vulnerable to contaminants in drinking water than the general population. Immuno-compromised persons such as persons with cancer undergoing chemotherapy, persons who have undergone organ transplants, people with HIV/AIDS or other immune system disorders, some elderly, and infants can be particularly at risk from infections. These people should seek advice about drinking water from their health care providers. EPA/CDC guidelines on appropriate means to lessen the risk of infection by Cryptosporidium and other microbial contaminants are available from the Safe Drinking Water Hotline (1-800-426-4791).
Due to Anchorage’s pristine environment and purity of its water sources, AWWU treats water at a lower cost and produces the highest quality drinking water. Many substances are substantially lower or virtually nonexistent in our drinking water than elsewhere. While over 80 substances are routinely tested, only those detected are listed in the following tables.
Drinking Water Table Definitions Contaminant - Any physical, chemical, biological, or radiological substance or matter in the water. MCL - Maximum Contaminant Level - The highest level of a contaminant allowed in drinking water. MCLs are set by EPA as close
to MCLGs as feasible using the best available treatment technology. MCLG - Maximum Contaminant Level Goal - The level of a contaminant in drinking water below which there is no known or
expected risk to health. MCLGs allow for a margin of safety. MRDL - Maximum Residual Disinfectant Level - The highest level of a disinfectant allowed in drinking water. There is convincing
evidence that addition of a disinfectant is required for control of microbial contaminants. MRDLG - Maximum Residual Disinfectant Level Goal - The level of drinking water disinfectant below which there is no known or
expected risk to health. MRDLGs do not reflect the benefits of the use of disinfectants to control microbial contaminants.
TT - Treatment Technique - A required process intended to reduce the level of a contaminant in drinking water. AL - Action Level - The concentration of a contaminant which, if exceeded, triggers treatment or other requirements that a water
system must follow. ppb = 1 part per billion = 1microgram/Liter (µg/L) ppm = 1 part per million = 1milligram/Liter (mg/L) / 1 ppm = 1,000 ppb N/A = Not Applicable NTU = Nephelometric Turbidity Unit - a measure of water clarity ND = Not Detected BPC = By-Product of drinking water chlorination NP = Naturally present in the environment BPD = By-Product of drinking water disinfection C = Corrosion of household plumbing R = Run off from fertilizer use DP = Discharge from petroleum refineries, fire retardants, SL = Septic leaching ceramics, electronics, solder SR = Soil runoff E = Erosion of natural deposits SMCL = Secondary Maximum Contaminant Level FS = Fire Retardants, Solder WA = Water additive promotes strong teeth MDL = Method Detection Limit WM = Water additive to control microbes MRL = Method Reporting Limit
Drinking water, including bottled water, may reasonably be expected to contain at least small amounts of some contaminants. The presence of contaminants does not necessarily indicate that water poses a health risk. Call the Safe Drinking Water Hotline at 1-800-426-4791 or visit their website at www.epa.gov/safewater for more information.
Anchorage Public Drinking Water System – Water Quality Data for 2019 The tables below list all 2018 detected drinking water contaminants and information about their typical sources. In accord with regulatory guidance, contaminants below detection limits for reporting are not shown, with the exception of Total Coliform Bacteria where no detections were observed.
PRIMARY STANDARDS (MANDATORY HEALTH RELATED STANDARDS)
CHEMICAL PARAMETERS UNITS MCL MCLG RANGE HIGHEST LEVEL
MICROBIOLOGICAL UNITS MCL MCLG RANGE AVERAGE MAJOR SOURCES IN DRINKING WATER HOW DID
WE DO?
Total Coliform Bacteria /100ml <5% positive 0 ND ND Naturally present in the environment
TURBIDITY UNITS MCL MCLG EKLUTNA SHIP CREEK MAJOR SOURCES IN DRINKING
WATER
HOW DID
WE DO?
Turbidity NTU TT = 1NTU N/A Max Level
Found = 0.08
Out of Service
for 2018 Soil runoff
Turbidity NTU TT = 95% of
samples ≤0.3 N/A
100% of
samples ≤ 0.3
Out of Service
for 2018 Soil runoff
* Average is calculated based on quarterly averages
Inorganic Analytes: Maximum Contaminant Levels (MCLs) are developed for the purpose of protecting the public from possible health risks associated with long term exposure to contaminants. In general, no health hazard is reasonably expected to occur when levels are below a primary MCL. Anchorage Municipal Code 26.440.050 directs AWWU to add fluoride to Anchorage drinking water. Fluoride is added at a level that does not exceed the nationally recognized recommendation of 0.7 mg/L., and concentrations in finished drinking water are monitored daily to ensure meeting treatment objectives. Barium is the 14th most abundant element in the Earth’s crust. The most likely source in Anchorage drinking water is the erosion of natural deposits during water’s journey through the Eklutna Lake watershed. The low-level presence of barium in drinking water is fairly common, due to its presence as a trace element in both igneous and sedimentary rock. The highest levels to be found in drinking-water are likely to be associated with groundwater of low pH from granite-like igneous rocks, alkaline igneous and volcanic rocks and manganese-rich sedimentary rocks. Concentrations, therefore, are expected to be relatively stable. Chromium, while not as abundant, has similar sources and expectations of occurrence. Nitrate also occurred at natural abundance levels. Toluene was detected in a well subject to major upgrade at the time of sampling. Its detection was most likely due to surface coatings on new materials. To
Total Coliform Bacteria: Coliforms are bacteria naturally present in the environment and are used as an indicator that other, potentially harmful bacteria may be present. ADEC regulations require AWWU to test a minimum of five samples per week from throughout the distribution system for total coliform and E. coli, and to report the results, including the percentage of total Coliform positive samples in a given month. To meet this requirement, in 2018 AWWU collected and analyzed over 2000 samples from the distribution system for total coliform and E. coli. The MCL is 5.0%; this means that if more than 5% of the monthly samples collected are total coliform positive, then the MCL is violated. In 2018 AWWU detected no total coliform bacteria.
Turbidity: Turbidity is a measure of the cloudiness of water. We monitor it because it's a good indicator of the effectiveness of our filtration system. Both the Eklutna and Ship Creek treatment plants monitor for turbidity every 15 minutes to ensure uniform quality of the water produced for AWWU customers. Our consistently very low turbidity results attest to the high quality of drinking water AWWU produces.
2019 – Anchorage Public Drinking Water System Detected Results #AK2210906
CONTINUED: PRIMARY STANDARDS (MANDATORY HEALTH RELATED STANDARDS)
MICROBIOLOGICAL UNITS MCL MCLG EKLUTNA SHIP CREEK
MAJOR SOURCES IN DRINKING WATER HOW DID
WE DO? Range Average Range Average
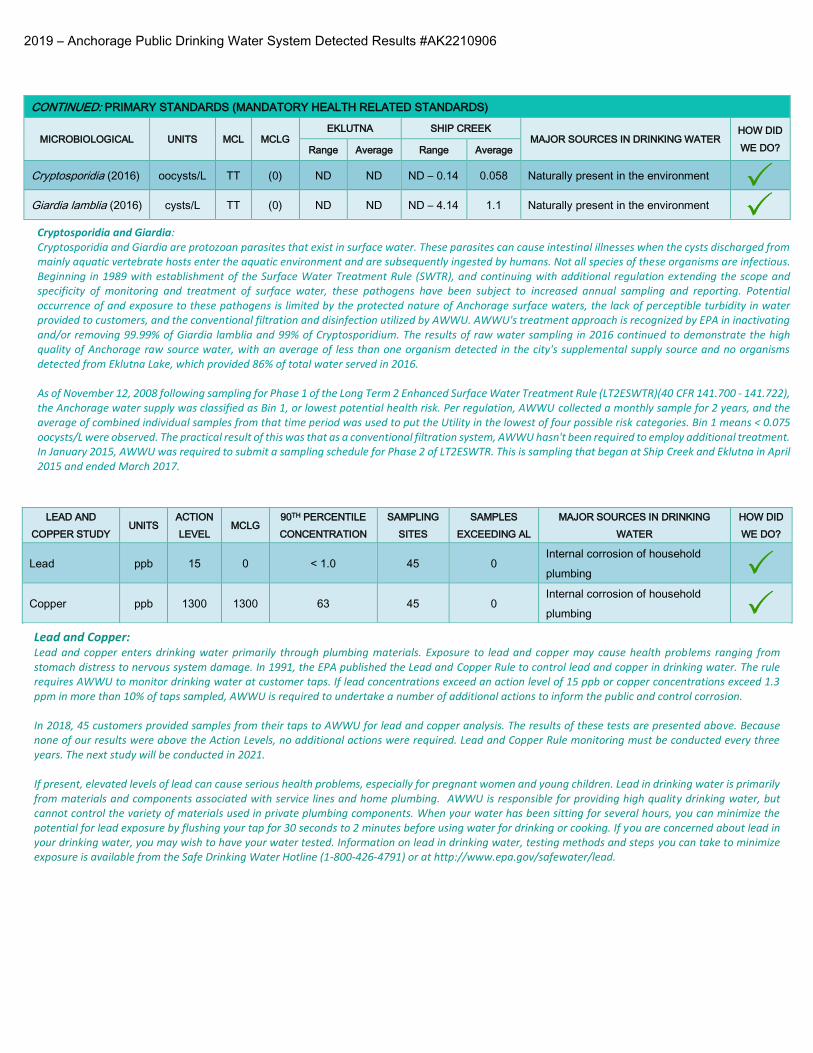
Cryptosporidia (2016) oocysts/L TT (0) ND ND ND – 0.14 0.058 Naturally present in the environment
Giardia lamblia (2016) cysts/L TT (0) ND ND ND – 4.14 1.1 Naturally present in the environment
Cryptosporidia and Giardia: Cryptosporidia and Giardia are protozoan parasites that exist in surface water. These parasites can cause intestinal illnesses when the cysts discharged from mainly aquatic vertebrate hosts enter the aquatic environment and are subsequently ingested by humans. Not all species of these organisms are infectious. Beginning in 1989 with establishment of the Surface Water Treatment Rule (SWTR), and continuing with additional regulation extending the scope and specificity of monitoring and treatment of surface water, these pathogens have been subject to increased annual sampling and reporting. Potential occurrence of and exposure to these pathogens is limited by the protected nature of Anchorage surface waters, the lack of perceptible turbidity in water provided to customers, and the conventional filtration and disinfection utilized by AWWU. AWWU's treatment approach is recognized by EPA in inactivating and/or removing 99.99% of Giardia lamblia and 99% of Cryptosporidium. The results of raw water sampling in 2016 continued to demonstrate the high quality of Anchorage raw source water, with an average of less than one organism detected in the city's supplemental supply source and no organisms detected from Eklutna Lake, which provided 86% of total water served in 2016. As of November 12, 2008 following sampling for Phase 1 of the Long Term 2 Enhanced Surface Water Treatment Rule (LT2ESWTR)(40 CFR 141.700 - 141.722), the Anchorage water supply was classified as Bin 1, or lowest potential health risk. Per regulation, AWWU collected a monthly sample for 2 years, and the average of combined individual samples from that time period was used to put the Utility in the lowest of four possible risk categories. Bin 1 means < 0.075 oocysts/L were observed. The practical result of this was that as a conventional filtration system, AWWU hasn't been required to employ additional treatment. In January 2015, AWWU was required to submit a sampling schedule for Phase 2 of LT2ESWTR. This is sampling that began at Ship Creek and Eklutna in April 2015 and ended March 2017.
LEAD AND
COPPER STUDY UNITS
ACTION
LEVEL MCLG
90TH PERCENTILE
CONCENTRATION
SAMPLING
SITES
SAMPLES
EXCEEDING AL
MAJOR SOURCES IN DRINKING
WATER
HOW DID
WE DO?
Lead ppb 15 0 < 1.0 45 0 Internal corrosion of household
Lead and Copper: Lead and copper enters drinking water primarily through plumbing materials. Exposure to lead and copper may cause health problems ranging from stomach distress to nervous system damage. In 1991, the EPA published the Lead and Copper Rule to control lead and copper in drinking water. The rule requires AWWU to monitor drinking water at customer taps. If lead concentrations exceed an action level of 15 ppb or copper concentrations exceed 1.3 ppm in more than 10% of taps sampled, AWWU is required to undertake a number of additional actions to inform the public and control corrosion. In 2018, 45 customers provided samples from their taps to AWWU for lead and copper analysis. The results of these tests are presented above. Because none of our results were above the Action Levels, no additional actions were required. Lead and Copper Rule monitoring must be conducted every three years. The next study will be conducted in 2021. If present, elevated levels of lead can cause serious health problems, especially for pregnant women and young children. Lead in drinking water is primarily from materials and components associated with service lines and home plumbing. AWWU is responsible for providing high quality drinking water, but cannot control the variety of materials used in private plumbing components. When your water has been sitting for several hours, you can minimize the potential for lead exposure by flushing your tap for 30 seconds to 2 minutes before using water for drinking or cooking. If you are concerned about lead in your drinking water, you may wish to have your water tested. Information on lead in drinking water, testing methods and steps you can take to minimize exposure is available from the Safe Drinking Water Hotline (1-800-426-4791) or at http://www.epa.gov/safewater/lead.
2019 – Anchorage Public Drinking Water System Detected Results #AK2210906
DETECTED DISINFECTION BY-PRODUCTS, DISINFECTANT RESIDUAL AND DISINFECTION BYPRODUCT PRECURSORS
UNITS MCL OR
MRDL
MCLG OR
MRDLG RANGE AVERAGE
MAJOR SOURCES IN
DRINKING WATER
HOW DID
WE DO?
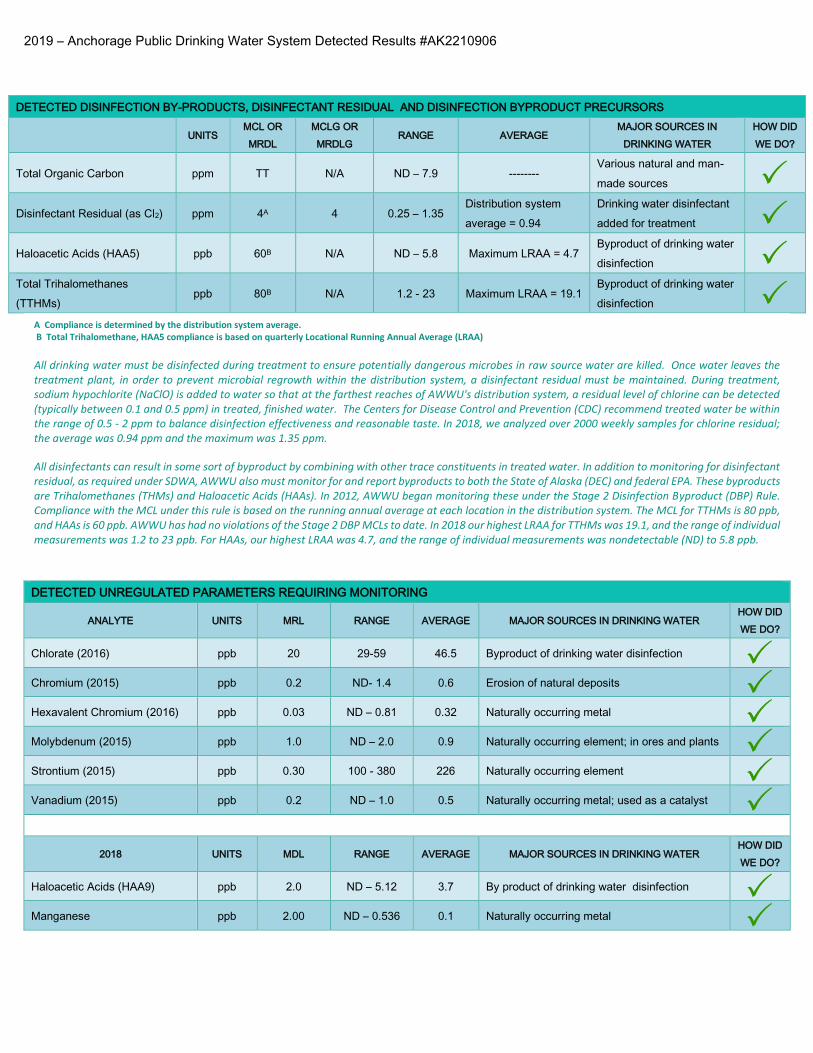
Total Organic Carbon ppm TT N/A ND – 7.9 -------- Various natural and man-
made sources
Disinfectant Residual (as Cl2) ppm 4A 4 0.25 – 1.35 Distribution system
average = 0.94
Drinking water disinfectant
added for treatment
Haloacetic Acids (HAA5) ppb 60B N/A ND – 5.8 Maximum LRAA = 4.7 Byproduct of drinking water
Vanadium (2015) ppb 0.2 ND – 1.0 0.5 Naturally occurring metal; used as a catalyst
2018 UNITS MDL RANGE AVERAGE MAJOR SOURCES IN DRINKING WATER HOW DID
WE DO?
Haloacetic Acids (HAA9) ppb 2.0 ND – 5.12 3.7 By product of drinking water disinfection
Manganese ppb 2.00 ND – 0.536 0.1 Naturally occurring metal
A Compliance is determined by the distribution system average. B Total Trihalomethane, HAA5 compliance is based on quarterly Locational Running Annual Average (LRAA) All drinking water must be disinfected during treatment to ensure potentially dangerous microbes in raw source water are killed. Once water leaves the treatment plant, in order to prevent microbial regrowth within the distribution system, a disinfectant residual must be maintained. During treatment, sodium hypochlorite (NaClO) is added to water so that at the farthest reaches of AWWU's distribution system, a residual level of chlorine can be detected (typically between 0.1 and 0.5 ppm) in treated, finished water. The Centers for Disease Control and Prevention (CDC) recommend treated water be within the range of 0.5 - 2 ppm to balance disinfection effectiveness and reasonable taste. In 2018, we analyzed over 2000 weekly samples for chlorine residual; the average was 0.94 ppm and the maximum was 1.35 ppm.
All disinfectants can result in some sort of byproduct by combining with other trace constituents in treated water. In addition to monitoring for disinfectant residual, as required under SDWA, AWWU also must monitor for and report byproducts to both the State of Alaska (DEC) and federal EPA. These byproducts are Trihalomethanes (THMs) and Haloacetic Acids (HAAs). In 2012, AWWU began monitoring these under the Stage 2 Disinfection Byproduct (DBP) Rule. Compliance with the MCL under this rule is based on the running annual average at each location in the distribution system. The MCL for TTHMs is 80 ppb, and HAAs is 60 ppb. AWWU has had no violations of the Stage 2 DBP MCLs to date. In 2018 our highest LRAA for TTHMs was 19.1, and the range of individual measurements was 1.2 to 23 ppb. For HAAs, our highest LRAA was 4.7, and the range of individual measurements was nondetectable (ND) to 5.8 ppb.
2019 – Anchorage Public Drinking Water System Detected Results #AK2210906
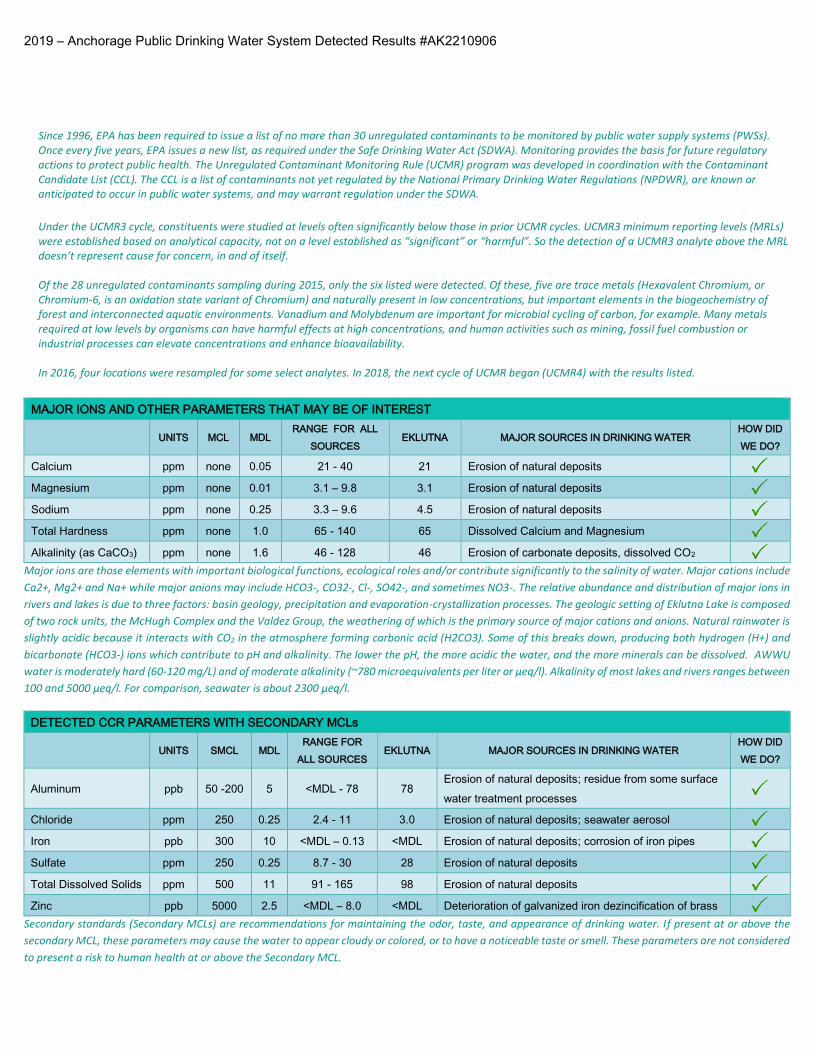
Since 1996, EPA has been required to issue a list of no more than 30 unregulated contaminants to be monitored by public water supply systems (PWSs). Once every five years, EPA issues a new list, as required under the Safe Drinking Water Act (SDWA). Monitoring provides the basis for future regulatory actions to protect public health. The Unregulated Contaminant Monitoring Rule (UCMR) program was developed in coordination with the Contaminant Candidate List (CCL). The CCL is a list of contaminants not yet regulated by the National Primary Drinking Water Regulations (NPDWR), are known or anticipated to occur in public water systems, and may warrant regulation under the SDWA.
Under the UCMR3 cycle, constituents were studied at levels often significantly below those in prior UCMR cycles. UCMR3 minimum reporting levels (MRLs) were established based on analytical capacity, not on a level established as “significant” or “harmful”. So the detection of a UCMR3 analyte above the MRL doesn’t represent cause for concern, in and of itself. Of the 28 unregulated contaminants sampling during 2015, only the six listed were detected. Of these, five are trace metals (Hexavalent Chromium, or Chromium-6, is an oxidation state variant of Chromium) and naturally present in low concentrations, but important elements in the biogeochemistry of forest and interconnected aquatic environments. Vanadium and Molybdenum are important for microbial cycling of carbon, for example. Many metals required at low levels by organisms can have harmful effects at high concentrations, and human activities such as mining, fossil fuel combustion or industrial processes can elevate concentrations and enhance bioavailability. In 2016, four locations were resampled for some select analytes. In 2018, the next cycle of UCMR began (UCMR4) with the results listed.
MAJOR IONS AND OTHER PARAMETERS THAT MAY BE OF INTEREST
Total Hardness ppm none 1.0 65 - 140 65 Dissolved Calcium and Magnesium
Alkalinity (as CaCO3) ppm none 1.6 46 - 128 46 Erosion of carbonate deposits, dissolved CO2 Major ions are those elements with important biological functions, ecological roles and/or contribute significantly to the salinity of water. Major cations include
Ca2+, Mg2+ and Na+ while major anions may include HCO3-, CO32-, Cl-, SO42-, and sometimes NO3-. The relative abundance and distribution of major ions in
rivers and lakes is due to three factors: basin geology, precipitation and evaporation-crystallization processes. The geologic setting of Eklutna Lake is composed
of two rock units, the McHugh Complex and the Valdez Group, the weathering of which is the primary source of major cations and anions. Natural rainwater is
slightly acidic because it interacts with CO2 in the atmosphere forming carbonic acid (H2CO3). Some of this breaks down, producing both hydrogen (H+) and
bicarbonate (HCO3-) ions which contribute to pH and alkalinity. The lower the pH, the more acidic the water, and the more minerals can be dissolved. AWWU
water is moderately hard (60-120 mg/L) and of moderate alkalinity (~780 microequivalents per liter or µeq/l). Alkalinity of most lakes and rivers ranges between
100 and 5000 µeq/l. For comparison, seawater is about 2300 µeq/l.
DETECTED CCR PARAMETERS WITH SECONDARY MCLs
UNITS SMCL MDL RANGE FOR
ALL SOURCES EKLUTNA MAJOR SOURCES IN DRINKING WATER
HOW DID
WE DO?
Aluminum ppb 50 -200 5 <MDL - 78 78 Erosion of natural deposits; residue from some surface
Total Dissolved Solids ppm 500 11 91 - 165 98 Erosion of natural deposits
Zinc ppb 5000 2.5 <MDL – 8.0 <MDL Deterioration of galvanized iron dezincification of brass
Secondary standards (Secondary MCLs) are recommendations for maintaining the odor, taste, and appearance of drinking water. If present at or above the
secondary MCL, these parameters may cause the water to appear cloudy or colored, or to have a noticeable taste or smell. These parameters are not considered
to present a risk to human health at or above the Secondary MCL.
The Municipality of Anchorage, Anchorage Water and Wastewater Utility, PWS # AK2210906, is required to monitor your drinking water for specific contaminants on a regular basis. Results of regular monitoring are an indicator of whether or not your drinking water meets health standards. During the nine-year compliance periods for alpha emitters and Radium 226/Radium 228 (2008-2016) and the annual compliance period (2016) for nitrate, we did not complete all monitoring for Total Gross Alpha, Radium 226/228 and Nitrate, and therefore cannot be sure of the quality of your drinking water during that time. The table below provides summary details:
Contaminant Compliance Cycle Frequency (# sites affected) Return to Compliance Total Gross Alpha 2008-2016 One sample per nine year cycle (1 site) 12/22/17 Radium 226/228 2008-2016 One sample per nine year cycle (11 sites) 12/26/17 Nitrate 2016 One sample annually (1 site) 10/31/17
Monitoring procedures have been corrected to avoid future violations. Replacement samples taken in 2017 were acceptable. Adverse health effects, if any, are not anticipated for any population, including particularly vulnerable subpopulations. Historical detection levels have been well below any health concern or MCL. New results are significantly below any health risk and are at or below detection levels. No consumer action is necessary. AWWU encourages you to please share this information with all the other people who drink this water, especially those who may not have received this notice directly (for example, people in apartments, nursing homes, schools, and businesses). You can do this by posting this notice in a public place or distributing copies by hand or mail.
Notice of Violation of Monitoring Requirements
Additional Information
Substances That Could Be in Water The sources of drinking water (both tap water and bottled water) include rivers, lakes, streams, ponds, reservoirs, springs, and groundwater.
As water travels over the surface of the land or through the ground, it dissolves naturally occurring minerals and, in some cases, radioactive material, and can pick up substances resulting from the presence of animals or from human activity. In order to ensure that tap water is safe to drink, the USEPA and the State Board prescribe regulations that limit the amount of certain contaminants in water provided by public water systems. The State of Alaska regulations also establish limits for contaminants in bottled water that must provide the same protection for public health.
Arsenic While your drinking water meets EPA’s standard for arsenic, it may contain low levels of arsenic. EPA’s standard balances the current understanding of arsenic’s possible health effects against the costs of removing arsenic from drinking water. EPA continues to research the health effects of low levels of arsenic, which is a mineral known to cause cancer in humans at high concentrations and is linked to other health effects such as skin damage and circulatory problems.
Contaminants That May Be Present in Source Water Include: Microbial Contaminants, such as viruses and bacteria, which may come from sewage treatment plants, septic systems, agricultural livestock operations, and wildlife. Inorganic contaminants, such as salts and metals, that can be naturally occurring or can result from urban stormwater runoff, industrial or domestic wastewater discharges, oil and gas production, mining, or farming; Pesticides and Herbicides that may come from a variety of sources such as agriculture, urban stormwater runoff, and residential uses; Organic Chemical Contaminants, including synthetic and volatile organic chemicals, which are by-products of industrial processes and petroleum production, and which can also come from gas stations, urban stormwater runoff, agricultural applications, and septic systems; Radioactive Contaminants that can be naturally occurring or can be the result of oil and gas production and mining activities.
Supporting the public health, safety and economic interests of the community by providing quality water and wastewater services in a responsible, efficient, and sustainable manner.
Anchorage Water & Wastewater Utility Clearly
AWWU encourages your participation in local voluntary source water protection efforts. Your activities and the natural environment may contribute contaminants and increase the susceptibility of a water supply.
Water supplies are vulnerable to the following: bacteria, viruses, volatile organic compounds, nitrates, nitrites, heavy metals, cyanide, inorganic and synthetic organic compounds. The potential sources are identified as: recreation, wildlife, campgrounds, agriculture, business, industry, transportation, storage tanks and resource extraction.
Anchorage’s water supply vulnerability is rated medium to low for the Eklutna Lake watershed, Ship Creek watershed and Anchorage wells. The Eklutna Lake watershed and Well #1 at Denali St. have an increased vulnerability to some contaminants.
In 2001 and 2002 the Alaska Department of Environmental Conservation prepared source water assessments to identify potential contaminants. These reports are available through the Alaska Department of Environmental Conservation, Drinking Water Program, (907) 269-7656 or the Alaska Resources Library, (907) 272-7547.
To comment, request more information or if you have any water quality questions, contact the Utility’s Water Quality Section at (907) 751-2217, or email [email protected]. Include “Water Quality Report” in the subject line. To receive a report by mail, phone (907) 786-5613.
Community participation to enhance water quality is welcome at AWWU Board meetings.
For location and dates, call 564-2700 or visit our website at www.awwu.biz.
Anchorage Water & Wastewater Utility 3000 Arctic Blvd. Anchorage, AK 99503-3898
Contact the Utility at 786-5613 for copies for tenants living in multi-dwelling units.