1 Date:_____Feb. 4th________ Analyst Name:___Jace Hochwalt________________ CIF Stock Recommendation Report (Spring 2013) Company Name and Ticker:__Monster Beverage (MNST)___ Section (A) Summary Recommendation Buy: Yes No Target Price: N/A Stop-Loss Price: N/A Sector: Consumer Staples Industry: Food and beverage retailing Market Cap (in Billions): 8.16 Billion # of Shrs. O/S (in Millions): 171.37 Million Current Price: 48.33 52 WK Hi: 83.96 52 WK Low: 39.99 EBO Valuation: $22.01 Morningstar (MS) Fair Value Est.: 52.00 MS FV Uncertainty: High MS Consider Buying: 31.20 MS Consider Selling: 80.60 EPS (TTM): 1.88 EPS (FY1): 1.89 EPS (FY2): 2.33 MS Star Rating: 3 star Next Fiscal Yr. End ”Year”: “Month”: Dec 2013 Last Fiscal Qtr. End: Less Than 8 WK: Y N If Less Than 8 WK, next Earnings Ann. Date: Feb. 18th Analyst Consensus Recommendation: Outperform Forward P/E: 20.47 Mean LT Growth: 19.0 PEG: 1.33 Beta: .29 % Inst. Ownership: 76% Inst. Ownership- Net Buy: Y N Short Interest Ratio: 2.2 Short as % of Float: 3.00% Ratio Analysis Company Industry Sector P/E (TTM) 26.19 37.47 31.18 P/S (TTM) 4.08 1.3 3.48 P/B (MRQ) 9.17 3.13 1.57 P/CF (TTM) 22.87 12.68 19.24 Dividend Yield 0 2.13 1.67 Total Debt/Equity (MRQ) 0 40.28 18.95 Net Profit Margin (TTM) 16.84 5.37 7.25 ROA (TTM) 26.53 5.11 3.22 ROE (TTM) 36.94 11.07 17.37
Transcript
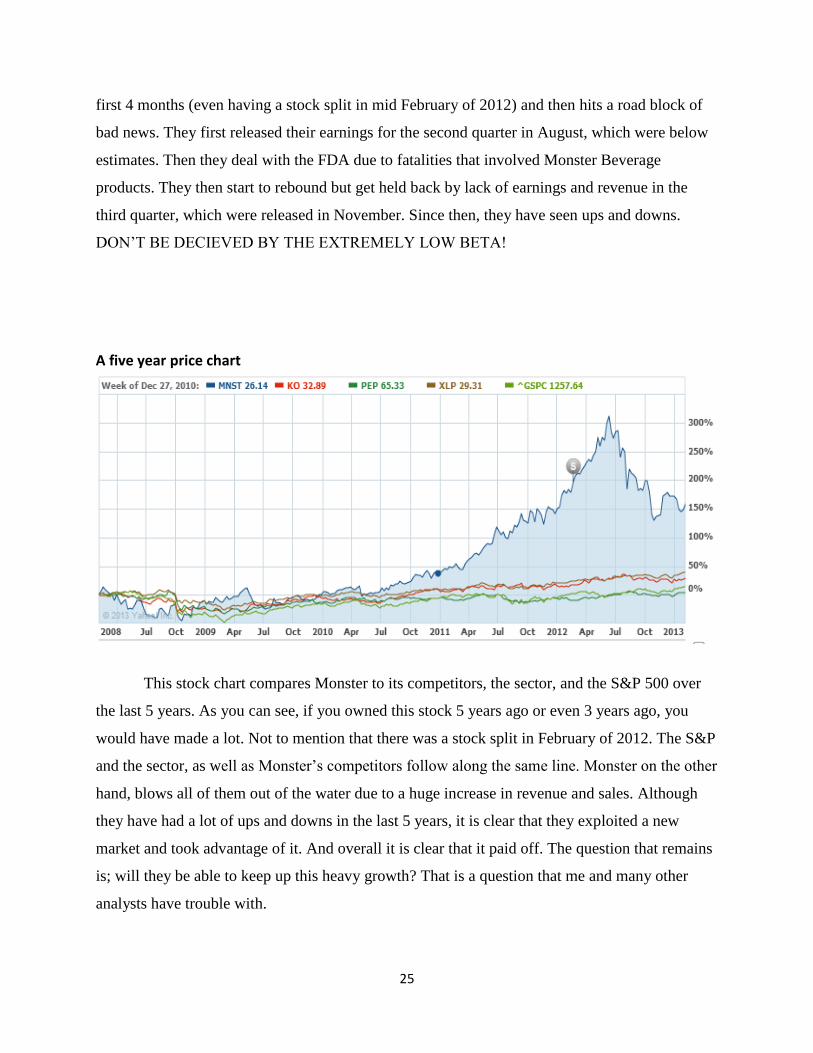
1
Date:_____Feb. 4th________
Analyst Name:___Jace Hochwalt________________
CIF Stock Recommendation Report (Spring 2013)
Company Name and Ticker:__Monster Beverage (MNST)___
Section (A) Summary
Recommendation Buy: Yes No Target Price: N/A Stop-Loss Price: N/A
Sector: Consumer Staples
Industry: Food and beverage retailing
Market Cap (in Billions): 8.16 Billion
# of Shrs. O/S (in Millions): 171.37 Million
Current Price: 48.33
52 WK Hi: 83.96
52 WK Low: 39.99
EBO Valuation: $22.01
Morningstar (MS) Fair Value Est.: 52.00
MS FV Uncertainty: High
MS Consider Buying: 31.20
MS Consider Selling: 80.60
EPS (TTM): 1.88 EPS (FY1): 1.89 EPS (FY2): 2.33 MS Star Rating: 3 star
Next Fiscal Yr. End ”Year”: “Month”: Dec 2013
Last Fiscal Qtr. End: Less Than 8 WK: Y N
If Less Than 8 WK, next Earnings Ann. Date: Feb. 18th
Analyst Consensus Recommendation: Outperform
Forward P/E: 20.47 Mean LT Growth: 19.0
PEG: 1.33 Beta: .29
% Inst. Ownership: 76%
Inst. Ownership- Net Buy: Y N
Short Interest Ratio: 2.2
Short as % of Float: 3.00%
Ratio Analysis Company Industry Sector
P/E (TTM) 26.19 37.47 31.18
P/S (TTM) 4.08 1.3 3.48
P/B (MRQ) 9.17 3.13 1.57
P/CF (TTM) 22.87 12.68 19.24
Dividend Yield 0 2.13 1.67
Total Debt/Equity (MRQ) 0 40.28 18.95
Net Profit Margin (TTM) 16.84 5.37 7.25
ROA (TTM) 26.53 5.11 3.22
ROE (TTM) 36.94 11.07 17.37
2
Investment Thesis
My overall opinion on this stock is a No buy.
When I first looked at the stock I was
instantly attracted to the high ROA, ROE,
and most of all, the fact that the company
had no debt.
When I dug deeper into Monster I found
some unattractive things about the company.
They are currently involved in lawsuits with
the FDA about the safeness of their
beverages. There have been 5 deaths that
have involved Monster energy drinks.
Monster states that the energy drinks
themselves are not the causes of the deaths.
The high price multiples are also another
unattractive feature. They have a much
higher P/B, P/S, and P/CF ratio than all
competitors. Also, if you look at their 50 day
moving average compared to their 200 day
moving average, you will notice that they hit
the death cross about 4 months ago. Poor
quarterly performance has really set the stock
back though. This can be the main reason for
the huge dips in the stock price in the last 8
months.
Although there are multiple reasons not to
buy Monster’s stock, the company still has
great room to grow. Although they hit the
death cross about 4 months ago, it looks as
though they are rebounding and will have a
golden cross within 2 months. They also
have incredibly high profit margins and are
expected to expand into some new countries.
They have expanded into a few so far and
haven’t made too much money yet (but they
didn’t make much money in the US the first
5 years either). It is expected to take 2 years
of marketing in new countries to establish a
good customer base. Then expansion will
occur. It is said that if they decide to pursue a
global market, they will have significantly
higher revenue.
Summary
Company Profile: Monster Beverage Corporation
develops, markets, and sells alternative beverages. The
company is most known for their energy drink “Monster
Energy.” They have much competition within their
product lines, and compete with some major companies.
Fundamental Valuation: Unfortunately, due mainly to
the low beta of the stock and the lack of dividends, the
stock is extremely undervalued in comparison to the
current price. I got a value of $21.53, which is severely
under the current price of $48.
Relative Valuation: The relative valuation of Monster
Beverage also had the stock undervalued in most
categories. The competitors I chose included Dr
Pepper/Snapple, Coca Cola, Molson Coors, and
PepsiCo. The best competitor in my opinion is Red Bull,
but they are a privately owned company.
Revenue and Earnings Estimates: Revenue and
earnings estimates for the future are promising and
higher than previous quarters and years. Past revenue
and earnings estimates tend to overestimate the actual
revenue and earnings though which raises a red flag.
Analyst Recommendations: Analysts are bullish about
the MNST stock. The mean rating on Reuters.com is
2.33. This means that analysts are expecting MNST to
just outperform the market. Yahoo Finance has a similar
opinion. Unfortunately not many analysts have given
their opinion. In better news, the mean rating has
dropped from 2.6 to 2.33 in the last few months.
Institutional Ownership: The institutional ownership
of Monster Beverage is very interesting. There is 477
total holders and mutual fund ownership is very low.
With that said, there are 2 owners that hold a share of
over 5%. Those companies are: Fidelity Management
and Vanguard.
3
One remark I have about Monster Beverage
Corporation’s stock is about its very low
beta. The beta is .2 yet this stock has
fluctuated more than most stocks I’ve ever
seen, and is extremely volatile for the sector
it is in.
Short Interest: One of the things I am most impressed
about with this stock is the short interest. It is currently
at about 2.2. It maintains a very low short interest ratio,
even at one point hitting 1.00. The short interest ratio
has ranged between 1 and 3 the last year.
Stock Price Chart: The stock chart for MNST is very
interesting. Although the beta is very low, this stock
does see a lot of movement. In the three month stock
chart, the price fluctuates between $44 and $56. The 6
month chart ranges from about $40 to $70. The one year
chart ranges from $40 to $80, and there was actually a
stock split last February.
4
Section (B) Company Profile (two pages maximum)
Company Summary
“Based in Corona, California, Monster Beverage Corporation is a leading marketer and
distributor of energy drinks and alternative beverages. The Company markets and distributes
Monster Energy® brand energy drinks, Monster Energy Extra Strength Nitrous Technology®
brand energy drinks, Java Monster® brand non-carbonated coffee + energy drinks, X-Presso
Monster® brand non carbonated espresso energy drinks, M-3™ superconcentrated energy
drinks, Monster Rehab™ non-carbonated rehydration energy drinks, Worx Energy® shots, and
Peace Tea® iced teas, as well as Hansen’s® natural sodas, apple juice and juice blends, multi-
vitamin juices, Junior Juice® beverages, Blue Sky® beverages, Hubert’s® Lemonades,
Vidration® vitamin enhanced waters, and PRE® Probiotic drinks (MonsterBevCorp.com).”
Monster Beverage Corporation is a leader within the energy drink business. In May of
2012, they held nearly 35% of the energy drink market (seekingalpha.com). They target drinks to
younger audiences like adolescents and young adults. Monster does have several competitors.
Coca Cola and Pepsi both compete in the energy drink market but Monster still holds a majority
of the market in comparison. One of their largest competitors is Red Bull. Unfortunately, Red
Bull is a private company though so I was unable to look at all their financial statistics.
Business Model, Competition, Environment and Strategy
Monster Beverage Corporation has an interesting business model. They focus a lot of
their attention on advertising. They also focus strictly on teenagers. Monster sponsors several
action sports athletes and has an incredibly successful advertising campaign. A big thing that
Monster has to watch out for is lawsuits. There have been 5 deaths that have involved the
Monster energy drink. Monster rebuttals against the fact the energy drinks are actually what
caused the deaths. I believe the reason the stock has seen such ups and downs this last year is due
to the lawsuits that they have been battling.
Like I mentioned before, competition within the energy drink market (92% of Monster
Beverage Corporation’s revenue) is very competitive. Energy drinks were not popular until
around 2000. In 2003, Monster had $50 million in revenue, but exploded to $1.7 billion by 2011
5
(Morningstar). That is when Red Bull and Monster really had a battle between who could control
the most market share. Red Bull currently holds more market share in the energy drink market
than does Monster. Unfortunately Red Bull is a privately held company so I could not compare
the two very similar companies. Both companies really saw a huge rise in profits and revenue
within the last 6 years. Both companies are typically huge sponsors for action sports athletes and
both companies have catch phrases for their drinks.
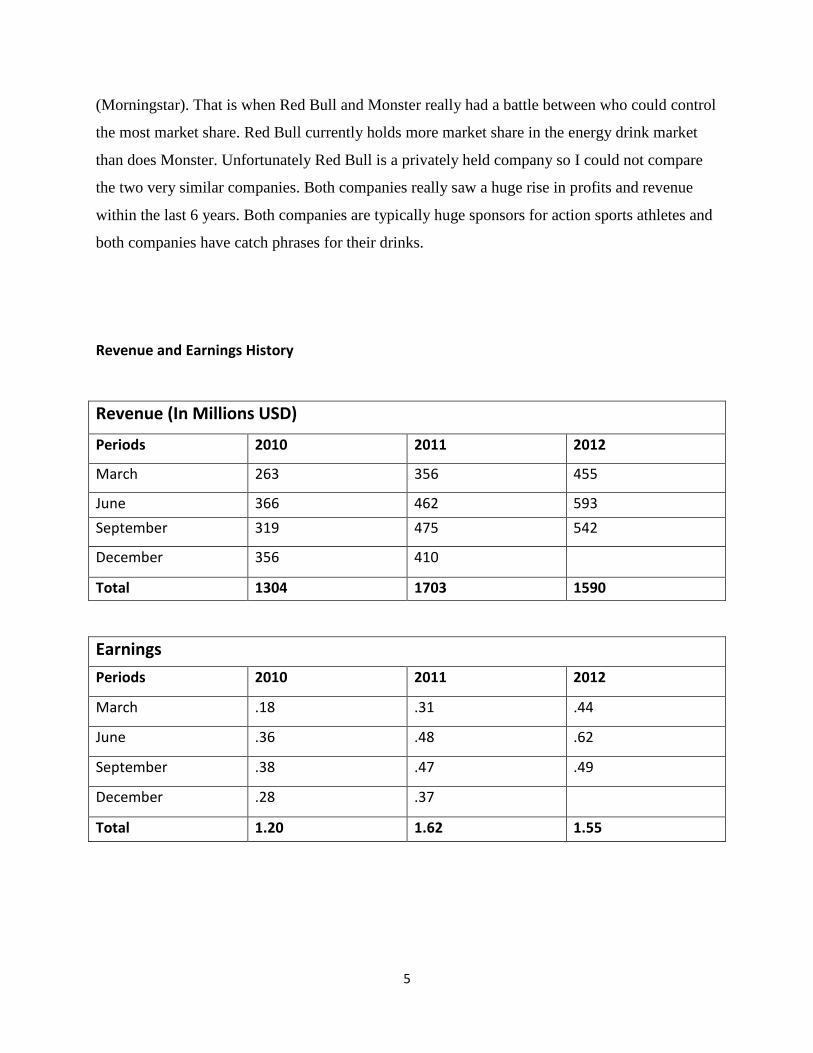
Revenue and Earnings History
Revenue (In Millions USD)
Periods 2010 2011 2012
March 263 356 455
June 366 462 593
September 319 475 542
December 356 410
Total 1304 1703 1590
Earnings
Periods 2010 2011 2012
March .18 .31 .44
June .36 .48 .62
September .38 .47 .49
December .28 .37
Total 1.20 1.62 1.55
6
As you can see by the tables above, revenue and earnings have both increased over the
last 3 years. Revenue increased by $400 million between 2010 and 2011. There does seem to be
a trend within the revenue of Monster Beverage Corporation. During the month of June, usually
Monster has their highest revenue. This is probably due to the fact that kids do not have school
over the summer months, so more energy drinks are bought. It seems that the March and
December quarters are usually the quarters where Monster has the least revenue.
Earnings have a very similar trend to revenue as far as seasonality. In the last 3 years, the
worst earning have occurred in the December and March quarters, with higher earnings in June
and September. Earnings have increased significantly, in a similar fashion as revenue. The
question that needs to be asked is; can Monster keep up these huge increases in revenue and
earnings in the future? The short answer to this is yes. Energy drinks have gained popularity
among the years and I do not see the trend stopping for awhile, unless there are big lawsuits that
Monster loses.
7
Section (C) Fundamental Valuation (EBO)
Inputs (provide below input values used in your analysis)
EPS forecasts (FY1 & FY2): ___1.89 and 2.33 respectively______
Long-term growth rate: _____19%________________
Book value /share (along with book value and number of shares outstanding):
Book value: ______889.67 million_______________
# of shares outstanding: ______171.37 million_____________
Book value / share: ______5.6_______________
Dividend payout ratio: ________0______________
Next fiscal year end: ________December 2013______________
Current fiscal month: ________2______________
Target ROE: ________11.07______________
8
Output
Above normal growth period chosen: ______3_______________
EBO valuation (Implied price from the spreadsheet): _______$28.02___________
Sensitivity Analysis
EBO valuation would be (you can include more than one scenario in each of the following):
_______$32.91________ if changing above normal growth period to _____5________
___$30.94_ if changing growth rate from mean (consensus) to the highest estimate __23%_
_______$25.28________ if changing growth rate from mean (consensus) to the lowest
estimate ______15%_________
______$52.35_________ if changing discount rate to ______6%________
______$28.02_________if changing target ROE to _____5%__________
*All of the above changes apply to a 3 year growth period. So all the numbers in the last 4
questions have the implied price for the year 2016
9
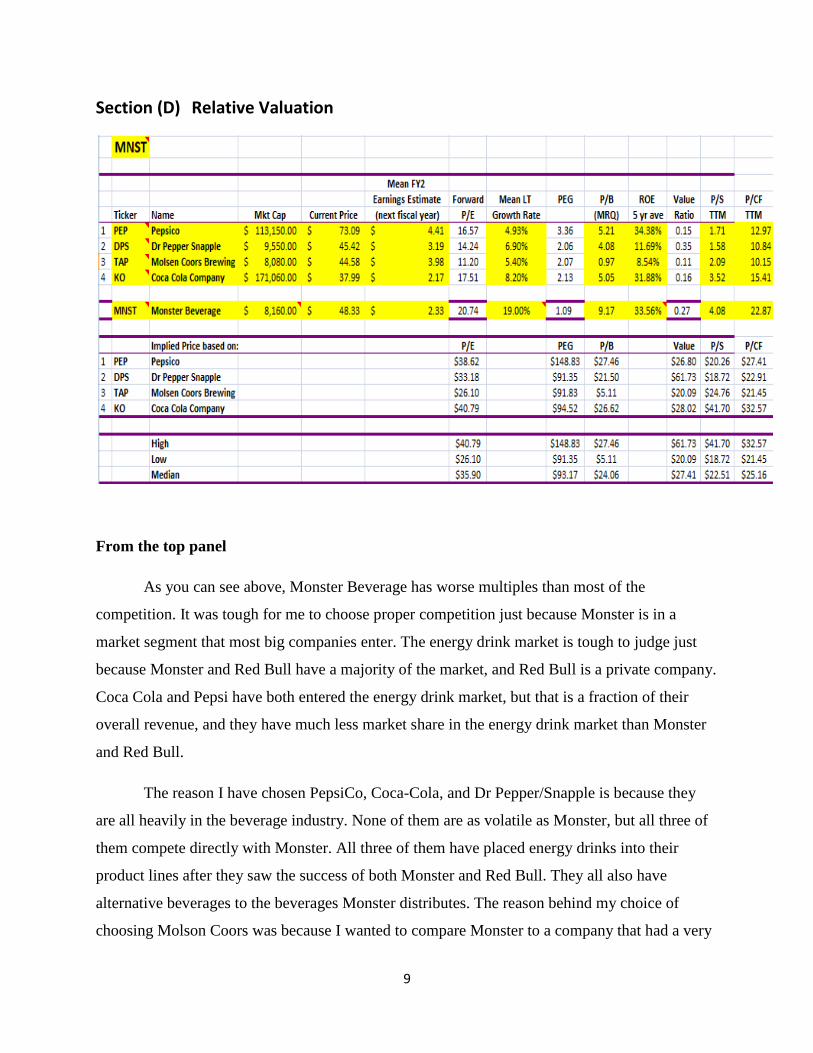
Section (D) Relative Valuation
From the top panel
As you can see above, Monster Beverage has worse multiples than most of the
competition. It was tough for me to choose proper competition just because Monster is in a
market segment that most big companies enter. The energy drink market is tough to judge just
because Monster and Red Bull have a majority of the market, and Red Bull is a private company.
Coca Cola and Pepsi have both entered the energy drink market, but that is a fraction of their
overall revenue, and they have much less market share in the energy drink market than Monster
and Red Bull.
The reason I have chosen PepsiCo, Coca-Cola, and Dr Pepper/Snapple is because they
are all heavily in the beverage industry. None of them are as volatile as Monster, but all three of
them compete directly with Monster. All three of them have placed energy drinks into their
product lines after they saw the success of both Monster and Red Bull. They all also have
alternative beverages to the beverages Monster distributes. The reason behind my choice of
choosing Molson Coors was because I wanted to compare Monster to a company that had a very
10
similar market cap. As seen, PepsiCo and Coca-Cola have much higher of a market cap than
Monster, so I did think TAP was a good way for me to compare companies based on market cap.
Monster has an earnings estimate that falls in line with the rest of the competition I have
stated above. Monster does have a very low market cap in comparison with its main competitors,
Coca Cola, and PepsiCo, but does have a higher market cap than Molson Coors. What jumps out
the most is the long term growth rate. Monster Beverage has a growth rate that is over twice the
growth rate of all other competitors at 19%. The really bad news about Monster’s multiples in
comparison to competitors is that Monster has the highest P/B, P/S, and P/CF ratios by a clear
margin. The ROE 5 year average is good though and falls in line with both Coca-Cola and
PepsiCo.
From the bottom panel
In the lower section of the chart, there is not much good news for Monster Beverage in
comparison to its competition. In the P/E, P/B, P/S, value ratio, and P/CF comparisons,
Monster’s stock is overvalued by all. The one ratio that actually undervalues the stock is the PEG
ratio, and this is due to the very high growth rate which Monster has. The one thing I question is
the growth rate. Monster only had two analysts value a growth rate so I think it is tough to
actually conclude that this 19% growth rate is accurate. With that said however, I do believe that
the PEG ratio is the best measure of the stock price vs. competition. Monster has been growing
rapidly in the last 10 years and shows little signs of slower growth.
Almost all of the valuation metrics overvalue Monster’s stock price even at its 52 week
low. Some reasons for Monster Beverage Corporations stock to be overvalued in almost every
category is due to a low beta, and very high pricing multiples. It would be great if I could
compare Red Bull in this comparison, but I will bring the company Red Bull up more in my
presentation.
11
Section (E) Revenue and Earnings Estimates
As seen from the chart above, there have been positive and negative estimates within the
last 5 quarters. This most recent quarter (Sep 2012), Monster negatively missed revenue and
earnings by a large margin. This could be due to the lawsuits that have been arising within the 5
months about deaths that are potentially related to Monster energy drinks. That seems to be the
only major miss in revenue and earnings. In June of 2012, both earnings and revenue missed by a
low margin. In March of 2012, both earnings and revenue exceeded expectations by a small
margin. In December of 2011, both earnings and revenue missed by a low margin. In March of
2012, revenue exceeded expectations, while earnings hit the exact estimate. There seems to be no
real pattern, just besides the fact that Monster Beverage has missed earnings and revenue in the
last two quarters which could potentially be a bad sign.
After looking at Monster Beverage Corporation’s stock chart over the past 18 months, I
noticed some interesting things. Last quarter (September, 2012), when earnings and revenue
12
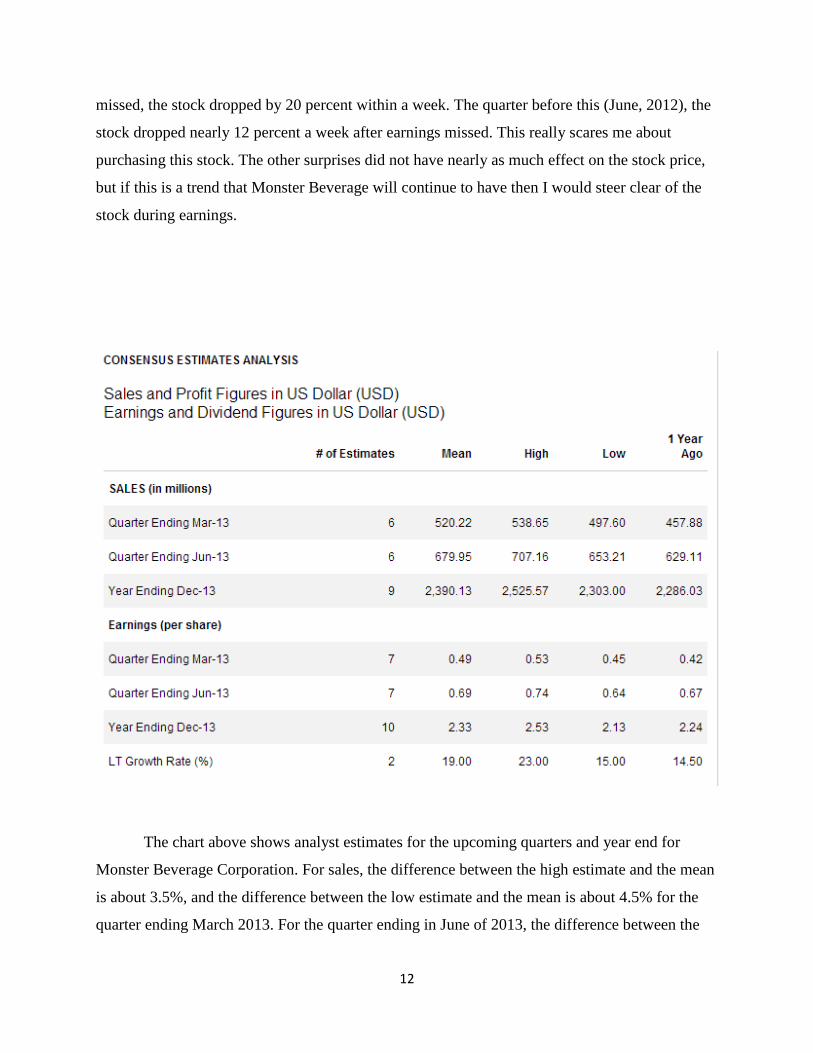
missed, the stock dropped by 20 percent within a week. The quarter before this (June, 2012), the
stock dropped nearly 12 percent a week after earnings missed. This really scares me about
purchasing this stock. The other surprises did not have nearly as much effect on the stock price,
but if this is a trend that Monster Beverage will continue to have then I would steer clear of the
stock during earnings.
The chart above shows analyst estimates for the upcoming quarters and year end for
Monster Beverage Corporation. For sales, the difference between the high estimate and the mean
is about 3.5%, and the difference between the low estimate and the mean is about 4.5% for the
quarter ending March 2013. For the quarter ending in June of 2013, the difference between the
13
high estimate and the mean is right around 4%, and the difference between the low estimate and
the mean is also 4%. For the year ending in 2013, there is a bit larger of a margin. The difference
between the high estimate ad the mean is about 10%, whereas the difference between the low
estimate and the mean is around 4%. I think the reason for the high difference between the high
estimate and the mean is due to the fact that this company has been growing and gaining more
and more revenue each quarter, but it is tough to exactly estimate just how much the company
will increase sales in a full year time span. The very good news is that all these estimates are up
significantly from where they were at only a year ago.
Earnings per share estimates seem to range a little more than the sales estimates. For the
quarter ending March 2013, the difference between the high estimate and the mean is about 8%,
and the difference between the low estimate and the mean is about 9%. For the quarter ending
June of 2013, the difference between the high estimate and the mean is about 7%, and the
difference between the low estimate and mean is about 8%. For the year ending in 2013, the
difference between the high estimate and the mean is about 8.5%, whereas the difference
between the low estimate and the mean is about 9.5%. These seem to stay between the range of
9% for the high and low sides of the mean even for the year ending. The earnings per share
estimates, just like sales, have gone up by a significant margin since last year, which is a good
sign of growth.
Another value that this chart mentions is the long term growth percentage. The mean is
19%, but there are only 2 analysts that give there estimation for the long term growth rate. The
low estimate is 15% and the high estimate is 23%. These are significantly different, but they are
still very high growth rates in comparison with the industry and close competitors. It is
worrisome that only 2 analysts have estimated this variable, and makes me wonder how realistic
the estimate actually is.
14
The chart above shows the consensus estimate trend within the last 2 months, as well as
last year at this time. If you look above, you will be able to notice that there is little to no change
for sales or earnings in the last 2 months. This is by far the closest consensus I have ever seen.
The only major difference, which I mentioned in the previous section, is the fact that sales and
earnings per share are up significantly in comparison to where estimations were at 1 year ago.
The chart sends bullish messages, yet at the same time, sends bearish messages. Sales and
earnings are up from a year ago, but virtually have not changed within the last 2 months, so it is
tough to infer what will happen next.
15
The Chart above shows when and how revisions have taken place within the last week
and the last 4 weeks. The last week there has been no estimate revisions, but in the last 4 weeks
there have been a few. For revenue in the quarters ending in March and June of 2013, one analyst
has revised up, and another has revised down. For revenue for the year ending in 2013, one
analyst has revised upward, and two have revised downward.
Earnings per share revisions are somewhat similar to revenue revisions. For the quarter
ending in March of 2013, one analyst has revised downward, and no analysts revised upward.
For the quarter ending in June of 2013, one analyst has revised upward and one analyst has
revised downward. For the year ending in 2013, one analyst has revised downward, and no
analysts have revised upward.
There seems to be no trend among analysts. Some say that revenue and earnings will be
up, while others say that revenue and earnings will be down, so again it is tough to infer what
really will happen as far as earnings and revenue goes.
16
Based on other websites and other analysts, this is by far the most difficult stock to
predict that I have looked at. They have increasing revenue and earnings every year, yet they are
not beating estimates and their stock is taking a beating from missed estimates at a very extreme
pace. Overall this stock is said to outperform the market by every website I have looked at. Some
analysts say this is a stock that should be shorted, while others say that this stock will outperform
the market and grow at a rapid pace. Morningstar overall claims that the stock is still
undervalued, and there is room for massive growth in the United States, but mainly overseas.
With that said, Morningstar seems to be on the fence about this stock though. They do go into
severe detail about the competitors the Monster faces, as well as the suppliers of the raw
materials that Monster uses for their beverages.
Honestly what it comes down to with the purchase of Monster Beverage Corporation’s
stock is risk. The risky investors are seeing Monster as an opportunity to make huge gains by
looking more at the opportunities and tuning out the threats of the business. The less risky
investors are shorting this stock or just completely looking past this stock just because there is
too much financial risk involved. This is the idea I have gotten from all the articles I have read.
Monster has great room for expansion, loads of cash, and no debt. They also have high
competition and threats of lawsuit by the FDA. If I were a sole investor, I would put this stock in
my portfolio and keep it for awhile because I like risk and I see high risk as high return. For
someone on the other end of the spectrum, they see this stock as a high risk stock that could
mean high losses. For the Cougar Investment Fund, I recommend this stock as a no buy. I don’t
believe that one semester is long enough to have the reward override the risks involved.
17
Section (F) Analysts’ Recommendations
The chart above shows the overall recommendations of analysts and their revisions
within the last three months. As you can see, the mean rating has actually dropped in the last
three months which is a bullish sign among these analysts. Three months ago and two months
ago, analysts said the exact same thing. One analyst recommended a buy, three said it would
outperform the market, five said to hold it, and one said the stock would underperform. One
month ago, analysts revised their opinions slightly. Two analysts recommended a buy, three said
the stock would outperform the market, two said to hole the stock, and one said the stock would
underperform. Since a month ago, it looks as though one analyst decided to no longer look at the
stock and removed he/she recommendation from a hold to nothing at all.
Overall it seems that analysts have become more bullish about Monster Beverage
Corporation. What does concern me is the lack of analysts that actually have an opinion on
Monster’s stock. There are currently only 8 analysts that have rated this stock, which seems low,
18
especially in comparison with the higher number of analysts rating stocks for competitors like
Coca-Cola and PepsiCo. These analyst opinions do coincide with that of Morningstar. For the
most part there is a slightly bullish sentiment, but there is a lot of uncertainty overall. Yahoo
Finance gives Monster Beverage’s stock a 2.4 rating, where 1 is a strong buy and 5 is a sell. This
is also very similar to the analyst opinions of Reuters.
Below is the upgrades and downgrades that Monster did/didn’t get in the last two months
according to CNBC.com. Unfortunately, Monster Beverage comes out with earnings on the 18th
of February, and in the last two months, CNBC does not have Monster listed at all as far as
analysts upgrading or downgrading the stock. I figured I would include this chart to show that I
have in fact completed the work, but just had no information
Revision Date
Upgrade or Downgrade
Current Recommendation
Previous Recommendation
Firm Last Revision
The most recent revision date
The earliest revision date in the last two months
19
Section (G) Institutional Ownership
The chart above explains the ownership of Monster Beverage Corporation. Overall this
chart does send a bearish signal to investors. Overall there are negative 35 net buyers (35 net
sellers), and a 3 month net change of -1.67% in Monster’s shares. There are a total of 477 share
holders and they make a total of 77.36% of Monsters stock. There have been 18 new positions,
but 22 closed positions which cancel new positions. There have also been 48 increased
positions, but there have been 83 decreased positions. For top 10 institutions holding, they
hold about 37% of Monsters stock which is about average. The mutual fund ownership is
20
minimal at less than a percent. This is a somewhat negative sign in my opinion. There are two
companies that hold over 5% of the stock. These companies include Fidelity Management and
Research Company, and The Vanguard Group, Inc, which hold 6.8% and 5.2% respectively.
There are however, no corporate insiders that hold more than 5% of shares.
21
Section (H) Short Interest (two pages)
22
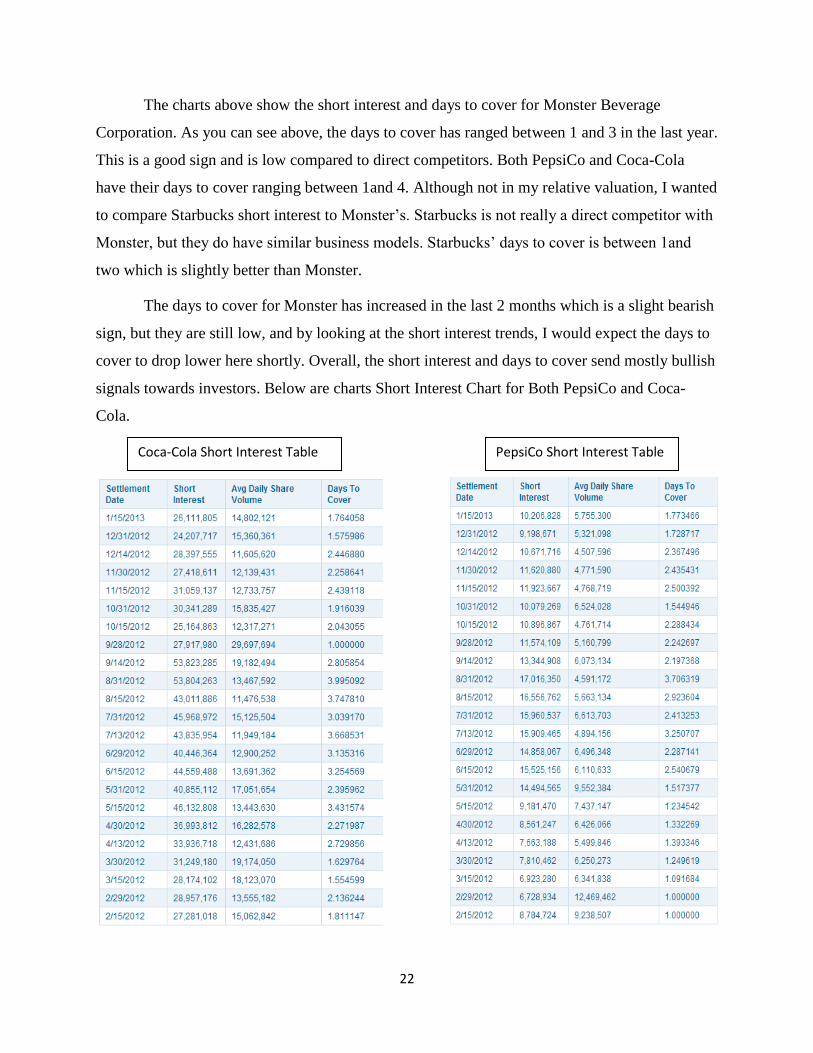
The charts above show the short interest and days to cover for Monster Beverage
Corporation. As you can see above, the days to cover has ranged between 1 and 3 in the last year.
This is a good sign and is low compared to direct competitors. Both PepsiCo and Coca-Cola
have their days to cover ranging between 1and 4. Although not in my relative valuation, I wanted
to compare Starbucks short interest to Monster’s. Starbucks is not really a direct competitor with
Monster, but they do have similar business models. Starbucks’ days to cover is between 1and
two which is slightly better than Monster.
The days to cover for Monster has increased in the last 2 months which is a slight bearish
sign, but they are still low, and by looking at the short interest trends, I would expect the days to
cover to drop lower here shortly. Overall, the short interest and days to cover send mostly bullish
signals towards investors. Below are charts Short Interest Chart for Both PepsiCo and Coca-
Cola.
Coca-Cola Short Interest Table PepsiCo Short Interest Table
23
From http://finance.yahoo.com/
Complete the following table with information from the “share statistics” table.