Topographic and Tomographic Properties ofForme Fruste Keratoconus Corneas
Alain Saad1,2 and Damien Gatinel1,2
PURPOSE. To investigate the efficacy of topography and tomog-raphy indices combined in discriminant functions to detectmild ectatic corneas.
METHODS. The authors retrospectively reviewed the data of 143eyes separated into three groups by the Corneal Navigator OPDscanning system (Nidek, Gamagori, Japan): normal (N; LASIKsurgery with a 2-year follow-up; n � 72), forme fruste kerato-conus (N topography with contralateral KC; FFKC; n � 40),and KC (n � 31). Topography and tomography indices, cor-neal thickness spatial profile (CTSP), and anterior and posteriorcurvature spatial profiles were obtained with the Orbscan IIz(Bausch & Lomb Surgical, Rochester, NY). The percentage ofthickness increase (PTI) from the thinnest point to the periph-ery, the percentage of variation of anterior (PVAK), and poste-rior curvature were calculated and compared by Kruskal-Wallistest. The usefulness of these data to discriminate among thethree groups was assessed by receiver operating characteristic(ROC) curve analysis.
RESULTS. Posterior elevation of the thinnest point (TP), allpositions of CTSP, PTI for all distances from the TP, and PVAKfrom a 5- to 7-mm distance from the TP were significantlydifferent in the FFKC compared with the N group. The dis-criminant functions between the FFKC and the N groups andbetween the KC and the N groups reached an area under theROC curve of 0.98 and 0.99, respectively. PTI indices andmaximum posterior central elevation were the most importantcontributors to the discriminant function.
CONCLUSIONS. Indices generated from corneal thickness andcurvature measurements over the entire cornea centered onthe TP can identify very mild forms of ectasia undetected by aPlacido-based neural network program. (Invest OphthalmolVis Sci. 2010;51:5546–5555) DOI:10.1167/iovs.10-5369
There has been a great interest in attempting to identifypatients at risk for post-LASIK corneal ectasia before sur-
gery. It is now known that corneas that share similarities withectatic corneas (keratoconus or pellucid marginal corneal de-generation) are at higher risk for this complication.1–4 Thus,efforts have been concentrated on using available speculartopography, tomography, or biomechanical studies to recog-nize keratoconus (KC) in its earliest stages.5–12 KC is a nonin-flammatory progressive localized thinning and protrusion ofthe cornea. The progressive nature of the disease makes iteasily recognized in its advanced stages. However, there is a
persistent ambiguity regarding the exact definition of a suspectkeratoconus (KCS) cornea, and there are no widely acceptedcriteria for categorizing an eye as KCS.13–15 It has been debatedwhether the first detectable sign of KC, consequently definingthe KCS category, is a localized steepening seen with Placidocorneal topography15–19 or a slight bowing of the posteriorcorneal surface detected by tomography.9,14,20 Current biome-chanical parameter (corneal hysteresis and corneal resistance fac-tor) studies have shown that KCS corneas differ significantly fromnormal and KC corneas, but the results have been of little clinicalvalue until now.5 An important practical task for clinicians is toimprove the sensitivity of their screening methods for identifyingpatients with mild manifestations of KC and prevent iatrogenickeratectasia. Even if only one eye is affected initially, KC is anasymmetric progressive disorder that will ultimately affect botheyes. The reported frequency of unilateral KC among all KCpatients varies, depending on the methods used for diagnosis. Theestimated prevalence of unilateral KC ranges from 14.3% to 41%in studies in which only clinical parameters were considered.21–23
In more recent studies, the reported frequencies based on com-puterized videokeratography diagnostic techniques ranged from0.5% to 4%.18,24 Thus, the incidence of true unilateral KC is verylow, and results in some studies have suggested that, if patientsare observed for a sufficient period, signs of keratoconus willdevelop in the opposite eye.23,24 This conclusion was reachedmainly because both eyes in unilateral KC have the same geneticmakeup, and therefore the less-affected eye is also thought tohave KC,15 considering that KC is genetically described as amodel of autosomal dominant transmission with complete pen-etrance but incomplete expression.25–28 Therefore, the termforme fruste KC (FFKC), first proposed by Amsler in 196129 andthen adopted by Klyce et al.,15 should be used to define thecontralateral eye in unilateral KC, the forme fruste being “anincomplete, abortive, or unusual form of a syndrome or dis-ease.”29
Thus, investigating these particular eyes and determiningthe topographic and tomographic characteristics of their cor-neas may help to identify at-risk corneas.
The purposes of our study were to describe and comparetopography and tomography indices, as well as the central toperiphery percentage of thickness increase and the percentageof anterior and posterior curvature modification in threegroups of corneas classified as normal (N; LASIK with a 2-yearsfollow-up), FFKC, and KC by specular topography, on the basisof the artificial intelligence of the Corneal Navigator OPDsystem (Nidek Co., Ltd., Gamagori, Japan)30–32 and then tocombine those indices in discriminant functions to detect mildectatic corneas.
METHODS
This retrospective study adhered to the tenets of the Declaration ofHelsinki and included 143 eyes of 143 patients divided into three groups:normal, FFKC, and KC. Only one eye of each patient was included.
The Orbscan IIz (Bausch & Lomb Surgical, Rochester, NY) and OPD-Scan (Corneal Navigator; Nidek Co., Ltd.) videokeratographs were ob-
From the 1Rothschild Foundation, Paris, France; and the 2Centerfor Expertise and Research in Optics for Clinicians (CEROC), Paris,France.
Submitted for publication February 11, 2010; revised March 29,April 30, and June 1, 2010; accepted June 9, 2010.
Disclosure: A. Saad, None; D. Gatinel, NoneCorresponding author: Damien Gatinel, Fondation Ophtal-
mologique Adolphe de Rothschild, 25, Rue Manin, 75019, Paris,France; [email protected].
tained by two experienced operators. Segregation of the three groups wasbased on the results of the Nidek Corneal Navigator (NCN), which uses anartificial intelligence technique to train a computer neural network torecognize specific classifications of corneal topography. The NCN firstcalculates various indices representing corneal shape characteristics. Theindices are then used by the NCN to score the measurement’s similarity tonine clinical classification types: normal, astigmatism, suspected keratoco-nus, keratoconus, pellucid marginal degeneration, postkeratoplasty, myo-pic refractive surgery, hyperopic refractive surgery, and unclassified vari-ation. These diagnostic results are estimated based on the relationshipbetween the corneal indices and cases. The percentage of similarity isindicated for each diagnostic condition; the value varies from 0% to 99%.The indicated result for each topography condition is independent fromother categories.
Eyes in the normal group had a score of 99% similarity tonormality using the NCN analysis. In addition, data provided by theOrbscan IIz (Bausch & Lomb Surgical, Inc.) for the normal group did notreveal any topography patterns suggestive of KCS, such as focal or inferior
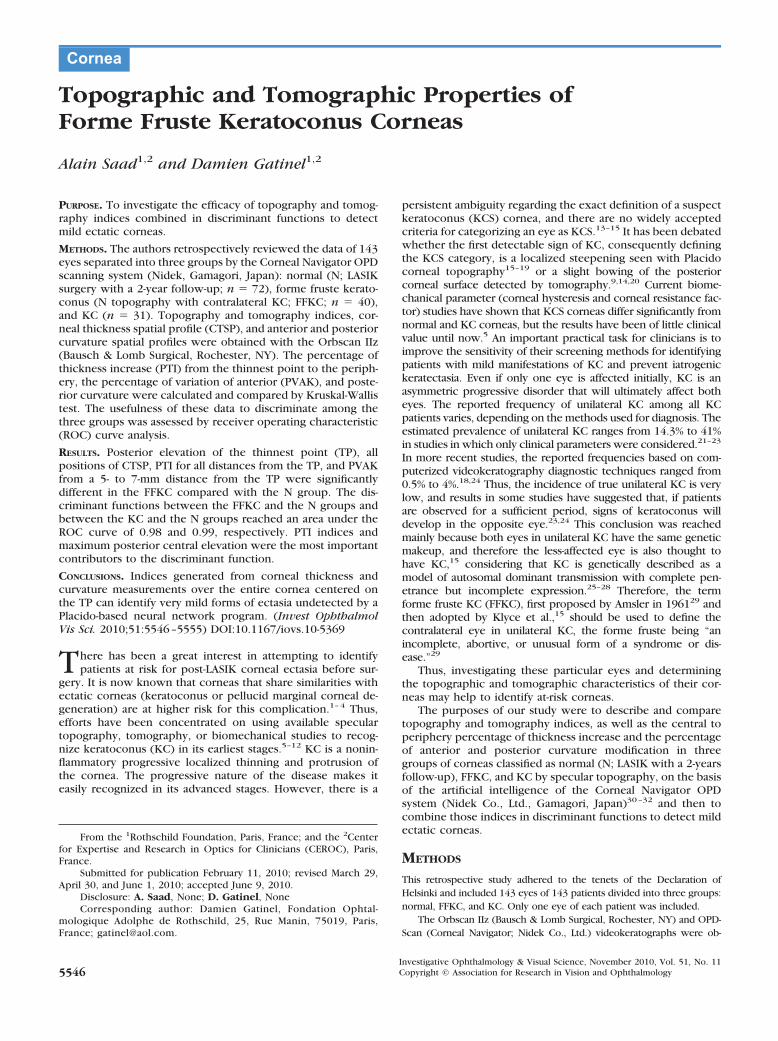
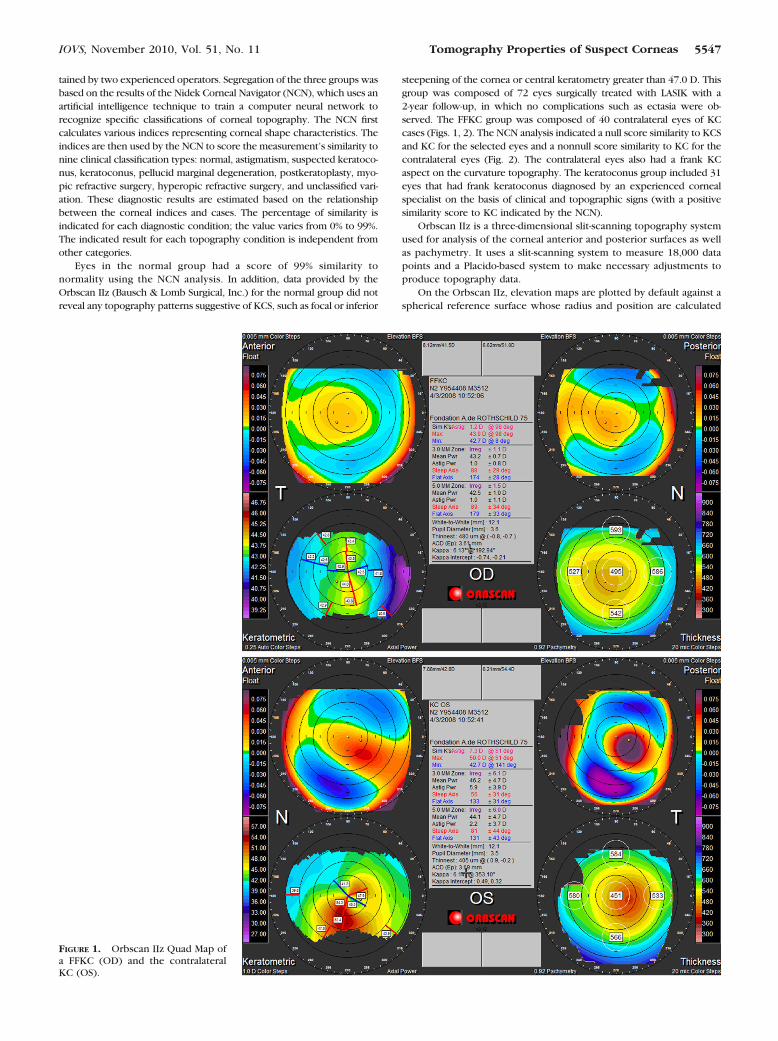
steepening of the cornea or central keratometry greater than 47.0 D. Thisgroup was composed of 72 eyes surgically treated with LASIK with a2-year follow-up, in which no complications such as ectasia were ob-served. The FFKC group was composed of 40 contralateral eyes of KCcases (Figs. 1, 2). The NCN analysis indicated a null score similarity to KCSand KC for the selected eyes and a nonnull score similarity to KC for thecontralateral eyes (Fig. 2). The contralateral eyes also had a frank KCaspect on the curvature topography. The keratoconus group included 31eyes that had frank keratoconus diagnosed by an experienced cornealspecialist on the basis of clinical and topographic signs (with a positivesimilarity score to KC indicated by the NCN).
Orbscan IIz is a three-dimensional slit-scanning topography systemused for analysis of the corneal anterior and posterior surfaces as wellas pachymetry. It uses a slit-scanning system to measure 18,000 datapoints and a Placido-based system to make necessary adjustments toproduce topography data.
On the Orbscan IIz, elevation maps are plotted by default against aspherical reference surface whose radius and position are calculated
FIGURE 1. Orbscan IIz Quad Map ofa FFKC (OD) and the contralateralKC (OS).
IOVS, November 2010, Vol. 51, No. 11 Tomography Properties of Suspect Corneas 5547
without constraints (float mode). The following criteria were analyzedand compared by using the Orbscan Quad Map representation: centralpower and radius in both anterior best-fit sphere (BFS) and posteriorBFS; maximum anterior central elevation (MACE) and posterior centralelevation (MPCE) relative to the BFS in the central 1.0-mm radius zone;simulated keratometry in maximum (SKmax) and minimum (SKmin)dioptric values; irregularity index at 3.0 and 5.0 mm; central pachy-metry (CP); thinnest pachymetry (TP); and magnitude of the decentra-tion of the thinnest corneal point from the corneal geometric center(DTP). All values except MACE and MPCE are directly available fromthe Quad Map display mode. The MACE and MPCE values can beobtained via the Stats menu, which is accessed through the Tools menuon the main toolbar. The elevation and topography and tomographymaps can be rotated to view the acquired image in a different perspec-tive. This positioning is accomplished by determining the perpendic-ular to the surface at the specified center location. The surface is thenrotated to bring the new center to the map center and the surfacenormal parallel to the instrument axis. The rotation is obtained via theTools menu, by clicking on the surface rotation button and selectingthe preferred center location. We considered the TP of the cornea asthe center location to obtain the following data:
The elevation of the TP (AETP and PETP: anterior and posteriorelevation of the TP), acquired by manually guiding the cursor over thecenter of the anterior and posterior elevation maps, respectively.
The anterior and posterior averages of keratometry values of thepoints on nine circular adjacent rings of 0.5-mm width centered onthe TP. These keratometry values were processed from the slitscanning data rotated and centered on the TP. The outer diameter
of each ring varied from 1 mm (inner ring) to 9 mm (outer ring).Knowing the mean keratometry of each ring, we calculated theanterior and posterior central to peripheral percentage of variationin anterior and posterior curvature (increase or decrease; PVAKn,
and PVPKn) for each radius with the formula: PVA(P)Kn � [Kn �(Kn�0.5)]/Kn�0.5 where Kn is the mean corneal curvature at eachradius and n represents the radius of imaginary rings centered onthe TP. In contrast to asphericity, which is a global descriptor of therate of change of curvature between the center and the peripheryof the cornea, the PVA(P)K represents the local variation in thecurvature with steps of 0.5 mm of radius. Therefore, it provides amore exhaustive and complete approach to investigating the changesin corneal curvature in the studied population. Similarly, the averagesof thickness values of the points located on nine rings centered on theTP were obtained to create the corneal thickness profile. We calcu-lated the percentage of thickness increase33,34 for each ring (PTI),using the following formula: PTI � (Tn � TP)/TP where Tn is thecorneal thickness average at each rings and n represents the radius ofthe outer perimeter of each ring centered on the TP.
All numerical results were entered into a database, and statisticalanalyses were performed (xLSTAT2009 statistical analysis software;Addinsoft, New York, NY) with the Kruskal-Wallis test followed bya Dunn procedure for multiple nonparametric comparisons and aBonferroni correction to maintain a global level of P � 0.05.
Discriminant analysis was used to determine the group of an ob-servation based on a set of variables obtained from the anterior andposterior corneal surface and from the thickness spatial profile. Onthe basis of the N and FFKC groups, the discriminant analysis
TABLE 1. Demographic Characteristics of Patients
Characteristics Normal FFKC KC
Patients, n 72 40 31OD, n (%) 44 (61) 20 (50) 16 (52)Mean age, y � SD 33.3 � 9.3 33.4 � 13.1 32.0 � 7.7Male sex, n (%) 24 (33) 27 (67) 24 (77)Mean SE, D (range) �4.16 � 2.77 (�11.00 to �0.50) �1.13 � 0.96 (�2.50 to 0.50) �7.74 � 3.14 (�15.75 to 0.00)
SE, spherical equivalent.
FIGURE 2. OPD scan and NCN of the FFKC (OD) described in Figure 1 and the contralateral KC.
5548 Saad and Gatinel IOVS, November 2010, Vol. 51, No. 11
constructs a set of linear functions of the variables, known asdiscriminant functions, such as
L � b1x1 � b2x2 � bnxn � c
where b is a discriminant coefficient, x is an input variable, and c is aconstant. The following discriminant functions were generated:
FT: elevation and decentration of the TP
FPTI: percentage of thickness increase over the entire cornea
FPVAK: percentage of variation of anterior curvature over theentire cornea
FPVPK: percentage of variation of posterior curvature over theentire cornea
TABLE 2. All Studied Factors and Intergroup Comparison
P-values in bold denote statistically significant differences.
IOVS, November 2010, Vol. 51, No. 11 Tomography Properties of Suspect Corneas 5549
FI: irregularity at 3 and 5 mm
FA: all the studied indices
The discriminant functions can be used to predict the class of a newobservation with unknown class.
Receiver operating characteristic (ROC) curves were plotted to obtaincritical values that allow classification with maximum accuracy. For theoutput values of the discriminant functions tested, the area under the ROCcurve (AUROC), sensitivity [true positive/(true positivefalse negative)],specificity [true negative/(true negativefalse positive)], accuracy [(truepositivetrue negative)/total number of cases], and cutoff value werecalculated.
RESULTS
Table 1 shows the demographic data in the three groups.There were significantly more men in the KC and the FFKCgroups (P � 0.001). The mean age was not significantly differ-ent between the groups. In Table 2 the mean � SD of thestudied factors are shown as well as an intergroup comparison.
Normal and FFKC Groups
There was no significant difference between the normal groupand the FFKC group for the ABFS, PBFS, SKmax, and SKmin. The3- and 5-mm irregularities were significantly higher in the FFKCgroup. The CP was significantly lower in the FFKC groupcompared with that in the normal group, and the TP wassignificantly thinner and decentered. The differences betweenthe CP and the TP (CP � TP) and the PETP were significantlylarger in the FFKC group than in the normal group (Table 2).The MACE, MPCE, and AETP were not significantly differentbetween the two groups.
Normal and KC Groups
The anterior and posterior elevation indices deriving from theQuad Map (ABFS, PBFS, SKmax and SKmin, irregularity at 3 and5 mm) were significantly different in the KC group than in thenormal group. The CP and the TP were also significantlydifferent in the two groups and the difference between the CPand the TP (CP � TP) was significantly larger in the KC group.The TP was more inferotemporally located in the KC groupthan in the normal group, and the MACE, MPCE, AETP, andPETP were significantly higher in the KC group (Table 2).
Anterior Corneal Curvature
The mean anterior curvature was significantly different for anydistance from the cornea’s TP, except at 8.0 and 9.0 mm betweenthe normal group and the KC group, but not between the normalgroup and the FFKC group (Table 2, Fig. 3). The cornea flattenedsignificantly faster at 5.0, 6.0, and 7.0 mm from the TP in the FFKCgroup compared to the normal group (Fig. 4).
Corneal Thickness Spatial Profile
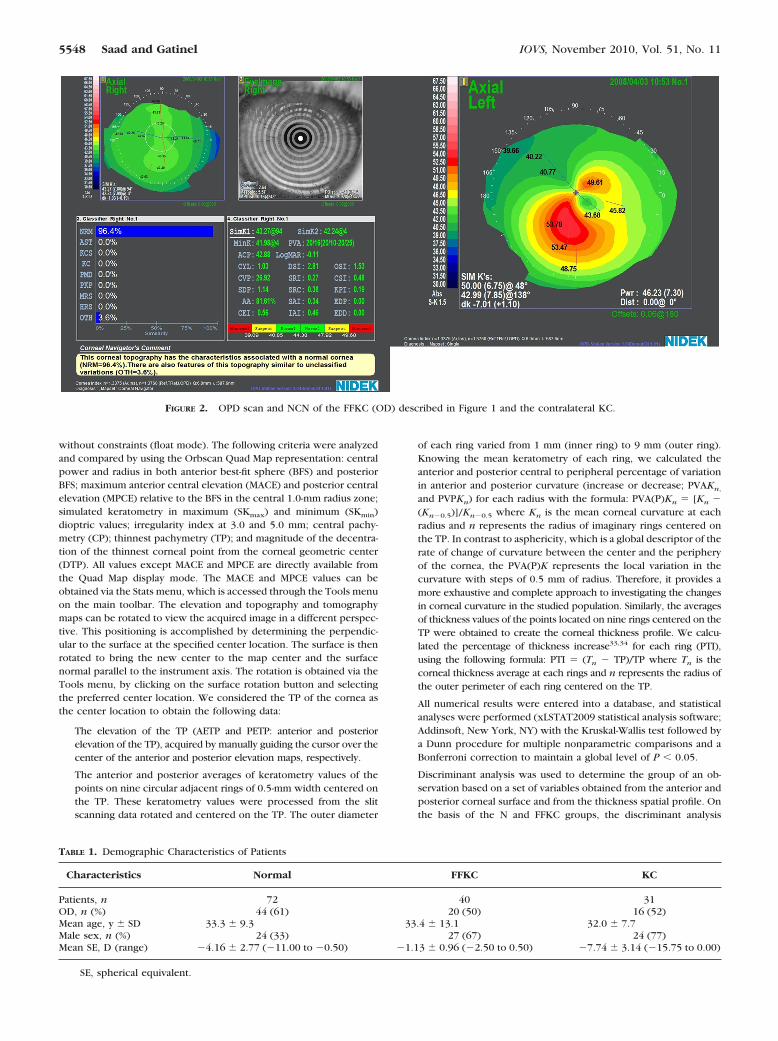
The mean thickness of all corneal zones was significantly lowerin the FFKC and KC group compared to the normal group(Table 2, Fig. 5). The cornea thickened significantly faster fromthe TP to the periphery in all corneal zones in the FFKC and KCgroup compared to the normal group (Fig. 6).
Posterior Corneal Curvature
The mean posterior curvature was significantly lower from a 1-to 6-mm distance from the cornea’s TP between the normalgroup and the KC group, but not between the normal groupand the FFKC group (Table 2). The cornea flattened signifi-
FIGURE 3. Mean corneal curvatures on rings concentric to the TP. ***P � 0.0001 between the N and KC groups; **P � 0.001 between the N andKC groups; †††P � 0.0001 between the FFKC and KC groups; ††P � 0.001 between the FFKC and KC groups; †P � 0.05 between the FFKC andKC groups.
5550 Saad and Gatinel IOVS, November 2010, Vol. 51, No. 11
cantly faster from 3.0 to 9.0 mm from the TP in the KC groupcompared to the normal group (Table 2).
Discriminant Analysis and ROC Curve
The formulas for all discriminant functions are shown in theAppendix. The functions were derived from N and FFKC indi-ces and their output values were tested to differentiate be-tween the N and FFKC groups and the N and KC groups. Theoutput values of the discriminant function were significantlydifferent between the three groups (P � 0.0001; Table 3).
The function FT consisted of the TP, the difference be-tween the CP and TP, the decentration of the TP, and the AETPand PETP, where the difference between the CP and TP hadthe highest discriminant coefficient (0.501).
The function FPTI consisted of the PTI over the entirecornea, where the PTI at 4 mm from the TP had the highestdiscriminant coefficient (2.846).
The function FPVAK consisted of the PVAK over the entirecornea, where the PVAK at 5 mm from the TP had the highestdiscriminant coefficient (1.019).
The function FPVPK consisted of the PVPK over the entirecornea, where the PVPK at 2 mm from the TP had the highestdiscriminant coefficient (0.527).
The function FI consisted of the irregularity at 3 and 5 mm,where the irregularity at 5 mm had the highest discriminantcoefficient (0.543).
The function FA was derived from all the studied factors.The PTI at 5 and 6 mm from the TP had the highest relative
FIGURE 4. Percentage of variation of anterior curvature from the TP to the periphery. ***P � 0.0001 between the N and KC groups; †††P � 0.0001between the FFKC and KC groups; ‡‡‡P � 0.0001 between the N and FFKC groups.
FIGURE 5. Mean corneal thicknesses on concentric rings to the TP. ***P � 0.0001 between the N and KC groups; †††P � 0.0001 between the FFKCand KC groups; ‡‡‡P � 0.0001 between the N and FFKC groups.
IOVS, November 2010, Vol. 51, No. 11 Tomography Properties of Suspect Corneas 5551
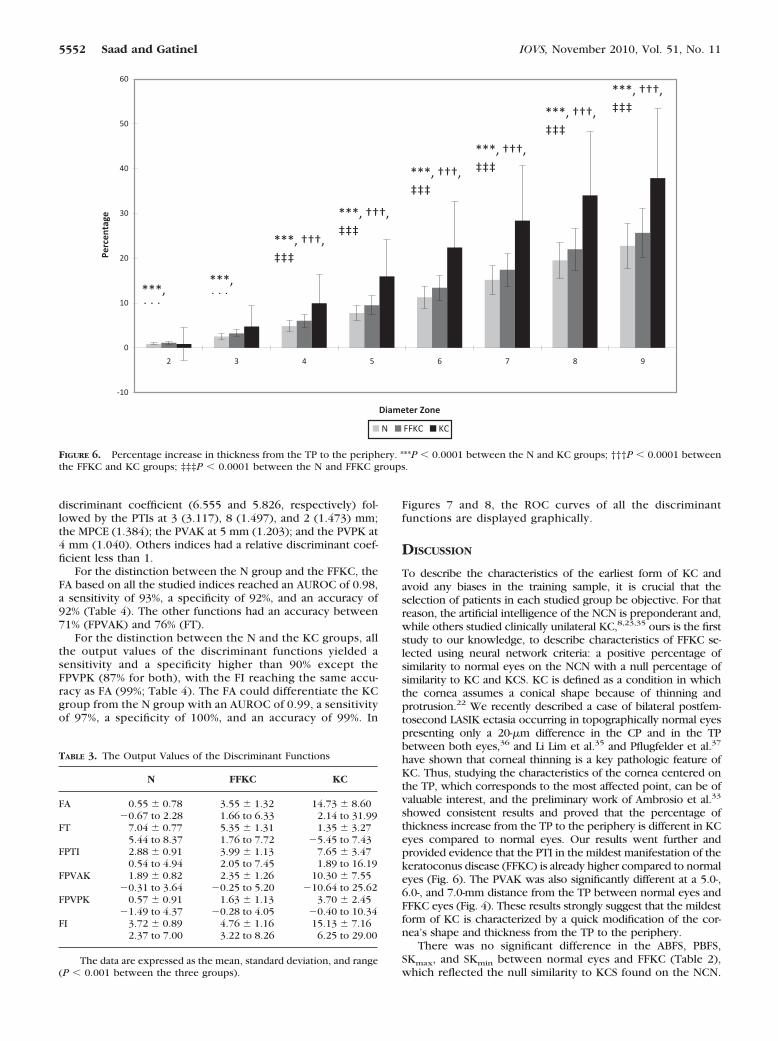
discriminant coefficient (6.555 and 5.826, respectively) fol-lowed by the PTIs at 3 (3.117), 8 (1.497), and 2 (1.473) mm;the MPCE (1.384); the PVAK at 5 mm (1.203); and the PVPK at4 mm (1.040). Others indices had a relative discriminant coef-ficient less than 1.
For the distinction between the N group and the FFKC, theFA based on all the studied indices reached an AUROC of 0.98,a sensitivity of 93%, a specificity of 92%, and an accuracy of92% (Table 4). The other functions had an accuracy between71% (FPVAK) and 76% (FT).
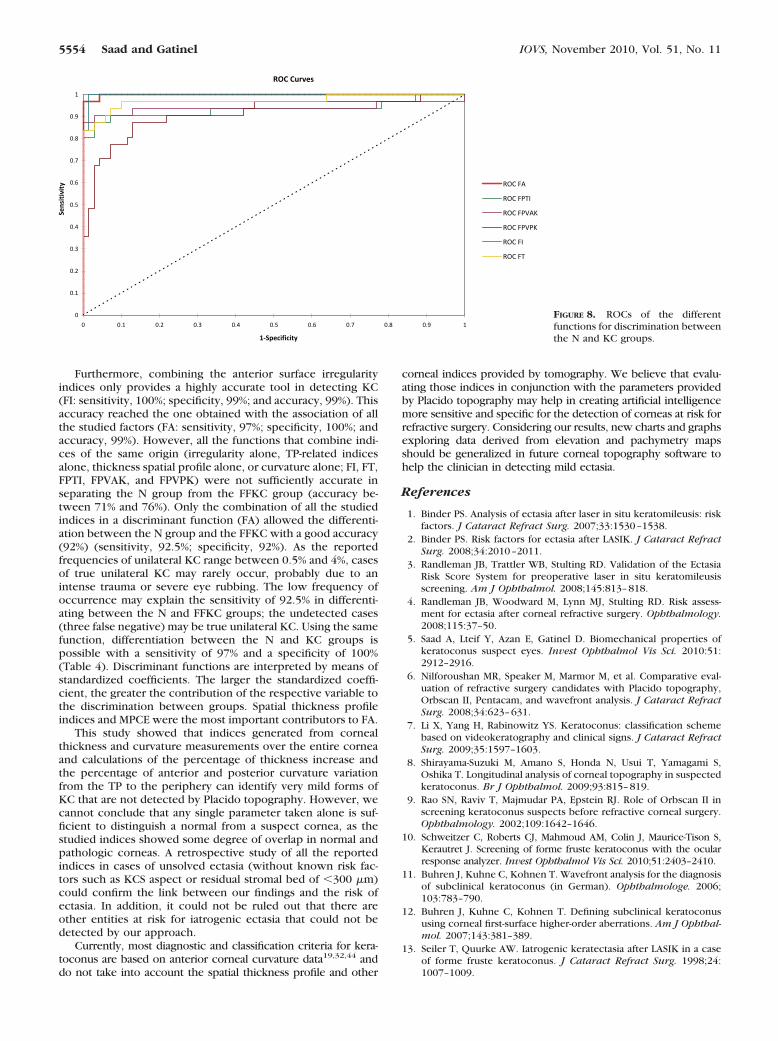
For the distinction between the N and the KC groups, allthe output values of the discriminant functions yielded asensitivity and a specificity higher than 90% except theFPVPK (87% for both), with the FI reaching the same accu-racy as FA (99%; Table 4). The FA could differentiate the KCgroup from the N group with an AUROC of 0.99, a sensitivityof 97%, a specificity of 100%, and an accuracy of 99%. In
Figures 7 and 8, the ROC curves of all the discriminantfunctions are displayed graphically.
DISCUSSION
To describe the characteristics of the earliest form of KC andavoid any biases in the training sample, it is crucial that theselection of patients in each studied group be objective. For thatreason, the artificial intelligence of the NCN is preponderant and,while others studied clinically unilateral KC,8,23,35 ours is the firststudy to our knowledge, to describe characteristics of FFKC se-lected using neural network criteria: a positive percentage ofsimilarity to normal eyes on the NCN with a null percentage ofsimilarity to KC and KCS. KC is defined as a condition in whichthe cornea assumes a conical shape because of thinning andprotrusion.22 We recently described a case of bilateral postfem-tosecond LASIK ectasia occurring in topographically normal eyespresenting only a 20-�m difference in the CP and in the TPbetween both eyes,36 and Li Lim et al.35 and Pflugfelder et al.37
have shown that corneal thinning is a key pathologic feature ofKC. Thus, studying the characteristics of the cornea centered onthe TP, which corresponds to the most affected point, can be ofvaluable interest, and the preliminary work of Ambrosio et al.33
showed consistent results and proved that the percentage ofthickness increase from the TP to the periphery is different in KCeyes compared to normal eyes. Our results went further andprovided evidence that the PTI in the mildest manifestation of thekeratoconus disease (FFKC) is already higher compared to normaleyes (Fig. 6). The PVAK was also significantly different at a 5.0-,6.0-, and 7.0-mm distance from the TP between normal eyes andFFKC eyes (Fig. 4). These results strongly suggest that the mildestform of KC is characterized by a quick modification of the cor-nea’s shape and thickness from the TP to the periphery.
There was no significant difference in the ABFS, PBFS,SKmax, and SKmin between normal eyes and FFKC (Table 2),which reflected the null similarity to KCS found on the NCN.
FIGURE 6. Percentage increase in thickness from the TP to the periphery. ***P � 0.0001 between the N and KC groups; †††P � 0.0001 betweenthe FFKC and KC groups; ‡‡‡P � 0.0001 between the N and FFKC groups.
TABLE 3. The Output Values of the Discriminant Functions
N FFKC KC
FA 0.55 � 0.78 3.55 � 1.32 14.73 � 8.60�0.67 to 2.28 1.66 to 6.33 2.14 to 31.99
FT 7.04 � 0.77 5.35 � 1.31 1.35 � 3.275.44 to 8.37 1.76 to 7.72 �5.45 to 7.43
FPTI 2.88 � 0.91 3.99 � 1.13 7.65 � 3.470.54 to 4.94 2.05 to 7.45 1.89 to 16.19
FPVAK 1.89 � 0.82 2.35 � 1.26 10.30 � 7.55�0.31 to 3.64 �0.25 to 5.20 �10.64 to 25.62
FPVPK 0.57 � 0.91 1.63 � 1.13 3.70 � 2.45�1.49 to 4.37 �0.28 to 4.05 �0.40 to 10.34
FI 3.72 � 0.89 4.76 � 1.16 15.13 � 7.162.37 to 7.00 3.22 to 8.26 6.25 to 29.00
The data are expressed as the mean, standard deviation, and range(P � 0.001 between the three groups).
5552 Saad and Gatinel IOVS, November 2010, Vol. 51, No. 11
One of the first detectable signs of keratoconus with Placidocorneal topography is a localized steepening.15 The FFKC is themildest stage of the disease; the eyes included in our FFKC groupwere negative for KC and KCS detection, on the basis of anteriorcurvature data only. Thus, current Placido-based indices were notsensitive enough to detect the earliest forms of KC. Irregularityindices at 3 and 5 mm show the optical surface irregularity that isproportional to the standard deviation of the axis-independentsurface curvature. They are calculated automatically from withinthe Orbscan IIz software, according to a statistical combination ofthe standard deviations of the mean and toric curvatures.38 Someinvestigators have reported that these irregularity indices weresignificantly higher in KCS corneas than in normal corneas.35,39
Of interest, in our study, the 3- and 5-mm irregularity indices weresignificantly higher in FFKC than in normal corneas; however, thislevel of irregularity was not sufficient to exceed the threshold forpositive KCS suspicion with the NCN. The CP and the TP weresignificantly lower in FFKC (P � 0.0001, Table 2), and the sub-traction of the CP from the TP (CP � TP) significantly differenti-ated the three groups (Table 2). It had been reported that the TPof keratoconic eyes is typically located inferotemporally.40,41 Wefound that the TP of the FFKCs was located inferiorly comparedwith that of the normal eyes (P � 0.0001, Table 2). Horizontal andvertical displacement of the TP on the pachymetry map is com-monly associated with poor patient fixation or operator centra-tion during acquisition of the Orbscan IIz image.6 However, mul-tiple Orbscan images were acquired for our FFKC groups. Many
studies described modifications in the posterior corneal surface inkeratoconus,14,35,42 and some investigators have proposed a KCscreening algorithm, using the posterior elevation on Orbscan IIzcombined with videokeratography.9The PETP was significantlyhigher in FFKC (P � 0.0001, Table 2) compared with normalcorneas. Thus, even if not identified as suspect by Placido topog-raphy indices, the FFKC group had PETP significantly higher thanin the normal corneas. This result corroborates the hypothesisthat an increase in posterior elevation concomitant to paracentralcorneal thinning may be the first sign of subclinical keratoco-nus.9,14
Tomidokoro et al.43 showed that the central posterior cornealcurvature is significantly lower (larger absolute value) in KCS andKC eyes than in normal eyes and concluded that deformation,including local protrusion, occurs not only in the anterior but alsoin the posterior corneal surface of keratoconus eyes. We found asignificantly larger absolute value for posterior curvature from a1.0- to 6.0-mm distance from the TP in KC eyes compared to theN eyes; however, the difference was not significantly differentbetween the N and FFKC groups. The PVPK from the TP was notsignificantly different between the N and FFKC groups. Thus,elevation indices of the posterior surface (MPCE, PETP) seem tobe more sensitive than posterior curvature indices in discriminat-ing between normal eyes and mild KC eyes.
As shown in Table 4, most of the discriminant functionswere able to separate between the N and the KC group whichsupports the idea that frank KC is an easily detectable entity.
TABLE 4. Data of the Discriminant Functions
DiscriminantFunction
Cutoff Value AUROC Sensitivity (%) Specificity (%) Accuracy (%)
FIGURE 7. ROCs of the differentfunctions for discrimination betweenthe N and FFKC groups.
IOVS, November 2010, Vol. 51, No. 11 Tomography Properties of Suspect Corneas 5553
Furthermore, combining the anterior surface irregularityindices only provides a highly accurate tool in detecting KC(FI: sensitivity, 100%; specificity, 99%; and accuracy, 99%). Thisaccuracy reached the one obtained with the association of allthe studied factors (FA: sensitivity, 97%; specificity, 100%; andaccuracy, 99%). However, all the functions that combine indi-ces of the same origin (irregularity alone, TP-related indicesalone, thickness spatial profile alone, or curvature alone; FI, FT,FPTI, FPVAK, and FPVPK) were not sufficiently accurate inseparating the N group from the FFKC group (accuracy be-tween 71% and 76%). Only the combination of all the studiedindices in a discriminant function (FA) allowed the differenti-ation between the N group and the FFKC with a good accuracy(92%) (sensitivity, 92.5%; specificity, 92%). As the reportedfrequencies of unilateral KC range between 0.5% and 4%, casesof true unilateral KC may rarely occur, probably due to anintense trauma or severe eye rubbing. The low frequency ofoccurrence may explain the sensitivity of 92.5% in differenti-ating between the N and FFKC groups; the undetected cases(three false negative) may be true unilateral KC. Using the samefunction, differentiation between the N and KC groups ispossible with a sensitivity of 97% and a specificity of 100%(Table 4). Discriminant functions are interpreted by means ofstandardized coefficients. The larger the standardized coeffi-cient, the greater the contribution of the respective variable tothe discrimination between groups. Spatial thickness profileindices and MPCE were the most important contributors to FA.
This study showed that indices generated from cornealthickness and curvature measurements over the entire corneaand calculations of the percentage of thickness increase andthe percentage of anterior and posterior curvature variationfrom the TP to the periphery can identify very mild forms ofKC that are not detected by Placido topography. However, wecannot conclude that any single parameter taken alone is suf-ficient to distinguish a normal from a suspect cornea, as thestudied indices showed some degree of overlap in normal andpathologic corneas. A retrospective study of all the reportedindices in cases of unsolved ectasia (without known risk fac-tors such as KCS aspect or residual stromal bed of �300 �m)could confirm the link between our findings and the risk ofectasia. In addition, it could not be ruled out that there areother entities at risk for iatrogenic ectasia that could not bedetected by our approach.
Currently, most diagnostic and classification criteria for kera-toconus are based on anterior corneal curvature data19,32,44 anddo not take into account the spatial thickness profile and other
corneal indices provided by tomography. We believe that evalu-ating those indices in conjunction with the parameters providedby Placido topography may help in creating artificial intelligencemore sensitive and specific for the detection of corneas at risk forrefractive surgery. Considering our results, new charts and graphsexploring data derived from elevation and pachymetry mapsshould be generalized in future corneal topography software tohelp the clinician in detecting mild ectasia.
References
1. Binder PS. Analysis of ectasia after laser in situ keratomileusis: riskfactors. J Cataract Refract Surg. 2007;33:1530–1538.
2. Binder PS. Risk factors for ectasia after LASIK. J Cataract RefractSurg. 2008;34:2010–2011.
3. Randleman JB, Trattler WB, Stulting RD. Validation of the EctasiaRisk Score System for preoperative laser in situ keratomileusisscreening. Am J Ophthalmol. 2008;145:813–818.
4. Randleman JB, Woodward M, Lynn MJ, Stulting RD. Risk assess-ment for ectasia after corneal refractive surgery. Ophthalmology.2008;115:37–50.
5. Saad A, Lteif Y, Azan E, Gatinel D. Biomechanical properties ofkeratoconus suspect eyes. Invest Ophthalmol Vis Sci. 2010:51:2912–2916.
6. Nilforoushan MR, Speaker M, Marmor M, et al. Comparative eval-uation of refractive surgery candidates with Placido topography,Orbscan II, Pentacam, and wavefront analysis. J Cataract RefractSurg. 2008;34:623–631.
7. Li X, Yang H, Rabinowitz YS. Keratoconus: classification schemebased on videokeratography and clinical signs. J Cataract RefractSurg. 2009;35:1597–1603.
8. Shirayama-Suzuki M, Amano S, Honda N, Usui T, Yamagami S,Oshika T. Longitudinal analysis of corneal topography in suspectedkeratoconus. Br J Ophthalmol. 2009;93:815–819.
9. Rao SN, Raviv T, Majmudar PA, Epstein RJ. Role of Orbscan II inscreening keratoconus suspects before refractive corneal surgery.Ophthalmology. 2002;109:1642–1646.
10. Schweitzer C, Roberts CJ, Mahmoud AM, Colin J, Maurice-Tison S,Kerautret J. Screening of forme fruste keratoconus with the ocularresponse analyzer. Invest Ophthalmol Vis Sci. 2010;51:2403–2410.
11. Buhren J, Kuhne C, Kohnen T. Wavefront analysis for the diagnosisof subclinical keratoconus (in German). Ophthalmologe. 2006;103:783–790.
12. Buhren J, Kuhne C, Kohnen T. Defining subclinical keratoconususing corneal first-surface higher-order aberrations. Am J Ophthal-mol. 2007;143:381–389.
13. Seiler T, Quurke AW. Iatrogenic keratectasia after LASIK in a caseof forme fruste keratoconus. J Cataract Refract Surg. 1998;24:1007–1009.
FIGURE 8. ROCs of the differentfunctions for discrimination betweenthe N and KC groups.
5554 Saad and Gatinel IOVS, November 2010, Vol. 51, No. 11
14. Schlegel Z, Hoang-xuan T, Gatinel D. Comparison of and correla-tion between anterior and posterior corneal elevation maps innormal eyes and keratoconus-suspect eyes. J Cataract RefractSurg. 2008;34:789–795.
15. Klyce SD. Chasing the suspect: keratoconus. Br J Ophthalmol.2009;93:845–847.
16. Klyce SD, Smolek MK, Maeda N. Keratoconus detection with the KISA%method-another view. J Cataract Refract Surg. 2000;26:472–474.
19. Rabinowitz YS, Rasheed K. KISA% index: a quantitative videokeratog-raphy algorithm embodying minimal topographic criteria for diagnos-ing keratoconus. J Cataract Refract Surg. 1999;25:1327–1335.
20. Mahon L, Kent D. Can true monocular keratoconus occur? ClinExp Optom. 2004;87:126, author reply 126.
21. Kennedy RH, Bourne WM, Dyer JA. A 48-year clinical and epidemio-logic study of keratoconus. Am J Ophthalmol. 1986;101:267–273.
22. Krachmer JH, Feder RS, Belin MW. Keratoconus and related non-inflammatory corneal thinning disorders. Surv Ophthalmol. 1984;28:293–322.
23. Li x, Rabinowitz YS, Rasheed K, Yang H. Longitudinal study of thenormal eyes in unilateral keratoconus patients. Ophthalmology.2004;111:440–446.
24. Holland DR, Maeda N, Hannush SB, et al. Unilateral keratoconus.Incidence and quantitative topographic analysis. Ophthalmology.1997;104:1409–1413.
25. Ihalainen A. Clinical and epidemiological features of keratoconusgenetic and external factors in the pathogenesis of the disease.Acta Ophthalmol Suppl. 1986;178:1–64.
26. Jacobs DS, Dohlman CH. Is keratoconus genetic? Int OphthalmolClin. 1993;33:249–260.
27. Rabinowitz YS, Maumenee IH, Lundergan MK, et al. Moleculargenetic analysis in autosomal dominant keratoconus. Cornea.1992;11:302–308.
28. Armitage JA, Bruce AS, Phillips AJ, Lindsay RG. Morphologicalvariants in keratoconus: anatomical observation or aetiologicallysignificant? Aust N Z J Ophthalmol. 1998;26(suppl 1):S68–S70.
29. Amsler M. The “forme fruste” of keratoconus (in German). WienKlin Wochenschr. 1961;73:842–843.
30. Buscemi PM. Nidek corneal navigator software for topographicanalysis of corneal states. J Refract Surg. 2004;20:S747–S750.
32. Maeda N, Klyce SD, Smolek MK. Neural network classification ofcorneal topography: preliminary demonstration. Invest Ophthal-mol Vis Sci. 1995;36:1327–1335.
33. Ambrosio R Jr, Alonso RS, Luz A, Coca Velarde LG. Corneal-thickness spatial profile and corneal-volume distribution: tomo-graphic indices to detect keratoconus. J Cataract Refract Surg.2006;32:1851–1859.
34. Luz A, Ursulio M, Castaneda D, Ambrosio R, Jr. Corneal thicknessprogression from the thinnest point to the limbus: study based ona normal and a keratoconus population to create reference values(in Portuguese). Arq Bras Oftalmol. 2006;69:579–583.
35. Lim L, Wei RH, Chan WK, Tan DT. Evaluation of keratoconus inAsians: role of Orbscan II and Tomey TMS-2 corneal topography.Am J Ophthalmol. 2007;143:390–400.
36. Saad A, Gatinel D. Bilateral corneal ectasia after laser in situkeratomileusis in patient with isolated difference in centralcorneal thickness between eyes. J Cataract Refract Surg. 36:1033–1035.
37. Pflugfelder SC, Liu Z, Feuer W, Verm A. Corneal thickness indicesdiscriminate between keratoconus and contact lens-induced cor-neal thinning. Ophthalmology. 2002;109:2336–2341.
38. Sonmez B, Doan MP, Hamilton DR. Identification of scanningslit-beam topographic parameters important in distinguishing nor-mal from keratoconic corneal morphologic features. Am J Oph-thalmol. 2007;143:401–408.
39. Tanabe T, Tomidokoro A, Samejima T, et al. Corneal regular andirregular astigmatism assessed by Fourier analysis of videokeratog-raphy data in normal and pathologic eyes. Ophthalmology. 2004;111:752–757.
40. Levy D, Hutchings H, Rouland JF, et al. Videokeratographic anom-alies in familial keratoconus. Ophthalmology. 2004;111:867–874.
41. Rabinowitz YS, Rasheed K, Yang H, Elashoff J. Accuracy of ultra-sonic pachymetry and videokeratography in detecting keratoco-nus. J Cataract Refract Surg. 1998;24:196–201.
43. Tomidokoro A, Oshika T, Amano S, Higaki S, Maeda N, Miyata K.Changes in anterior and posterior corneal curvatures in keratoco-nus. Ophthalmology. 2000;107:1328–1332.