34
Demand Information Distortion and Bullwhip Effect Chopra: Chap. 17

Demand Information Distortion and
Bullwhip Effect
Chopra: Chap. 17

Lessons of the Game
• Such oscillations are common
– Bullwhip effect (demand distortion)
• Everyone blames others - but problem is
with the structure
–
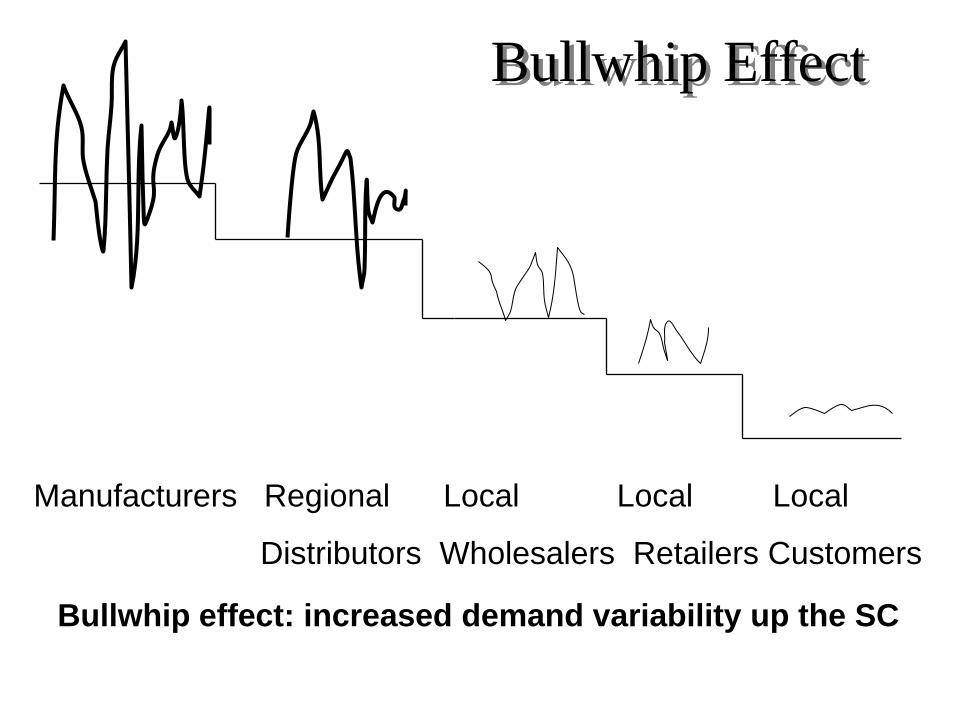
Bullwhip Effect
Manufacturers Regional Local Local Local
Distributors Wholesalers Retailers Customers
Bullwhip effect: increased demand variability up the SC

Bullwhip effect in the US PC supply chain
Semiconductor
1995 1996 1997 1998 1999 2000 2001
-40%
-20%
0%
20%
40%
60%
80%
PC
Semiconductor
Equipment
Changes in
demand
Semiconductor
1995 1996 1997 1998 1999 2000 2001
-40%
-20%
0%
20%
40%
60%
80%
PC
Semiconductor
Equipment
Changes in
demand
Annual percentage changes in demand (in $s) at three levels of the semiconductor
supply chain: personal computers, semiconductors and semiconductor manufacturing
equipment.

4L 5L 4L 5L
HP- Shipment Wholesaler-see-
thru
HP Laser: L –Series

5L
Elek Tek
Micro Electronic
PC Warehouse
Comp USA
Office
Depot
Best Buy
OfficeMax
Staple
12000 2000 6000
Sel
l –
ou
t S
td D
ev
Order Std Dev
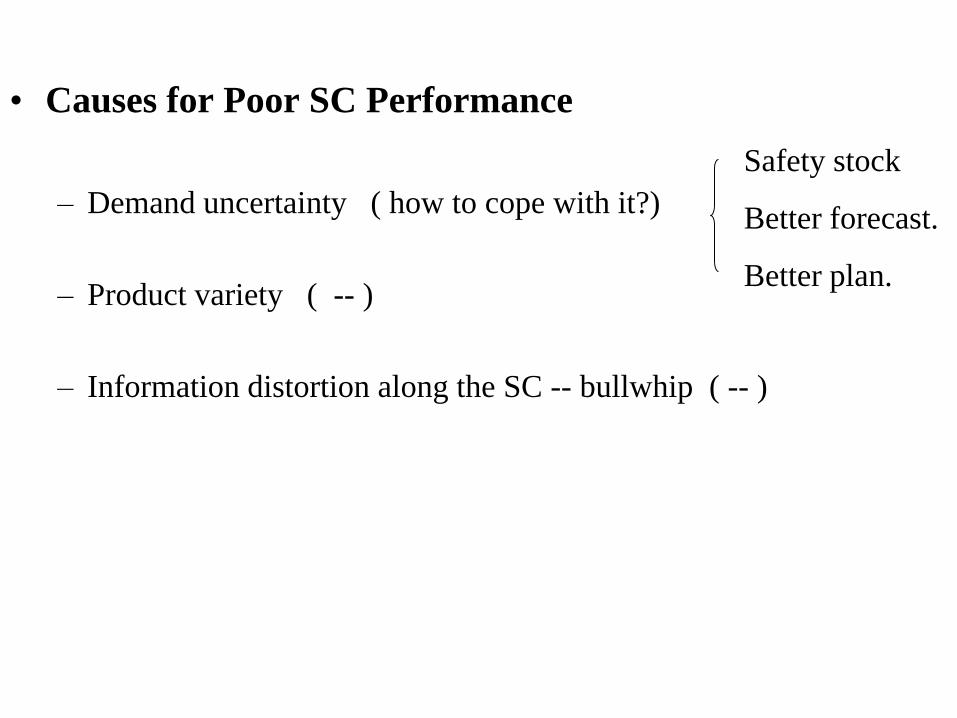
• Causes for Poor SC Performance
– Demand uncertainty ( how to cope with it?)
– Product variety ( -- )
– Information distortion along the SC -- bullwhip ( -- )
Safety stock
Better forecast.
Better plan.
Curses of Bullwhip Effect
• Curses
–
–
–
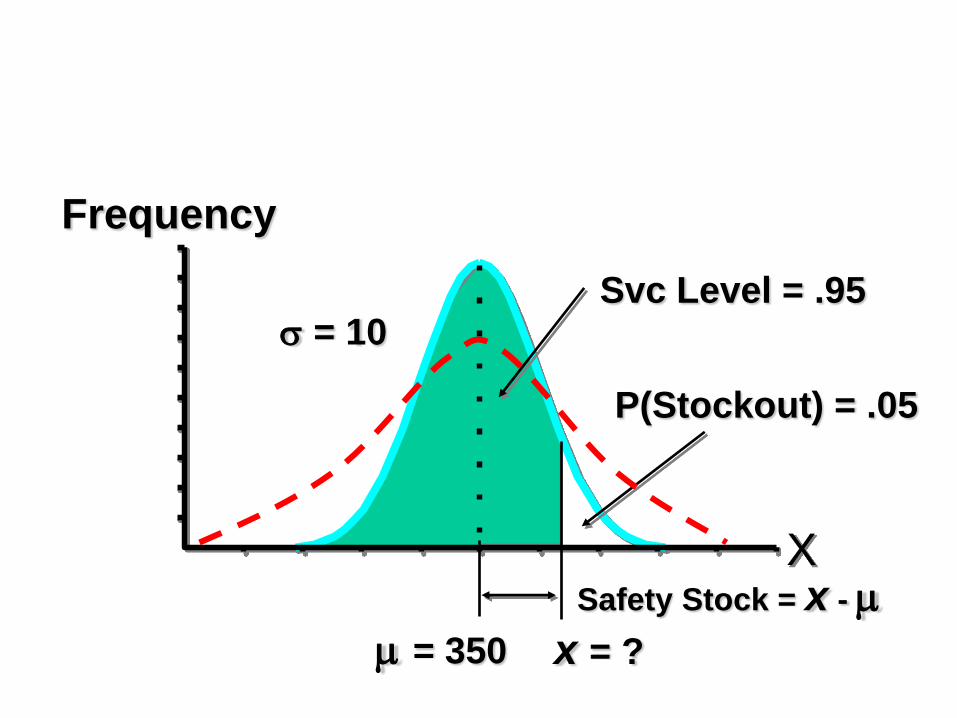
X
= 350
Svc Level = .95
P(Stockout) = .05
Frequency
x = ?
= 10
Safety Stock = x -
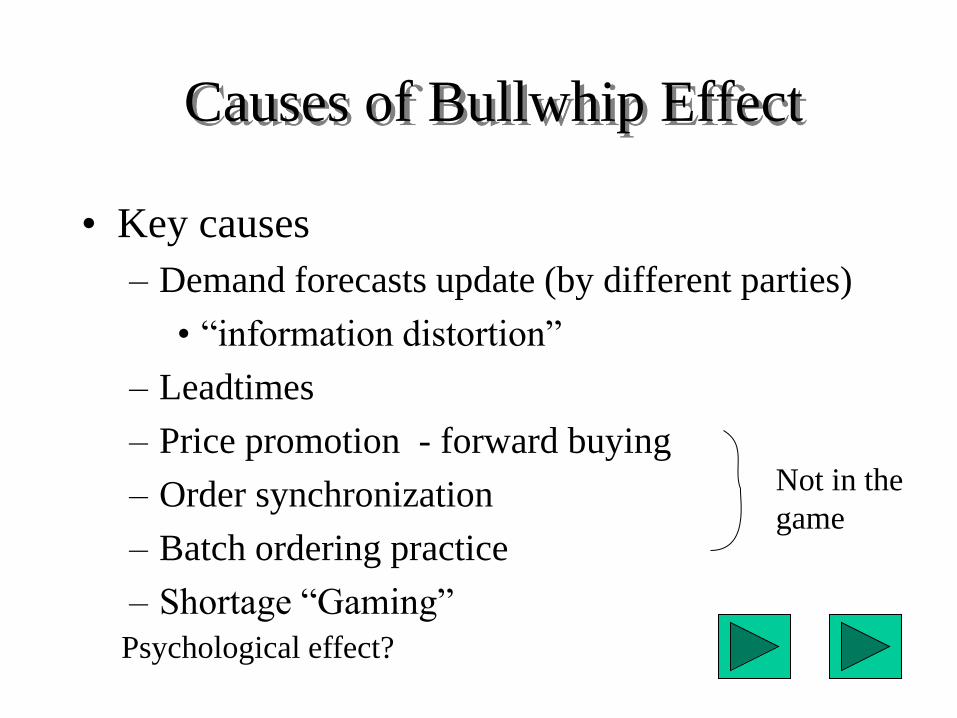
Causes of Bullwhip Effect
• Key causes
– Demand forecasts update (by different parties)
• “information distortion”
– Leadtimes
– Price promotion - forward buying
– Order synchronization
– Batch ordering practice
– Shortage “Gaming”
Not in the
game
Psychological effect?
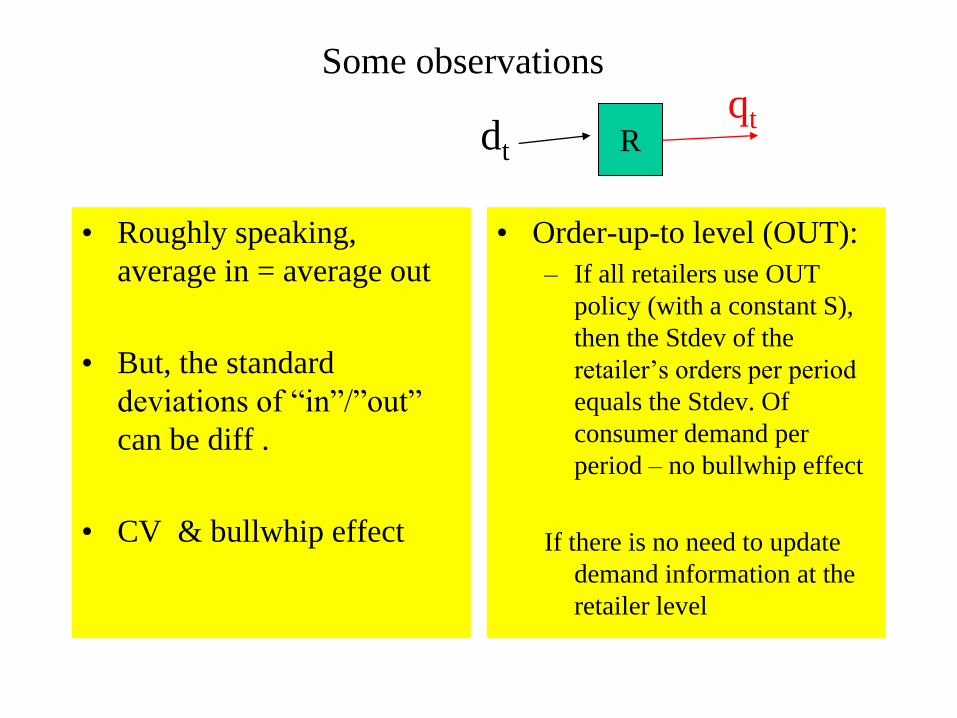
Some observations
• Roughly speaking,
average in = average out
• But, the standard
deviations of “in”/”out”
can be diff .
• CV & bullwhip effect
• Order-up-to level (OUT):
– If all retailers use OUT
policy (with a constant S),
then the Stdev of the
retailer’s orders per period
equals the Stdev. Of
consumer demand per
period – no bullwhip effect
If there is no need to update
demand information at the
retailer level
R dt
qt
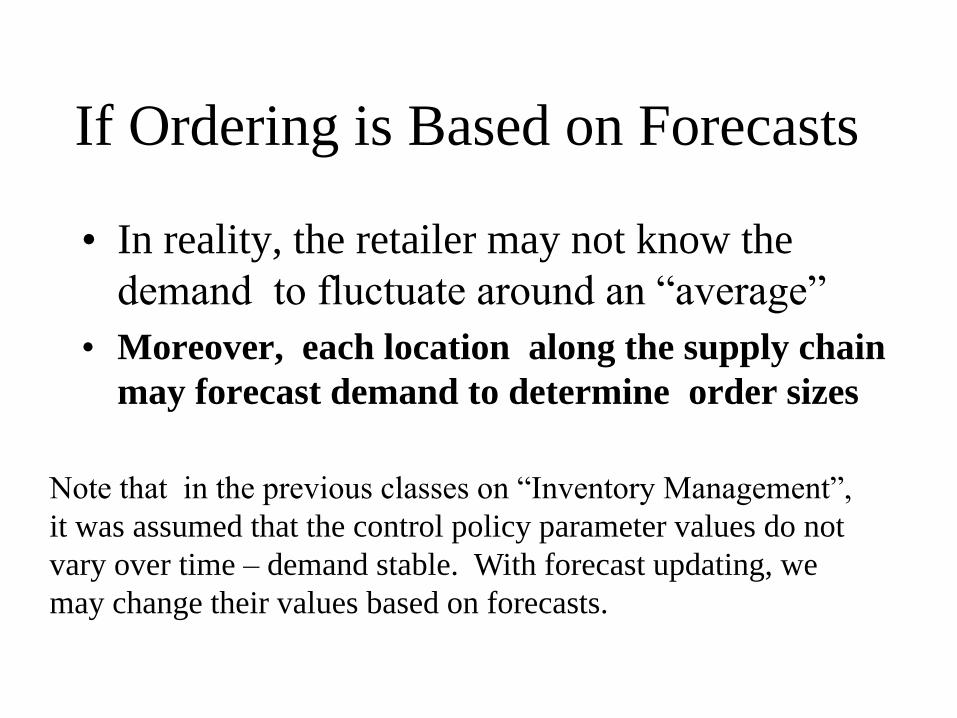
If Ordering is Based on Forecasts
• In reality, the retailer may not know the
demand to fluctuate around an “average”
• Moreover, each location along the supply chain
may forecast demand to determine order sizes
Note that in the previous classes on “Inventory Management”,
it was assumed that the control policy parameter values do not
vary over time – demand stable. With forecast updating, we
may change their values based on forecasts.
Gerard Cachon
(The Wharton School)
• I worked with Campbell Soup to evaluate their VMI
system in which they decided what to ship to their client
retailers. They were able to lower their retailers’
inventories by about 2/3rds and raise their fill rates at the
same time. What made that achievement remarkable was
that their system was quite simple, painfully simple –
forecast sales for the next few days based on a rolling
average of sales in the previous weeks, choose an order up-
to level that would achieve a given fill rate assuming a
reasonable level of demand volatility.

Forecast Updating - 121 SC:
An Example – Order-up-to Level
Period t t-1 t-2 t-3 t-4 t-5
Demand 64 40 45 35 40
Forecast 64 40 45 35 40
Order Upto 128 80 90 70 80
Order q 112 30 65 25
Assumptions: retailer uses Dt-1 to forecast future demand
Dt, as Ft = Dt-1; order-up-to-level 2 Ft.
No Safety stock?
Impact of Forecasting on BE
• The BE is due, in part, to the need to forecast
demand & hold safety stock
• Moving ave and exponential smoothing are “bad”
• The fancier the method, the worse the BE
• Smoother demand forecasts can reduce the
bullwhip effect (MA & ES methods)
• The longer the leadtime, the higher the BE
• Centralised information sig reduces the BE
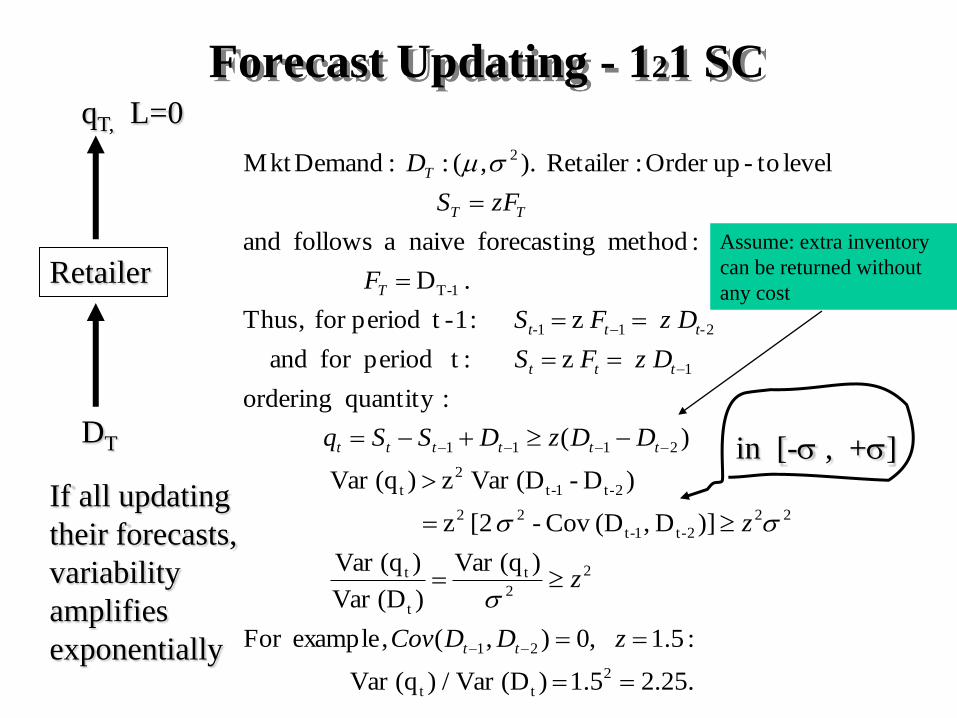
Forecast Updating - 121 SC
.25.21.5 )(DVar / )(qVar
:5.1 ,0),(,exampleFor
)(qVar
)(DVar
)(qVar
)]D ,(D Cov - [2 z
)D - (DVar z )(qVar
)(
:quantity ordering
z : tperiodfor and
z :1- tperiodfor Thus,
. D
:method gforecastin naive a follows and
level to-upOrder :Retailer ).,(: :DemandMkt
2
tt
21
2
2
t
t
t
22
2-t1-t
22
2-t1-t
2
t
2111
1
211
1-T
2
zDDCov
z
z
DDzDSSq
z DFS
z DF S
F
zFS
D
tt
tttttt
ttt
t-tt-
T
TT
T
Retailer
DT
qT, L=0
If all updating
their forecasts,
variability
amplifies
exponentially
in [- , +]
Assume: extra inventory
can be returned without
any cost
Avoiding Demand Forecast Updates
• BE resulted from the chain effect along the SC
– Repetitive multiple forecast updating
• Share demand information so that every one can
obs demand shifts without distortions:
– Demand forecasts should be based on final sales to
consumers
Avoiding Demand Forecast Updates
• Channel Alignment
– VMI - vendor managed inventory scheme
– Consumer direct
– Discount for information sharing, including
plan of promotion activities
• Operational Efficiency
– Leadtime reduction
– Echelon-based inventory control

Bullwhip can occur within a firm
Sales
We need to promote and get
rid of these green cars
Production
All green cars are sold out,
time for replenishement
Volvo Green Cars
Order Synchronization
• Synchronized ordering occurs when
retailers tend to order at the same time:
– end of the week orders
– beginning of the month orders
– end of the quarter orders
Order batching
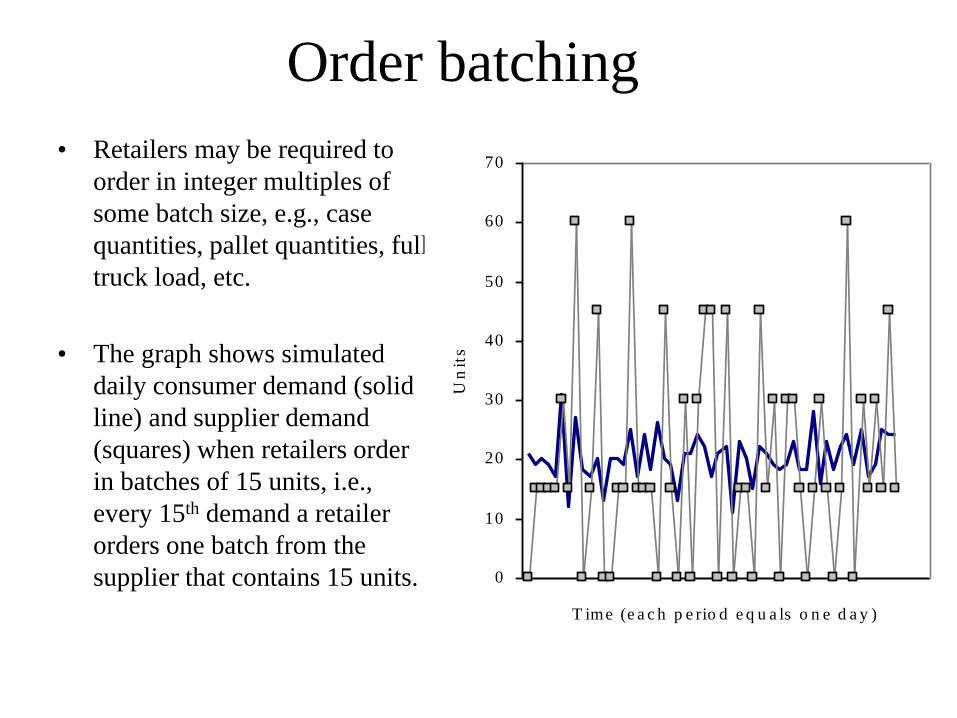
• Retailers may be required to
order in integer multiples of
some batch size, e.g., case
quantities, pallet quantities, full
truck load, etc.
• The graph shows simulated
daily consumer demand (solid
line) and supplier demand
(squares) when retailers order
in batches of 15 units, i.e.,
every 15th demand a retailer
orders one batch from the
supplier that contains 15 units. 0
10
20
30
40
50
60
70
T ime (e a c h p e rio d e q u a ls o n e d a y )
Un
its
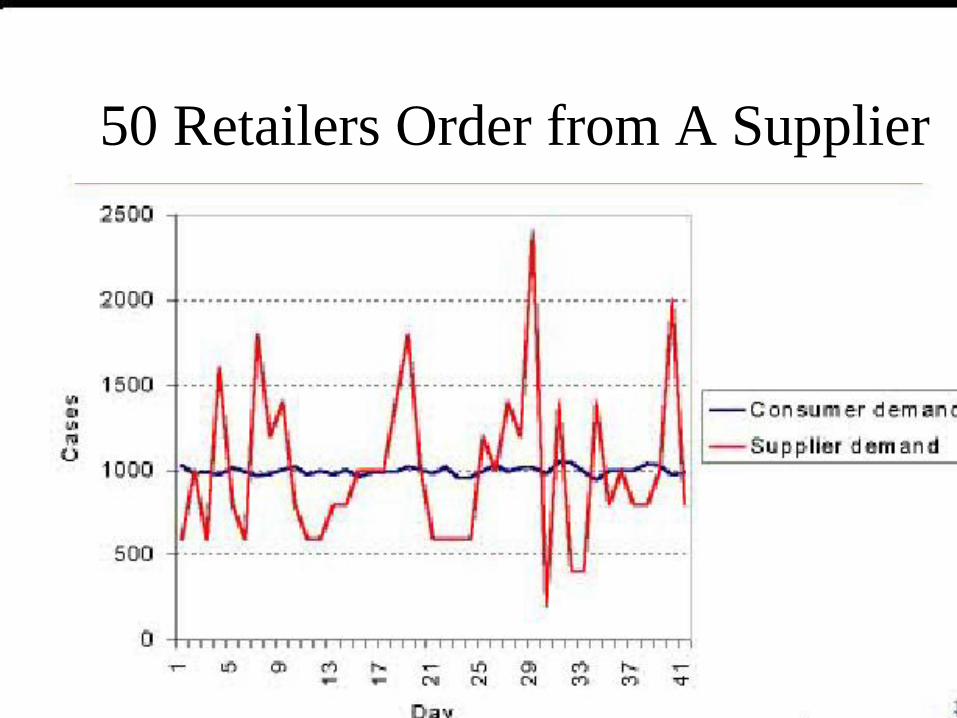
50 Retailers Order from A Supplier
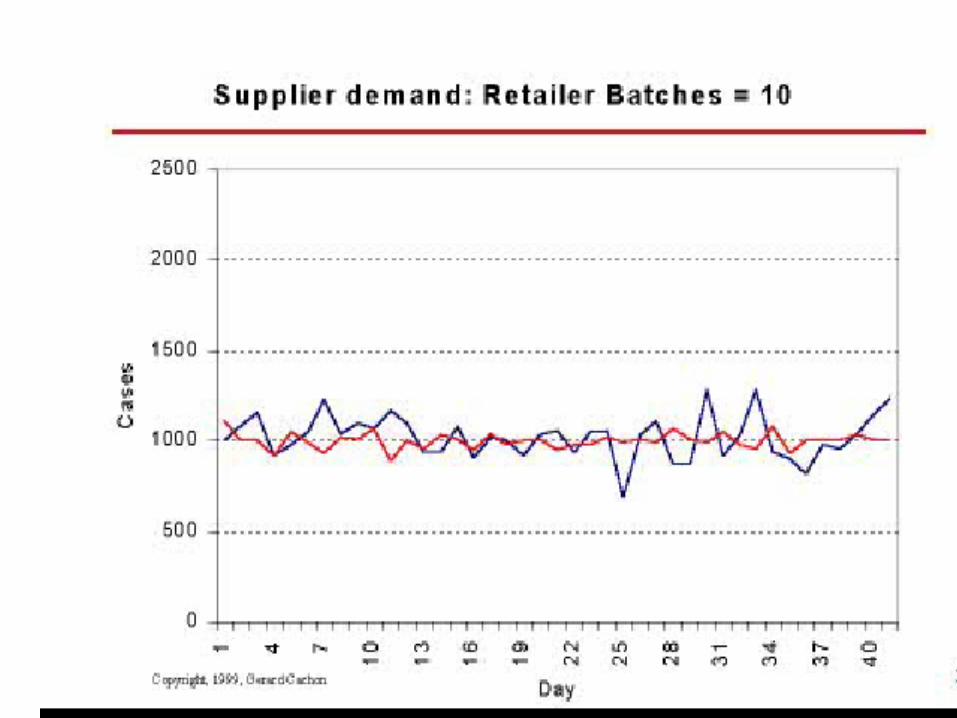

• Smaller min order quantity (lower Q), so retailers
order more frequently
• Unsynchronize retailer order intervals
– Retailers may order every T periods
– Min batch size Q=1, so no min order Q restriction
– Retailers are placed on balanced schedules s.t. average
demand per period is held constant
• e.g., 100 identical retailers and T=5 implies 20
retailers may order each period
Order batching solutions
Trade Promotion
• Why trade promotion?
• Consequences of trade promotion?
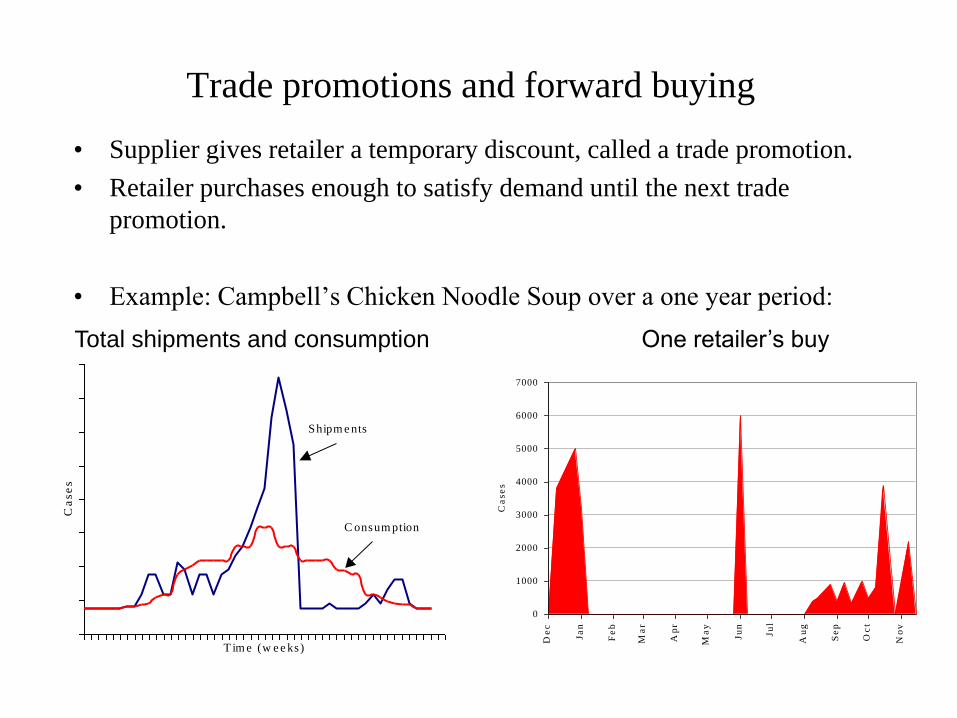
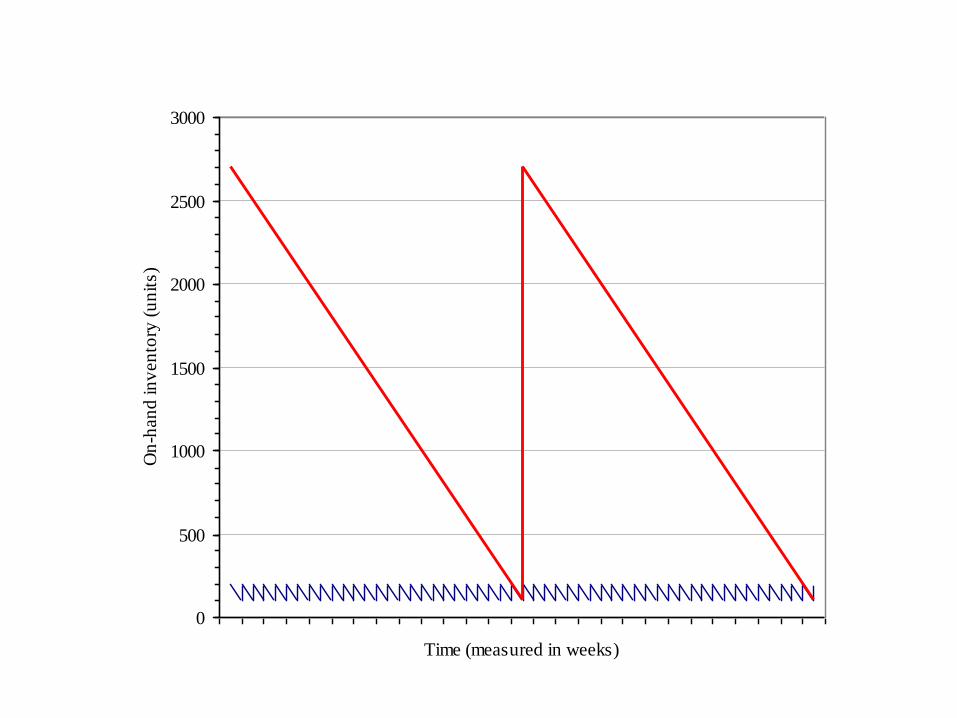
Trade promotions and forward buying
• Supplier gives retailer a temporary discount, called a trade promotion.
• Retailer purchases enough to satisfy demand until the next trade
promotion.
• Example: Campbell’s Chicken Noodle Soup over a one year period:
One retailer’s buy
T im e (w e e ks)
Ca
se
s
Shipm e nts
C onsum ption
0
1000
2000
3000
4000
5000
6000
7000
De
c
Ja
n
Fe
b
Ma
r
Ap
r
Ma
y
Ju
n
Ju
l
Au
g
Se
p
Oc
t
No
v
Ca
se
s
Total shipments and consumption
0
500
1000
1500
2000
2500
3000
Time (measured in weeks)
On
-han
d in
ven
tory
(u
nit
s)
• Retailers submit orders for delivery in a
future period
• Supplier might not be able to fill all orders
– He might not get enough components
– His production yield might not be as high as
expected
• Phantom orders
– Reatilers order more than they think they need
to make sure they get a good allocation if
demand is high or if capacity is tight
Shortage game

• Supplier allows retailers to cancel order or accepts
returns
• High retailer profit margin, i.e., costly to not have
goods
• Retailer demand expectations positively
correlated(i.e., if one retailer has high demand
expectation, the other retailers probably do too.)
• Retailer competition (if retailer A takes more
inventory, retailer B has less to sell)
• Capacity is expensive, so the supplier will not
build unlimited cap
When is shortage game likely?
Classic Bullwhip Effect:
Semiconductor Industry, 1995/2000
• Perception: Demand for semiconductors
would have a tremendous increase
• Result: Customers, worried about a supply
shortage, tripled their orders
• Reality: Semiconductor companies
scrambled to meet demand, realized
information was inflated and suffered huge
losses
• Don’t let retailers cancel orders
• Don’t offer retailers generous return
policies
• Share cap. And inventory data prevent false
scares
• Prioritize retailers (customers, e.g., by past
sales)
How to stop phantom ordering

• Three major causes for Poor SC Performance
– Demand uncertainty
– Product variety
– Information distortion along the SC -- bullwhip
• Several (root) causes for B.E.
– Ordering decision based on demand forecast
updating
– Order synchronization and batch ordering
– Promotion deals
– Shortage gaming
Summary


![El Bullwhip Effect[1]- Yerlani](https://static.documents.pub/doc/80x56/577d29c31a28ab4e1ea7c468/el-bullwhip-effect1-yerlani.jpg)


