Page 1
1
DETAILED PROJECT REPORT OF IWMP
(2010 – 2015)
Micro Watershed & Micro Watershed Code No
: Salaguri MWS
Saidal Turung MWS
Dangdhra Mahimabari MWS
Phulbari Tengajan MWS
IWMP project : JORHAT – 2 (TIPOMIAJAN) IWMP , 2010-11
Block : Titabor Dev. Block
District : Jorhat
Name of the PIA : Divisional Soil Conservation Office, Jorhat
Division, Jorhat, Assam
Page 2
i
Contents
ACKNOWLEDGEMENT-
CHAPTER 1
Introduction and Background
CHAPTER 2
General Description of Project Area
CHAPTER – 3
Base Line Information of Watershed
CHAPTER – 4
Institutional Building and Project Management
CHAPTER – 5
Management/Action Plan
CHAPTER 6
Capacity Building Plan
CHAPTER 7
Phasing of Programme and Budgeting
CHAPTER 8
Consolidation and Completion of Various Works
CHAPTER – 9
Expected Outcomes
Page 3
ii
ACKNOWLEDGEMENT
We, M/S Super Engineering Works, Jorhat, Assam express our sincere
gratitude towards State Level Nodal Agency, IWMP, Assam for entrusting with the
responsibility of preparing the Detail Project Report for Tipomiya Watershed Project
under Integrated Watershed Management Programme (IWMP).
We also express our gratitude to Dr. Prem Charan, Chairman, SLNA, IWMP,
Assam for providing his valuable suggestions, guidance for preparing the DPR.
We are also indebted to the CEO, SLNA, IWMP, Assam, Mr. F. Haque
Choudhry, Deputy Secretary, Soil Conservation Department, Govt. of Assam and
other officials of SLNA, IWMP, Assam for their help and support in every stage of
preparing the DPR.
We are expressing our sincere gratitude to the Deputy Commissioner, Jorhat
District and Mr. Dimbeswar Gogoi, Divisional Officer, Soil Conservation Division,
Jorhat, Assam for their help, suggestions and constant inspiration and supervision
for preparing the DPR.
We sincerely acknowledge the help and cooperation extended by all the Goan
Burahs and other community members during the conduction of PRA Exercises and
household survey.
(Er. S. Nazrul Hussain),
Team Leader,
M/S Super Engineering Works,
Jorhat, Assam.
Page 4
1
CHAPTER 1
INTRODUCTION AND BACKGROUND
INTRODUCTION:
Name of the State : Assam Name of the District : Jorhat Names of the Blocks : Titabor Dev. Block
Name of the project : Jorhat- 3 (Upper Tuni Watershed)
Financial Year of sanction : 2010-11 Project duration : From2010 to 2015
II). PROFILE OF THE WATERSHED PROJECT:
Table No.1.1 Project at a Glance
1 Name of the State Assam
2 Name of the project JORHAT – 2 (TIPOMIAJAN) IWMP , 2010-11
3 Name of the District Jorhat
4 Names of the Blocks Titabor Dev. Block
5 Names of Gram Panchayats 85 No. Tengajan, 81 No Turung, 87 No. Madhapur
6 Names & Census Code of Villages
covered
Name of Village Census Code
Christian Gaon 01926200
No.2 Madhapur 01926300
Kachari Gaon 01926400
Charaipani Bangali 01926000
Dangdhara 01926100
Mahimabari 01925900
Salaguri 01926600
Lohong Bebejia 01926500
No.1 Madhapur 01927200
Saidal Kachari 01926700
Tipomia 01926800
Turung gaon 01927000
Tipomea Habi 01927100
Bhagyalakhi 01925100
Medeluajan 01925200
Phulbari 01925400
Tangajan 01925500
Charaipani Bosabari
Grant No. 188
Charaipani Grant No.1
7 Four major reasons for selection of
watershed
1. Proper utilization of Natural Resources for
sustenance. 2. Flood is a major concern for the watershed.
Page 5
2
Floods cause instant devastation of the life and
properties. On the other hand infested thousands of hectares of lands with sands
thereby converting cultivable land into waste
lands. 3. Run-off originating from seasonal rain attain
high velocity due to medium to steep gradient which prevail in the watershed and thereby
causes all types of soil erosion hazards. 4. Lack of sufficient vegetal cover in the project
area is a permanent factor effecting the
infiltration and percolation of surface flow leading to severe moisture stress in the soil
which affects the economy of the people in the long run.
8 Name, Address, Phone No and
Reg.No.. of the PIA(s)
Divisional Officer, Jorhat Soil Conservation Division,
Jorhat, Assam
9 Date of approval of Watershed
Development Plan by the DPC
-
10 Area of the Project (ha.) 4778 Ha
11 Area proposed to be treated (ha.) 3850 Ha
12 Financial Year of sanction 2010-11
13 Project duration From 2010 to 2015
14 Project Cost (Rs. in Lakhs) 462.00
15 Date of Sanction by State authority …
16 Date of Release of 1st Installment of
Central Assistance (To be filled by DoLR)
…
17 Any other, please specify ---
Page 6
3
Project Background:
Integrated Watershed Management Programme (IWMP) is a modified
programme of previous Drought Prone Areas Programme (DPAP), Desert
Development Programme (DDP) and Integrated Wastelands Development
Programme (IWDP) of the Department of Land Resources, Government of India. The
scheme was launched during 2009-10. The main objectives of the IWMP are to
restore the ecological balance by harnessing, conserving and developing degraded
natural resources such as soil, vegetative cover and water. The outcomes are
prevention of soil erosion, regeneration of natural vegetation, rain water harvesting
and recharging of the ground water table. This enables multi-cropping and the
introduction of diverse agro-based activities, which help to provide sustainable
livelihoods to the people residing in the watershed area.
Every land area, regardless of its location, is part of a watershed. Some are
hilly and others are relatively flat. Every watershed has a physical landscape a
complex terrain of landforms, water resources, vegetation, animals and their
habitats, human beings and the structures they have built. At the watershed scale,
conflicts over water and land resources are inherently multi-attribute, multi-
stakeholder, and multi-discipline decision problems. Watershed systems from those
with many small tributaries to large-scale lake systems and river basins provide
direct inputs to economic processes, serve as waste sinks for economic output, and
provide ecosystem services that make life possible.
In recent years, the concepts of integrated watershed management have
gained increasing attention as strategies for sustainable resource use within a
complex multi-institutional regulatory context. Watershed is a basic hydrologic unit,
and hydrologic and ecologic processes govern the quality of soil and water resources
within the watershed. Soil degradative processes are accentuated by anthropogenic
factors. It is appropriate; therefore, that issues related to sustainable management
of natural resources (e.g., food security and environment quality) are addressed
within the context of watershed management.
Page 7
4
Integrated Watershed management implies rational utilization of natural
resources for optimal and sustained production with minimum hazard to
environment. It requires collection and analysis of information from multiple services
to ensure sustainable economic and social progress of a watershed.
Problems :
The Tipomiya Watershed is located in southernmost part of the district Jorhat
and near the foothill of Nagaland. The geographically the project area is located
between 94°7'23.71" to 94°15'9.93"E longitude and 26°29'13.20"N to 26°
33'10.47"N latitude. The watershed area covered 20 numbers of revenue villages
under Titabor Development Block. The total project area of the watershed is about
5077 Ha.
The Tipomiya Watershed is characterized by undulating topography with
numerous streams and wetlands. The major problems of the watershed are – Firstly
degradation and congestion of natural water bodies like wetlands and other natural
drainage secondly, flood is a major concern for the watershed which cause instant
devastation of the life and properties, thirdly, run-off originating from seasonal rain
attain high velocity due to medium to steep gradient which prevail in the watershed
and thereby causes all types of soil erosion hazards. Fourthly, lack of sufficient
vegetal cover in the project area is a permanent factor effecting the infiltration and
percolation of surface flow leading to severe moisture stress in the soil which affects
the economy of the people in the long run. Besides above, the uneven rainfall, river
bank erosion, lack of irrigation facilities, damage caused by pest and diseases in
agricultural production etc are also important problems in the project area.
Need and Scope for Watershed Development
Degradation of soil and water resources is considered not only as an utmost
constraint to sustainable agricultural development but also a threat to the society.
Poor ecosystem management has and will result in the impaired functioning of
watershed and will continue to do so in the future and the need to protect and
preserve the quality of the ecosystem is very essential.
Page 8
5
Due to rapid growth of population there is an excessive demand for more land both
for agriculture and non-agriculture use. This has created a vast stretches of
wastelands and some are on the verge of becoming wastelands. There is need to
reverse the trend by treating wastelands. Land which is degraded by natural forces
needs improvement by appropriate interventions.
Watershed management is the implementation of management systems that
ensure the preservation, conservation and sustainable use of all land and water
resources. Watershed management also integrates various aspects of forestry,
agriculture, hydrology, ecology, soils etc. for choosing acceptable management
alternative within the specific social and economic context. As mention above, the
major problems of the Tipomiya Watershed are degradation of Natural Resources,
soil erosion, siltation etc. and therefore there is a huge scope for taking up
watershed development activities in the watershed area.
Table No. 1.2 Need and Scope for Watershed Development
Project Name
Project
Type
Weightage
i ii iii iv v vi vii ix x xi xii xiii
Jorhat-2 (Tipomiya) IWMP Plain 5 5 5 5 3 0 5 7.5 10 15 10 5
*As per PPR
Slno. Criteria Max Score
Ranges and Scores
i Poverty index(%of poor to population)
10 Above 80% (10) 80 to 50 % (7.5) 50 to 20 % (5) Below 20% (2.5)
ii % of SC/ST population
10 More than 40% (10)
20 to 40 % (5) Less than 20% (3)
iii Actual wages 5 Actual wages are significantly lower than minimum wages (5)
Actual wages are equal to or higher than minimum wages (0)
iv % of small and marginal farmers
10 More than 80% (10)
50 to 80% (5) Less than 50 (3)
v Ground water status 15 Over exploited (15)
Critical (10) Sub critical (5) Safe (0)
vi Moisture index/ DPAP/DDP Block
10 -66.7 & below (10) DDP Block
-33.3 to -66.6 (5) DPAP Block
0 to -33.2 (0) Non DPAP/DDP
Page 9
6
Block
vii Area under assured irrigation
15 Less than 10% (15)
10 to 20% (10) 20 to 30% (5) Above 30% (Reject)
viii Drinking water 10 No source (10) Problematic village (7.5)
Partially covered (5)
Fully covered (0)
ix Degraded land 15 High – above 20% (15)
Medium – 10 to 20 % (10)
Low – less than 10 % of TGA (5)
x Productivity potential of the land
10 Lands with low production & where productivity can be significantly enhanced with reasonable efforts (10)
Land with moderate production & where productivity can be enhanced with reasonable efforts (5)
Lands with high production & where productivity can be marginally enhanced with reasonable efforts (0)
xi Contiguity to another watershed that has already been developed/treated
10 Contiguous to previously treated watershed & contiguity within the micro watersheds in the project (10)
Contiguity with in the micro watersheds in the project but non contiguous to previously treated watershed (5)
Neither contiguous to previously treated watershed nor contiguity within the micro watersheds in the project (0)
xii Cluster approach in the plains (more than one contiguous micro-watersheds in the project)
15 Above 6 micro-watersheds in cluster (15)
4 to 6 micro watersheds in cluster (10)
2 to 4 micro watersheds in cluster (5)
xiii Cluster approach in the hills (More than one contiguous micro- watersheds in the project)
15 Above 5 micro-watersheds in cluster (15)
3 to 5 micro watersheds in cluster (10)
2 to 3 micro watersheds in cluster (5)
Total 150 150 90 41 2.5
Page 10
7
Table no.1.3: Watershed information Sl no
Name of Project
Watershed Code Villages to be Treated Geographical Area(Ha)
Treatable Area(Ha)
Approval Year
1
Jorhat-2
(Tipomiyai)
Salaguri MWS, 3B3C3eII
Salaguri Gaon 514.95
3850 2010-11
2 Lohong Bebejia 343.64
3 Madhapur Grant No.1 181.9
4 Saidal – Turung
MWS, 3B3C3eIII
Saidal Kachari Gaon 562.51
5 Tipomia Gaon 367.68
6 Turung Gaon 262.3
7 Dangdhara –
Mahimabari MWS, 3B3C3eI
Christian Gaon 196
8 Madhapur No.2 95.73
9 Kachari Gaon 35.01
10 Charaipani Bongali Gaon 277.98
11 Dangdhara Grant 182.85
12 Mohima Bari Gaon 216.71
13 Phulbari -Tengajan MWS, 3B3C3eIV
Medeluajan Gaon 34.59
14 Tongajan Gaon 236.55
15 Phulbari Gaon 105.24
16 Tipomia Habi Gaon 315.21
17 Bhagyalakni 298.72
18 Charaipani Bosabari T.E. 278.18
19 Grant No.188 168.45
20 Charaipani Grant No.1 186.81
Page 11
8
CHAPTER 2
General Description of Project Area
Table 2.1: Location
Longitude 94°7'23.711" to 94°15'9.93"E
Latitude 26°33'10.47"N to 26° 29'13.20"N
State Assam
District Jorhat
Subdivision Titabor
Block Titabor Dev. Block
Panchayat 85 No. Tengajan, 81 No Turung, 87 No. Madhapur
Villages Salaguri Gaon
Lohong Bebejia
Madhapur Grant No.1
Saidal Kachari Gaon
Tipomia Gaon
Turung Gaon
Christian Gaon
Madhapur No.2
Kachari Gaon
Charaipani Bongali Gaon
Dangdhara Grant
Mohima Bari Gaon
Medeluajan Gaon
Tongajan Gaon
Phulbari Gaon
Tipomia Habi Gaon
Bhagyalakni
Charaipani Bosabari T.E.
Grant No.188
Charaipani Grant No.1
Page 13
10
Micro Watershed Map
Page 14
11
Location of Watershed :
The Tipomiya Watershed is located in southernmost part of the district Jorhat
and near the foothill of Naga-Patkai range. The geographically the project area is
located between 94°7'23.71" to 94°15'9.93"E longitude and 26°29'13.20"N to 26°
33'10.47"N latitude. The area is bounded by the foothills of Naga-Patkai Range in
the South-east, Saraipani Jan in the North, River Kakodunga in the west.The
watershed area covered 20 numbers of revenue villages under Titabor Development
Block. The total project area of the watershed is about 4778 Ha.
Physiography:
The physiography of the project area is characterized by undulating hill area
running along the Naga-Patkai range covering the piedmont plain with a dynamic
flow system; the ecology is unique and there is a constant threat of flood and
erosion.
Climate:
The climate of project area is typically ‘tropical monsoon rainfall’ type,
with high levels of humidity and heavy rainfall. People here enjoy a moderate
climate all throughout the year, with warm summers and mild winters. The sub-
tropical climate of the area is characterised by high rainfall and high humidity and is
worked by three dominant seasons, viz. winter (November to February), summer
(March to May) and monsoon (June to October). Most of the rainfall in the state is
received under the influence of the south-west monsoon between June and October.
Rainfall Data of Jorhat District for Last 7 Years (2004-2010)
Year
Jan
uar
y
Feb
ruar
y
mar
ch
Ap
ril
may
Jun
e
July
augu
st
Sep
tem
ber
Oct
ob
er
No
vem
ber
Dec
emb
er
2004 36.4 37.6 133.5 305.4 307.2 187.2 326.1 204.5 337.7 229.2 5.4 1.8
2005 36.4 24.3 227.9 154.2 219.6 192.1 263.4 281.4 140.9 60.9 14.9 0
2006 5.6 105.7 38.8 140.5 155.4 245.4 332 226.2 157.4 73.3 20.1 11.4
2007 0.1 76.3 29.4 212.8 189 274.6 300.8 318 355.1 28.5 25.3 17.6
2008 27.7 8.3 89.9 181.8 203.3 329.9 357.1 330.5 125 122.5 0 2.1
2009 6.6 21.7 26 154 187.8 225 293.4 286.8 101.5 57.8 18.7 0.7
2010 0 0 108 325 272.4 328 413.8 290.3 187.1 113.9 27.6 8.8 Source: India Meteorological Department, HYDROMET DIVISION.
Page 15
12
Variation in Rainfall :
YEAR
2010200920082007200620052004
Va
lue
300
200
100
0
JANUARY
FEBRUARY
MARCH
YEAR
2010200920082007200620052004
Va
lue
400
300
200
100
APRIL
MAY
JUNE
YEAR
2010200920082007200620052004
Va
lue
500
400
300
200
100
0
JULY
AUGUST
SEPTEMBE
YEAR
2010200920082007200620052004
Va
lue
300
200
100
0
OCTOBER
NOVEMBER
DECEMBER
Annual Rainfall for Last Seven Years
Year Annual Rainfall
2004 2112
2005 1616
2006 1512
2007 1828
2008 1778
2009 1380
2010 2075
Average Annual Rainfall for Last 7 Years 1757
Source: India Meteorological Department, HYDROMET DIVISION.
Page 16
13
Graph : Variation in Annual Rainfall of Jorhat District, Assam for last 7 Years
Temparature :
Maximum Temparature: (in Degree Celicious)
Years JAN FEB MAR APR MAY JUN JUL AUG SEP OCT NOV DEC
1951 22.7 25.0 27.9 27.0 30.0 30.7 31.5 32.3 31.9 28.9 25.5 23.5
1971 22.1 23.3 29.3 28.9 30.1 31.9 32.0 31.4 31.8 29.0 25.4 23.4
1991 22.1 24.4 28.0 27.7 27.9 31.3 32.5 32.3 30.8 29.2 26.3 21.8
2009 24.1 26.7 29.0 28.9 30.9 33.0 33.0 31.8 33.1 30.8 27.0 23.3
Source: Tea Research Association, Tocklai
Page 17
14
Fig: Variation in Maximum Temparature since 1951
Minimum Temparature: (in Degree Celicious)
Year JAN FEB MAR APR MAY JUN JUL AUG SEP OCT NOV DEC
1951 9.0 11.6 15.7 17.5 21.4 23.7 24.3 24.7 23.6 21.1 15.3 10.6
1971 10.3 11.6 15.5 19.8 22.8 24.9 24.9 24.5 24.5 21.9 14.9 10.3
1991 9.7 13.4 17.4 19.6 22.0 25.2 25.9 25.9 24.5 20.6 15.1 8.6
2009 11.7 13.1 16.1 20.6 23.0 25.4 26.0 25.6 25.7 22.6 16.5 12.4 Source: Tea Research Association, Tocklai
Fig: Variation in Minimum Temparature since 1951
Page 18
15
Relative Humidity (in %)
Year Time/Hour JAN FEB MAR APR MAY JUN JUL AUG SEP OCT NOV DEC
1951
Morning (recorded at 06.13 hrs.)
98 96 94 93 95 92 94 96 97 97 98 98
Afternoon (recorded at 13.13 hrs.)
57 49 48 61 67 76 73 74 70 71 68 59
Sunshine Hrs. 6.9 7.3 6.5 5.5 4.9 4.0 6.2 6.6 7.8 5.5 6.4 6.2
1971
Morning (recorded at 06.13 hrs.)
94 92 89 90 90 91 91 93 93 95 95 94
Afternoon (recorded at 13.13 hrs.)
55 53 43 59 66 72 72 73 70 73 59 55
Sunshine Hrs. 5.6 6.5 7.7 5.9 6.0 5.0 4.8 5.3 5.8 5.3 6.3 6.9
1991
Morning (recorded at 06.13 hrs.)
96 96 92 92 93 92 92 93 95 96 97 98
Afternoon (recorded at 13.13 hrs.)
58 60 51 64 76 76 72 69 77 72 61 65
Sunshine Hrs. 6.8 6.0 7.0 6.1 3.4 3.2 5.4 4.7 3.9 5.5 6.9 5.3
2009
Morning (recorded at 06.13 hrs.)
96 94 95 93 91 92 93 95 93 95 97 97
Afternoon (recorded at 13.13 hrs.)
57 49 44 65 69 70 70 74 68 65 61 64
Sunshine Hrs. 4.9 6.1 5.1 5.2 6.4 5.2 5.2 4.3 6.6 5.9 5.9 4.6
Source: Tea Research Association, Tocklai
Fig: Variation in Relative Humidity since 1951
Page 19
16
Evaporation (in mm) Year JAN FEB MAR APR MAY JUN JUL AUG SEP OCT NOV DEC
1954 43.4 64.4 105.4 102.0 133.3 141.0 99.2 93.0 99.0 68.2 57.2 46.5
1971 36.8 51.2 91.1 91.1 102.3 100.8 112.3 97.4 97.4 69.8 37.5 34.7
1991 36.4 44.8 83.6 75.7 72.6 83.6 105.7 90.2 65.1 62 46.6 32.6
2009 32.8 50.9 73.8 72.1 96.2 93.4 94.6 81.8 94.7 68.4 46.0 31.7
Source: Tea Research Association, Tocklai
Fig: Variation in Evaporation since 1954
Drainage & Water bodies:
The watershed area is endowed with many perennial streams namely Tipomiya,
Medeluajan, Saraipanijan and Letekajan etc. The Tipomiya Jan originates in the Hills
of Naga-Patkai Range and flows through Phulanibari, Kakatigaon, Tipomiya Habi
gaon,Tipomiya Gaon, and confluence with Cherelijan near Naopeta and then with
Saraipanijan and finally confluence with River Kakodonga. Other Streams are also
originated in the hills of Naga-Patkai Range and flows through the watershed are
and finally confluence with River Kaodona.
Page 21
18
Soil:
The general and average soil character of cultivable land in the watershed is mainly alluvial and composed of mixture of sand
(course to loamy). From soil resource mapping and taxonomic classification carried by the Natural Bureau of Soil Survey and Land
Use Planning (NBSSLUP) it is observed that there are basically eight types of taxonomic classification of are found with the
watershed namely - Fine Loamy Typic Dystrochrepts (36), Fine Loamy Typic Paleudalfs (38), Fine Loamy Typic Dystrochrepts
associated with clayey, typic hapludults (40), Coarse Loamy Typic Dystrochrepts Fine Silty (42), Fine loamy, Aeric Haplaquepts
(43), Fine Loamy Typic Dystrochrepts associated with fine, typic haplaquepts(44), Fine Loamy Typic Dystrochrepts associated with
fine silty, typic haplaquepts (46), Fine loamy, Aeric Haplaquepts associated with course loamy Typic Dystrochrepts (47).
Characteristics of Dominant Soil:
Pa
rtic
ula
rs
Fin
e L
oam
y
Typic
Dyst
roch
repts
(36)
Fin
e L
oam
y
Typic
Pale
udalfs
(38),
Fin
e L
oam
y
Typic
Dyst
roch
repts
ass
oci
ate
d w
ith
clayey, ty
pic
haplu
dults
(40)
Coars
e L
oam
y
Typic
Dyst
roch
repts
Fin
e S
ilty (
42),
Fin
e loam
y,
Aeric
Hapla
quepts
(43)
Fin
e L
oam
y
Typic
Dyst
roch
repts
ass
oci
ate
d w
ith
fine, ty
pic
hapla
quepts
(44
),
Fin
e L
oam
y
Typic
Dyst
roch
repts
ass
oci
ate
d w
ith
fine s
ilty,
typic
hapla
quepts
(46),
Fin
e loam
y,
Aeric
Hapla
quepts
ass
oci
ate
d w
ith
cours
e loam
y
Typic
Dyst
roch
repts
(47)
Morphology Steep Gently slopping Undulating Undulating Valleys Valleys Valleys Valleys
Surface Texture Steep Gently slopping Undulating Undulating Valleys Valleys Valleys Valleys
Parent Material Sand stone Sand stone Allovium Allovium Alluvium Alluvium Alluvium Alluvium
Soil Depth Deep (>100) Deep (>100) Deep (>100) Deep (>100) Deep (>100) Deep (>100) Deep (>100) Deep (>100)
Particle Size Class Fine loamy Fine loamy Fine loamy Coarse loamy Fine loamy Fine loamy Fine loamy Fine loamy
Mineralogy Mixed Mixed Mixed Mixed Mixed Mixed Mixed Mixed
Soil temperature regime
Highper thermic 220-280 C
Highper thermic 220-280 C
Highper thermic 220-280 C
Highper thermic 220-280 C
Highper thermic 220-280 C
Highper thermic 220-
280 C
Highper thermic 220-280 C
Highper thermic 220-280 C
Reaction (pH) Moderatly acidic 4.5
– 5.5 Moderatly acidic
4.5 – 5.5 Moderatly acidic
4.5 – 5.5 Moderatly acidic
4.5 – 5.5 Neutral 6.5-7.5
Moderatly acidic 4.5 – 5.5
Moderatly acidic 4.5 – 5.5
Slietly acedic 5.5-6.5
Drainage Class Well Excessive Well Well Very poor Well Well Poor
Ground Water Depth
Deep (>5) Deep (>5) Deep (>5) Deep (>5) Moderately
shallow (1-2mtr) Deep (>5)
Moderately deep (2-5 mtr)
Moderately shallow (1-2mtr)
Slope Moderately steep
slopping (15-30%) Gently slopping
3-8% Gently slopping 3-
8% Moderately steep slopping (8-15%)
Level to nearly level 0-1%
Gently slopping 3-8%
Level to nearly level 0-1%
Very gently slopping (1-3%)
Page 24
21
Ground Water:
The depth of ground water level in water table zone varies from 0.41 to 3.07 m bgl
in the pre monsoon period and 0.56 to 3.41 m bgl during post monsoon period. As
per Ground Water Information Booklet, Central Ground Water Board, 2008 –the area
is very much suitable for construction of ground water abstraction structures for
discharge ranging from 100-300 M3/hr. Ground water occurs under water table
conditions. In the southern parts of the watershed, the aquifer system fades out due
to mixing of finer particles of sand and clay leading to decrease in thickness of
aquifer system. The southern part of the area, adjacent to the Naga hill range is
covered by surficial blanket of clay, belonging to Younger alluvium and probably has
been derived from the adjacent hills which are composed of the rocks of Tertiary
age.
Economy:
The economy of the project area depends on agriculture. Paddy is the major crop
and it cultivated in kharif and land remains uncultivated for rest of the year. The
farming system is traditional. Low agricultural productivity, lack of irrigation facilities,
damage cause by pest and diseases are the major constraints for the agricultural
development of the region. Further fishing, livestock rearing handloom and weaving
are other important economic activities of the watershed area.
Land Use/ Land Cover:
The following landuse categories are identified through visual interpretation of
remote Sensing Map and supported by field verification. The identified main landuse
categories are –Agricultural land (kharif) constitute about 2928 ha about 57.66% of
total geographicl area of the watershed, Agricultural Land (Double Crop) constitute
about 310 Ha (6.11%), Agricultural Plantation i.e. Tea Garden 734 Ha (14.46%),
Forest (Evergreen/Semi-evergreen) – 46 Ha (0.91%), Wetland – 20 Ha and rural
habitation including homestead plantation constitute about 1039 ha area.
Page 26
23
Table no: 2.2 Land Details Sl
No
Nam
e of
Vill
age
Geogra
phic
al
Are
a(H
a)
Fore
st A
rea (
ha)
Land u
nder
agricu
ltura
l use
(ha)
Rain
-fed a
rea (
ha)
Irrigate
d A
rea
Perm
anent
past
ure
s
(ha)
Wasteland
Cul
tivab
le
Non
Cul
tivab
le
1 Salaguri Gaon 514.95 0 350.30 311.04 39.26 2.36 0
2 Lohong Bebejia 343.64 0 256.11 256.11 0 0 0
3 Madhapur Grant No.1 181.9 0 74.05 74.05 0 0 0
4 Saidal Kachari Gaon 562.51 0 483.39 215.68 267.71 18.1 0
5 Tipomia Gaon 367.68 0 232.47 229.06 3.41 0 0
6 Turung Gaon 262.3 0 220.68 220.68 0 0 0
7 Christian Gaon 196 0 152.13 152.13 0 0 0
8 Madhapur No.2 95.73 0 40.01 40.01 0 0 0
9 Kachari Gaon 35.01 0 23.89 23.89 0 0 0
10 Charaipani Bongali Gaon 277.98 0 205.07 205.07 0 0 0
11 Dangdhara Grant 182.85 0 124.32 124.32 0 0 0
12 Mohima Bari Gaon 216.71 0 72.12 72.12 0 0 0
13 Medeluajan Gaon 34.59 0.31 32.63 32.63 0 0 0
14 Tongajan Gaon 236.55 6.39 173.71 173.71 0 0 0
15 Phulbari Gaon 105.24 2.1 83.76 83.76 0 0 0
16 Tipomia Habi Gaon 315.21 0 232.47 229.06 3.41 0 0
17 Bhagyalakni 298.72 37.25 209.86 209.86 0 0 0
18 Charaipani Bosabari T.E. 278.18 0 84.98 84.98 0 0 0
19 Grant No.188 168.45 0 19.68 19.68 0 0 0
20 Charaipani Grant No.1 186.81 0 128.36 128.36 0 0 0
TOTAL 4778 46 3342 3029 314 0 20 0
Page 27
24
Table No. 2.3: Details of the types of areas covered under the project 1 2 3
S.
No.
Names of villages No. of beneficiaries covered
Large
Farmer
Small
Farmer
Marginal
farmer Landless Total
1 Salaguri Gaon 46 72 177 185 479
2 Lohong Bebejia 27 42 104 108 281
3 Madhapur Grant No.1 6 10 24 25 65
4 Saidal Kachari Gaon 13 20 49 51 133
5 Tipomia Gaon 18 29 71 74 193
6 Turung Gaon 17 27 67 70 181
7 Christian Gaon 11 18 44 45 118
8 Madhapur No.2 11 18 44 45 118
9 Kachari Gaon 7 11 27 28 73
10 Charaipani Bongali Gaon 28 45 110 115 298
11 Dangdhara Grant 19 29 72 76 196
12 Mohima Bari Gaon 26 41 101 105 272
13 Medeluajan Gaon 14 22 55 58 150
14 Tongajan Gaon 21 34 83 87 225
15 Phulbari Gaon 13 21 51 53 137
16 Tipomia Habi Gaon 30 47 115 120 312
17 Bhagyalakni 2 4 10 10 26
18 Charaipani Bosabari T.E. 26 41 102 107 277
19 Grant No.188 28 43 107 112 290
20 Charaipani Grant No.1 8 13 32 33 86
TOTAL 371 587 1445 1507 3910
Page 28
25
Table No. 2.4: Details of Agro-climatic condition N
am
e o
f th
e A
gro
-
clim
atic
zone
Name of
Village
Major soil types
b)Area(h
a)
Average
rainfall in mm
(precedi
ng 5 years’
average)
Major crops
a)Type
a)Na
me
b)Area
(ha)
Centr
al Bra
hm
aputr
a V
alle
y
Salaguri Gaon Coarse loamy, Lithic Dystrochrepts 125.73
1715
Paddy 350.3
Coarse loamy, Aeric Udifluvents 389.07
Lohong
Bebejia Coarse loamy, Lithic Dystrochrepts 343.64 Paddy 256.11
Madhapur Grant No.1 Coarse loamy, Lithic Dystrochrepts 181.90 Paddy 74.05
Saidal Kachari
Gaon
Coarse loamy, Aeric Udifluvents 390.64 Paddy 483.39
Fine silty, Typic Haplaquepts 170.30
Tipomia Gaon Coarse loamy, Lithic Dystrochrepts 40.60 Paddy 232.47
Coarse loamy, Aeric Udifluvents 327.08
Turung Gaon Coarse loamy, Lithic Dystrochrepts 263.30 Paddy 220.68
Christian Gaon Coarse loamy, Lithic Dystrochrepts 158.43 Paddy 152.13
Coarse loamy, Aeric Udifluvents 36.76
Madhapur
No.2 Coarse loamy, Lithic Dystrochrepts 95.73 Paddy 40.01
Kachari Gaon Coarse loamy, Lithic Dystrochrepts 35.01 Paddy 23.89
Charaipani Bongali Gaon Coarse loamy, Lithic Dystrochrepts 277.11 Paddy 205.07
Dangdhara
Grant Coarse loamy, Lithic Dystrochrepts 181.91 Paddy 124.32
Mohima Bari
Gaon Coarse loamy, Lithic Dystrochrepts 215.24 Paddy 72.12
Medeluajan
Gaon
Fine loamy, Typic Dystrochrepts 0.25 Paddy 32.63
Fine loamy, Typic Dystrochrepts 10.89
Tongajan Gaon
Coarse loamy, Lithic Dystrochrepts 83.47 Paddy 173.71
Fine loamy, Typic Dystrochrepts 130.22
Phulbari Gaon Fine loamy, Typic Dystrochrepts 41.88 Paddy 83.76
Tipomia Habi
Gaon Coarse loamy, Lithic Dystrochrepts 315.20 Paddy 232.47
Bhagyalakni
Coarse loamy, Lithic Dystrochrepts 26.34 Paddy 209.86
Fine loamy, Typic Dystrochrepts 189.67
Fine loamy, Typic Dystrochrepts 80.06
Charaipani
Bosabari T.E. Coarse loamy, Lithic Dystrochrepts 278.14 Paddy 84.98
Grant No.188 Coarse loamy, Lithic Dystrochrepts 168.45 Paddy 19.68
Charaipani Grant No.1
Coarse loamy, Lithic Dystrochrepts 150.34 Paddy 128.36
Fine loamy, Typic Dystrochrepts 33.20
Fine loamy, Typic Dystrochrepts 3.27
Page 29
26
Table No. 2.5 Details of flood and drought in the project area
Sl No
Villages
Periodicity
Annual Occurance
(During 1998-2007)
No. of village : 37
1 Salaguri Gaon High 7-8 Times
2 Lohong Bebejia High 7-8 Times
3 Madhapur Grant No.1 Moderate 5-6 times
4 Saidal Kachari Gaon Very High 9-10 Times
5 Tipomia Gaon Very High 9-10 Times
6 Turung Gaon High 7-8 Times
7 Christian Gaon High 7-8 Times
8 Madhapur No.2 Moderate 5-6 times
9 Kachari Gaon High 7-8 Times
10 Charaipani Bongali Gaon Moderate 5-6 times
11 Dangdhara Grant Moderate 5-6 times
12 Mohima Bari Gaon Low 3-4 Times
13 Medeluajan Gaon Moderate 5-6 times
14 Tongajan Gaon High 7-8 Times
15 Phulbari Gaon Very Low 1- 2 Times
16 Tipomia Habi Gaon High 7-8 Times
17 Bhagyalakni Low 3-4 Times
18 Charaipani Bosabari T.E. Low 3-4 Times
19 Grant No.188 Moderate 5-6 times
20 Charaipani Grant No.1 Moderate 5-6 times
Table No. 2.6: Details of soil erosion in the project area
Cause Type of erosion
Name of Micro
Watershed
Area affected
(ha)
Run off Average soil loss
(Tonnes/ ha/ year)
(mm/
year)
Water erosion
a Sheet
Dangdhara -
Mohimabari
680.46
1200 0.46 b Rill 39.94
c Gully & Riparain Erosion
-
a Sheet
Salaguri-
936.54
1200 0.46 b Rill 64.34
c Gully & Riparain
Erosion
a Sheet
Saidal - Turung
617.54
1200 0.46 b Rill 48.60
c Gully & Riparain
Erosion
a Sheet
Phulbari -Tengajan
1107.84
1200 0.46 b Rill 98.27
c Gully & Riparain
Erosion 7.46
Page 31
28
Table No. 2.7 Details of the Soil pH sl
No
Name of Village Soil pH Major soil types
1 Salaguri Gaon Moderatly acidic 4.5 – 5.5 Coarse loamy, Lithic Dystrochrepts
Neutral 6.5-7.5 Coarse loamy, Aeric Udifluvents
2 Lohong Bebejia Moderatly acidic 4.5 – 5.5 Coarse loamy, Lithic Dystrochrepts
3 Madhapur Grant No.1 Moderatly acidic 4.5 – 5.5 Coarse loamy, Lithic Dystrochrepts
4 Saidal Kachari Gaon Neutral 6.5-7.5 Coarse loamy, Aeric Udifluvents
Moderatly acidic 4.5 – 5.5 Fine silty, Typic Haplaquepts
5 Tipomia Gaon Moderatly acidic 4.5 – 5.5 Coarse loamy, Lithic Dystrochrepts
Neutral 6.5-7.5 Coarse loamy, Aeric Udifluvents
6 Turung Gaon Moderatly acidic 4.5 – 5.5 Coarse loamy, Lithic Dystrochrepts
7 Christian Gaon Moderatly acidic 4.5 – 5.5 Coarse loamy, Lithic Dystrochrepts
Neutral 6.5-7.5 Coarse loamy, Aeric Udifluvents
8 Madhapur No.2 Moderatly acidic 4.5 – 5.5 Coarse loamy, Lithic Dystrochrepts
9 Kachari Gaon Moderatly acidic 4.5 – 5.5 Coarse loamy, Lithic Dystrochrepts
10 Charaipani Bongali Gaon Moderatly acidic 4.5 – 5.5 Coarse loamy, Lithic Dystrochrepts
11 Dangdhara Grant Moderatly acidic 4.5 – 5.5 Coarse loamy, Lithic Dystrochrepts
12 Mohima Bari Gaon Moderatly acidic 4.5 – 5.5 Coarse loamy, Lithic Dystrochrepts
13 Medeluajan Gaon Moderatly acidic 4.5 – 5.5 Fine loamy, Typic Dystrochrepts
Moderatly acidic 4.5 – 5.5 Fine loamy, Typic Dystrochrepts
14 Tongajan Gaon Moderatly acidic 4.5 – 5.5 Coarse loamy, Lithic Dystrochrepts
Moderatly acidic 4.5 – 5.5 Fine loamy, Typic Dystrochrepts
15 Phulbari Gaon Moderatly acidic 4.5 – 5.5 Fine loamy, Typic Dystrochrepts
16 Tipomia Habi Gaon Moderatly acidic 4.5 – 5.5 Coarse loamy, Lithic Dystrochrepts
17 Bhagyalakni
Moderatly acidic 4.5 – 5.5 Coarse loamy, Lithic Dystrochrepts
Moderatly acidic 4.5 – 5.5 Fine loamy, Typic Dystrochrepts
Moderatly acidic 4.5 – 5.5 Fine loamy, Typic Dystrochrepts
18 Charaipani Bosabari T.E. Moderatly acidic 4.5 – 5.5 Coarse loamy, Lithic Dystrochrepts
19 Grant No.188 Moderatly acidic 4.5 – 5.5 Coarse loamy, Lithic Dystrochrepts
20 Charaipani Grant No.1
Moderatly acidic 4.5 – 5.5 Coarse loamy, Lithic Dystrochrepts
Moderatly acidic 4.5 – 5.5 Fine loamy, Typic Dystrochrepts
Moderatly acidic 4.5 – 5.5 Fine loamy, Typic Dystrochrepts
Page 32
29
Table No.2.7.1 Climatic Condition
Sl No
Year (2009) /month
Monthly Rain fall(in
mm)
Average Annual
rainfall(in mm)preceding 5
years
Temp(0C) (year -2009)
Wind Velocity
Evaporation
(mm per month)(year
2009)
Relative Humidity(RH) (Year 2009)
Average Annual run
off(mm/year) Max Min
Morning
(Recorded at 6.13 hrs
Afternoon (recorded
at 13.13
hrs
Sunshin
e Hrs.
1 January 6.60
1714
24.10 11.7 32.8 96 57 4.9
45.30
2 February 21.70 26.70 13.1 50.9 94 49 6.1
3 March 26.00 29.00 16.1 73.8 95 44 5.1
4 April 154.00 28.90 20.6 72.1 93 65 5.2
5 May 187.80 30.90 23 96.2 91 69 6.4
6 June 225.00 33.00 25.4 93.4 92 70 5.2
7 July 293.40 33.00 26 94.6 93 70 5.2
8 August 286.80 31.80 25.6 81.8 95 74 4.3
9 September 101.50 33.10 25.7 94.7 93 68 6.6
10 October 57.80 30.80 22.6 68.4 95 65 5.9
11 November 18.70 27.00 16.5 46 97 61 5.9
12 December 0.70 23.30 12.4 31.7 97 64 4.6
13 Average Monthly
Rain fall(in mm) 115.00
69.7
Page 33
30
Table No.-2.8 Physiographic Features
Names of micro watersheds and
Code Nos.
Elevation (metres)
Slope range (%)
Order of
watershed Major streams
Toposequence Average annual
soil loss(Ton / hectare/year)
Sub/micro-watershed
(Soil series)
Salaguri MWS, 3B3C3eII
Maximum - 109 mtr./
Minimum - 90 mtr. Average - 97 Mtr.
Max. Slope
3.5% / Average Slope - 0.6%
Medelua Jan,Tippomia
Jan, Leteka Jan
Coarse loamy,
Lithic Dystrochrepts
0.46
Saidal – Turung MWS, 3B3C3eIII
Maximum - 107mtr./ Minimum - 90mtr.
Average - 97Mtr.
Max. Slope 6.8% / Average
Slope - 0.8%
Tippomia Jan,Medelua Jan, Tenga Jan,Pan Jan
Coarse loamy, Aeric
Udifluvents
0.46
Dangdhara –Mahimabari MWS,
3B3C3eI
Maximum - 126 mtr./ Minimum - 93 mtr.
Average - 106 Mtr.
Max. Slope 4.1% / Average
Slope - 0.9%
Soraipani Jan, Leteka Jan
Coarse loamy, Lithic
Dystrochrepts
0.46
Phulbari -Tengajan
MWS, 3B3C3eIV
Maximum - 132mtr./
Minimum - 102 mtr. Average - 114 Mtr.
Max. Slope 12.8% /
Average Slope -
0.8%
Tenga Jan,Tippomia
Jan, Pan Jan, Soraipani Jan, Medelua Jan
Fine loamy,
Typic Dystrochrepts
0.46
Table No. 2.9 Watershed characteristics
Shape index of the watershed
Length of main stream
Drainage density Average slope Watershed relief Perimeter of the watershed
14.21 Km 0.00128 0.8 - 36357
Page 34
31
CHAPTER – 3 BASE LINE INFORMATION OF WATERSHED
Table No. 3.1: Demographic features: 1 2 3 4 5
S.No Feature Male Female Total
1
Population 10927 10475 21402
SC 318 307 625
ST 1771 1880 3651
OBC 6099 5719 11818
Others 2739 2569 5308
2 Children(0-14 years) 3084 2970 6054
3 Sex Ratio 913
4
Literacy 69.02% 54.33% 61.83%
Literates 7543 5691 13234
Illiterates 3385 4783 8168
5
Work Force
Agriculture 3299 2628 5927
Industrial/Business 1117 35 1152
Service 905 248 1153
6 Birth Rate NA NA NA
7 Death Rate NA NA NA
Table No. 3.2: Livestock details:
1 2 3
S.No Feature No./ quantity)
1 Milch Animals
Cows 4101
Buffaloes
Goat, sheep 4832
2 Draft Animals
Ox -
He Buffalo -
3 Others -
Poultry 5217
Piggery 1405
4 Total Milk production from milch animals (ltrs/day) 265
5 Fodder Availability
Dry (Abundant/Sufficient/ Scarce) Sufficient
Green (Abundant/Sufficient/ Scarce) Sufficient
6 Fuel wood Availability (Abundant/Sufficient/Scarce) Scarce
Page 35
32
Table No.3.3: Socio- economic status: 1 2 3 4 5 6
SN Type Total HHs
No. of BPL
HHs
Land Holding (Ha) Average Annual Gross Income (Rs.)
Rain fed Irrigated
SC ST Others SC ST Others Total SC ST Others Total
1 Marginal 1494 74 64.09 390.52 217.76 672.37 - 8.19 44.11 52.30 30000 32000 38000
2 Small Farmers 605 - 19.79 160.05 1091.69 1271.53 6.21 13.66 129.06 148.92 50000 50000 52000
3 Big farmers 384 - 10.37 89.63 1512.76 1612.76 46.43 62.73 109.16 90000 100000 100000
4 Landless 1558 1558 - - - - - - - - 19000 19000 19000
Total 4041 1632 94.25 640.20 2822.21 3556.66 6.21 68.28 235.89 310.38 189000 201000 209000
Table No. 3.4: Migration Details:
1 2 3 4 5 6 7
Sl.
No.
No. of persons migrating No. of days
per year of
migration
Major reason(s) for migrating
Distance of
destination of
migration from the
village (km)
Occupation during
migration
Income from
such
occupation
(Rs.) M F Total
1
1480 230 1710 180
Lack in sufficient employment generation,
For Better Opportunity , Lack of irrigation
facility, Mono Crop Area etc.
Various from 20 to
300 Km
Private Job,
Labour, etc. -
Page 36
33
Table No. 3.5: Details of Community Based Organizations existing in the watershed village:
1 2 3 4 5 6 7 8 9
S.
N
o.
Type of Group
Total no. of CBOs No. of members No. of ST in
each category
No. of SC in each
category
No. of Others in
each category
No. of BPL in
each category
Bank linkage
With o
nly
Men
With o
nly
Wom
en
With b
oth
Tota
l
M F Total M F Total M F Total M F Total M F Total
No. of SH
Gs
Bank L
oan
Am
ount
(Rs.
)
1 SHG
(i) Landless
(ii) MF
(iii) SF
(iv) LF
Total
2 UGs
(i) Landless
(ii) MF
(iii) SF
(iv) LF
Total
3 VSS
4 FG/ FC1
5 WUA
6 F-SHG-C
7 F-SHG-B
8 PG
9 PC
10
Other
related Groups
VSS: Van Suraksha Samiti, FG: Farmer’s Group/ Farmer’s Club, WUA: Water User Association, F-SHG: Federation of SHGs (C: at Cluster, B: at Block), PG: Producer’s Group,
PC: Producer’s Cooperative.
Page 37
34
Table No. 3.6: Infrastructure Facilities:
1 2 3 4 5
S.No Infrastructure type No./Quantity Distance (km) Status (description)
1 Educational Institutions
Anganwadi 31 Within the village Functional
Primary School 25 Within the village Functional
Secondary school 6 - -
Govt. College - - -
Vocational Institutions - - -
2 Service Institutions - -
Bank NA - -
Post office 4 - -
Primary Health Care Center 5 - -
Veterinary Center 2 - -
Markets/ Village Haat 2 - -
3 No. of bore wells/pump sets
(Functional)
NA - -
4 No. of Milk collection centers ( Union/ Society/ Pvt.
Agency/Others)
NA - -
Total Quantity of surplus milk
NA - -
5 Road Connectivity (to main
road by an all-weather road) (Yes/No)
Yes - -
6 Bus facility (Yes/No) No - -
7 No. of HHs provided electricity
2988 - -
8 No. of HHs with access to
drinking water
3900 - -
9 Access to Agro Industries
(Yes/No)
NO - -
10 Any other facilities (specify-------------)
- -
Page 38
35
Table No.3.7 Land use pattern (in Hectares)
Sl
No
Name of Village
Geogra
phic
al Are
a(H
a)
Fore
st A
rea (
ha)
Com
munity L
and
Land u
nder
agricu
ltura
l
use
(ha)
Perm
anent
past
ure
s (h
a)
Land U
nder
mis
cella
neous
use
Uncultivated
Private land Cultivated area
Net
Sow
n A
rea
Net
Are
a s
ow
n m
ore
than o
nce
Gro
ss C
ropped A
rea
Tem
pora
ry fallo
w
Perm
anent
Fallo
w
Cultiv
ate
d R
ain
fed
Cultiv
ate
d I
rrig
ate
d
1 Salaguri Gaon 514.95 0 0 350.30 0 0.00 2.36 0 311.04 39.26 350.30 39.26 389.56
2 Lohong Bebejia 343.64 0 0 256.11 0 0.00 0 0 256.11 0 256.11 0 256.11
3 Madhapur Grant No.1 181.9 0 0 74.05 0 0.00 0 0 74.05 0 74.05 0 74.05
4 Saidal Kachari Gaon 562.51 0 0 483.39 0 0.00 18.1 0 215.68
267.71 483.39 267.71 751.10
5 Tipomia Gaon 367.68 0 0 232.47 0 0.00 0 0 229.06 3.41 232.47 3.41 235.88
6 Turung Gaon 262.3 0 0 220.68 0 0.00 0 0 220.68 0 220.68 0 220.68
7 Christian Gaon 196 0 0 152.13 0 0.00 0 0 152.13 0 152.13 0 152.13
8 Madhapur No.2 95.73 0 0 40.01 0 0.00 0 0 40.01 0 40.01 0 40.01
9 Kachari Gaon 35.01 0 0 23.89 0 0.00 0 0 23.89 0 23.89 0 23.89
10 Charaipani Bongali Gaon 277.98 0 0 205.07 0 0.00 0 0 205.07 0 205.07 0 205.07
11 Dangdhara Grant 182.85 0 0 124.32 0 0.00 0 0 124.32 0 124.32 0 124.32
12 Mohima Bari Gaon 216.71 0 0 72.12 0 0.00 0 0 72.12 0 72.12 0 72.12
13 Medeluajan Gaon 34.59 0.31 0 32.63 0 0.00 0 0 32.63 0 32.63 0 32.63
14 Tongajan Gaon 236.55 6.39 0 173.71 0 0.00 0 0 173.71 0 173.71 0 173.71
15 Phulbari Gaon 105.24 2.1 0 83.76 0 0.00 0 0 83.76 0 83.76 0 83.76
16 Tipomia Habi Gaon 315.21 0 0 232.47 0 0.00 0 0 229.06 3.41 232.47 3.41 235.88
17 Bhagyalakni 298.72 37.25 0 209.86 0 0.00 0 0 209.86 0 209.86 0 209.86
18 Charaipani Bosabari T.E. 278.18 0 0 84.98 0 0.00 0 0 84.98 0 84.98 0 84.98
19 Grant No.188 168.45 0 0 19.68 0 0.00 0 0 19.68 0 19.68 0 19.68
20 Charaipani Grant No.1 186.81 0 0 128.36 0 0.00 0 0 128.36 0 128.36 0 128.36
TOTAL 4778.45 46.05 0 3199.99 0 0.0 20.46 0 2886.2 313.7 3199.99 313.79 3513.78
Page 39
36
Table No. 3.8: Details of Common Property Resources: 1 2 3 4
S.No CPR Particulars
Total Area (ha)
Area owned/ In possession of Area available for treatment (ha)
Pvt.
persons
Govt.
(specify dept.) PRI
Any other
(Pl. Specify)
Pvt.
persons
Govt.
(specify deptt.) PRI
Any other
(Pl. Specify)
1 Wasteland/ degraded land - 160 - - - 461.26 - -
2 Pastures - - - - - - - -
3 Orchards - - - - - - - -
4 Village Forest 320 - - - - - - -
5 Forest - - - - - - - -
6 Village Ponds/ Tanks 1.26 - - - - - - -
7 Community Buildings - - - - - - - -
8 Weekly Markets - 1.55 - ` - - - -
9 Permanent markets - - - - - - - -
10 Temples/ Places of worship - - - 3.5 - - - -
11 Others (Pl. specify) - - - - - - - -
Total - -
Table No. 3.9: Agriculture implements:
1 2 3
S. No. Implements Nos.
1
2
3
Table No. 3.10: Crop Classification 1 2 3
S. No. Crop Classification Area (Hec)
1 Single Crop 3556.66
2 Double Crop 310.38
3 Multiple Crop -
Page 40
37
Table No. 3.11: Crops & Cropping pattern: 1 2 3 4 5 6
S. No
Season Crop sown
Rain fed Irrigated Total
Area
(ha)
Producti
on (Ton/yr)
Producti
vity (Kgs/ha)
Cost of
cultivation (Rs. /ha)
Area
(ha)
Productio
n(Ton/yr)
Productivi
ty (Kgs/ha)
Cost of
cultivation (Rs. /ha)
Area
(ha)
Production
(Ton/yr)
Productivity
(Kgs/ha)
Cost of
cultivation (Rs. /ha)
1 Kharif Paddy 3556.66 4979 1400 5200 0 0 0 0 3556.66 4979.324 1800 5650
2 Rabi Paddy 0 0 0 0 310.38 682.84 2200 6100 310.38 682.836 225 8500
Lentil 30 39 300 13000 0 0 0 0 30 39 150 6500
Total 3897.04 5701.16 2175 20650
Table No. 3.12: Land capability Classification
* Soil texture (sandy-clay, clayey, loamy-clay, gravel)
1 2 3 4 5 6
La
nd
cla
ss
SN
La
nd
typ
e
To
tal
Are
a
(ha
)
So
il T
ex
ture
*
Based on Depth (cms)- (mention area in ha)
Based on Slope (%) (mention area in ha)
Erosion (mention area in ha)
V. Shallo
w
(0.7
5)
Shallo
w (
7.5
-
22.5
)
Modera
te
deep (
22.5
-
45.0
0)
Deep (
45.0
-
90.0
)
Very
. D
eep
(>90)
Nearly L
evel
(0-2
)
Modera
te
slope (
2-6
)
Str
ong s
lope
(6-1
5)
Ste
ep (
>15)
Water
Win
d
Sh
ee
t
Ril
l
Gu
lly
1 Agricultural Land (Double Crop
310.38 Fine Silty, Coarse-
loamy, Coarse-Silty
- - - 310.38 310.38 - - -
3342.3
8
251.1
5
-
2 Agricultural Land
(Kharif)
3556.66 - - - 3556.66 3556.66 - - -
3 Agricultural Land (Rabi)
- - - - - - - - -
4 Rural Habitation 1039 - - - 1039 1039 - - -
5 Wetland 20 - - - 20 20 - - -
Page 41
38
Table No.3.13: Irrigation facilities:
Table No. 3.15: Assessment of drinking water facility*:
* based on the observation from the field
1 2 3 4
S.No Type of the Source Nos. Command area (in ha)
1 Ponds 16 3.60
2 Open wells - -
3 Bore wells - -
4 Canal irrigation - -
5 Natural spring head -
1 2 3 4 5
S.No Item Units Quantity Source
1 Drinking water requirement Ltrs/day 74907 Well/Tubewell
2 Present availability of drinking water Ltrs/day 69000 Well/Tubewell
3 No. of drinking water sources
available
Nos 3200 Well/Tubewell
a) Functional Nos - -
b) Need Repairing Nos - -
c) Defunct Nos - -
4 Short fall if any Ltrs/day 5907
5 No. of families getting drinking water
from out side the Micro watershed
area
Nos -
6 Requirement of new drinking
water sources (if any)
Nos. -
Page 42
39
Table No. 3.16: Surface water resources
Table No. 3.19: Details of existing livelihoods
1 2 3 4
S. No.
Name of
activity
No. of beneficiaries Pre-project average
income per HH
(Rs.) SC ST Others Total Women
1 Dairy 14 21 231 266 40 3000
2 Goatary 55 160 2868 3083 1700 2500
3 Duckery 62 202 2576 2840 2100 1000
4 Poultry 47 698 1096 1841 1650 1500
5 Piggery 82 14 96 10 3500
6 Weaving 10 5 65 80 80 1000
1 2 3 4 5
S.No Type of water resource
Nos Area irrigated (Ha) Storage capacity (Cu.m)
1 Tank - - -
2 Pond 16 3.6 3200
3 Lake/Wetland 1 10 57000
4 Check dam - - -
5 Percolation tank - - -
6 Drainage
Channel/Canal
1 - -
7 Any others (specify--
------------)
- - -
Page 43
40
Table No.3.21 PROBLEM TYPOLOGY OF THE WATERSHED
1 2 3 4
S.No Problem area Problem analysis Proposed interventions to overcome
problems
1 Soil Conservation
(slope, erosion, soil
loss, rainfall,
productivity, etc)
1. River Bank Erosion, 2. Soil Erosion, Siltation & high soil loss in
upland area. 3. Sheet erosion is combatively high in many
places.
1. Construction of graded bund, field bund to protect the soil erosion and
siltation problems.
2. Applying Bio-engineering (Vetiver Plantation) to protect the river bank from erosion.
2 Water
conservation
(Water budget,
Ground water norms,
productivity)
1. Degradation of Natural Resource like congestion of natural drainage, degradation of wetland etc.
2. Lack of water storage facility cause scarcity
of water during winter.
3. Run-off originated from seasonal rain
attains high velocity due to medium to steep
prevailed in the watershed and thereby
causes all types of soil erosion hazards.
4. Loss of productivity due to waterlogging
1. Restoration of drainage channel by excavation and reclamation.
2. Reclamation of natural water bodies (beels) by excavating and constructing periphery bund etc. Increase water storage capacity.
3. Construction of Farm Pond for water harvesting/storage. Along with water
distribution channel for irrigation.
4. Construction of Nullabund to check the
water stagnant/waterlogging problem.
Page 44
41
3 Crop coverage –
{80% of w/s area
should be with
canopy}
1. Rabi crop area is very low because of lack of
irrigation facilities.
2. Mono cropping
3. Inundation problem during summer (kharif)
4. Low vegetative cover
1. Agro-forestry, fuel wood plantation
2. Turmeric & Banana Plantation
4 Agriculture
productivity (crop
wise compare with
dist. average)
1. Low agricultural productivity due to high
flood during summer, lack of irrigation
facility, erratic and uncertain rainfall, low
cropping intensity, lack of location-specific
technologies to match the high ecological
diversity of rainfed area etc.
1. Brick canal and water storage farm pond for irrigation for both Rabi & Kharif crop.
5 Livestock
productivity (Milk
Yield, Meat yield,
Eggs, Wool Yield,
Kidding etc.)
1. Scarcity of fodder during flood period.
2. Lack of secure shelter during flood period
3. Inadequate nutrition due to lack of grazing
land.
4. Diseases which reduce the production
potential of livestock.
1. Promotion of Marketing facilities
through SHG
2. Promotion of Dairy, Piggery, goatery, Duckery and Poultry farming activities.
6 Existing Livelihood
activities for Asset
1. Less income generating activities.
2. Their present occupation is Daily Labour,
1. Promotion of Dairy, Piggery, goaery, Duckery and Poultry farming activities.
Page 45
42
less persons Rikswa Pullers etc. 2. Promotion of weaving activities for
asset less woman.
7 Community Based
Organizations &
Social capital base
1. Most of the SHG are not functional. 1. Formation of SHG, User groups for promotion of various income generating activities
8 Capacity Building
(participation,
training, awareness
of watershed
community
1. In many villages it is observed that the
Participation in Gram Sabha is very low due
to lack of awareness towards watershed
development activities.
1. Conducting Awareness programmes
among the villagers.
2. Providing training in respect to each activities proposed for watershed development as well as livelihood
generation.
9 Others (specify) 1. Lack of Marketing Facilities 1. Providing Market Promotion Centres along with Low Cost go-down for
storage of various products.
Page 46
43
CHAPTER – 4
Institutional Building and Project Management
Table No. 4.1 Details of SHGs & UGs newly formed under IWMP:
1 2 3 4 5 6 7 8 9
Sl. No
.
Type of
Group
Total no. of CBOs No. of members No. of ST in
each
category
No. of SC in each
category
No. of
Others in each
category
No. of BPL in each
category
Bank linkage
With
only
Men
With only
Wome
n
Wit
h both
Tota
l M F
Tota
l M F
Tota
l M F
Tota
l M F
Tota
l M F
Tota
l
No. of SHGs
Amount (Rs)
1 SHG
(i)
Landless
(ii) MF
(iii) SF
(iv) LF
Total
2 UGs
(i)
Landless
(ii) MF
(iii) SF
(iv) LF
Total
*Account no. of Watershed Committee, PIA.
Page 47
44
4.2: Details of Watershed Committees (WC)
1 2 3 4 5 6 7 8 9 10 11 12 13 14 15 16 17 18
Name of
WCs
Date of
Registration
as a
Society
No. of
members in
WC Designation Name
M/F
SC ST SF MF LF Land-
less UG SHG GP
Any
other Educl
qualifi-
cation
Function/s
assigned# Write “Yes” if applicable
Dangdhra
Mahimabari
Watershed
Committee
10 President Ullium Barlu M
Secretary Nabin Dutta M
Member Md. Mainuddin Ahmed M
Member Mrs. Tanuja Begam F
Member Miss Mayuri Saikia F
Member Miss Juri Saikia F
Member Sri Budheswar Bhumij M
Member Mrs. Purabi Saikia F
Member Sri Surbhajyoti Borah M
Member Mrs. Rinku Moni
Phukan
F
Page 48
45
1 2 3 4 5 6 7 8 9 10 11 12 13 14 15 16 17 18
Name of
WCs
Date of
Registration
as a
Society
No. of
members in
WC Designation Name
M/F
SC ST SF MF LF Land-
less UG SHG GP
Any
other Educl
qualifi-
cation
Function/s
assigned# Write “Yes” if applicable
Salaguri
Watershed
Committee
10 President Mrs. Panita Bora F
Secretary Sri Sunil Saikia M
Member Sri Sunil Bora M
Member Mrs. Kalpana Sonowal
Kachari
F
Member Sri Mithen Lagun M
Member Mrs. Rita Saikia F
Member Mr. Lohit Das M
Member Sri Mridul Bora M
Member Sri Babul Bora M
Member Mrs. Sumi Barik F
Page 49
46
1 2 3 4 5 6 7 8 9 10 11 12 13 14 15 16 17 18
Name of
WCs
Date of
Registration
as a
Society
No. of
members in
WC Designation Name
M/F
SC ST SF MF LF Land-
less UG SHG GP
Any
other Educl
qualifi-
cation
Function/s
assigned# Write “Yes” if applicable
Sadial
Turung
Watershed
Committee
11 President Sri Singheswar Shym M
Secretary Sri Sanjib Barua M
Member Mrs. Lakhimi Thengal
Gogoi
F
Member Mrs. Joya Kachari F
Member Sri Jekson Bhengra M
Member Sri Prasanta Hazarika M
Member Mrs. Anita Sonowal
Kachari
F
Member Sri Pabitra Saikia M
Member Sri Tileswar Kurmi M
Member Mrs. Daibaki Kachari F
Member Sri Dambaru Saikia M
Page 50
47
1 2 3 4 5 6 7 8 9 10 11 12 13 14 15 16 17 18
Name of
WCs
Date of
Registration
as a
Society
No. of
members in
WC Designation Name
M/F
SC ST SF MF LF Land-
less UG SHG GP
Any
other Educl
qualifi-
cation
Function/s
assigned# Write “Yes” if applicable
Phulbari-
Tengajan
Watershed
Committee
11 President Sri Debakumar Kurmi M
Secretary Mrs. Jurijyori Saikia F
Member Sri Anil Gogoi M
Member Sri Mantu Bhakta
Member Deepak Saikia
Member Mrs. Moni Gogoi
Member Mrs. Runu Saikia
Member Sri Jeral Tappa
Member Mrs. Mandira Hazarika
Member Sri Susanta Hazarika
Member Sri Atul Bag
Page 51
48
Table No 4.3: WDT Particulars:
1 2 3 4 5 6 7
S.No
Names of WDT
members M/F# Age Qualification / Experience
Description of
professional training Role/ Function*
1 Keshab Baruah M - SCR, Converner, Range
Office, Titabar SC Range,
Titabar
- -
2 Shri Pulin Bora M - ADO, Sub-Divisional Agril.
Office, Titabar
- -
3 Shri Ajit Chetia M - J.E., AEE, Irrigation Sub
Divisional Office, Titabar
- -
4 Smti Juri
Bhattacharya
F - I.C.D.S Project, Titabor - -
5 Dr. Dinesh
Gogoi
M - Tipomiya State Vety.
Dispensary
- -
6 Shri J. R.
Boruah,
M - F.R. Range Office,
Moriyani Forest Range,
Moriyani
- -
7 Miss
Sanghamitra
Shyam
F - WCDC, Jorhat - -
Page 52
49
Table No. 4.4: PIA particulars 1 2 3
S.No Particulars Details of PIA
1. Type of organization# Govt. Department
2. Name of organization Department of Soil Conservation
3. Designation & Address Divisional Officer, Jorhat Soil Conservation Divison, Jorhat, Assam
4. Telephone +91-9678009880
5. Fax
6. E-mail [email protected]
# In column no. 8.1.6 (1), only the letter assigned to each type, as given below, needs to be typed.
A Line Dept. B Autonomous organization
C Govt. Institute D Research Bodies
E Zila Parishad F Intermediate Panchayat
G Voluntary Organisations H Any other (please specify).
Table No. 4.5 Bank Account Details Name of WC/PIA Name of the Bank/Place Account No. Name of the Signatory Address
Page 53
50
* Institutional Mechanisms:
Fig. 11 Flow Chart of Institutional Arrangement from District to watershed level
NLDC National Level Data Centre DoLR Department of Land Resource NRAA National Rainfed Area Authority SLNA State Level Nodal Agency
C.E.O Chief Executive Officer MIS Management Information System GIS Geographical Information System SLDC State Level Data Cell F.O. Financial Officer T.E. Technical Expert
DEO Data Entry Operator DWDU District Water Development Unit DDC District Data Cell WC Watershed Committee PIA Project Implementation Agency PIU Project Implementation Unit
WDT Watershed Development Team SHG Self Help Group WDTM Watershed Development Team Member UG User Group
DoLR, Gol
SLNA - ASSAM
NRAA, GoI
Chairman
MIS
GIS
SLDC
Admn. Officer F.O.
C.E.O. RDD SS, Finance, PCC, Director Soil, DoLR, NREGA, Water, Agril, F&E, DoLR, NGO, Expert, PIA
DWDU
PIA/PIU
WC
SHG UG
T.E. (W/M)
T.E. (Agr.)
T.E. (GIS.)
T.E. (GIS.)
Ac. Astt./ Off. Astt, DEO
NLDC
Chairman Project Manager WCDC T.E. (Agri, W/M, S/M, Mang., F.O
Com. Opp. Off. Astt.
DDC
National Level Institutional
Arrangement
State Level Institutional
Arrangement
WDT MEMBER
District Level Institutional
Arrangement
Project Level Institutional
Arrangement
Page 54
51
4.6.2 Fund Flow mechanisms – flow chart,
4.6.3 List of Watershed Records to be maintained
A) AT WATERSHED COMMITTEE LEVEL
Registration Certificate
Bylaws
Detail Project Report
Annual Action Plan
Cash Book
DoLR, Gol (90%)
Govt. of Assam (10%)
STATE LEVEL NODAL AGENCY, ASSAM
(100%)
PROJECT IMPLEMENTATION AGENCY (PIA)
(TRAINING, OVERHEAD, EPA)
WATERSHED COMMITTEE
DWDU
Page 55
52
Project Fund Passbook
Watershed Development Fund Pass book
Ledger Book
Asset Register
Vouchers
Land Details
Measurement Book
Audit Report/ Social Audit Report
Photo Documents
Project Completion Report
Common Guidelines
MoU between Watershed Committee and Project Implementing Agency
Revenue Records.
B) AT PROJECT IMPLEMENTING AGENCY LEVEL
Cash Book
Computerized Accounting System
Vouchers
4.7 Documents of Agreements:
4.7.1) Watershed Committee Registration certificate - (under Process)
4.7.2 MoU – PIA – DWDU, PIA – WC - (under Process)
4.7.3 Resolution of Gram Sabha ,Aam Sabha, WC approving action plan#
#the resolution should be done village wise and needs to be approved in Gram/Aam Sabha
Page 56
53
4.8 Project Implementation
Project Implementation involves a number of activities. Among them, the major
activities are- securing community participation, co-ordination of activities and
project management & Controlling, Monitoring.
Co-ordination is the process whereby more people or organizations work together
to deal collectively with a shared objective. The rationale for co-ordination shall be-
1. To take immediate corrective action for problems encountered in
implementation of the project.
2. To promote better relationship among organizations, institution, departments
and individuals connected with the project and to harmonies resources and
activities for the achievements of the project objectives.
3. To establish cordial relationship between the target population of the project
and all the other section of the society.
4. Team building which include recruiting people with appropriate qualification
for positions in the organization, orienting new people to their position to help
them learn about their responsibilities and providing training when necessary
to upgrade people’s skills.
Project Management & Controlling means managing activities to ensure
progress towards the project objectives.
1. Measuring progress of project by comparing the current situation with
established goals and objectives.
2. Submitting reports to account for project activities and finance
3. Monitoring performance to document the way people carry out their
responsibilities.
4. Providing feedback to people on a regular, informal basis including positive
feedback and constructive criticism.
5. Adjusting plans to respond to changes in the internal and external
organizational environment.
Page 57
54
Monitoring is an important part of project implementation which is a process of
routinely gathering information on all aspects of the project. The monitoring shall
be continuous and it should be in place before start-up.
The first level monitoring shall be done by the project staff. The DWDU and PIA
shall be responsible for monitoring the staff and task under them and Project
Manager shall be responsible for monitoring all aspects of the project. The
second level monitoring shall be done by third party. The monitoring team shall
be collected the report through field visit, progress and measures performance
including financial reporting.
Step for Monitoring Process:
Defining the objectives of the monitoring system;
Designing a programme to systematically monitor achievements;
Selection of indicators/parameters to be monitored, the location,
methods/processes and frequency of observations and the information
processing and reporting procedure are important; and
Organizing, motivating and training people to obtain, convey and use the
information.
Monitoring Tools
Semi-structured interviews;
Community workshops to evaluate the extent of adoption and resulting
achievements from conservation practices.
Observation and measurement of easily quantifiable field indicators.
Farmers’ own records can be prepared which provides vital information to
great details.
Ground photographs taken from the same place depicting before and after
remedial measures, details concerning landscape CPR’s changes in the
status of natural resources.
Community evaluation of certain simple technical, ecological, economical,
social and essential services indicators.
Remote sensing satellite imageries and aerial photographs taken at the
start of the plan are repeated periodically.
Page 58
55
Geographical Information Systems (GIS)
Video monitoring.
Comparison with demonstration and research plots/ farms.
Comparison with demonstration and research micro-watersheds.
Hydro-meteorological measuring.
Using the information gathered by other institutional and private
enterprises.
Combination of above mentioned tools.
PIS Tasks Responsibility
Project
Co-ordination
Immediate corrective action for
problem encountered
DWDU, Project Manager,
WDT Member
Create Relationship among staff and Institution
Project Manager
Team Building & Capacity Building DWDU/PIA/Project Manager
Co-operation and Network
Development DWDU/PIA/Project Manager
Project Management &
Controlling
Progress of Project Project Manager
Report generating to account project
activities and financial statement PIA/ Project Manager
Performance monitoring PIA/ Project Manager/DWDU
Monitoring
1st Level Monitoring
Staff Performance
Work Performance
Target achievement
DWDU/Project Manager/PIA
2nd Level Monitoring
Work Quality
Deviation Report
Financial statement
DWDU/ Third Party
Page 59
56
Role & Responsibility of different Institution during Project Implementation
SLNA
Prepare a perspective and strategic plan
Provide technical support to DWDU
Ensure regular and quality on-line monitoring
Identify potential PIAs
Providing professional technical support to Project Implementing
Agencies (PIAs)
Carry out regular monitoring, evaluation and learning.
Ensure smooth flow of funds to watershed development
projects.
Ensure timely submission of required documents to
SLNA / Nodal
Agency of the Department at central level.
DWDU
PIA
Technical guidance to WC
Undertake community organization and training for the
village communities
Undertake community organization and training for the
village communities
Supervise watershed development activities
Monitor and review the overall project implementation
Inspect and authenticate project accounts
Set up institutional arrangements for post-project
operation
Page 60
57
CHAPTER – 5
Management/Action Plan
Description on methodology of plan adopted
a) Awareness generation interventions :
i. Awareness campaign through Gram Sabha in each villages of watershed
area. Awareness generation programme will be conducted for all project
stakeholders at watershed level with the basic purpose of educating them
and creating more interest regarding various aspects of the IWMP project.
ii. Awareness campaign through distribution of pamphlet and brochures
describing about the IWMP project.
b) Initial Orientation program: For successful completion of the project,
orientation of both project personnel and watershed communities according to
the changing perspective is imperative and it will enhance skills and competence
of project staff to work with the villagers. Various training, awareness
programme and seminar shall be conducted to build necessary skills and
competence among the project officials, PRIs, especially GPs and other
Communities Based Organizations (CBOs) about planning, implementation and
management of various project activities.
c) Formation process UGs & Watershed Committee : The User Group and
Watershed Committee are formed through Gram Sabha and awareness
programme.
d) DPR preparation process:
In consideration of the objective & terms of reference of the programme , the
Methodology adopted for Preparing The DPR are-
A. Survey :
1. Socio-Economic Survey:
a) Collection of data to find out the strength, weakness, opportunity and
threat of the project area and assessment of local resources. It also
Page 61
58
includes collection of water sample, soil sample and testing shall be
done in laboratory to find out its problem & prospects.
b) Total household enumeration – include collection of household data
related to social as well economic status of the member. It also include
Land use, Agriculture including area, productivity, cropping intensity,
Horticulture, Livestock and Fisheries, Forests and Grass land,
Livelihood Status, Hydrology and Water Resources, Soil and Moisture
Conservation and Efficient use of Water.
2. Physiographic Survey:
a. A Physical survey has conducted using GPS/Total Station in the study
area to identify the location, distribution and availability of the local
resources and to identify the location, morphology and other
physiographic conditions that proposed for any intervention.
b. Collection of satellite imagery, toposheets, weather data, data related
to natural calamities like damage by flood, earthquake etc.
B. PRA:
After collection of baseline data of the study areas PRA has conducted among
the villagers in village level to find out the intervention which are proposed for
implementation. The PRA The process is expected to enhance identification of
the felt needs of the people, bringing forth consensus, the empowerment of
local disadvantaged groups, integration of local knowledge systems into
project design, two‐way learning process between the project and local
people, political commitment and support, accountability in local
governance. The PRA methodology utilizes different tools to seek its goal of a
participatory approach for addressing any issue. The following tools were
used by the research team in the exercise under consideration:
a. Resource mapping: Resource Mapping has done to identify valuable
resource, Ensure that everyone has access to the resources they need,
avoid duplication of services and resource, enhance service, Identify
flexible funding strategies, use data to make informed decision and
cultivate new partnerships and relationship.
Page 62
59
b. Social mapping: Social mapping is used to present information on village
layout, social infrastructure, demography, language-religion-culture
groups, health, wealth, other, etc. This provides an overview of the socio-
economic aspects.
c. Focus Group Discussion: A focus group discussion (FGD) is a group
discussion of approximately 6 - 12 persons guided by a facilitator, during
which group members talk freely and spontaneously about a certain topic.
A FGD is a qualitative method and its purpose is to obtain in-depth
information on concepts, perceptions and ideas of a group. A FGD aims to
be more than a question-answer interaction. The idea is that group
members discuss the topic among themselves, with guidance from the
facilitator. A FGD also helps to bring out the perceptions of the weaker
stake-holders in an issue, which otherwise will not come up.
d. Transect Walk: A transect walk is a walk taken by participants and
facilitator through the area of interest, observing, asking, listening,
looking, identifying different zones, seeking problems and possible
solutions. The finding are documented and they can be mapped on to a
transect diagram or map. Transects are an ideal point of departure for a
research/planning process in a village, because we establish the villagers
as the experts on living condition of that area.
e. Seasonality: Seasonality analysis has done to identify seasonal
resources. Water availability in different sources at different times,
cropping pattern is clearly recognized through seasonality tool.
f. Trend line: In Trend-line, graphs are created for long-term changes over
time based on the local people’s accounts of the past, of how things close
to them have changed - ecological histories, land use and cropping
patterns, customs and practices, trends in fuel use, etc. Although
secondary data may be available on these, a local perspective facilitates
the design of development initiatives.
g. Time line: Time line has helped us in identifying important past events.
With this information the team is better informed about the area,
community, progress and the problems. The team conducted semi-
Page 63
60
structured interviews to obtain oral histories of past events. These oral
histories can provide details on local events, how the community perceived
them, and the eventual impact of these events on the local area and the
community.
C. Analysis: Considering the objective of the study analysis has been done -
i. Analysis of Household data (Which shall include socio-economic data)
ii. Analysis of physical data (Weather Data, Soil, water quality, flood etc.)
iii. Analysis of data collected for proposed Intervention and its outcome
etc.
D. Mapping: Mapping and analysis has done in GIS Platform using ARC GIS
and the Satellite Image interpretation shall be done by ERDAS Software. The data
that collected for any intervention has analyzed in GIS Platform using satellite
imagery and Google Earth. The following Maps for the study shall be prepared
using GIS-
a. Location Map
b. Watershed Map
c. Relief Map
d. Drainage Map
e. Slope map
f. Soil Map
g. Land Use / Land cover map
h. Map showing Proposed Intervention in Different Phase
Page 64
61
Photographic View
Decongestion of Natural Drainage Ipomiya
Congestion of Natural Drainage Site Visit with Villagers
PRA (Village Meeting) Resource Mapping
Present scnerio of Infrasture Wasteland
Page 65
62
5.2 Details of Natural Resource Management Activities
Table No. 5.2.1 Soil and Moisture Conservation structures & Surface Water Treatment
1 2 3 4 5 6 7 8 9 10 11
Sl.
No
.
Na
me
of
the
Acti
vit
ies
(Str
uctu
res)
Na
me
of
the
Ha
mle
t /
Vil
lag
e
Plo
t N
um
be
rs
( in
clu
din
g
Na
me
of
the
loca
l P
atc
h)
Na
me
of
Be
ne
ficia
rie
s
Are
a (
in H
a)/
Dim
en
sio
n (
in M
/ S
q.
M /
Cu
M)
of
Str
uctu
re
Un
it C
ost
To
tal
Co
st
(in
Rs.)
Co
ntr
ibu
tio
n
To
tal
Gra
nt
Am
ou
nt
(in
Rs)
Ye
ar
of
Imp
lem
en
ta
tio
n
(1st/
2n
d/3
r
d/4
th/
5 t h )
1 Drainage Channel (RM)
Lohong Bebejia,
Madhapur Grant No.1, Saidal Kachari Gaon,
Tipomia Gaon, Turung Gaon, Christian Gaon,
Tongajan Gaon, Phulbari
Gaon, Bhagyalakni, Charaipani Grant No1
- - 24494 355 8695370 - 8695370 2nd Year, 3rd Year
2 Ipomiya Eradication
Saidal Kachari Gaon - - 60 16540 992400 - 992400 3rd Year
3 Field Bund (RM)
Salaguri Gaon, Lohong
Bebejia, Saidal Kachari Gaon, Tipomia Gaon,
Christian Gaon, Madhapur
No.2, Charaipani Bongali Gaon, Dangdhara Grant,
Tipomia Habi Gaon,
- - 51300 120 6156000 - 6156000 3rd Year & 5th Year
Page 66
63
Table No. 5.2.2 Water Harvesting Structures
1 2 3 4 5 6 7 8 9 10 11 S
l. N
o.
Na
me
of
the
Acti
vit
ies
(Str
uctu
res)
Na
me
of
the
Ha
mle
t /
Vil
lag
e
Plo
t N
ou
mb
ers
(
inclu
din
g N
am
e o
f
the
lo
ca
l P
atc
h)
Na
me
of
Be
ne
ficia
rie
s
Are
a (
in H
a)/
Dim
en
sio
n (
in
M/ S
q.
M /
Cu
M)
of
Str
uctu
re
Un
it C
ost
To
tal
Co
st
(in
Rs.)
Co
ntr
ibu
tio
n
To
tal
Gra
nt
Am
ou
nt
(in
Rs)
Ye
ar
of
Imp
lem
en
tati
on
(1st/
2n
d/3
rd/4
th/5
t
h)
1 Pond
(no)
Salaguri Gaon, Lohong
Bebejia, Saidal Kachari Gaon, Tipomia Gaon,
Madhapur No.2, Tongajan Gaon, Phulbari
Gaon, Bhagyalakni
- - 10 96000 960000 - 960000 3rd Year
&4th Year
2
Sluice
Gate (SQM)
Salaguri gaon, Saidal Kachari Gaon, Turung
Gaon, Christian Gaon, Tengajan Gaon, Phulbari
Gaon,
- - 6 1020000 6120000 - 6120000 4th Year
Page 67
64
Table No. 5.2.2 Vegetative Covers
1 2 3 4 5 6 7 8 9 10 S
l. N
o.
Na
me
of
the
Acti
vit
ies
Na
me
of
the
Ha
mle
t / V
illa
ge
Plo
t
No
um
be
r
s
Na
me
of
Be
ne
ficia
rie
s
Are
a (
in H
a)
Un
it C
ost
To
tal
Co
st
(in
Rs.)
Co
ntr
ibu
tio
n
To
tal
Gra
nt
Am
ou
nt
(in
Rs)
Ye
ar
of
Imp
lem
en
tati
on
(1st/
2n
d/3
rd/4
th/
5th
)
(in
clu
din
g
Na
me
of
the
lo
ca
l
Pa
tch
)
1 Agro Forestry
Salaguri Gaon, Lohong Bebejia, Madhapur
Grant No.1, Saidal Kachari Gaon, Tipomia
Gaon, Turung Gaon,
Christian Gaon, Madhapur No.2, Kachari
Gaon, Charaipani Bongali Gaon,
Dangdhara Grant,
Mohima Bari Gaon, Medeluajan Gaon,
- - 6.9 hec 116000 800400 - 800400
2nd Year, 3rd Year &
4th Year
2 Fuel Wood
Tongajan Gaon, Phulbari Gaon, Tipomia Habi
Gaon, Bhagyalakni
- - 24 Hec 27200 652,800 652,800
3 Road Side
Plantation
273 No 1800 491400 491400
Page 68
65
5.3: Structure or Activity Wise Details of Engineering Structure and Vegetative Measures
5.3.2: Details of engineering structures for Water Harvesting WHS
M – Materials, W- wages, O- others, T – Total
1 2 3 4
S. No. Name of structures
Proposed plan
Total units
(No./ cu.m./
rmt)
UNIT COST Estimated cost* Farmers
contribution
(Rs) (Rs. in lakh) (Rs)
M W O T
A2 Common structures
1 Brick Canal 730 680 1.4892 2.9784 0.4964 4.964 -
3 Sluice Gate 6 1020000 18.36 36.72 6.12 61.2
4 Slab Culvert 6 84500 1.521 3.042 0.507 5.07
Page 69
66
CHAPTER 6 CAPACITY BUILDING PLAN
COST OF CAPACITY BUILDING COMPONENT WISE BREAKUP IN PERCENTAGE (%) (OUT OF 5% OF THE TOTAL FUND ALLOCATION)
(Value in %)
Particulars 1st yr 2nd yr 3rd yr 4th yr 5th Year Total
1 IEC
1.1 Mass Meeting 2.00000 0.00000 1.52000 1.00000 0.000000 4.52000
1.2 Awareness Meeting 1.50000 4.64000 0.00000 0.00000 0.000000 6.14000
1.3 Publicity Materials 2.00000 6.00000 0.00000 0.00000 0.000000 8.00000
sub-total 5.50 10.64 1.52 1.00 0.000000 18.66
2 Institutional Building
2.1
WC Formation & Registration, etc. 0.5000 1.5000 0.0000 0.0000 0.000000 2.0000
2.2 UG Formation 0.0000 0.3000 0.2500 0.1800 0.070000 0.8000
2.3 SHG Formation 0.0000 0.2000 0.6700 0.3000 0.250000 1.4200
sub-total 0.50 2.00 0.92 0.48 0.320000 4.22
3 Capacity Building 0.00 0.00 0.00 0.00 0.0000
3.1 Training (DWDU) 2.00 2.00 0.00 0.00 0.000000 4.0000
3.2 Training ( PIA& WDT) 2.00 3.00 1.80 1.86 0.000000 8.6600
3.3 Training (WC) 0.00 3.50 2.36 0.00 0.000000 5.8600
3.4 Training (UG) 0.00 3.50 3.20 2.20 1.680000 10.5800
3.5 Training (SHG) 0.00 3.50 3.20 2.50 2.160000 11.3600
3.6
Exposure Visit (Farmers/WC Members) 0.00 5.00 2.50 3.00 1.520000 12.0200
3.7
Exposure Visit (Officers/PRI) 0.00 3.00 2.50 4.00 2.860000 12.3600
3.8 Participation in Exhibition 0.00 3.00 2.00 1.66 1.460000 8.1200
3.9 Seminer & Workshop 0.00 0.86 0.00 3.30 0.000000 4.1600
sub-total 4.00 27.36 17.56 18.52 9.680000 77.1200
Total 10.00 40.00 20.00 20.00 10.00000
0 100.000
0
Page 70
67
COST OF CAPACITY BUILDING COMPONENT WISE BREAKUP IN LAKH RS. (OUT OF 5% OF THE TOTAL FUND ALLOCATION)
(Value in %)
Particulars 1st yr 2nd yr 3rd yr 4th yr 5th Yr Total
1 IEC
1.1 Mass Meeting 0.46 0.00 0.35 0.23 0.00 1.04
1.2 Awareness Meeting 0.35 1.07 0.00 0.00 0.00 1.42
1.3 Publicity Materials 0.46 1.39 0.00 0.00 0.00 1.85
sub-total 1.27 2.46 0.35 0.23 0.00 4.31
2 Institutional Building 0.00 0.00 0.00 0.00 0.00 0.00
2.1
WC Formation & Registration, etc. 0.12 0.35 0.00 0.00 0.00 0.46
2.2 UG Formation 0.00 0.07 0.06 0.04 0.02 0.18
2.3 SHG Formation 0.00 0.05 0.15 0.07 0.06 0.33
sub-total 0.12 0.46 0.21 0.11 0.07 0.97
3 Capacity Building 0.00 0.00 0.00 0.00 0.00 0.00
3.1 Training (DWDU) 0.46 0.46 0.00 0.00 0.00 0.92
3.2 Training ( PIA& WDT) 0.46 0.69 0.42 0.43 0.00 2.00
3.3 Training (WC) 0.00 0.81 0.55 0.00 0.00 1.35
3.4 Training (UG) 0.00 0.81 0.74 0.51 0.39 2.44
3.5 Training (SHG) 0.00 0.81 0.74 0.58 0.50 2.62
3.6
Exposure Visit (Farmers/WC Members) 0.00 1.16 0.58 0.69 0.35 2.78
3.7
Exposure Visit (Officers/PRI) 0.00 0.69 0.58 0.92 0.66 2.86
3.8 Participation in Exhibition 0.00 0.69 0.46 0.38 0.34 1.88
3.9 Seminer & Workshop 0.00 0.20 0.00 0.76 0.00 0.96
sub-total 0.92 6.32 4.06 4.28 2.24 17.81
Total 2.31 9.24 4.62 4.62 2.31 23.10
Page 71
68
Table No. 6.1 Details of Capacity Building
1 2 3 4 5 6 7 8 9 10 11
Sl. No.
Name of the Training & Exposure ( Knowledge, Skill, etc. at both Being and Doing level)
Number of events
Number of Participants in an event
Total Number of days per event
Total Traineedays (= 3 x 4 x 5)
Cost per Traineeday (in Rs)
Total Cost required for the programme (= 6 x7 ; in Rs.)
Total Grant Amount (in Rs)
Year of Implementation (1st/2nd/3rd/4th/5th)
Monitoring Indicators
TRAINING
1 DWDU 1 60 1 60 1570.00 94200.00 94200.00 1st Year
2 PIA/WDT 3 20 2 120 1666.67 200000.40 200000.40 1st Year, 2nd Year, 4th Year
3 WC/SHG/UG 9 40 2 720 888.89 640000.80 640000.80 1st, 2nd, 3rd, 4th Year
Subtotal 13 120 5 900 4125.56 934201.20 934201.20
EXPOSURE VISIT
1 Farmers/ WC Members 3 20 4 240 1156.93 277662.00 277662.00 1st Year, 3rd Year, 4th Year
2 PIA/WDT 3 15 4 180 1586.20 285516.00 285516.00 1st Year, 3rd Year, 4th Year
Subtotal 6 35 8 420 2743.13 563178.00 563178.00
PARTICIPATION IN EXHIBITION
1 SHG/UG 3 10 4 120 1563.10 187572.00 187572.00 2nd Year, 3rd Year, 4th Year
Subtotal 3 10 4 120 1563.10 187572.00 187572.00
SEMINER & WORKSHOP
1 Seminer & Workshop 2 100 1 200 480.48 96096.00 96096.00 2nd Year, 4th Year
Subtotal 2 100 1 200 480.48 96096.00 96096.00
GRAND TOTAL 24 265 18 1640 8912.265 1781047.2 1781047.2
Page 72
69
CHAPTER 7
PHASING OF PROGRAMME AND BUDGETING
Table No. 7.1: Phasing of the action plan
1 2 3 4 5 6 7 8 9 10 11
S.No
Component
Activities
Unit
Unit Cost
1 year 2nd year 3rd year 4th year 5th year Total
(Rs.) Phy (No)
Fin (Rs.) Phy (No)
Fin (Rs.) Phy (No)
Fin (Rs.) Phy (No)
Fin (Rs.) Phy (No)
Fin (Rs.) Phy (No) Fin (Rs.)
1 Entry Point Activities (4%)
i
Construction of Hume Pipe Culvert
No. 6 500000 6 500000
ii
Development of Community Pond
No. 3 510000 3 510000
iii
Ipomiya Eradication
Hec 14.59 240000 14.59 240000
iv
Development of Village Road
No 4 600000 4 600000
v - - 0
Sub Total of Entry Point Activity
1850000 0 0 0 0 0 0 0 0 1850000
Page 73
70
2 Institution & Capacity Building (5%)
i)
Poor HHs in Watersheds to be covered under SHGs
SC No. 50
ST No. 89
BC No. 42
OT No. 72
ii)
Awareness Generation (events) to be conducted
253
Publicity Material No. - - 46200.00 0.00 138600.00 0.00 0.00 0.00 0.00 0.00 0.00 - 184800
Awareness Meeting
No. - - 34650 0 107184 0 0 0 0 0 0 141834
Mass Meeting No. 46200 0 0 0 35112 0 23100 0 0 104412
iv) Formation of UGs No. 0 0 6930 0 5775 0 4158 0 1617 18480
No. of women No. 0
No. of men No. 0
v)
Formation of SHGs
No. - 0 0 4620 0 15477 0 6930 0 5775 32802
No. of women No. 0
No. of men No. 0
vi)
Formation of Watershed Committee
No. - 11550.00 0.00 34650.00 0.00 0.00 0.00 0.00 0.00 0.00 - 46200
No. of women No. 0
No. of men No. 0
Page 74
71
vii)
Regular Meetings to be conducted
0
Watershed Committee
No. 0
UGs/LGs No. 0
VO/SHGs No. 0
Gram Panchayat No. 0
viii)
No. of Planning events
No. 0
ix) Registration of WC No. 0
x)
Self Monitoring events (planning, review of activities through tool)
No.
0
xi)
Convergence meetings with LDs/other institutions
No.
0
xii) Social Audit events No. 0
xiii)
Trainings & Exposures
0
a) DWDU No.Trgs - - 46200.00 0.00 46200.00 0.00 0.00 0.00 0.00 0.00 0.00 - 92400
Women No. 0
Men No. 0
b) PIA/WDT No. trgs - - 46200.00 0.00 69300.00 0.00 41580.00 0.00 42966.00 0.00 0.00 200046
Women No. 0
Men No. 0
c) WC/SHG/UG No. trgs - - 0.00 0.00 242550.00 0.00 202356.00 0.00 108570.00 0.00 88704.00 - 642180
Women No. 0
Men No. 0
Page 75
72
d)
Exposure Visits of Farmers/WC Members
Nos - - 0.00 0.00 115500.00 0.00 57750.00 0.00 69300.00 0.00 35112.00 277662
Women No. 0
Men No. 0
e)
Exposure Visits of PIA/WDT Member
No. trgs 0.00 0.00 69300.00 0.00 57750.00 0.00 92400.00 0.00 66066.00 285516
Women No. 0
Men No. 0
f)
Participation in Exhibition
Nos - - 0 0 69300 0 46200 0 38346 0 33726 187572
Women No. 0
Men No. 0
g) Seminer/Workshop Nos - - 0 0 19866 0 0 0 76230 0 0 96096
Women No. 0
Men No. 0
Sub Total IB & CB {Do not sum Men & Women under CB events
(a to f)}[1]
231000 0 924000 0 462000 0 462000 0 231000 506 2310000
3 Productivity Enhancement (13%)
A) Agriculture
(Improved practices)
i)
Turmeric cultivation
Bigha 19800 0 0 0.00 0 0 0 5.85 115830 3.3 65340 9.15 181170
ii) Ginger Cultivation Bigha 21000 0 0 0 0 7 147000 0 0 0 0 7.00 147000
iii) Vermi Composting No 61675 0 0 0 0 10 616750 0 0 1 61675 11.00 678425
iv)
Horticulture Nursery
Hec 358000 0 0 0 0 0 0 0 0 1.12 400960 1.12 400960
Page 76
73
B)
Animal Husbandry
i) Goatery No. 6667 0 0 2 13334 40 266680 0 0 43 286681 85.00 566695
ii) Dairy No. 135000 0 0 0 0 0 0 6 810000 0 0 6.00 810000
iii) Piggery No 120000 0 0 0 0 0 0 3 360000 0 0 3.00 360000
C) Fisheries
Fisheries No. 88700 0 0 5 443500 4 354800 0 0 2 177400 11.00 975700
D) OTHERS
Weaving Centre No. 50000 0 0 0 0 0 0 2 100000 8 400000 10.00 500000
E)
No. of para workers to be positioned
No.
Women No.
Men No.
F) Revolving Fund Rs.
Sub-Total PE 0 456834 1385230 1385830 1392056 4619950
4 Enterprise Promotion (10%)
i) Dairy No 135000 0 0 0 0 10 1350000 0 0 2 270000 12.00 1620000
ii) Weaving Centre No 50000 0 0 0 0 0 0 3 150000 0 0 3.00 150000
iii) Goatery No 6667 0 0 35 233345 6 40002 12 80004 36 240012 89.00 593363
iv) Piggery No 120000 0 0 0 0 0 0 4 480000 0 0 4.00 480000
v) Duckery No 12000 0 0 19 228000 0 0 23 276000 0 0 42.00 504000
vi) Poultry No 10000 0 0 0 0 0 0 0 0 25 250000 25.00 250000
vii)
Bicycle Repairing Unit
No 40000
0 0 0 0 0 0 10 400000 0 0 10.00 400000
viii) Mobile Repairing No 40000 0 0 0 0 0 0 0 0 4 160000 4.00 160000
Page 77
74
i)
EP RF to be released
Rs.
ii)
No. of candidates trained under skill development
No.
Women No.
Men No.
Sub-Total EP 0 461345 1390002 1386004 920012 4157363
5 Natural Resource Management (50%)
I) WHS (MI Works)
a Drainage Channel RM 355 0 0 8794 3121870 15700 5573500 0 0 0 0 24494.00 8695370
b
Ipomiya Eradication Hec 16540
0 0 0 0 60 992400 0 0 0 0 60.00 992400
c Pond NO 96000 0 0 3 288000 1 96000 4 384000 2 192000 10.00 960000
II
Soil Moisture Conservation (SMC)
a Field Bund RM 120 0 0 0 0 6700 804000 0 0 44600 5352000 51300.00 6156000
d) Slab Culvert No 84500 0 0 0 0 6 507000 0 0 0 0 6.00 507000
e Brick Canal RM 680 0 0 0 0 730 496400 0 0 0 0 730.00 496400
f) Sluice Gate No 1020000 0 0 0 0 1 1020000 4 4080000 1 1020000 6.00 6120000
III
Vegetative Measures
a Agro Forestry HEC 116000 0 0 0.47 54520 1.03 119480 1.2 139200 4.2 487200 6.90 800400
b
Road Side Plantation No 1800
0 0 0 0 52 93600 138 248400 83 149400 273.00 491400
c Fuel Wood HEC 27200 0 0 0 0 0 0 0 0 24 652800 24.00 652800
Sub Total NRM: 0 3464390 9702380 4851600 7853400 25871770
Grand Total (sum of all sub-totals 1 to 6) 2081000 5306569 12939612 8085434 10396468 38809083
Page 78
75
1 2 3 4 5 6 7 8 9 10 11
S.No
Component
Activities
Unit
Unit Cost
1 year 2nd year 3rd year 4th year 5th year 6th year Total
(Rs.) Phy (No)
Fin (Rs.) Phy (No)
Fin (Rs.) Phy (No)
Fin (Rs.) Phy (No)
Fin (Rs.) Phy (No)
Fin (Rs.) Phy (No)
Fin (Rs.) Phy (No)
Fin (Rs.)
6 Administration (10%)
a
WC office expenditure (per office)
Rs. 12000 4 48000 4 48000 4 48000 4 48000 4 48000 4 48000 24 288000
b
WS secretary Salary
Rs 48000 4 192000 4 192000 4 192000 4 192000 4 192000 4 192000 20 1152000
c
Stationary & miscillaneous
Rs. - 222000 - 222000 684000 684000 684000 684000 - 3180000
Sub Total Admin 60000 8 462000 8 462000 8 924000 8 924000 8 924000 8 924000 44 4620000
7 Monitoring Cost (1%)
a Monitoring Rs. - - - 231000 - - 115500 0 0
115500 462000
Sub Total Monitoring 0 0 0 0 231000 0 0 0 115500 0 0 0 115500 0 462000
8 Evaluation (1%)
a Evaluation Rs. - - - 231000 - - 115500 0 0
115500 462000
Sub Total Evaluation 0 0 0 0 231000 0 0 0 115500 0 0 0 115500 0 462000
9 DPR (1%)
a
DPR Preparation
Rs. - - 231000 - 231000 - 0 - 0 - 0 462000
Sub Total DPR 0 0 231000 0 231000 0 0 0 0 0 0 0 0 0 462000
10 Consolidation (3%)
a Consolidation Rs. - - 0 - 0 - 0 - 0 - 1386000 1386000
Sub Total Consolidation 0 0 0 0 0 0 0 0 0 0 1386000 0 0 0 1386000
SUB Total (sum of all sub-totals6to 10) 693000 1155000 924000 1155000 2310000 1155000 7392000
GRAND TOTAL
2774000 6461569 13863612 9240434 12706468 1155000 46201083
Page 79
76
VILLAGE & MICRO-WATERSHED WISE BUDGETING FOR WATERSHED WORK PHASE (56%)
Name of Micro Watershed Salaguri MWS
Name of Village Salaguri Gaon
Activities Related to Surface Water Treatment (Rs. In Lakh)
Name of Intervention Unit Rate (in INR) TOTAL
2nd Year 3rd Year 4th Year 5th Year
Phy Fin Phy Fin Phy Fin Phy Fin Phy Fin
Drainage Channel RM 355 2844 10.10 2844 10.10 0 0.00 0 0.00 0 0.00
Details of engineering structures in watershed works for Ridge Area, Drainage Line & Land Development
Field Bund RM 120 1700 2.04 0 0.00 0 0.00 0 0.00 1700 2.04
Sluice Gate RM 1020000 1 10.20 0 0.00 0 0.00 1 10.20 0 0.00
Details of activities connected with vegetative cover in watershed works*
Road Side Plantaton NO 1800 15 0.27 0 0.00 0 0.00 0 0.00 15 0.27
Agro Forestry HEC 116000 0.6 0.70 0 0.00 0.3 0.35 0.3 0.35 0 0.00
Fuel Wood HEC 27200 1.0 0.27 0 0.00 0 0.00 0 0.00 1 0.27
Name of Micro Watershed Salaguri MWS
Name of Village Lohong Bebejia
Activities Related to Surface Water Treatment (Rs. In Lakh)
Name of Intervention Unit Rate (in INR) TOTAL 2nd Year 3rd Year 4th Year 5th Year
Phy Fin Phy Fin Phy Fin Phy Fin Phy Fin
Drainage Channel RM 355 2250 7.99 2250 7.99 0 0.00 0 0.00 0 0.00
Pond NO 96000 2 1.92 0 0.00 1 0.96 1 0.96 0 0.00
Page 80
77
Details of engineering structures in watershed works for Ridge Area, Drainage Line & Land Development
Field Bund RM 120 6800 8.16 0 0.00 0 0.00 0 0.00 6800 8.16
Brick Canal RM 680 730 4.96 0 0.00 730 4.96 0 0.00 0 0.00
Details of activities connected with vegetative cover in watershed works*
Road Side Plantaton NO 1800 20 0.36 0 0.00 0 0.00 0 0.00 20 0.36
Agro Forestry HEC 116000 0.3 0.35 0 0.00 0 0.00 0 0.00 0.3 0.35
Fuel Wood HEC 27200 1.0 0.27 0 0.00 0 0.00 0 0.00 1 0.27
Name of Micro Watershed Salaguri MWS
Name of Village Madhapur No.1
Activities Related to Surface Water Treatment (Rs. In Lakh)
Name of Intervention Unit Rate (in INR) TOTAL 2nd Year 3rd Year 4th Year 5th Year
Phy Fin Phy Fin Phy Fin Phy Fin Phy Fin
Drainage Channel RM 355 2300 8.17 2300 8.17 0 0.00 0 0.00 0 0.00
Details of engineering structures in watershed works for Ridge Area, Drainage Line & Land Development
Field Bund RM 120 3400 4.08 0 0.00 0 0.00 0 0.00 3400 4.08
Details of activities connected with vegetative cover in watershed works*
Road Side Plantaton NO 1800 15 0.27 0 0.00 0 0.00 0 0.00 15 0.27
Agro Forestry HEC 116000 0.3 0.35 0 0.00 0 0.00 0 0.00 0.3 0.35
Fuel Wood HEC 27200 1.0 0.27 0 0.00 0 0.00 0 0.00 1 0.27
Page 81
78
Name of Micro Watershed Saidal – Turung MWS
Name of Village Saidal Kachari Gaon
Activities Related to Surface Water Treatment (Rs. In Lakh)
Name of Intervention Unit Rate (in INR) TOTAL 2nd Year 3rd Year 4th Year 5th Year
Phy Fin Phy Fin Phy Fin Phy Fin Phy Fin
Drainage Channel RM 355 4000 14.20 0 0.00 4000 14.20 0 0.00 0 0.00
Eradication of Ipomea HEC 16540 60 9.92 0 0.00 60 9.92 0 0.00 0 0.00
Details of engineering structures in watershed works for Ridge Area, Drainage Line & Land Development
Field Bund RM 120 4150 4.98 0 0.00 0 0.00 0 0.00 4150 4.98
Sluice Gate RM 1020000 1 10.20 0 0.00 0 0.00 1 10.20 0 0.00
Details of activities connected with vegetative cover in watershed works*
Road Side Plantaton NO 1800 20 0.36 0 0.00 0 0.00 7 0.13 13 0.23
Agro Forestry HEC 116000 0.6 0.70 0 0.00 0 0.00 0 0.00 0.6 0.70
Fuel Wood HEC 27200 2.0 0.54 0 0.00 0 0.00 0 0.00 2 0.54
Name of Micro Watershed Saidal – Turung MWS
Name of Village Tipomea Gaon
Activities Related to Surface Water Treatment (Rs. In Lakh)
Name of Intervention Unit Rate (in INR) TOTAL 2nd Year 3rd Year 4th Year 5th Year
Phy Fin Phy Fin Phy Fin Phy Fin Phy Fin
Drainage Channel RM 355 1400 4.97 1400 4.97 0 0.00 0 0.00 0 0.00
Pond NO 96000 2 1.92 0 0.00 0 0.00 0 0.00 2 1.92
Page 82
79
Details of engineering structures in watershed works for Ridge Area, Drainage Line & Land Development
Field Bund RM 120 4200 5.04 0 0.00 0 0.00 0 0.00 4200 5.04
Details of activities connected with vegetative cover in watershed works*
Road Side Plantaton NO 1800 17 0.31 0 0.00 17 0.31 0 0.00 0 0.00
Agro Forestry HEC 116000 0.6 0.70 0 0.00 0.3 0.35 0.3 0.35 0 0.00
Fuel Wood HEC 27200 1.0 0.27 0 0.00 0 0.00 0 0.00 1 0.27
Name of Micro Watershed Saidal – Turung MWS
Name of Village Turung Gaon
Activities Related to Surface Water Treatment (Rs. In Lakh)
Name of Intervention Unit Rate (in INR) TOTAL 2nd Year 3rd Year 4th Year 5th Year
Phy Fin Phy Fin Phy Fin Phy Fin Phy Fin
Drainage Channel RM 355 1400 4.97 0 0.00 1400 4.97 0 0.00 0 0.00
Details of engineering structures in watershed works for Ridge Area, Drainage Line & Land Development
Field Bund RM 120 4200 5.04 0 0.00 0 0.00 0 0.00 4200 5.04
Sluice Gate RM 1020000 1 10.20 0 0.00 0 0.00 1 10.20 0 0.00
Details of activities connected with vegetative cover in watershed works*
Road Side Plantaton NO 1800 15 0.27 0 0.00 15 0.27 0 0.00 0 0.00
Agro Forestry HEC 116000 0.3 0.35 0 0.00 0 0.00 0 0.00 0.3 0.35
Fuel Wood HEC 27200 1.0 0.27 0 0.00 0 0.00 0 0.00 1 0.27
Page 83
80
Name of Micro Watershed Dangdhara –Mohimabari MWS
Name of Village Christian Gaon
Activities Related to Surface Water Treatment (Rs. In Lakh)
Name of Intervention Unit Rate (in INR) TOTAL 2nd Year 3rd Year 4th Year 5th Year
Phy Fin Phy Fin Phy Fin Phy Fin Phy Fin
Drainage Channel RM 355 1200 4.26 0 0.00 1200 4.26 0 0.00 0 0.00
Details of engineering structures in watershed works for Ridge Area, Drainage Line & Land Development
Field Bund RM 120 3400 4.08 0 0.00 3400 4.08 0 0.00 0 0.00
Sluice Gate RM 1020000 1 10.20 0 0.00 0 0.00 1 10.20 0 0.00
Details of activities connected with vegetative cover in watershed works*
Road Side Plantaton NO 1800 10 0.18 0 0.00 0 0.00 0 0.00 10 0.18
Agro Forestry HEC 116000 0.3 0.35 0 0.00 0 0.00 0 0.00 0.3 0.35
Fuel Wood HEC 27200 1.0 0.27 0 0.00 0 0.00 0 0.00 1 0.27
Name of Micro Watershed Dangdhara –Mohimabari MWS
Name of Village Madhapur No.2
Activities Related to Surface Water Treatment (Rs. In Lakh)
Name of Intervention Unit Rate (in INR) TOTAL 2nd Year 3rd Year 4th Year 5th Year
Phy Fin Phy Fin Phy Fin Phy Fin Phy Fin
Details of engineering structures in watershed works for Ridge Area, Drainage Line & Land Development
Field Bund RM 120 1700 2.04 0 0.00 0 0.00 0 0.00 1700 2.04
Page 84
81
Details of activities connected with vegetative cover in watershed works*
Agro Forestry HEC 116000 0.3 0.35 0 0.00 0 0.00 0 0.00 0.3 0.35
Fuel Wood HEC 27200 2.0 0.54 0 0.00 0 0.00 0 0.00 2 0.54
Name of Micro Watershed Dangdhara –Mohimabari MWS
Name of Village Kachari Gaon
Activities Related to Surface Water Treatment (Rs. In Lakh)
Name of Intervention Unit Rate (in INR) TOTAL 2nd Year 3rd Year 4th Year 5th Year
Phy Fin Phy Fin Phy Fin Phy Fin Phy Fin
Details of engineering structures in watershed works for Ridge Area, Drainage Line & Land Development
Field Bund RM 120 850 1.02 0 0.00 0 0.00 0 0.00 850 1.02
Details of activities connected with vegetative cover in watershed works*
Road Side Plantaton NO 1800 20 0.36 0 0.00 0 0.00 10 0.18 10 0.18
Agro Forestry HEC 116000 0.6 0.70 0 0.00 0 0.00 0 0.00 0.6 0.70
Fuel Wood HEC 27200 1.0 0.27 0 0.00 0 0.00 0 0.00 1 0.27
Name of Micro Watershed Dangdhara –Mohimabari MWS
Name of Village Charaipani Bongali Gaon
Activities Related to Surface Water Treatment (Rs. In Lakh)
Name of Intervention Unit Rate (in INR) TOTAL 2nd Year 3rd Year 4th Year 5th Year
Phy Fin Phy Fin Phy Fin Phy Fin Phy Fin
Drainage Channel RM 355 1200 4.26 0 0.00 1200 4.26 0 0.00 0 0.00
Page 85
82
Details of engineering structures in watershed works for Ridge Area, Drainage Line & Land Development
Field Bund RM 120 1700 2.04 0 0.00 0 0.00 0 0.00 1700 2.04
Details of activities connected with vegetative cover in watershed works*
Road Side Plantaton NO 1800 10 0.18 0 0.00 0 0.00 10 0.18 0 0.00
Agro Forestry HEC 116000 0.3 0.35 0 0.00 0 0.00 0 0.00 0.3 0.35
Fuel Wood HEC 27200 1.0 0.27 0 0.00 0 0.00 0 0.00 1 0.27
Name of Micro Watershed Dangdhara –Mohimabari MWS
Name of Village Dangdhara
Activities Related to Surface Water Treatment (Rs. In Lakh)
Name of Intervention Unit Rate (in INR) TOTAL 2nd Year 3rd Year 4th Year 5th Year
Phy Fin Phy Fin Phy Fin Phy Fin Phy Fin
Drainage Channel RM 355 1400 4.97 0 0.00 1400 4.97 0 0.00 0 0.00
Details of engineering structures in watershed works for Ridge Area, Drainage Line & Land Development
Field Bund RM 120 3300 3.96 0 0.00 0 0.00 0 0.00 3300 3.96
Details of activities connected with vegetative cover in watershed works*
Agro Forestry HEC 116000 0.6 0.70 0 0.00 0 0.00 0 0.00 0.6 0.70
Fuel Wood HEC 27200 1.0 0.27 0 0.00 0 0.00 0 0.00 1 0.27
Page 86
83
Name of Micro Watershed Dangdhara –Mohimabari MWS
Name of Village Mohimabari Gaon
Activities Related to Surface Water Treatment (Rs. In Lakh)
Name of Intervention Unit Rate (in INR) TOTAL 2nd Year 3rd Year 4th Year 5th Year
Phy Fin Phy Fin Phy Fin Phy Fin Phy Fin
Pond NO 96000 2 1.92 1 0.96 0 0.00 1 0.96 0 0.00
Details of engineering structures in watershed works for Ridge Area, Drainage Line & Land Development
Field Bund RM 120 3300 3.96 0 0.00 3300 3.96 0 0.00 0 0.00
Details of activities connected with vegetative cover in watershed works*
Road Side Plantaton NO 1800 20 0.36 0 0.00 20 0.36 0 0.00 0 0.00
Agro Forestry HEC 116000 0.3 0.35 0 0.00 0 0.00 0 0.00 0.3 0.35
Fuel Wood HEC 27200 1.0 0.27 0 0.00 0 0.00 0 0.00 1 0.27
Name of Micro Watershed Phulbari -Tengajan MWS
Name of Village Medeluajan Gaon
Activities Related to Surface Water Treatment (Rs. In Lakh)
Name of Intervention Unit Rate (in INR) TOTAL 2nd Year 3rd Year 4th Year 5th Year
Phy Fin Phy Fin Phy Fin Phy Fin Phy Fin
Details of engineering structures in watershed works for Ridge Area, Drainage Line & Land Development
Field Bund RM 120 4200 5.04 0 0.00 0 0.00 0 0.00 4200 5.04
Page 87
84
Details of activities connected with vegetative cover in watershed works*
Road Side Plantaton NO 1800 30 0.54 0 0.00 0 0.00 30 0.54 0 0.00
Agro Forestry HEC 116000 0.3 0.35 0 0.00 0 0.00 0 0.00 0.3 0.35
Fuel Wood HEC 27200 3.0 0.82 0 0.00 0 0.00 0 0.00 3 0.82
Name of Micro Watershed Phulbari -Tengajan MWS
Name of Village Tengajan Gaon
Activities Related to Surface Water Treatment (Rs. In Lakh)
Name of Intervention Unit Rate (in INR) TOTAL 2nd Year 3rd Year 4th Year 5th Year
Phy Fin Phy Fin Phy Fin Phy Fin Phy Fin
Drainage Channel RM 355 2300 8.17 0 0.00 2300 8.17 0 0.00 0 0.00
Pond NO 96000 2 1.92 1 0.96 0 0.00 1 0.96 0 0.00
Details of engineering structures in watershed works for Ridge Area, Drainage Line & Land Development
Sluice Gate RM 1020000 1 10.20 0 0.00 0 0.00 0 0.00 1 10.20
Details of activities connected with vegetative cover in watershed works*
Road Side Plantaton NO 1800 20 0.36 0 0.00 0 0.00 20 0.36 0 0.00
Agro Forestry HEC 116000 0.3 0.35 0 0.00 0 0.00 0.3 0.35 0 0.00
Fuel Wood HEC 27200 1.0 0.27 0 0.00 0 0.00 0 0.00 1 0.27
Page 88
85
Name of Micro Watershed Phulbari -Tengajan MWS
Name of Village Phulbari Gaon
Activities Related to Surface Water Treatment (Rs. In Lakh)
Name of Intervention Unit Rate (in INR) TOTAL 2nd Year 3rd Year 4th Year 5th Year
Phy Fin Phy Fin Phy Fin Phy Fin Phy Fin
Drainage Channel RM 355 1150 4.08 0 0.00 1150 4.08 0 0.00 0 0.00
Pond NO 96000 2 1.92 1 0.96 0 0.00 1 0.96 0 0.00
Details of engineering structures in watershed works for Ridge Area, Drainage Line & Land Development
Field Bund RM 120 4200 5.04 0 0.00 0 0.00 0 0.00 4200 5.04
Sluice Gate RM 1020000 1 10.20 0 0.00 1 10.20 0 0.00 0 0.00
Details of activities connected with vegetative cover in watershed works*
Road Side Plantaton NO 1800 20 0.36 0 0.00 0 0.00 20 0.36 0 0.00
Agro Forestry HEC 116000 0.3 0.35 0 0.00 0 0.00 0.3 0.35 0 0.00
Fuel Wood HEC 27200 2.0 0.54 0 0.00 0 0.00 0 0.00 2 0.54
Name of Micro Watershed Phulbari -Tengajan MWS
Name of Village Tipomea Habi Gaon
Activities Related to Surface Water Treatment (Rs. In Lakh)
Name of Intervention Unit Rate (in INR) TOTAL 2nd Year 3rd Year 4th Year 5th Year
Phy Fin Phy Fin Phy Fin Phy Fin Phy Fin
Details of engineering structures in watershed works for Ridge Area, Drainage Line & Land Development
Field Bund RM 120 4200 5.04 0 0.00 0 0.00 0 0.00 4200 5.04
Slab Culvert NO 84500 6 5.07 0 0.00 6 5.07 0 0.00 0 0.00
Page 89
86
Details of activities connected with vegetative cover in watershed works*
Agro Forestry HEC 116000 0.6 0.70 0.17 0.20 0.43 0.50 0 0.00 0 0.00
Fuel Wood HEC 27200 2.0 0.54 0 0.00 0 0.00 0 0.00 2 0.54
Name of Micro Watershed Phulbari -Tengajan MWS
Name of Village Bhagyalakhi gaon
Activities Related to Surface Water Treatment (Rs. In Lakh)
Name of Intervention Unit Rate (in INR) TOTAL 2nd Year 3rd Year 4th Year 5th Year
Phy Fin Phy Fin Phy Fin Phy Fin Phy Fin
Drainage Channel RM 355 1100 3.91 0 0.00 1100 3.91 0 0.00 0 0.00
Details of activities connected with vegetative cover in watershed works*
Road Side Plantaton NO 1800 20 0.36 0 0.00 0 0.00 20 0.36 0 0.00
Agro Forestry HEC 116000 0.3 0.35 0.3 0.35 0 0.00 0 0.00 0 0.00
Fuel Wood HEC 27200 2.0 0.54 0 0.00 0 0.00 0 0.00 2 0.54
Name of Micro Watershed Phulbari -Tengajan MWS
Name of Village Grant No.188
Activities Related to Surface Water Treatment (Rs. In Lakh)
Name of Intervention Unit Rate (in INR) TOTAL 2nd Year 3rd Year 4th Year 5th Year
Phy Fin Phy Fin Phy Fin Phy Fin Phy Fin
Details of activities connected with vegetative cover in watershed works*
Road Side Plantaton NO 1800 21 0.38 0 0.00 0 0.00 21 0.38 0 0.00
Page 90
87
Name of Micro Watershed Phulbari -Tengajan MWS
Name of Village Charaipani Grant No.1
Activities Related to Surface Water Treatment (Rs. In Lakh)
Name of Intervention Unit Rate (in INR) TOTAL 2nd Year 3rd Year 4th Year 5th Year
Phy Fin Phy Fin Phy Fin Phy Fin Phy Fin
Drainage Channel RM 355 1950 6.92 0 0.00 1950 6.92 0 0.00 0 0.00
Page 91
88
VILLAGE & MICRO-WATERSHED WISE BUDGETING FOR PRODUCTION SYSTEM & MICRO ENTERPRISE (10%)
Name of Micro Watershed Salaguri MWS
Name of Village Salaguri Gaon
Details of allied / other activities (Rs. In Lakh)
Name of Intervention Unit Rate (in INR) TOTAL 2nd Year 3rd Year 4th Year 5th Year
Phy Fin Phy Fin Phy Fin Phy Fin Phy Fin
Fishery NO 88700 1 0.89 1 0.89 0 0.00 0 0.00 0 0.00
Goatery NO 6667 7 0.47 0 0.00 2 0.13 0 0.00 5 0.33
Weaving Centre NO 50000 1 0.50 0 0.00 0 0.00 0 0.00 1 0.50
Livelihood Proposed to be Created for Farmers 0
Turmeric Cultivation Bigha 19800 1.15 0.23 0 0.00 0 0.00 0.85 0.17 0.3 0.06
Ginger Cultivation Bigha 21000 1 0.21 0 0.00 1 0.21 0 0.00 0 0.00
Horticulture Nursery Bigha 358000 0.14 0.50 0 0.00 0 0.00 0 0.00 0.14 0.50
Vermi Composting No 61675 1 0.62 0 0.00 1 0.62 0 0.00 0 0.00
Name of Micro Watershed Salaguri MWS
Name of Village Lohong Bebejia
Details of allied / other activities (Rs. In Lakh)
Name of Intervention Unit Rate (in INR) TOTAL 2nd Year 3rd Year 4th Year 5th Year
Phy Fin Phy Fin Phy Fin Phy Fin Phy Fin
Fishery NO 88700 1 0.89 0 0.00 1 0.89 0 0.00 0 0.00
Goatery NO 6667 8 0.53 0 0.00 2 0.13 0 0.00 6 0.40
Dairy NO 135000 1 1.35 0 0.00 0 0.00 1 1.35 0 0.00
Livelihood Proposed to be Created for Farmers
Turmeric Cultivation Bigha 19800 1 0.20 0 0.00 0 0.00 1 0.20 0 0.00
Vermi Composting No 61675 1 0.62 0 0.00 1 0.62 0 0.00 0 0.00
Page 92
89
Name of Micro Watershed Salaguri MWS
Name of Village Madhapur Grant No.1
Details of allied / other activities (Rs. In Lakh)
Name of Intervention Unit Rate (in INR) TOTAL 2nd Year 3rd Year 4th Year 5th Year
Phy Fin Phy Fin Phy Fin Phy Fin Phy Fin
Fishery NO 88700 1 0.89 1 0.89 0 0.00 0 0.00 0 0.00
Goatery NO 6667 7 0.47 0 0.00 2 0.13 0 0.00 5 0.33
Weaving Centre NO 50000 1 0.50 0 0.00 0 0.00 0 0.00 1 0.50
Livelihood Proposed to be Created for Farmers
Turmeric Cultivation Bigha 19800 1 0.20 0 0.00 0 0.00 0 0.00 1 0.20
Ginger Cultivation Bigha 21000 1 0.21 0 0.00 1 0.21 0 0.00 0 0.00
Horticulture Nursery Bigha 358000 0.14 0.50 0 0.00 0 0.00 0 0.00 0.14 0.50
Vermi Composting No 61675 1 0.62 0 0.00 1 0.62 0 0.00 0 0.00
Name of Micro Watershed Saidal – Turung MWS
Name of Village Saidal Kachari Gaon
Details of allied / other activities (Rs. In Lakh)
Name of Intervention Unit Rate (in INR) TOTAL 2nd Year 3rd Year 4th Year 5th Year
Phy Fin Phy Fin Phy Fin Phy Fin Phy Fin
Fishery NO 88700 1 0.89 0 0.00 1 0.89 0 0.00 0 0.00
Goatery NO 6667 8 0.53 0 0.00 2 0.13 0 0.00 6 0.40
Dairy NO 135000 1 1.35 0 0.00 0 0.00 1 1.35 0 0.00
Livelihood Proposed to be Created for Farmers
Turmeric Cultivation Bigha 19800 1 0.20 0 0.00 0 0.00 1 0.20 0 0.00
Ginger Cultivation Bigha 21000 1 0.21 0 0.00 1 0.21 0 0.00 0 0.00
Vermi Composting No 61675 1 0.62 0 0.00 1 0.62 0 0.00 0 0.00
Page 93
90
Name of Micro Watershed Saidal – Turung MWS
Name of Village Tipomea Gaon
Details of allied / other activities (Rs. In Lakh)
Name of Intervention Unit Rate (in INR) TOTAL 2nd Year 3rd Year 4th Year 5th Year
Phy Fin Phy Fin Phy Fin Phy Fin Phy Fin
Piggery NO 120000 1 1.20 0 0.00 0 0.00 1 1.20 0 0.00
Goatery NO 6667 7 0.47 0 0.00 2 0.13 0 0.00 5 0.33
Weaving Centre NO 50000 1 0.50 0 0.00 0 0.00 0 0.00 1 0.50
Livelihood Proposed to be Created for Farmers
Turmeric Cultivation Bigha 19800 1 0.20 0 0.00 0 0.00 0 0.00 1 0.20
Ginger Cultivation Bigha 21000 1 0.21 0 0.00 1 0.21 0 0.00 0 0.00
Horticulture Nursery Bigha 358000 0.14 0.50 0 0.00 0 0.00 0 0.00 0.14 0.50
Name of Micro Watershed Saidal – Turung MWS
Name of Village Turung Gaon
Details of allied / other activities (Rs. In Lakh)
Name of Intervention Unit Rate (in INR) TOTAL 2nd Year 3rd Year 4th Year 5th Year
Phy Fin Phy Fin Phy Fin Phy Fin Phy Fin
Fishery NO 88700 1 0.89 0 0.00 0 0.00 0 0.00 1 0.89
Goatery NO 6667 8 0.53 0 0.00 2 0.13 0 0.00 6 0.40
Weaving Centre NO 50000 1 0.50 0 0.00 0 0.00 1 0.50 0 0.00
Livelihood Proposed to be Created for Farmers
Turmeric Cultivation Bigha 19800 1 0.20 0 0.00 0 0.00 1 0.20 0 0.00
Ginger Cultivation Bigha 21000 1 0.21 0 0.00 1 0.21 0 0.00 0 0.00
Horticulture Nursery Bigha 358000 0.14 0.50 0 0.00 0 0.00 0 0.00 0.14 0.50
Vermi Composting No 61675 1 0.62 0 0.00 1 0.62 0 0.00 0 0.00
Page 94
91
Name of Micro Watershed Dangdhara –Mahimabari MWS
Name of Village Christian Gaon
Details of allied / other activities (Rs. In Lakh)
Name of Intervention Unit Rate (in INR) TOTAL 2nd Year 3rd Year 4th Year 5th Year
Phy Fin Phy Fin Phy Fin Phy Fin Phy Fin
Goatery NO 6667 3 0.20 0 0.00 3 0.20 0 0.00 0 0.00
Dairy NO 135000 1 1.35 0 0.00 0 0.00 1 1.35 0 0.00
Livelihood Proposed to be Created for Farmers
Horticulture Nursery Bigha 358000 0.14 0.50 0 0.00 0 0.00 0 0.00 0.14 0.50
Name of Micro Watershed Dangdhara –Mahimabari MWS
Name of Village Madhapur No.2
Details of allied / other activities (Rs. In Lakh)
Name of Intervention Unit Rate (in INR) TOTAL 2nd Year 3rd Year 4th Year 5th Year
Phy Fin Phy Fin Phy Fin Phy Fin Phy Fin
Fishery NO 88700 1 0.89 1 0.89 0 0.00 0 0.00 0 0.00
Goatery NO 6667 3 0.20 0 0.00 3 0.20 0 0.00 0 0.00
Weaving Centre NO 50000 1 0.50 0 0.00 0 0.00 0 0.00 1 0.50
Livelihood Proposed to be Created for Farmers
Vermi Composting No 61675 1 0.62 0 0.00 1 0.62 0 0.00 0 0.00
Name of Micro Watershed Dangdhara –Mahimabari MWS
Name of Village Kachari Gaon
Details of allied / other activities (Rs. In Lakh)
Name of Intervention Unit Rate (in INR) TOTAL 2nd Year 3rd Year 4th Year 5th Year
Phy Fin Phy Fin Phy Fin Phy Fin Phy Fin
Fishery NO 88700 1 0.89 0 0.00 1 0.89 0 0.00 0 0.00
Goatery NO 6667 3 0.20 0 0.00 3 0.20 0 0.00 0 0.00
Weaving Centre NO 50000 1 0.50 0 0.00 0 0.00 0 0.00 1 0.50
Livelihood Proposed to be Created for Farmers
Vermi Composting No 61675 1 0.62 0 0.00 1 0.62 0 0.00 0 0.00
Page 95
92
Name of Micro Watershed Dangdhara –Mahimabari MWS
Name of Village Charaipani Bongali Gaon
Details of allied / other activities (Rs. In Lakh)
Name of Intervention Unit Rate (in INR) TOTAL 2nd Year 3rd Year 4th Year 5th Year
Phy Fin Phy Fin Phy Fin Phy Fin Phy Fin
Piggery NO 120000 1 1.20 0 0.00 0 0.00 1 1.20 0 0.00
Goatery NO 6667 3 0.20 0 0.00 3 0.20 0 0.00 0 0.00
Weaving Centre NO 50000 1 0.50 0 0.00 0 0.00 0 0.00 1 0.50
Livelihood Proposed to be Created for Farmers
Vermi Composting No 61675 1 0.62 0 0.00 1 0.62 0 0.00 0 0.00
Name of Micro Watershed Dangdhara –Mahimabari MWS
Name of Village Dangdhara
Details of allied / other activities (Rs. In Lakh)
Name of Intervention Unit Rate (in INR) TOTAL 2nd Year 3rd Year 4th Year 5th Year
Phy Fin Phy Fin Phy Fin Phy Fin Phy Fin
Goatery NO 6667 4 0.27 0 0.00 2 0.13 0 0.00 2 0.13
Dairy NO 135000 1 1.35 0 0.00 0 0.00 1 1.35 0 0.00
Livelihood Proposed to be Created for Farmers
Horticulture Nursery Bigha 358000 0.14 0.50 0 0.00 0 0.00 0 0.00 0.14 0.50
Name of Micro Watershed Dangdhara –Mahimabari MWS
Name of Village Mohimabari
Details of allied / other activities (Rs. In Lakh)
Name of Intervention Unit Rate (in INR) TOTAL 2nd Year 3rd Year 4th Year 5th Year
Phy Fin Phy Fin Phy Fin Phy Fin Phy Fin
Fishery NO 88700 1 0.89 1 0.89 0 0.00 0 0.00 0 0.00
Goatery NO 6667 8 0.53 0 0.00 2 0.13 0 0.00 6 0.40
Livelihood Proposed to be Created for Farmers
Turmeric Cultivation Bigha 19800 1 0.20 0 0.00 0 0.00 0 0.00 1 0.20
Ginger Cultivation Bigha 21000 1 0.21 0 0.00 1 0.21 0 0.00 0 0.00
Page 96
93
Name of Micro Watershed Phulbari -Tengajan MWS
Name of Village Medeluajan
Details of allied / other activities (Rs. In Lakh)
Name of Intervention Unit Rate (in INR) TOTAL 2nd Year 3rd Year 4th Year 5th Year
Phy Fin Phy Fin Phy Fin Phy Fin Phy Fin
Fishery NO 88700 1 0.89 0 0.00 0 0.00 0 0.00 1 0.89
Goatery NO 6667 3 0.20 0 0.00 2 0.13 0 0.00 1 0.07
Weaving Centre NO 50000 1 0.50 0 0.00 0 0.00 1 0.50 0 0.00
Livelihood Proposed to be Created for Farmers
Vermi Composting No 61675 1 0.62 0 0.00 1 0.62 0 0.00 0 0.00
Name of Micro Watershed Phulbari -Tengajan MWS
Name of Village Tengajan Gaon
Details of allied / other activities (Rs. In Lakh)
Name of Intervention Unit Rate (in INR) TOTAL 2nd Year 3rd Year 4th Year 5th Year
Phy Fin Phy Fin Phy Fin Phy Fin Phy Fin
Fishery NO 88700 1 0.89 0 0.00 1 0.89 0 0.00 0 0.00
Goatery NO 6667 3 0.20 0 0.00 3 0.20 0 0.00 0 0.00
Weaving Centre NO 50000 1 0.50 0 0.00 0 0.00 0 0.00 1 0.50
Livelihood Proposed to be Created for Farmers
Vermi Composting No 61675 1 0.62 0 0.00 0 0.00 0 0.00 1 0.62
Name of Micro Watershed Phulbari -Tengajan MWS
Name of Village Phulbari Gaon
Details of allied / other activities (Rs. In Lakh)
Name of Intervention Unit Rate (in INR) TOTAL 2nd Year 3rd Year 4th Year 5th Year
Phy Fin Phy Fin Phy Fin Phy Fin Phy Fin
Piggery NO 120000 1 1.20 0 0.00 0 0.00 1 1.20 0 0.00
Goatery NO 6667 3 0.20 0 0.00 2 0.13 0 0.00 1 0.07
Weaving Centre NO 50000 1 0.50 0 0.00 0 0.00 0 0.00 1 0.50
Livelihood Proposed to be Created for Farmers
Turmeric Cultivation Bigha 19800 1 0.20 0 0.00 0 0.00 1 0.20 0 0.00
Horticulture Nursery Bigha 358000 0.14 0.50 0 0.00 0 0.00 0 0.00 0.14 0.50
Page 97
94
Name of Micro Watershed Phulbari -Tengajan MWS
Name of Village Tipomea Habi Gaon
Details of allied / other activities (Rs. In Lakh)
Name of Intervention Unit Rate (in INR) TOTAL 2nd Year 3rd Year 4th Year 5th Year
Phy Fin Phy Fin Phy Fin Phy Fin Phy Fin
Goatery NO 6667 4 0.27 2 0.13 2 0.13 0 0.00 0 0.00
Dairy NO 135000 1 1.35 0 0.00 0 0.00 1 1.35 0 0.00
Livelihood Proposed to be Created for Farmers
Horticulture Nursery Bigha 358000 0.14 0.50 0 0.00 0 0.00 0 0.00 0.14 0.50
Name of Micro Watershed Phulbari -Tengajan MWS
Name of Village Bhagyalakhmi
Details of allied / other activities (Rs. In Lakh)
Name of Intervention Unit Rate (in INR) TOTAL 2nd Year 3rd Year 4th Year 5th Year
Phy Fin Phy Fin Phy Fin Phy Fin Phy Fin
Fishery NO 88700 1 0.89 1 0.89 0 0.00 0 0.00 0 0.00
Goatery NO 6667 3 0.20 0 0.00 3 0.20 0 0.00 0 0.00
Dairy NO 135000 1 1.35 0 0.00 0 0.00 1 1.35 0 0.00
Livelihood Proposed to be Created for Farmers
Turmeric Cultivation Bigha 19800 1 0.20 0 0.00 0 0.00 1 0.20 0 0.00
Ginger Cultivation Bigha 21000 1 0.21 0 0.00 1 0.21 0 0.00 0 0.00
Vermi Composting No 61675 1 0.62 0 0.00 1 0.62 0 0.00 0 0.00
Page 98
95
VILLAGE & MICRO-WATERSHED WISE BUDGETING FOR ASSET LESS PERSONS (9%) Name of Micro Watershed Salaguri MWS
Name of Village Salaguri Gaon
Livelihood Proposed to be Created for Assetless Persons (Rs. In Lakh)
Name of Intervention Unit Rate (in INR) TOTAL 1st Year 2nd Year 3rd Year 4th Year
Phy Fin Phy Fin Phy Fin Phy Fin Phy Fin
Dairy NO 135000 1 1.35 0 0.00 0 0.00 0 0.00 1 1.35
Goatery NO 6667 5 0.33 5 0.33 0 0.00 0 0.00 0 0.00
Duckery NO 12000 3 0.36 1 0.12 0 0.00 2 0.24 0 0.00
Mobile Repairing NO 40000 1 0.40 0 0.00 0 0.00 0 0.00 1 0.40
Name of Micro Watershed Salaguri MWS
Name of Village Lohong Bebejia
Livelihood Proposed to be Created for Assetless Persons (Rs. In Lakh)
Name of Intervention Unit Rate (in INR) TOTAL 1st Year 2nd Year 3rd Year 4th Year
Phy Fin Phy Fin Phy Fin Phy Fin Phy Fin
Handloom & Weaving Centre
NO 50000 1 0.50 0 0.00 0 0.00 1 0.50 0 0.00
Goatery NO 6667 4 0.27 0 0.00 0 0.00 0 0.00 4 0.27
Piggery NO 120000 1 1.20 0 0.00 0 0.00 1 1.20 0 0.00
Duckery NO 12000 2 0.24 1 0.12 0 0.00 1 0.12 0 0.00
Bicycle Repairing NO 40000 1 0.40 0 0.00 0 0.00 1 0.40 0 0.00
Name of Micro Watershed Salaguri MWS
Name of Village Madhapur No.1
Livelihood Proposed to be Created for Assetless Persons (Rs. In Lakh)
Name of Intervention Unit Rate (in INR) TOTAL 1st Year 2nd Year 3rd Year 4th Year
Phy Fin Phy Fin Phy Fin Phy Fin Phy Fin
Dairy NO 135000 1 1.35 0 0.00 1 1.35 0 0.00 0 0.00
Goatery NO 6667 4 0.27 4 0.27 0 0.00 0 0.00 0 0.00
Duckery NO 12000 2 0.24 2 0.24 0 0.00 0 0.00 0 0.00
Poultry NO 10000 4 0.40 0 0.00 0 0.00 0 0.00 4 0.40
Bicycle Repairing NO 40000 1 0.40 0 0.00 0 0.00 1 0.40 0 0.00
Page 99
96
Name of Micro Watershed Saidal – Turung MWS
Name of Village Saidal Kachari
Livelihood Proposed to be Created for Assetless Persons (Rs. In Lakh)
Name of Intervention Unit Rate (in INR) TOTAL 1st Year 2nd Year 3rd Year 4th Year
Phy Fin Phy Fin Phy Fin Phy Fin Phy Fin
Dairy NO 135000 1 1.35 0 0.00 1 1.35 0 0.00 0 0.00
Goatery NO 6667 7 0.47 0 0.00 3 0.20 2 0.13 2 0.13
Duckery NO 12000 3 0.36 1 0.12 0 0.00 2 0.24 0 0.00
Bicycle Repairing NO 40000 1 0.40 0 0.00 0 0.00 1 0.40 0 0.00
Name of Micro Watershed Saidal – Turung MWS
Name of Village Tipomia Gaon
Livelihood Proposed to be Created for Assetless Persons (Rs. In Lakh)
Name of Intervention Unit Rate (in INR) TOTAL 1st Year 2nd Year 3rd Year 4th Year
Phy Fin Phy Fin Phy Fin Phy Fin Phy Fin
Dairy NO 135000 1 1.35 0 0.00 1 1.35 0 0.00 0 0.00
Goatery NO 6667 7 0.47 4 0.27 0 0.00 0 0.00 3 0.20
Duckery NO 12000 3 0.36 1 0.12 0 0.00 2 0.24 0 0.00
Mobile Repairing NO 40000 1 0.40 0 0.00 0 0.00 0 0.00 1 0.40
Name of Micro Watershed Saidal – Turung MWS
Name of Village Turung Gaon
Livelihood Proposed to be Created for Assetless Persons (Rs. In Lakh)
Name of Intervention Unit Rate (in INR) TOTAL 1st Year 2nd Year 3rd Year 4th Year
Phy Fin Phy Fin Phy Fin Phy Fin Phy Fin
Goatery NO 6667 7 0.47 0 0.00 0 0.00 2 0.13 5 0.33
Piggery NO 120000 1 1.20 0 0.00 0 0.00 1 1.20 0 0.00
Duckery NO 12000 2 0.24 2 0.24 0 0.00 0 0.00 0 0.00
Poultry NO 10000 3 0.30 0 0.00 0 0.00 0 0.00 3 0.30
Bicycle Repairing NO 40000 1 0.40 0 0.00 0 0.00 1 0.40 0 0.00
Page 100
97
Name of Micro Watershed Dangdhara –Mahimabari MWS
Name of Village Christian Gaon
Livelihood Proposed to be Created for Assetless Persons (Rs. In Lakh)
Name of Intervention Unit Rate (in INR) TOTAL 1st Year 2nd Year 3rd Year 4th Year
Phy Fin Phy Fin Phy Fin Phy Fin Phy Fin
Dairy NO 135000 1 1.35 0 0.00 1 1.35 0 0.00 0 0.00
Goatery NO 6667 7 0.47 4 0.27 0 0.00 0 0.00 3 0.20
Duckery NO 12000 3 0.36 1 0.12 0 0.00 2 0.24 0 0.00
Name of Micro Watershed Dangdhara –Mahimabari MWS
Name of Village Madhapur No.2
Livelihood Proposed to be Created for Assetless Persons (Rs. In Lakh)
Name of Intervention Unit Rate (in INR) TOTAL 1st Year 2nd Year 3rd Year 4th Year
Phy Fin Phy Fin Phy Fin Phy Fin Phy Fin
Goatery NO 6667 5 0.33 0 0.00 0 0.00 1 0.07 4 0.27
Piggery NO 120000 1 1.20 0 0.00 0 0.00 1 1.20 0 0.00
Duckery NO 12000 2 0.24 1 0.12 0 0.00 1 0.12 0 0.00
Mobile Repairing NO 40000 1 0.40 0 0.00 0 0.00 0 0.00 1 0.40
Name of Micro Watershed Dangdhara –Mahimabari MWS
Name of Village Kachari Gaon
Livelihood Proposed to be Created for Assetless Persons (Rs. In Lakh)
Name of Intervention Unit Rate (in INR) TOTAL 1st Year 2nd Year 3rd Year 4th Year
Phy Fin Phy Fin Phy Fin Phy Fin Phy Fin
Dairy NO 135000 1 1.35 0 0.00 1 1.35 0 0.00 0 0.00
Goatery NO 6667 3 0.20 3 0.20 0 0.00 0 0.00 0 0.00
Duckery NO 12000 2 0.24 1 0.12 0 0.00 1 0.12 0 0.00
Poultry NO 10000 2 0.20 0 0.00 0 0.00 0 0.00 2 0.20
Bicycle Repairing NO 40000 1 0.40 0 0.00 0 0.00 1 0.40 0 0.00
Page 101
98
Name of Micro Watershed Dangdhara –Mahimabari MWS
Name of Village Charaipani Bongali
Livelihood Proposed to be Created for Assetless Persons (Rs. In Lakh)
Name of Intervention Unit Rate (in INR) TOTAL 1st Year 2nd Year 3rd Year 4th Year
Phy Fin Phy Fin Phy Fin Phy Fin Phy Fin
Dairy NO 135000 1 1.35 0 0.00 0 0.00 0 0.00 1 1.35
Goatery NO 6667 5 0.33 0 0.00 0 0.00 0 0.00 5 0.33
Duckery NO 12000 2 0.24 1 0.12 0 0.00 1 0.12 0 0.00
Poultry NO 10000 2 0.20 0 0.00 0 0.00 0 0.00 2 0.20
Bicycle Repairing NO 40000 1 0.40 0 0.00 0 0.00 1 0.40 0 0.00
Name of Micro Watershed Dangdhara –Mahimabari MWS
Name of Village Dangdhara
Livelihood Proposed to be Created for Assetless Persons (Rs. In Lakh)
Name of Intervention Unit Rate (in INR) TOTAL 1st Year 2nd Year 3rd Year 4th Year
Phy Fin Phy Fin Phy Fin Phy Fin Phy Fin
Dairy NO 135000 1 1.35 0 0.00 1 1.35 0 0.00 0 0.00
Goatery NO 6667 5 0.33 0 0.00 0 0.00 0 0.00 5 0.33
Duckery NO 12000 2 0.24 1 0.12 0 0.00 1 0.12 0 0.00
Poultry NO 10000 2 0.20 0 0.00 0 0.00 0 0.00 2 0.20
Name of Micro Watershed Dangdhara –Mahimabari MWS
Name of Village Mohimabari Gaon
Livelihood Proposed to be Created for Assetless Persons (Rs. In Lakh)
Name of Intervention Unit Rate (in INR) TOTAL 1st Year 2nd Year 3rd Year 4th Year
Phy Fin Phy Fin Phy Fin Phy Fin Phy Fin
Dairy NO 135000 1 1.35 0 0.00 1 1.35 0 0.00 0 0.00
Goatery NO 6667 5 0.33 2 0.13 0 0.00 3 0.20 0 0.00
Duckery NO 12000 2 0.24 1 0.12 0 0.00 1 0.12 0 0.00
Poultry NO 10000 2 0.20 0 0.00 0 0.00 0 0.00 2 0.20
Bicycle Repairing NO 40000 1 0.40 0 0.00 0 0.00 1 0.40 0 0.00
Page 102
99
Name of Micro Watershed Phulbari -Tengajan MWS
Name of Village Medeluajan
Livelihood Proposed to be Created for Assetless Persons (Rs. In Lakh)
Name of Intervention Unit Rate (in INR) TOTAL 1st Year 2nd Year 3rd Year 4th Year
Phy Fin Phy Fin Phy Fin Phy Fin Phy Fin
Goatery NO 6667 3 0.20 3 0.20 0 0.00 0 0.00 0 0.00
Piggery NO 120000 1 1.20 0 0.00 0 0.00 1 1.20 0 0.00
Duckery NO 12000 2 0.24 1 0.12 0 0.00 1 0.12 0 0.00
Poultry NO 10000 2 0.20 0 0.00 0 0.00 0 0.00 2 0.20
Bicycle Repairing NO 40000 1 0.40 0 0.00 0 0.00 1 0.40 0 0.00
Name of Micro Watershed Phulbari -Tengajan MWS
Name of Village Tengajan
Livelihood Proposed to be Created for Assetless Persons (Rs. In Lakh)
Name of Intervention Unit Rate (in INR) TOTAL 1st Year 2nd Year 3rd Year 4th Year
Phy Fin Phy Fin Phy Fin Phy Fin Phy Fin
Dairy NO 135000 1 1.35 0 0.00 1 1.35 0 0.00 0 0.00
Goatery NO 6667 5 0.33 0 0.00 0 0.00 0 0.00 5 0.33
Duckery NO 12000 2 0.24 1 0.12 0 0.00 1 0.12 0 0.00
Poultry NO 10000 2 0.20 0 0.00 0 0.00 0 0.00 2 0.20
Bicycle Repairing NO 40000 1 0.40 0 0.00 0 0.00 1 0.40 0 0.00
Name of Micro Watershed Phulbari -Tengajan MWS
Name of Village Phulbari Gaon
Livelihood Proposed to be Created for Assetless Persons (Rs. In Lakh)
Name of Intervention Unit Rate (in INR) TOTAL 1st Year 2nd Year 3rd Year 4th Year
Phy Fin Phy Fin Phy Fin Phy Fin Phy Fin
Dairy NO 135000 1 1.35 0 0.00 1 1.35 0 0.00 0 0.00
Goatery NO 6667 5 0.33 5 0.33 0 0.00 0 0.00 0 0.00
Duckery NO 12000 2 0.24 1 0.12 0 0.00 1 0.12 0 0.00
Mobile Repairing NO 40000 1 0.40 0 0.00 0 0.00 0 0.00 1 0.40
Page 103
100
Name of Micro Watershed Phulbari -Tengajan MWS
Name of Village Tipomea Habigaon
Livelihood Proposed to be Created for Assetless Persons (Rs. In Lakh)
Name of Intervention Unit Rate (in INR) TOTAL 1st Year 2nd Year 3rd Year 4th Year
Phy Fin Phy Fin Phy Fin Phy Fin Phy Fin
Handloom & Weaving Centre
NO 50000 1 0.50 0 0.00 0 0.00 1 0.50 0 0.00
Goatery NO 6667 7 0.47 5 0.33 0 0.00 2 0.13 0 0.00
Duckery NO 12000 6 0.72 1 0.12 0 0.00 5 0.60 0 0.00
Poultry NO 10000 4 0.40 0 0.00 0 0.00 0 0.00 4 0.40
Name of Micro Watershed Phulbari -Tengajan MWS
Name of Village Bhagyalakhmi
Livelihood Proposed to be Created for Assetless Persons (Rs. In Lakh)
Name of Intervention Unit Rate (in INR) TOTAL 1st Year 2nd Year 3rd Year 4th Year
Phy Fin Phy Fin Phy Fin Phy Fin Phy Fin
Dairy NO 135000 1 1.35 0 0.00 1 1.35 0 0.00 0 0.00
Handloom & Weaving Centre
NO 50000 1 0.50 0 0.00 0 0.00 1 0.50 0 0.00
Goatery NO 6667 5 0.33 0 0.00 3 0.20 2 0.13 0 0.00
Duckery NO 12000 2 0.24 1 0.12 0 0.00 1 0.12 0 0.00
Poultry NO 10000 2 0.20 0 0.00 0 0.00 0 0.00 2 0.20
Bicycle Repairing NO 40000 1 0.40 0 0.00 0 0.00 1 0.40 0 0.00
Page 104
101
Table No. 7.2 Estimated Benefit Cost Ratio
S.No. Name of the activity Total Cost
(Rs.)
Total Benefit expected *
(Rs.) BCR Remarks
1 EPA 1848000 2032800 1.1
2 NRM 25872000 35040000 1.46
3 Productivity Enhancement 4620000 10608000 1.7
4 Livelihood for Asset less 4158000 8640000 1.8
5 Institution and Capacity building 2310000 2772000 1.2
Page 105
102
Chapter 8 Consolidation and completion of various works
Table No. 8.1: Consolidation of Action Plan
Component Implementation Phase
Consolid-
ation/exit Phase
Total
1st year 2nd year 3rd year 4th year 5th year
Administrative 11.55 9.24 9.24 9.24 6.93 46.20
Monitoring 0.46 1.39 1.39 1.39 0.00 4.62
Evaluation 1.85 0.00 0.00 0.00 2.77 4.62
Entry Point Acty 18.48 0.00 0.00 0.00 0.00 18.48
Instituation&CB 9.24 4.62 4.62 4.62 0.00 23.10
DPR 4.62 0.00 0.00 0.00 0.00 4.62
Watershed Development works 46.20 63.29 67.91 81.31 0.00 258.72
livelihood activities (Asset less) 0.00 18.48 13.86 9.24 0.00 41.58
Production system & microenterprise 0.00 23.10 13.86 9.24 0.00 46.20
Consolidation 0.00 0.00 0.00 0.00 13.8600 13.86
TOTAL 92.40 120.12 110.88 115.04 23.56 462.00
Page 106
103
Consolidation of Action Plan
Name of MW Name(s) of the
villages CPR particulars Total for
village Activity proposed
Target
Target area under the
activity (ha)/ (Qnty. In No.)
Estimated
expenditure (Rs.)
Expected no. of
beneficia-ries
Estimated
contri-bution to WDF (Rs.)
Salaguri
MWS, 3B3C3eII
Salaguri Gaon
Lohong Bebejia Madhapur Grant No.1
Sluice Gate Repair & Maintanance 2.00 122400.00 200 -
Livelihood & Production System
Market Promotion Centre (Alongwidth Low Cost
Godown)
1 239400.00 150 -
SUB TOTAL` 3.00 361800.00 350 0.00
Saidal –
Turung
MWS,
3B3C3eIII
Saidal Kachari Gaon
Tipomia Gaon
Turung Gaon
Sluice Gate Repair & Maintanance 2.00 122400.00 200 -
Livelihood & Production
System
Market Promotion Centre
(Alongwidth Low Cost Godown)
1 239400.00 150 -
SUB TOTAL` 6.00 361800.00 700 0.00
Dangdhara –Mahimabari
MWS, 3B3C3eI
Christian Gaon Madhapur No.2
Kachari Gaon
Sluice Gate Repair & Maintanance 1.00 61200.00 200 -
Livelihood & Production
System
Market Promotion Centre
(Alongwidth Low Cost Godown)
1 239400.00 150 -
SUB TOTAL` 1.00 300600.00 150 0.00
Phulbari -Tengajan
MWS,
3B3C3eIV
Medeluajan Gaon Tongajan Gaon
Phulbari Gaon
Tipomia Habi Gaon Bhagyalakni
Charaipani Bosabari T.E.
Grant No.188 Charaipani Grant No.1
Sluice Gate Repair & Maintanance 2.00 122400.00 200 -
Livelihood & Production
System
Market Promotion Centre
(Alongwidth Low Cost
Godown)
1 239400.00 150 -
SUB TOTAL` 0.00 361800.00 0 0.00
Total for Project 10.00 1386000.00 1200.00 0.00
Page 107
104
CHAPTER – 9
EXPECTED OUTCOMES
9.1 Describe in detail the “Expected Outcomes”
Table No. 9.2: Summarize in the table given below (Quantifiable
indicators)
1 2 3 4 5 6
S. No.
Item Unit of measurement
Pre-project Status
Expected
Post-project
Status
Remarks
1 Status of water table (Depth to Ground water level)
Meters 4 3
2 Ground water structures repaired/
rejuvenated
No. NA NA
3 Quality of drinking water Description Iron -
4 Availability of drinking water Description Not Available
for all household
-
5 Increase in irrigation potential Hec. 281.45 2500
6 Change in cropping/ land use pattern Description
7 Area under agricultural crop Hec.
I Area under single crop Hec. 3556.66 -
Ii Area under double crop Hec. 310.38 2000
iii Area under multiple crop Hec. - 400
8 Net increase in crop production area Hec. - -
9 Increase in area under
Vegetation/Forest
Hec. - -
10 Increase in area under horticulture Hec. -
11 Increase in area under fuel Hec. -
12 Increase in area under Fodder Hec. -
13 Increase in milk production Litres/day 250
14 Environmental Impact Change in Soil Loss
Perenniality of flow and change in
Run-off Recharge of ground water
14 No. of SHGs Promoted No. 253
15 Increase in no. of livelihoods No. -
16 Increase in income Rs. -
17 Status of Migration No. Decrease
18 SHG Federations formed No. -
19 Credit linkage with banks Rs. -
20 Resource use agreements -
21 WDF collection & management Rs. -
22 Summary of lessons learnt Description
Page 108
105
Table No.9.3: Backward and Forward Linkages
5 6 7
Type of Marketing Facility Name of the institution
Pre-project (no.)
Expected post project status
(A) Backward linkages
(i) Seed certification
(ii) Seed supply system
(iii) Fertilizer supply system
(iv) Pesticide supply system
(v) Credit institutions
(vi) Water supply
(vii) Extension services
(viii) Nurseries
(ix) Tools/machinery suppliers
(x) Price Support system
(xi) Labour
(xii) Any other (please specify)
(B) Forward linkages
(i) Harvesting/threshing machinery
(ii) Storage (including cold storage)
(iii) Road network
(iv) Transport facilities
(v) Markets / Mandis
(vi) Agro and other Industries
(vii) Milk and other collection centres
(viii) Labour
(ix) Any other (please specify)
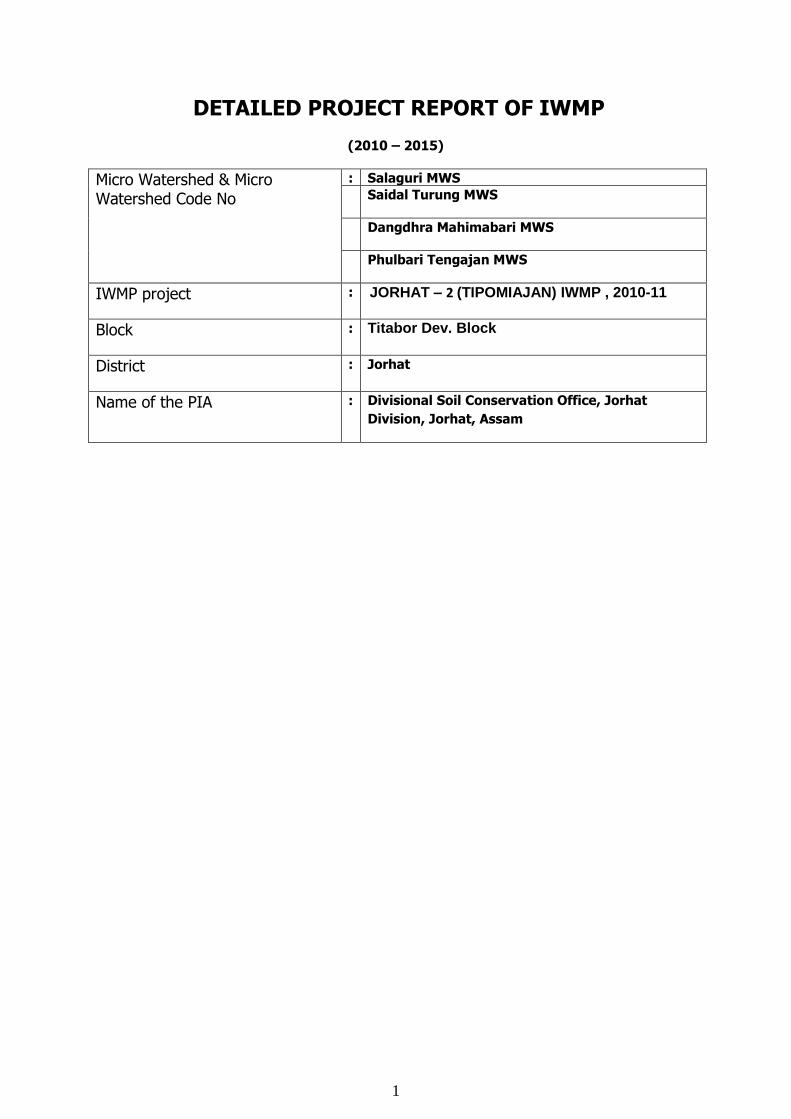
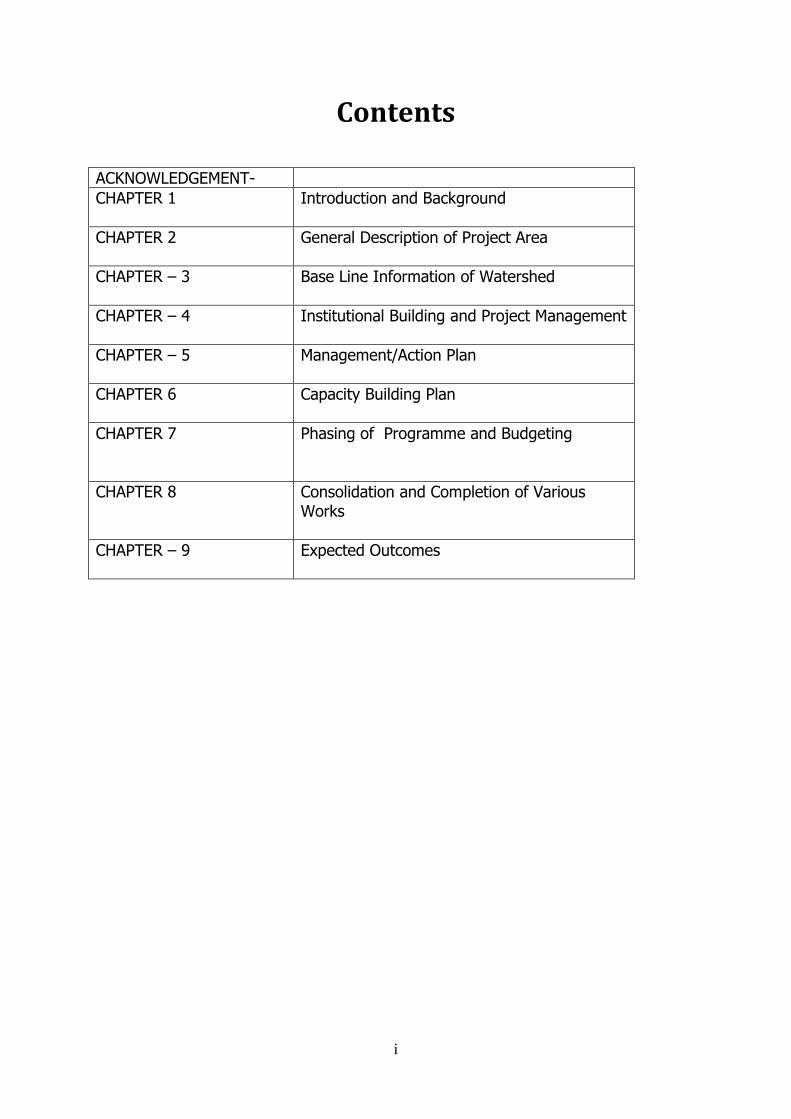
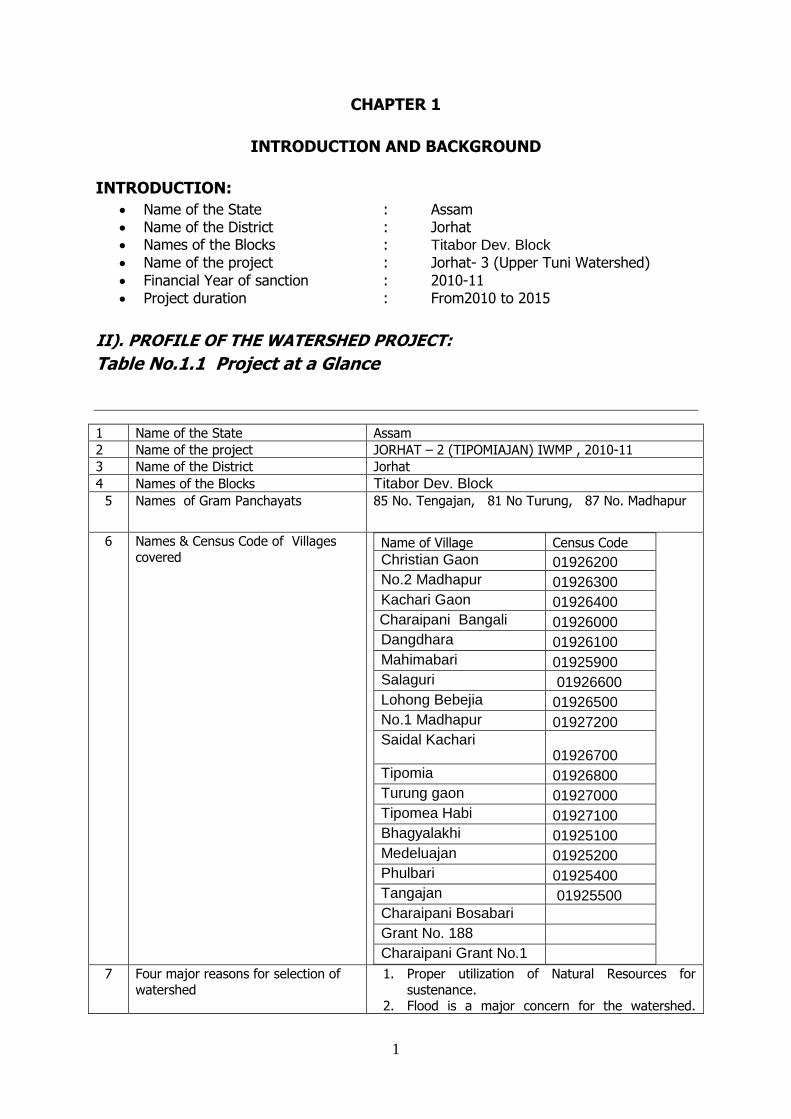
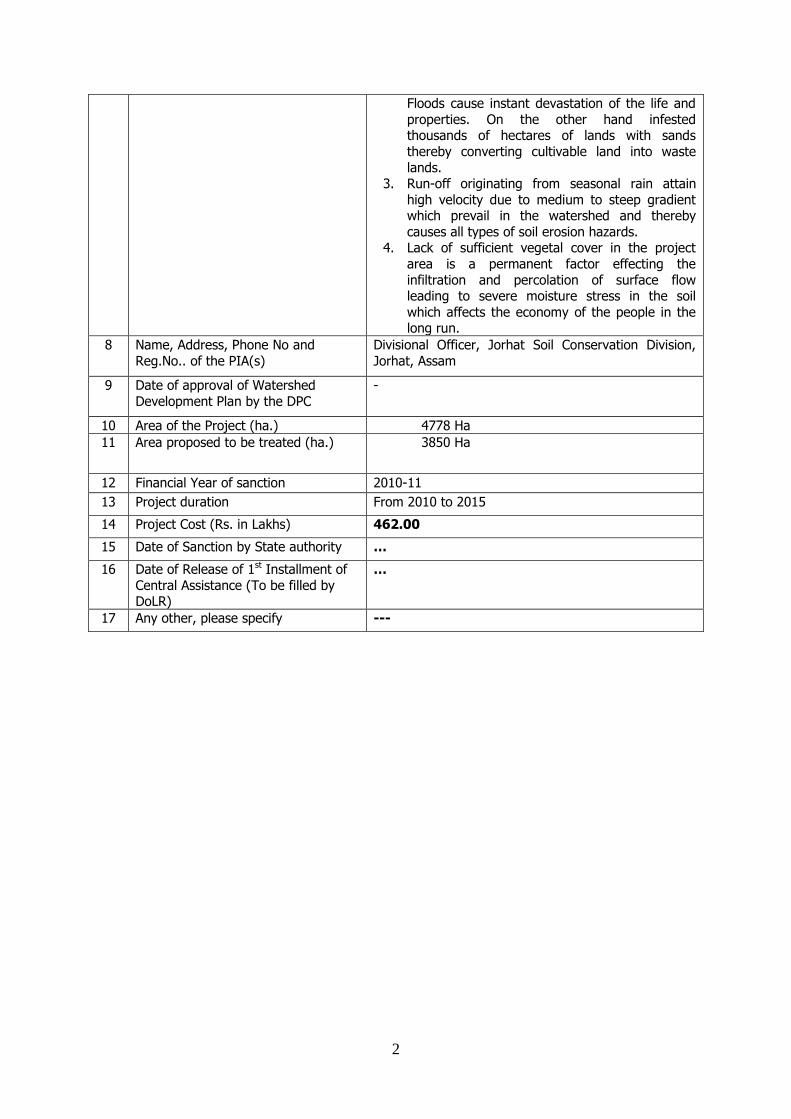
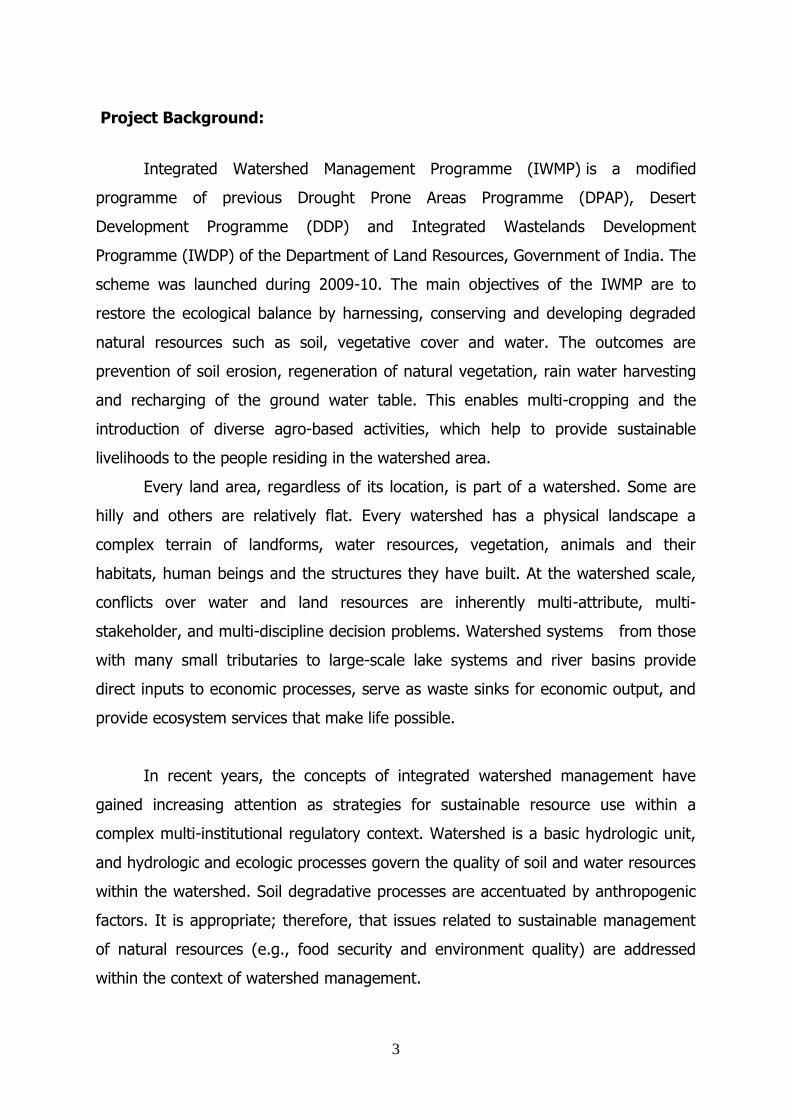
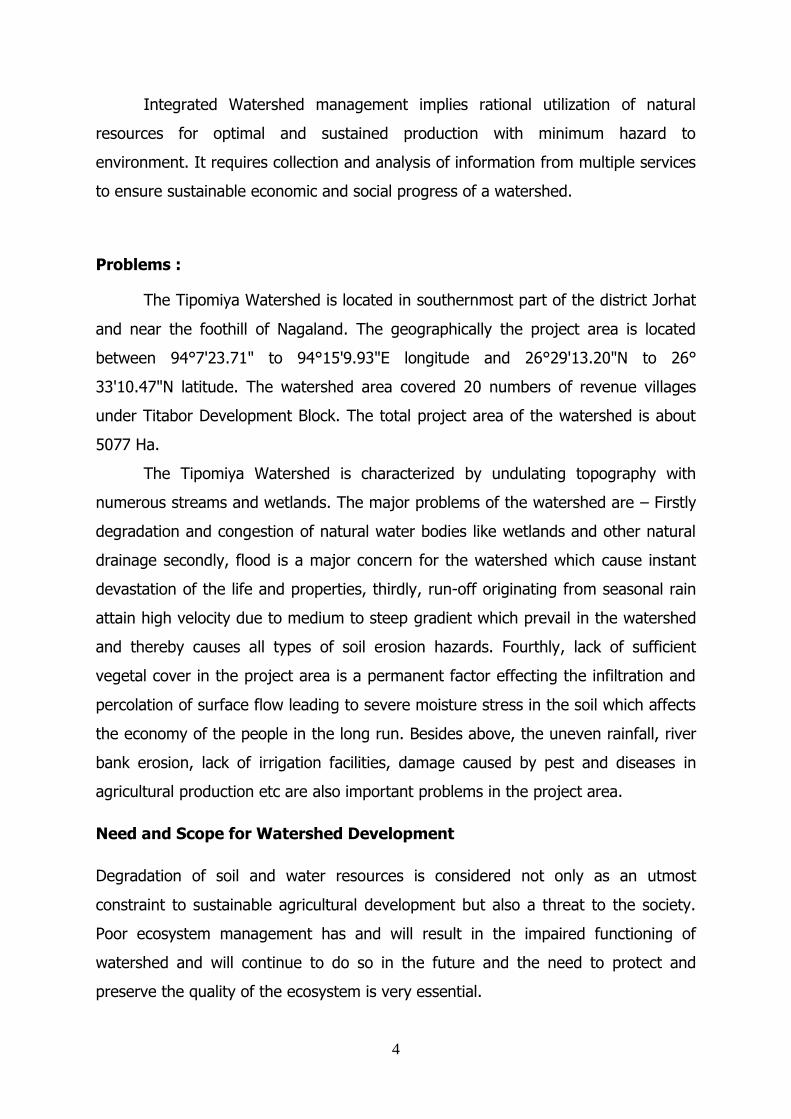
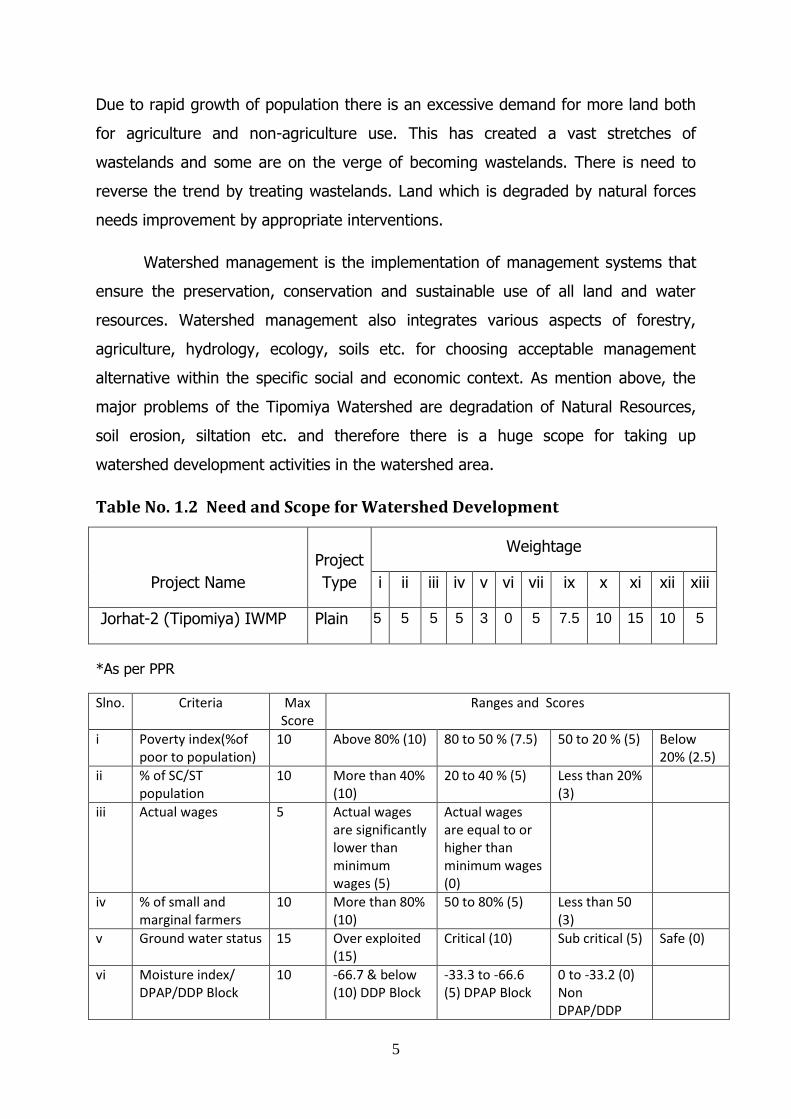
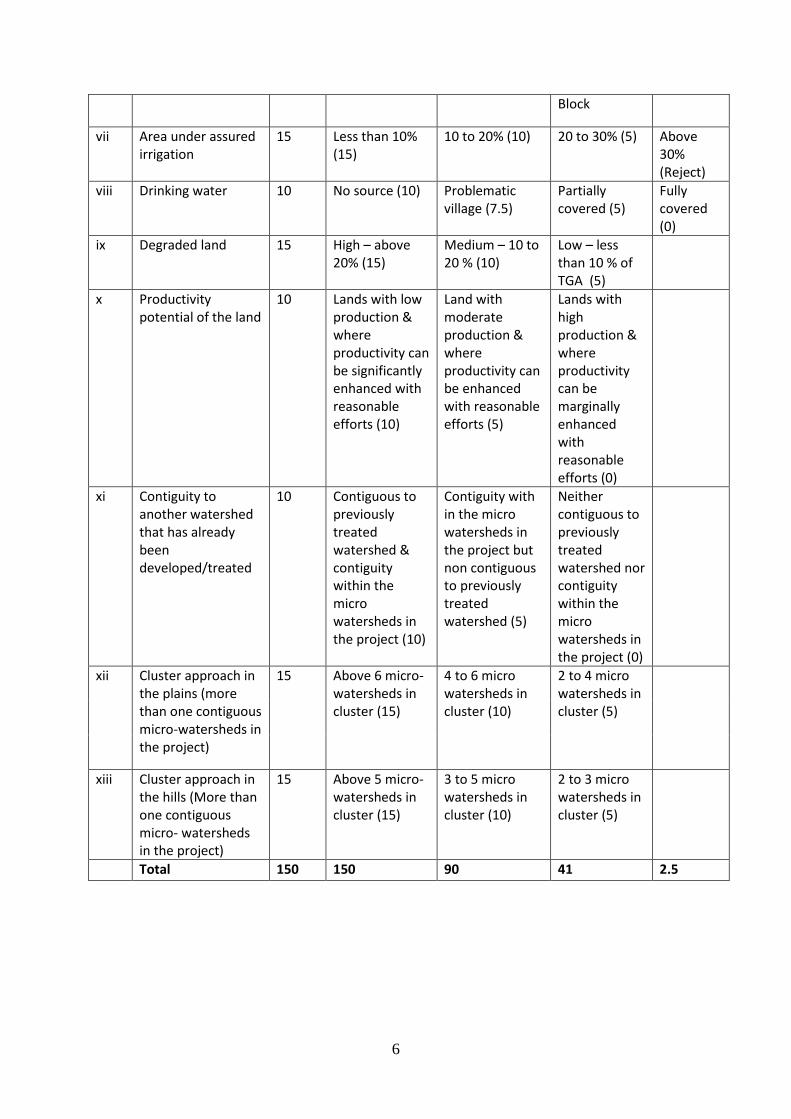
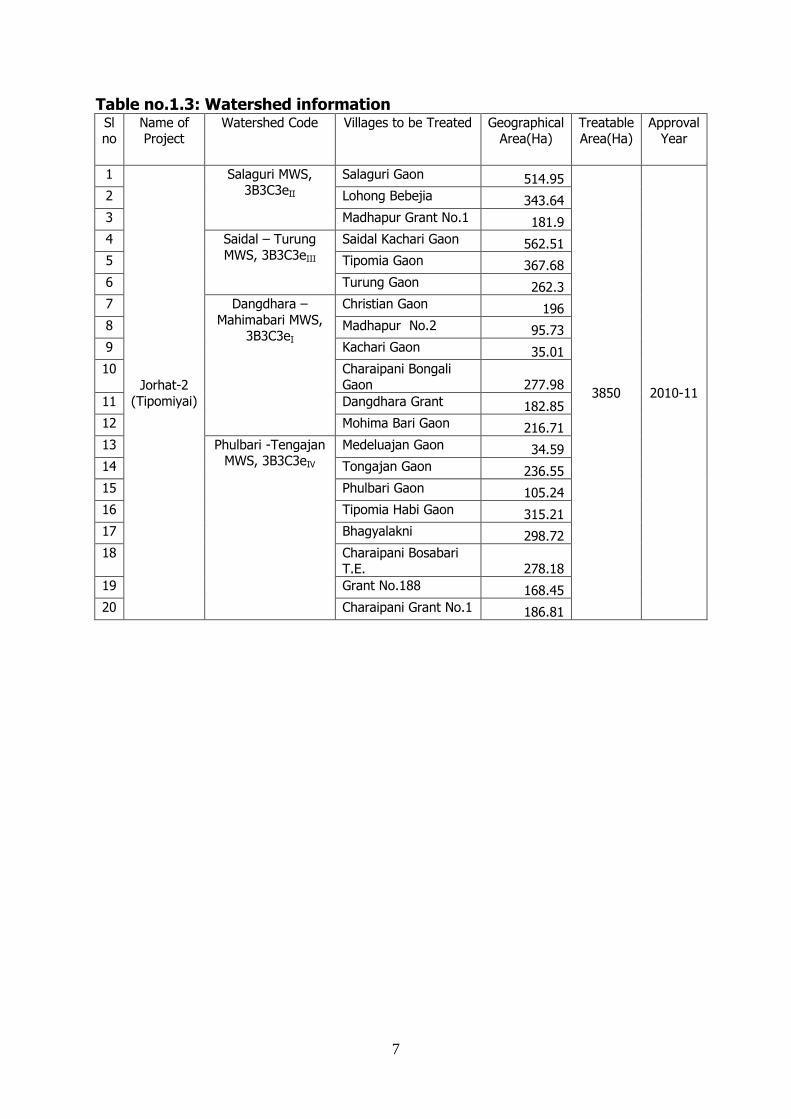
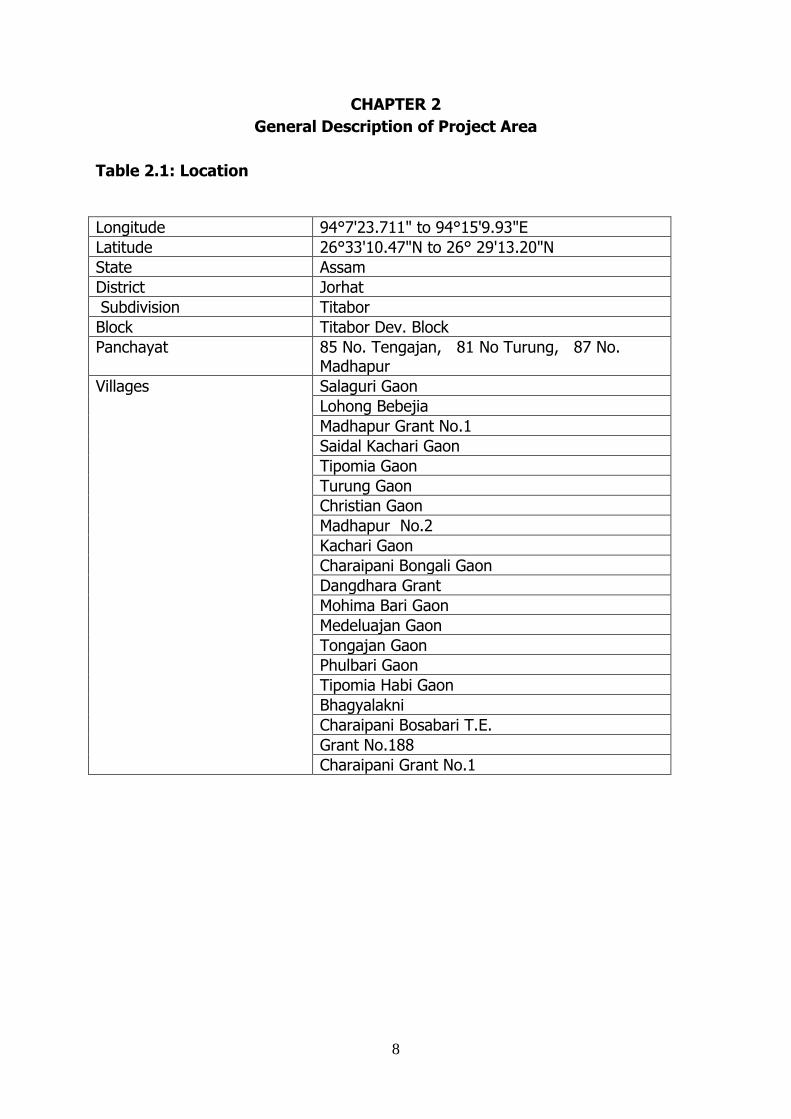


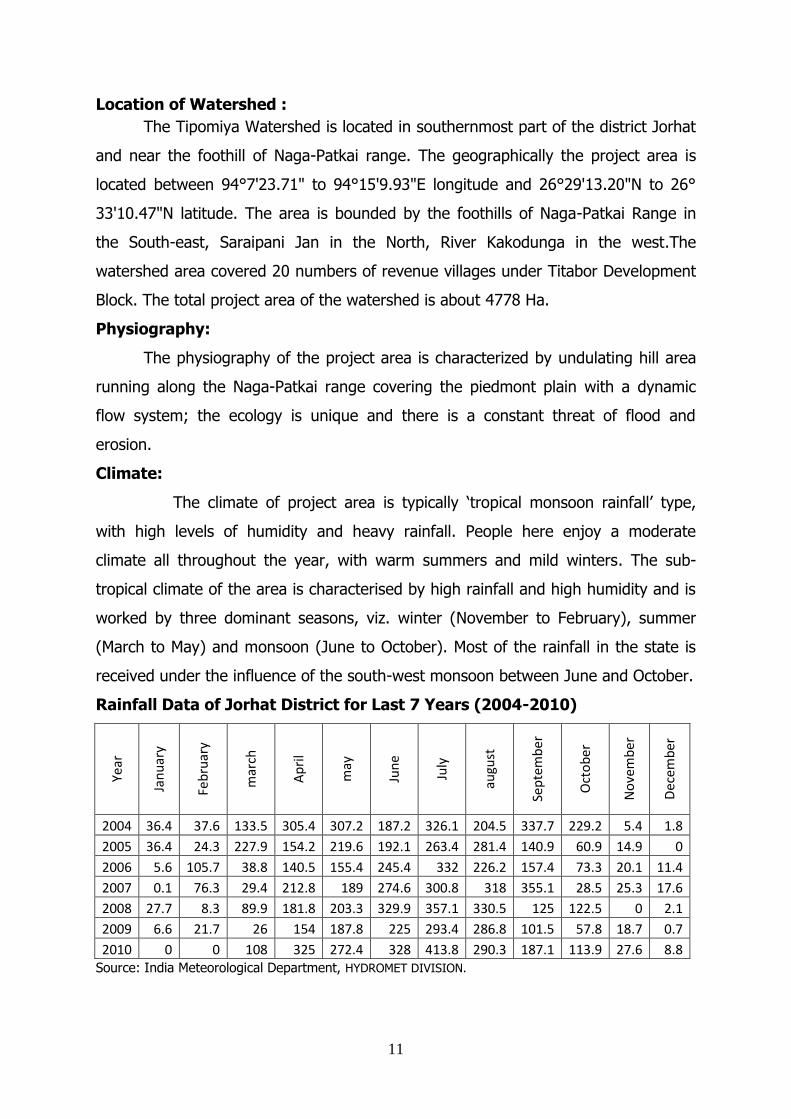
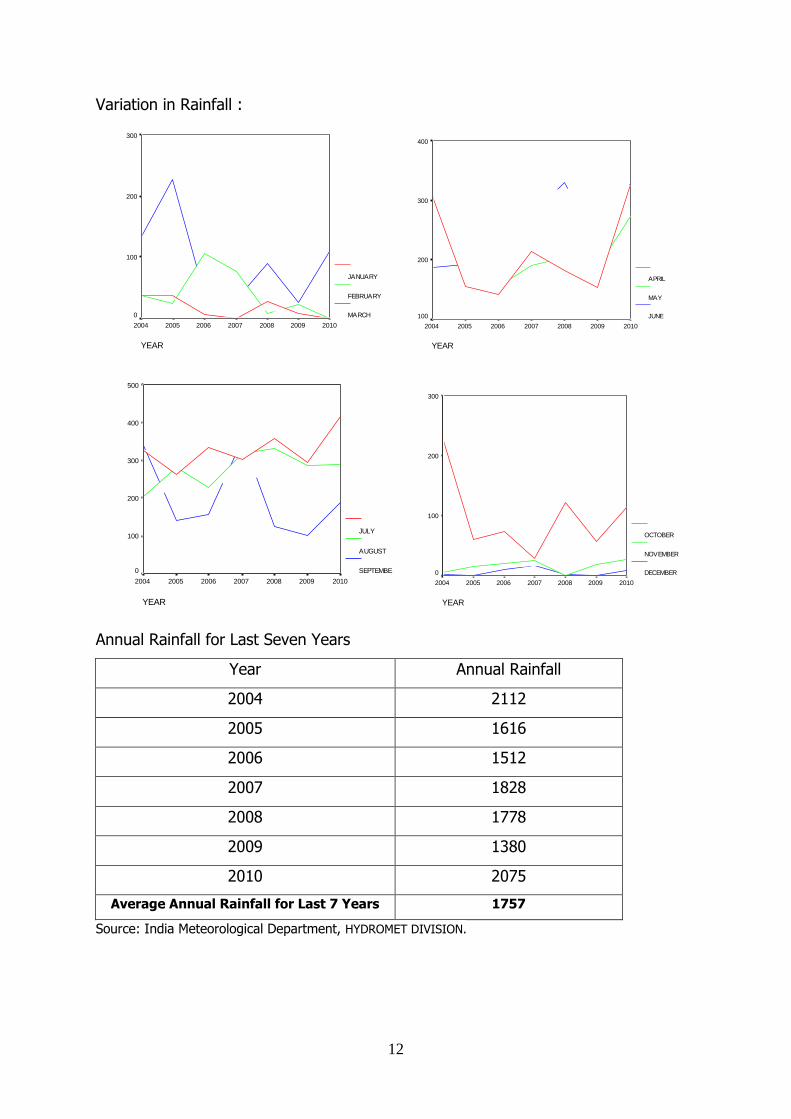
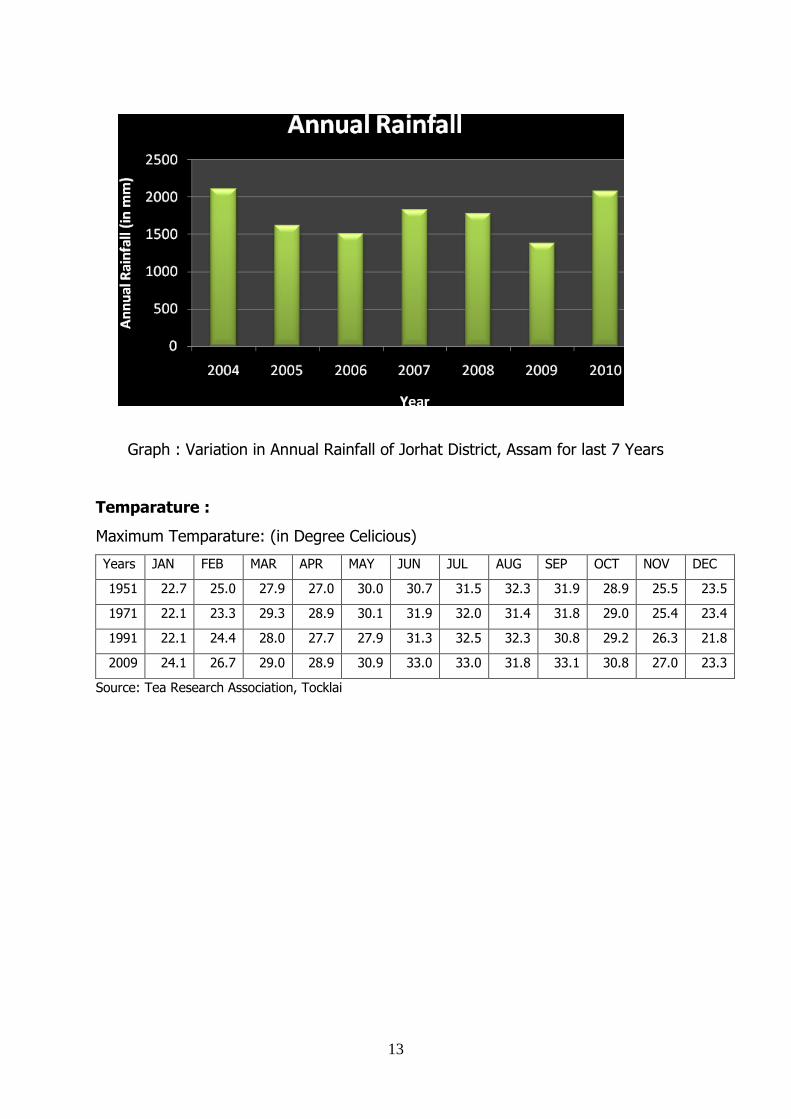
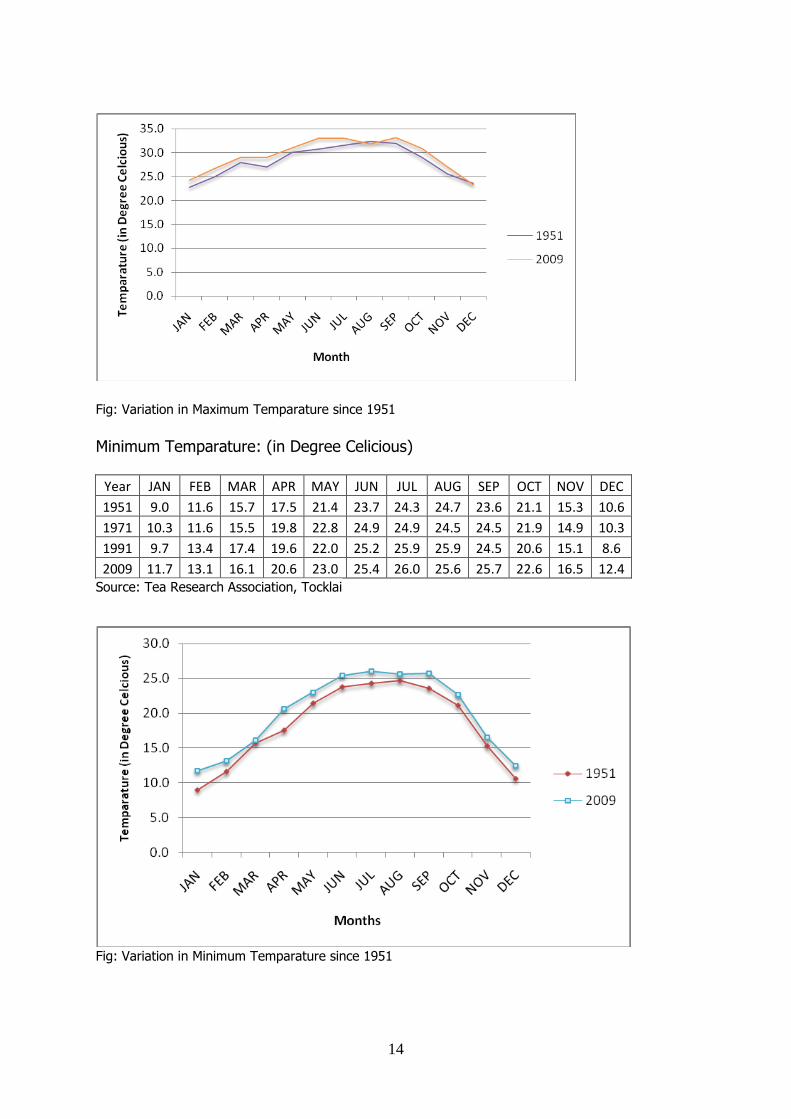
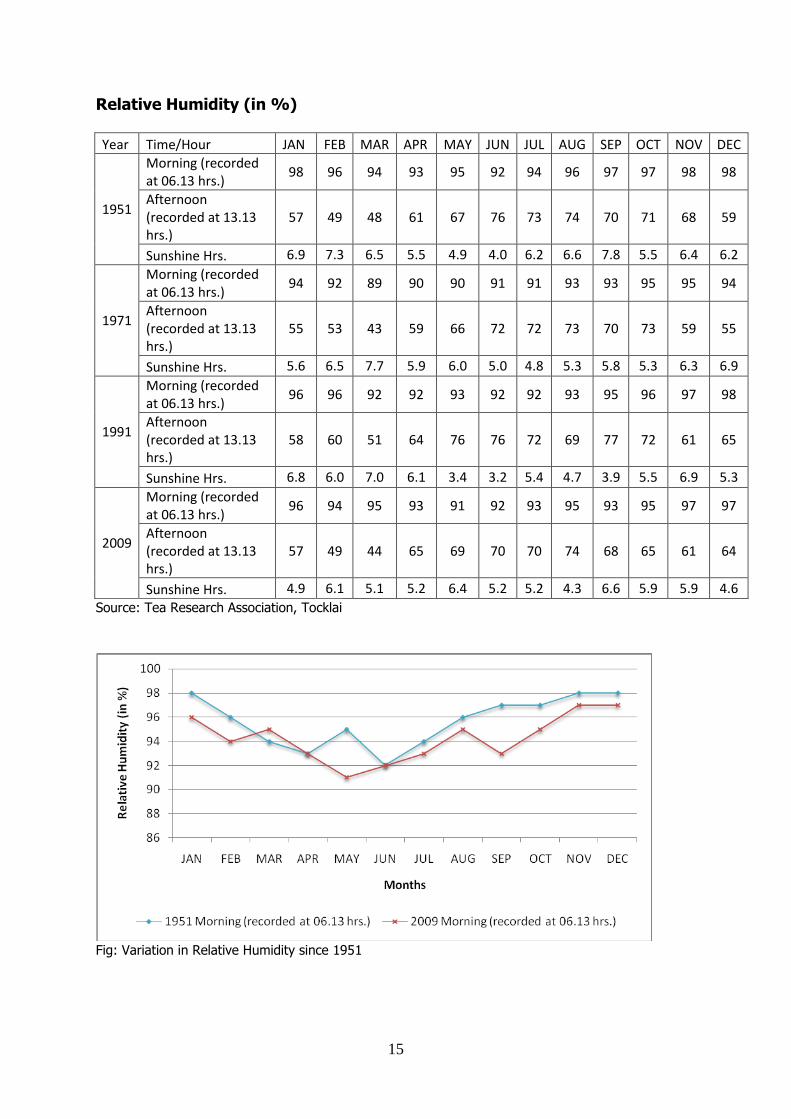
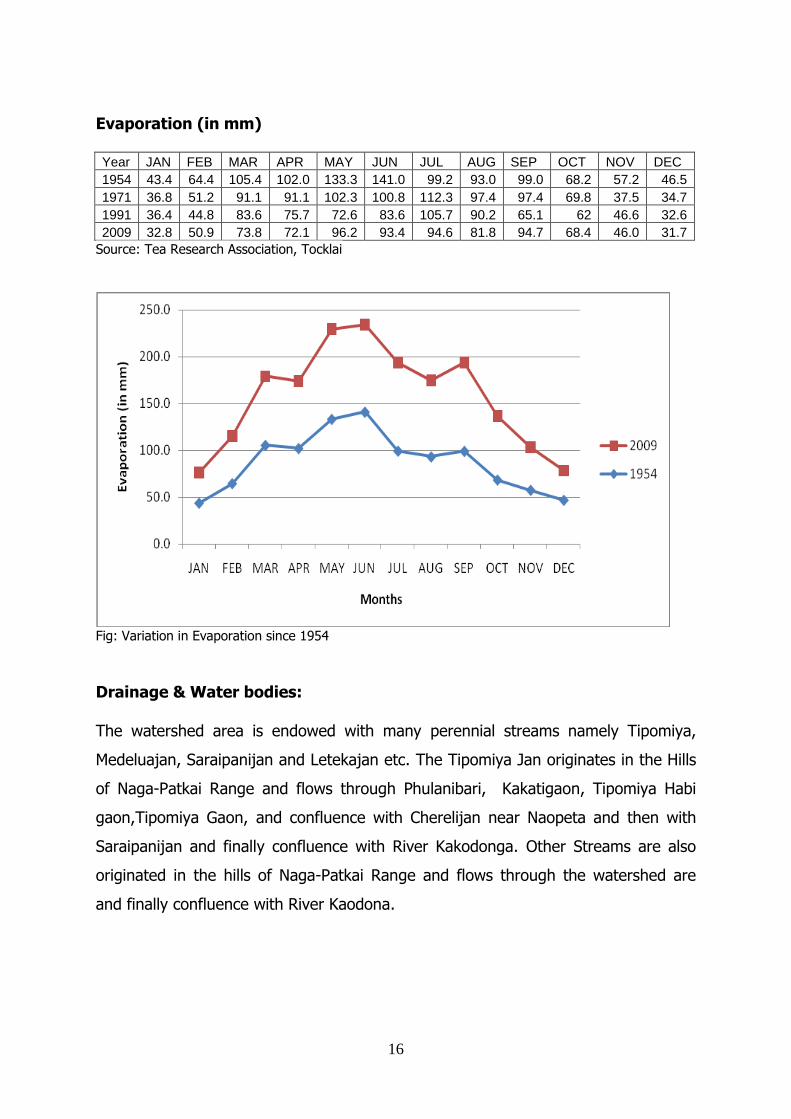

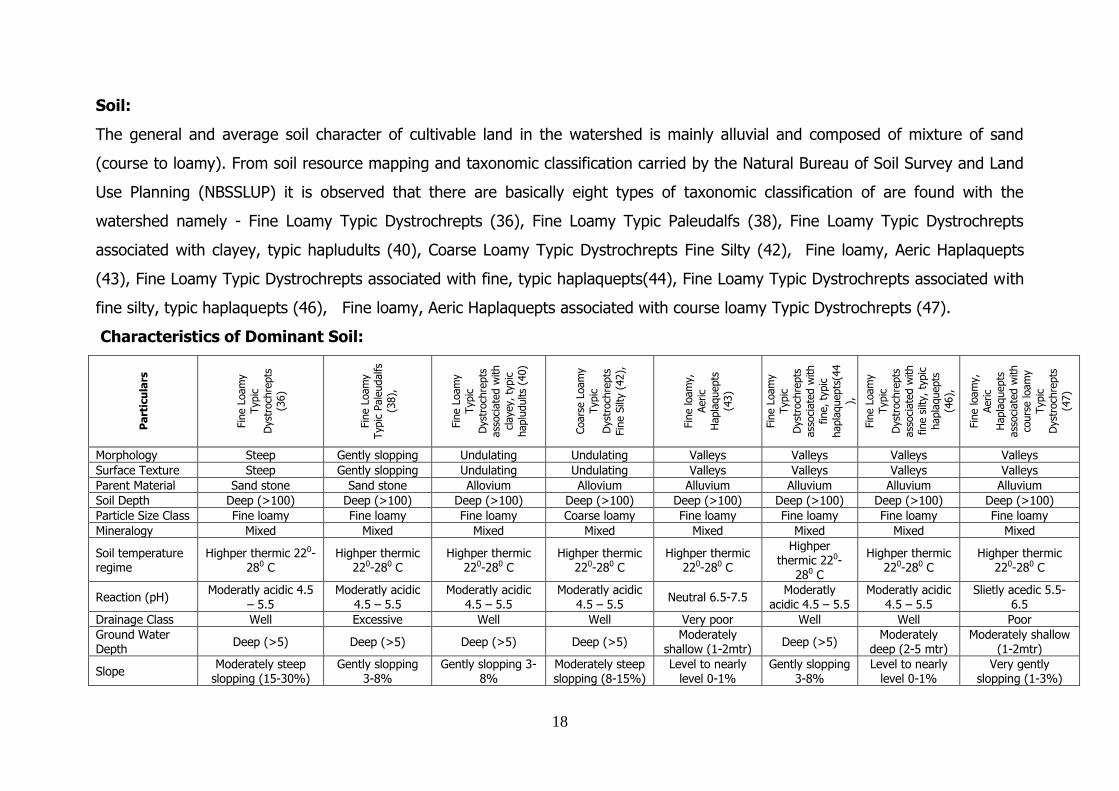


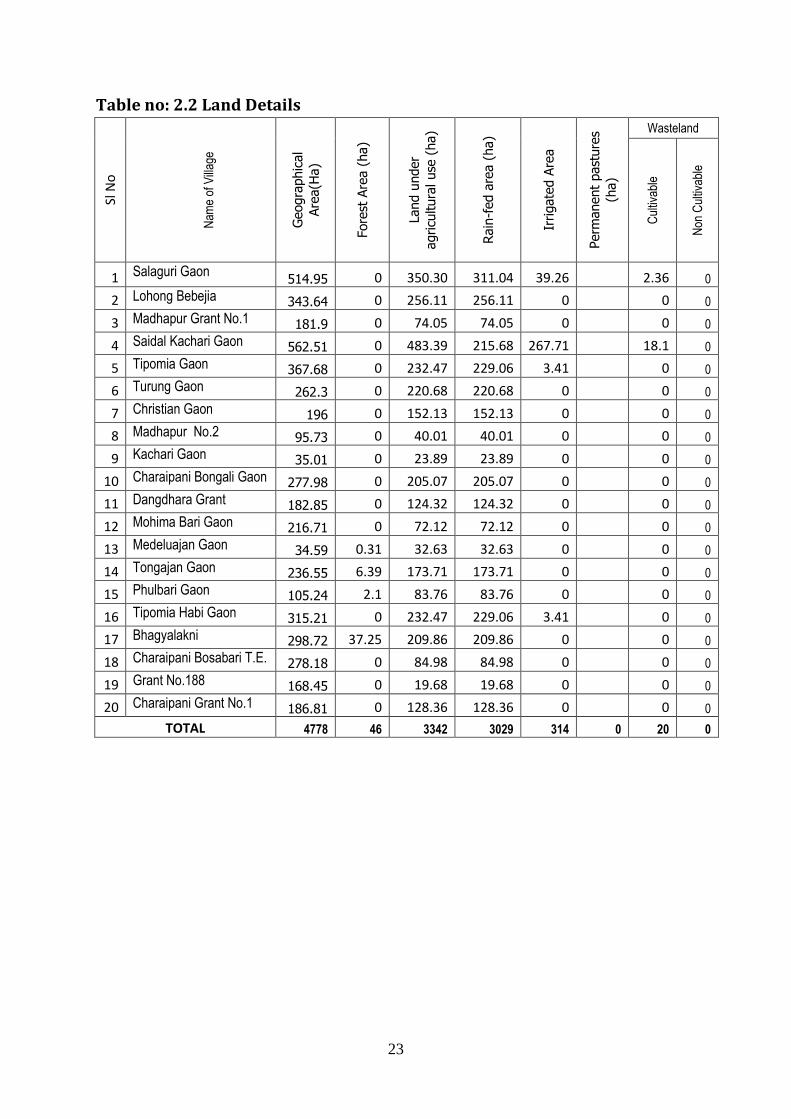
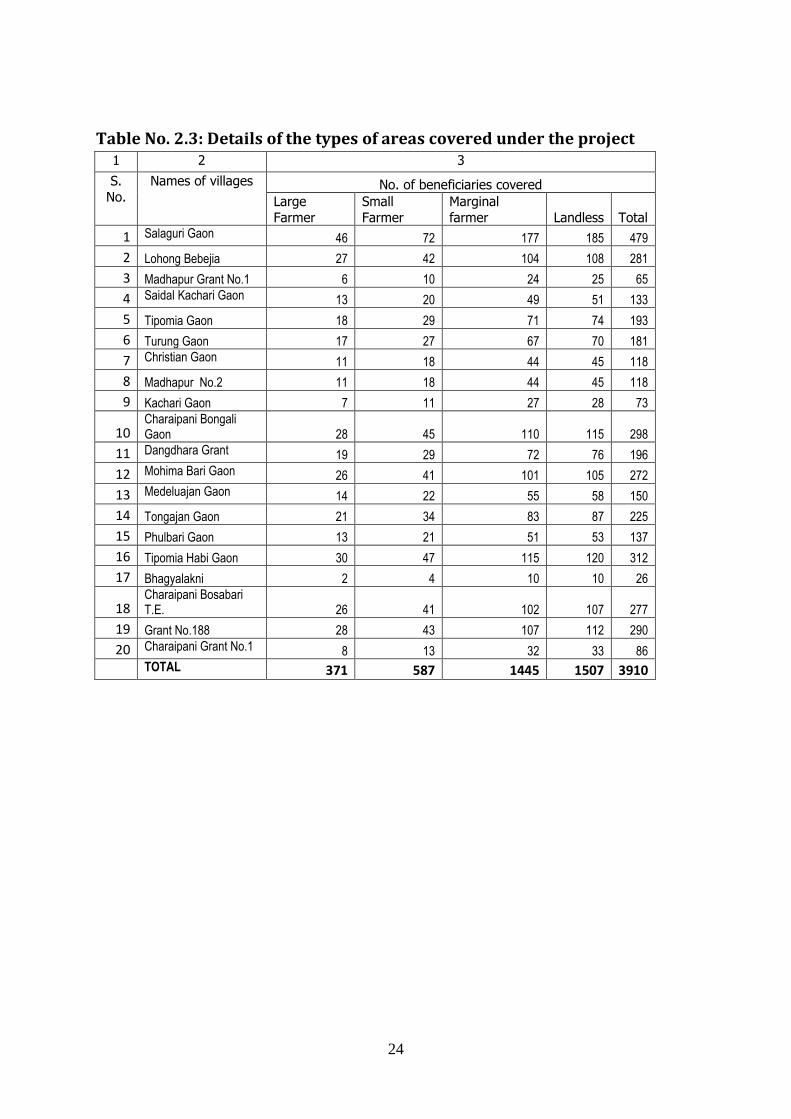
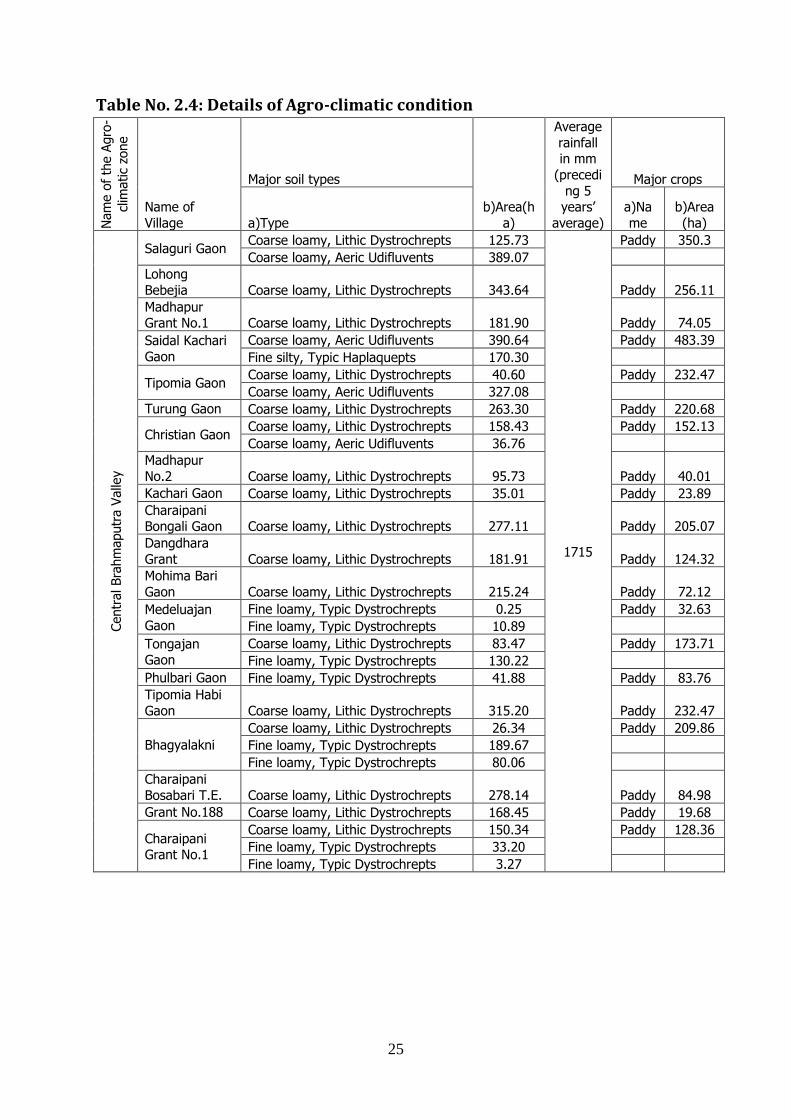
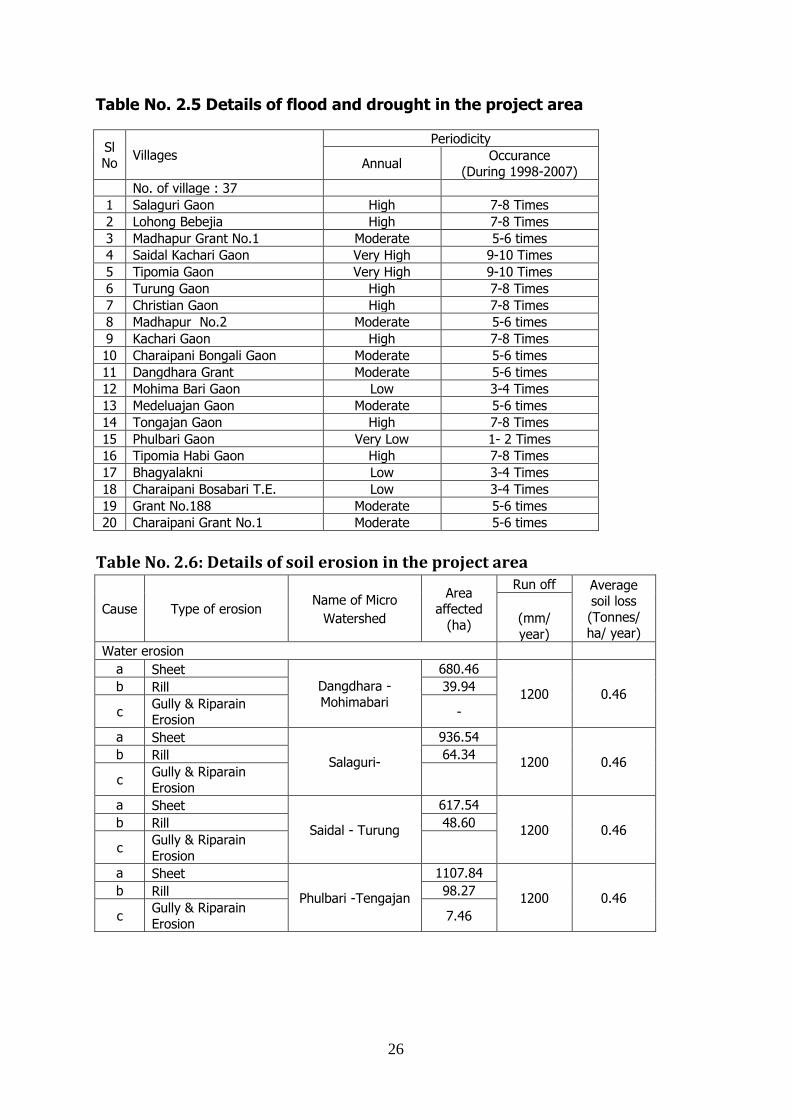

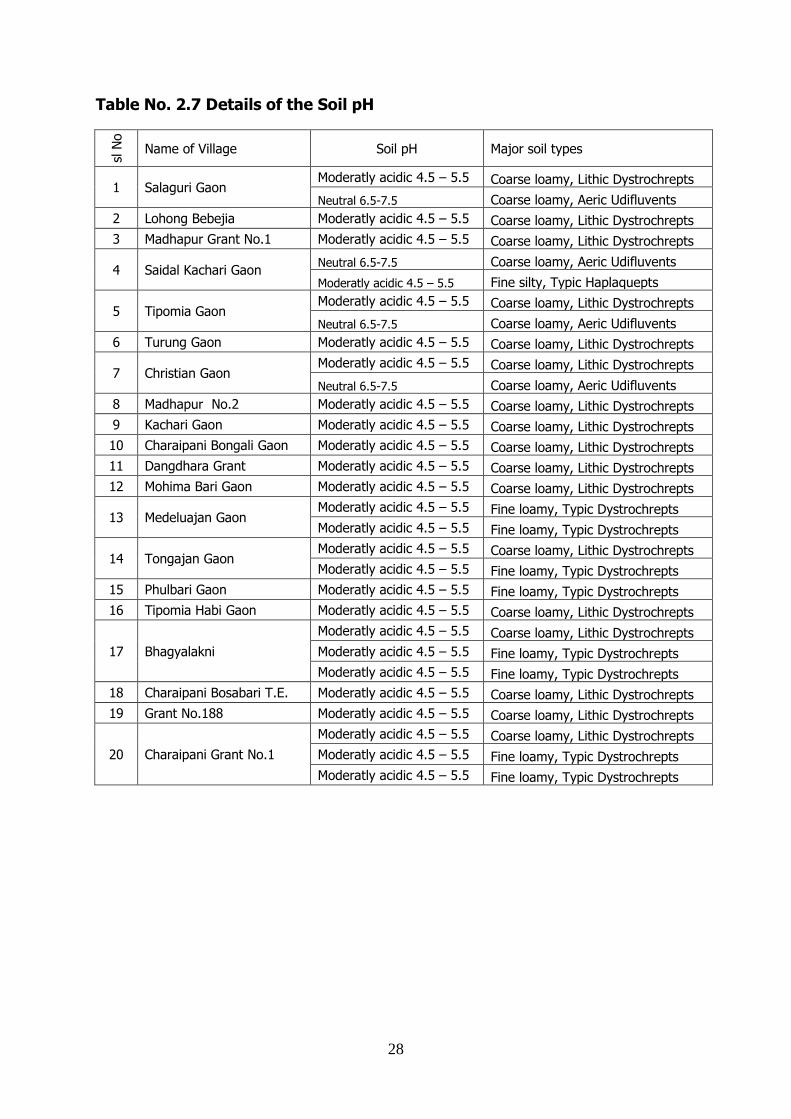
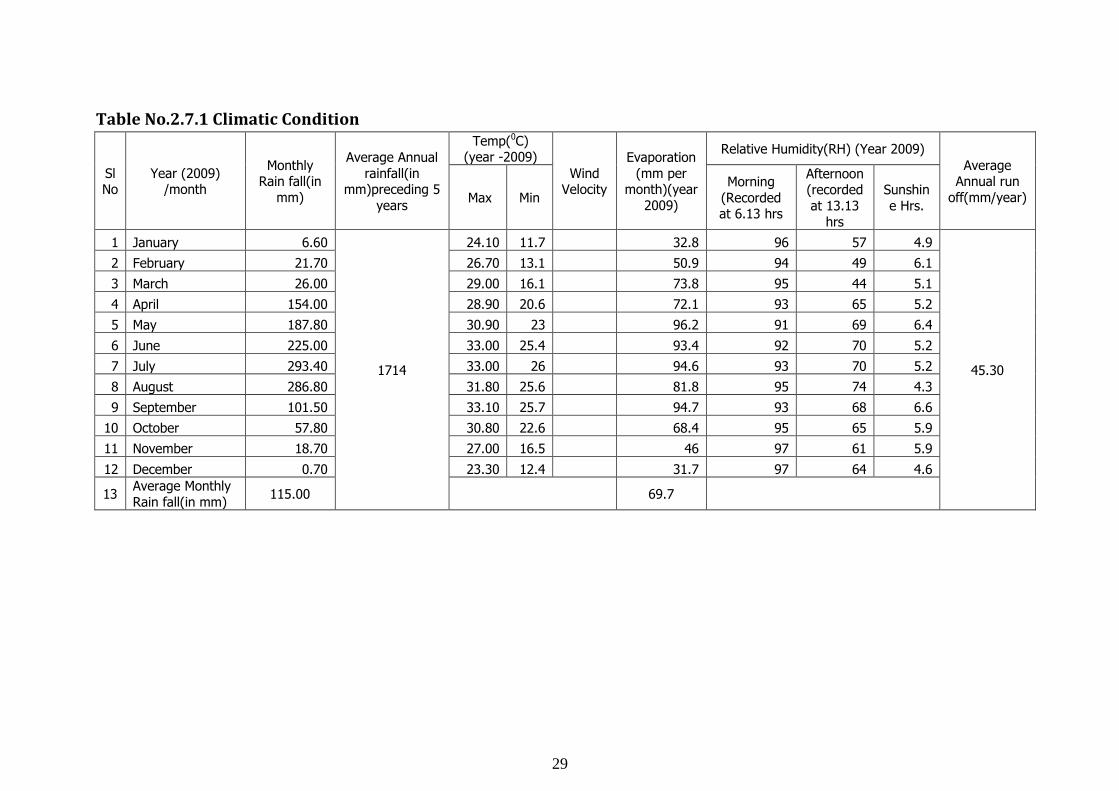
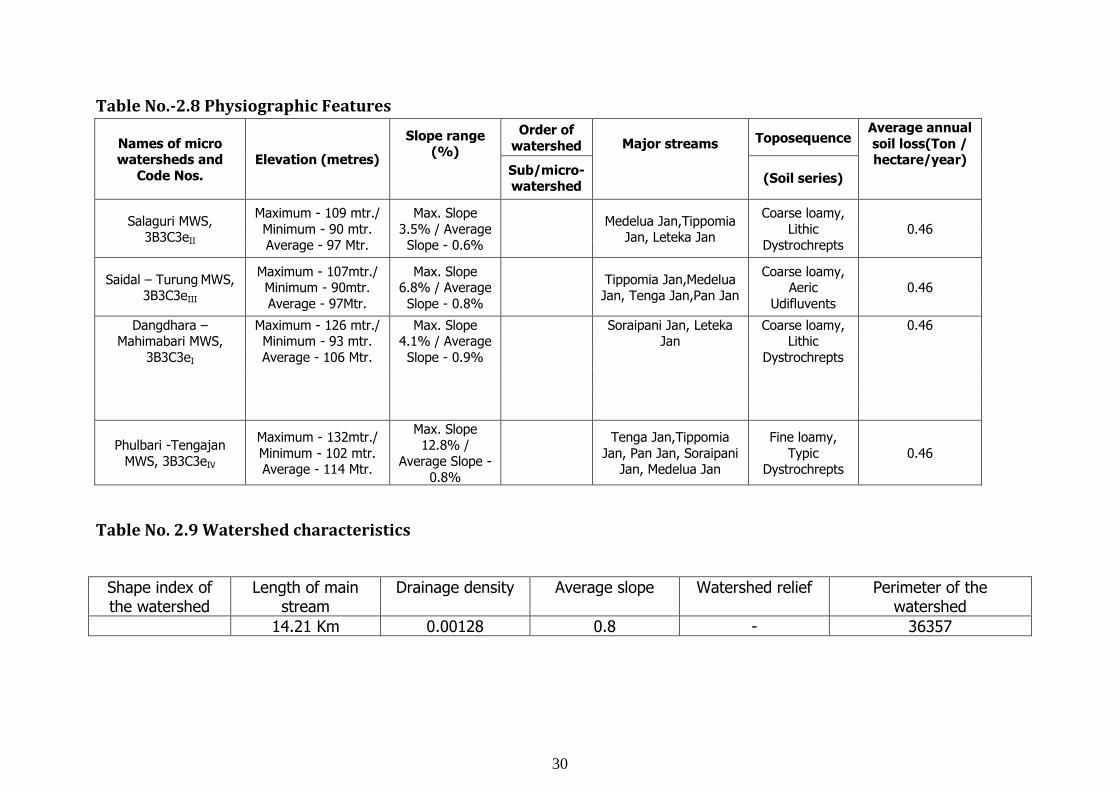
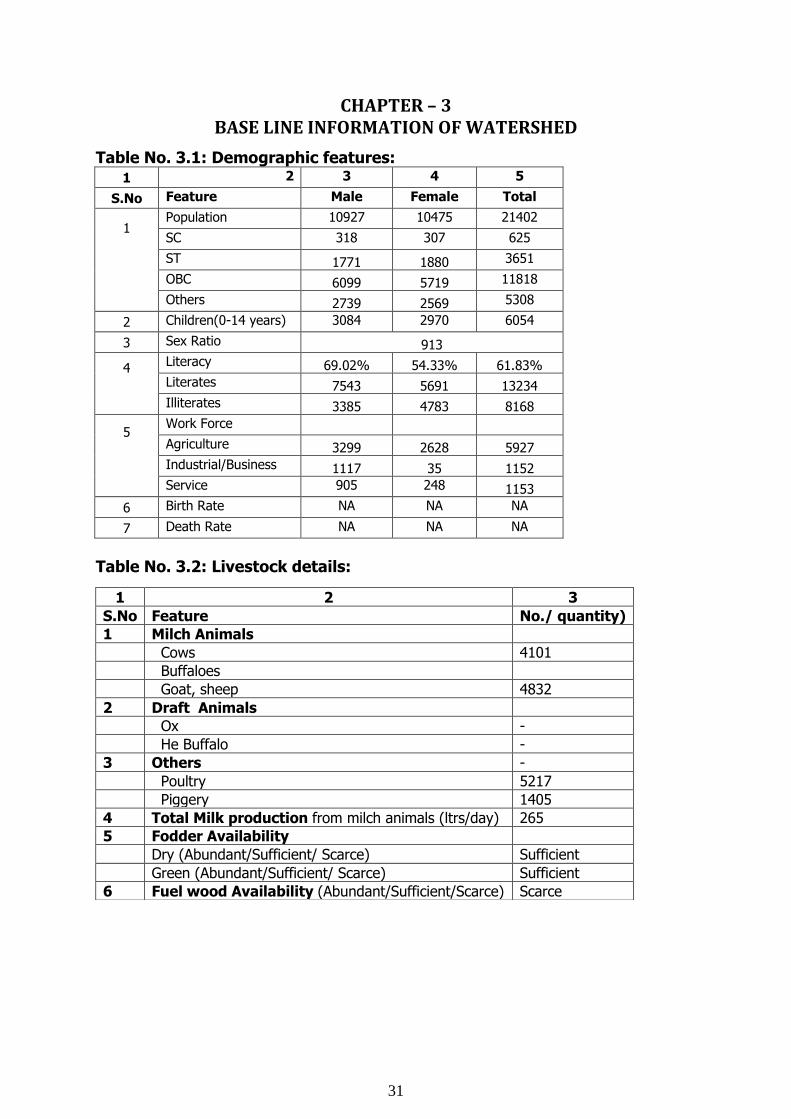
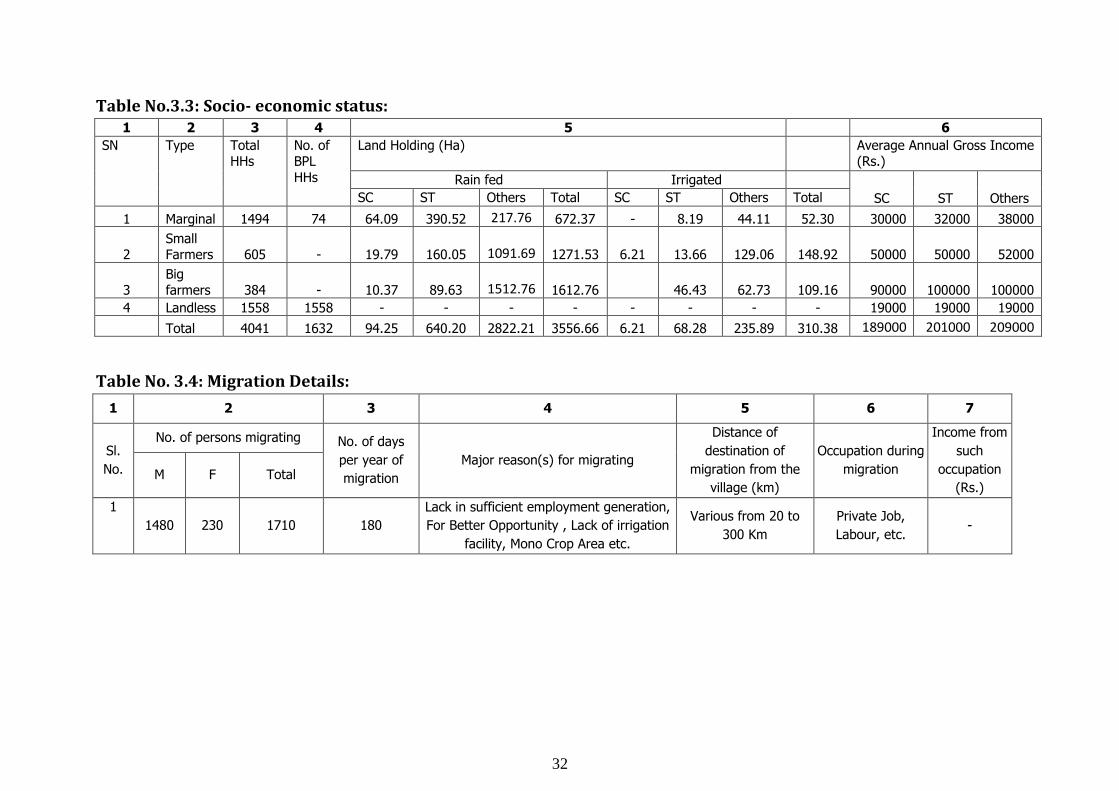
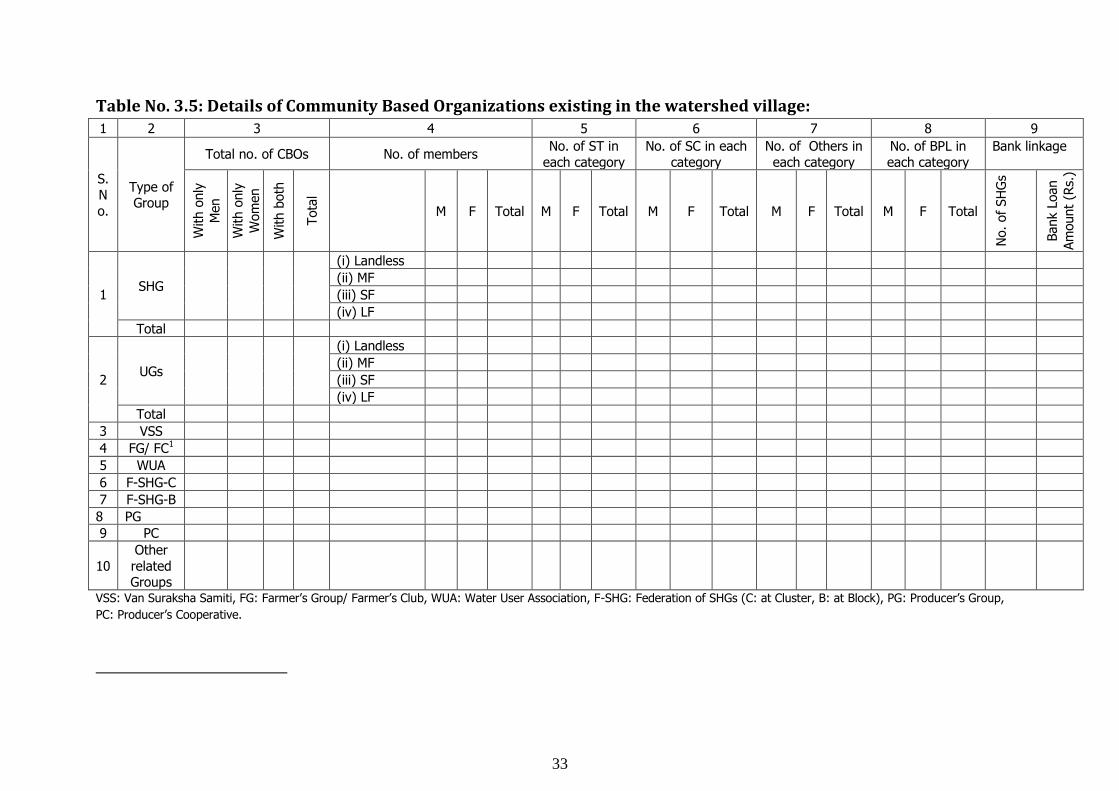
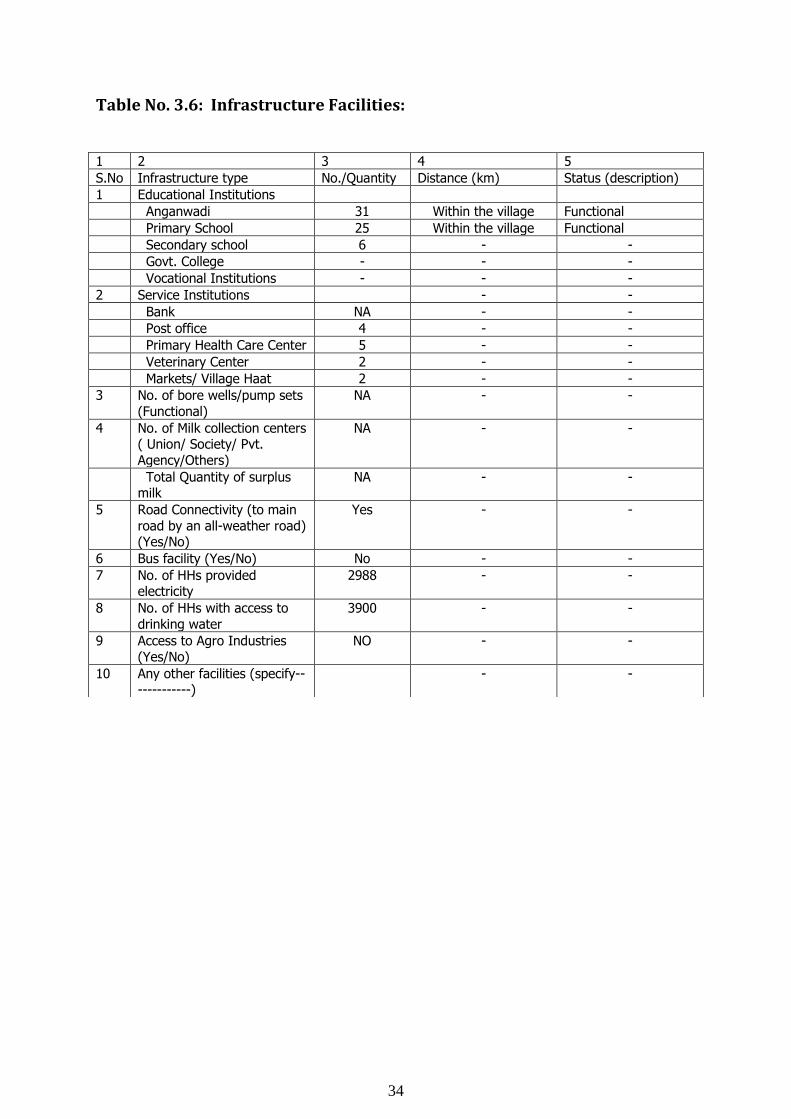
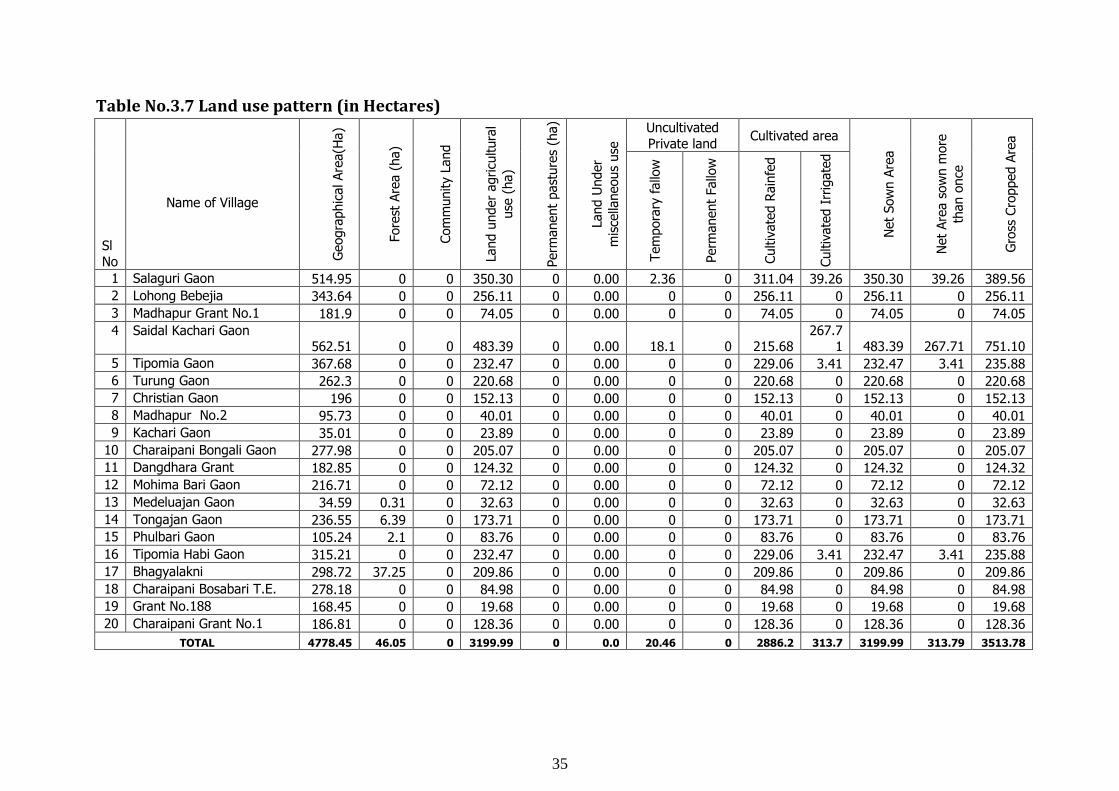
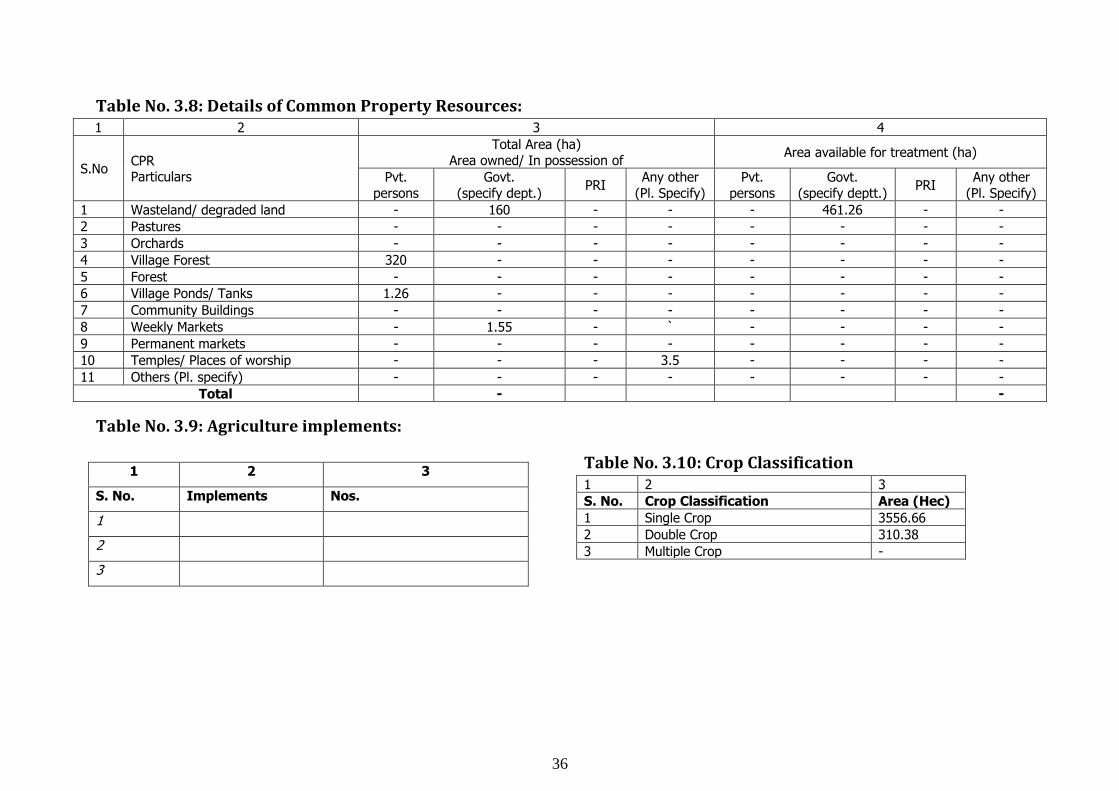
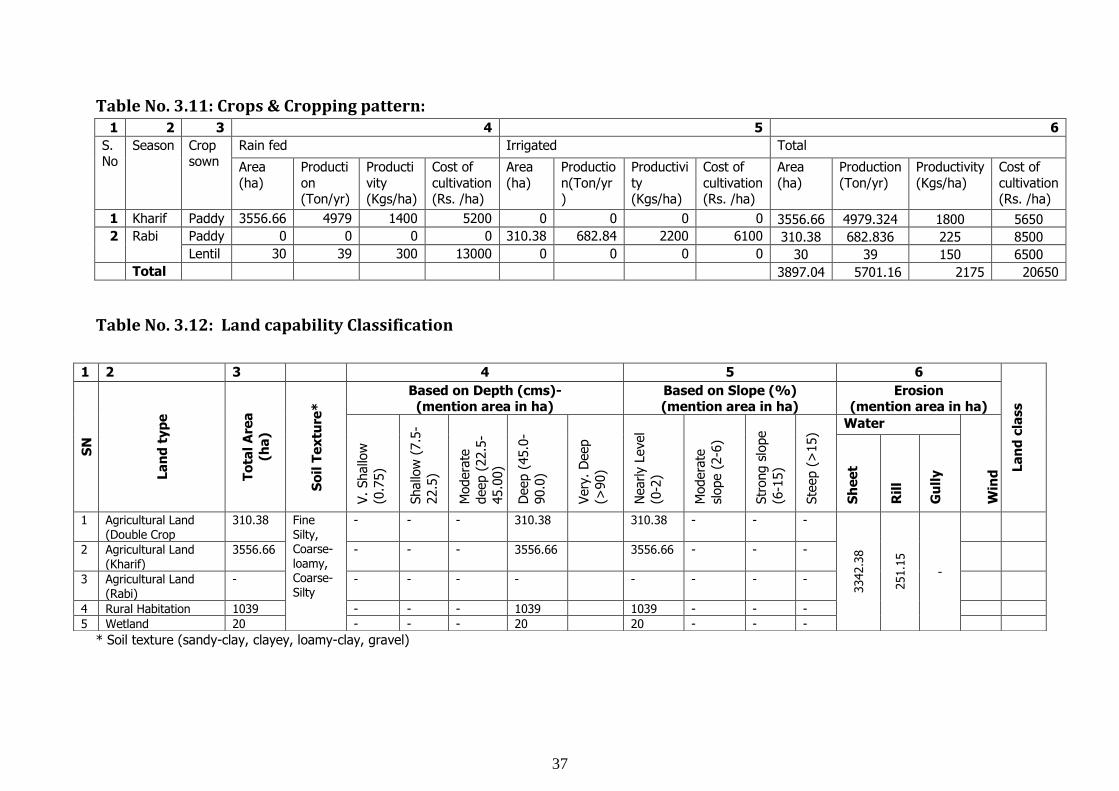
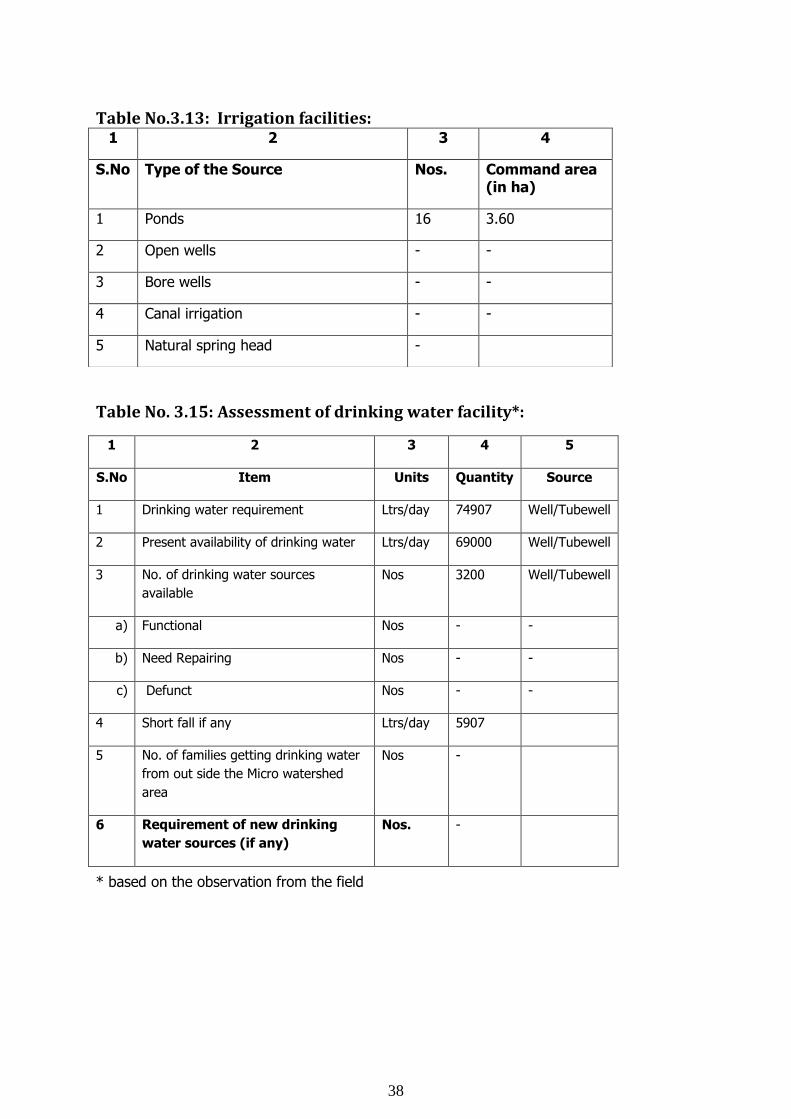
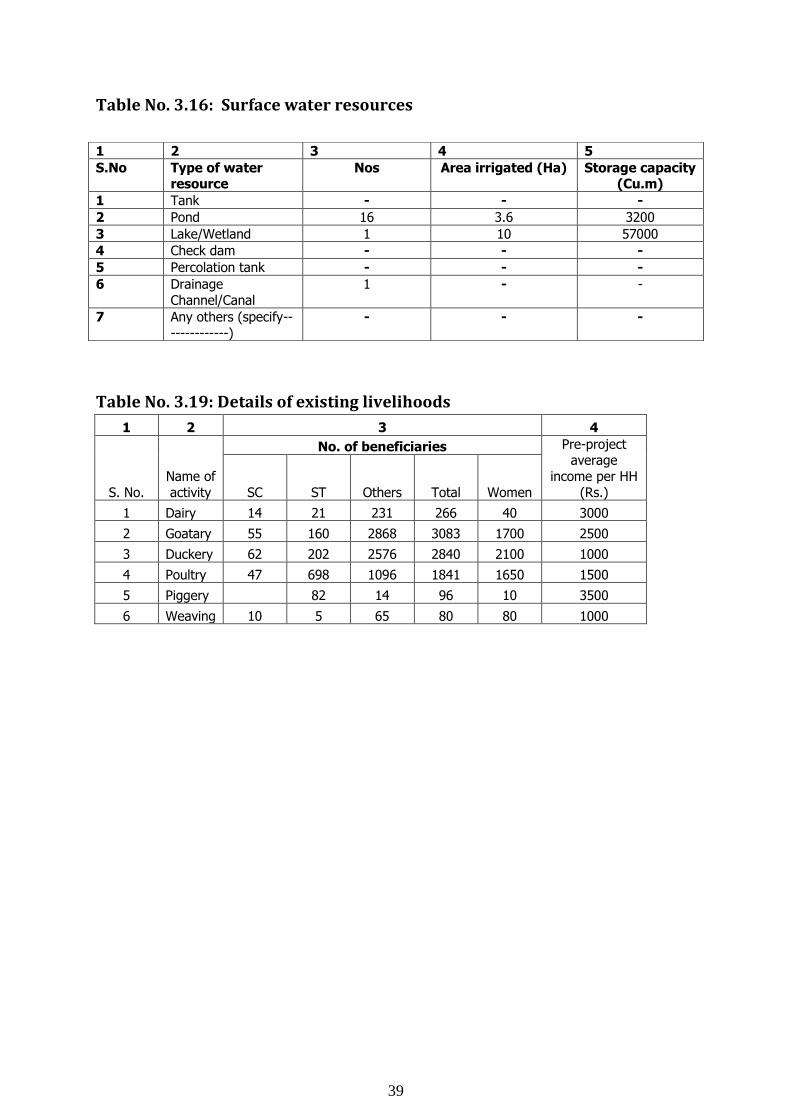
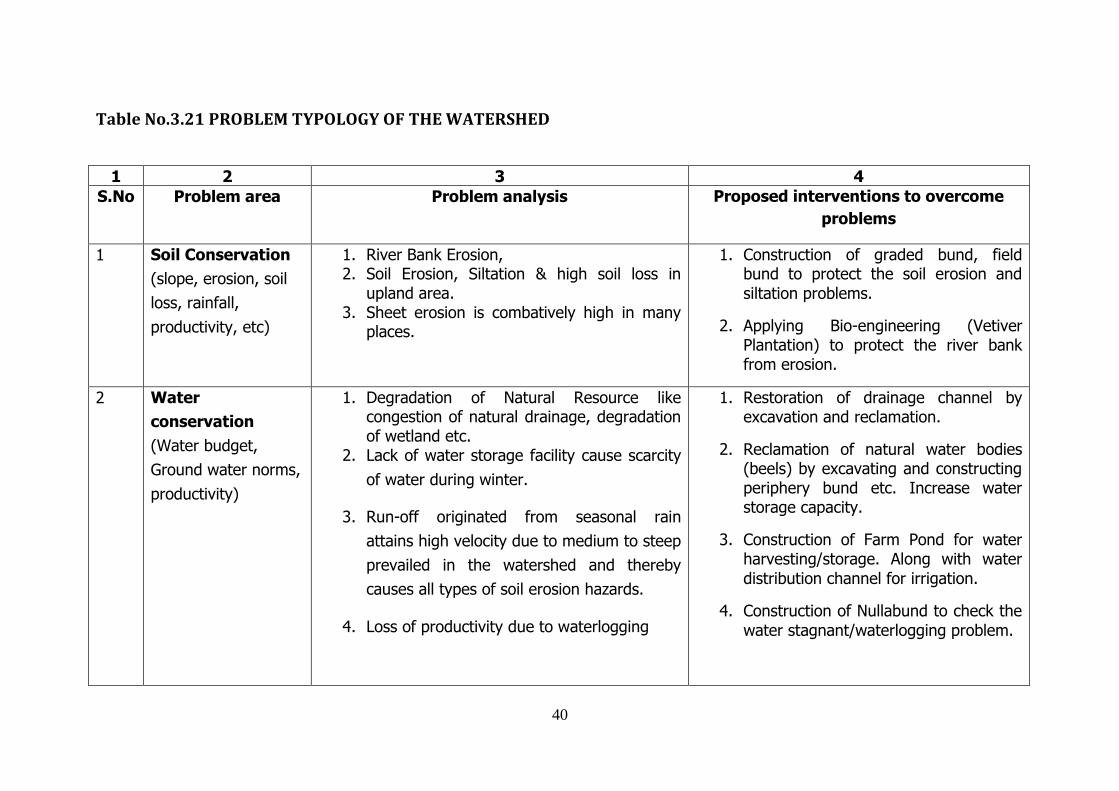
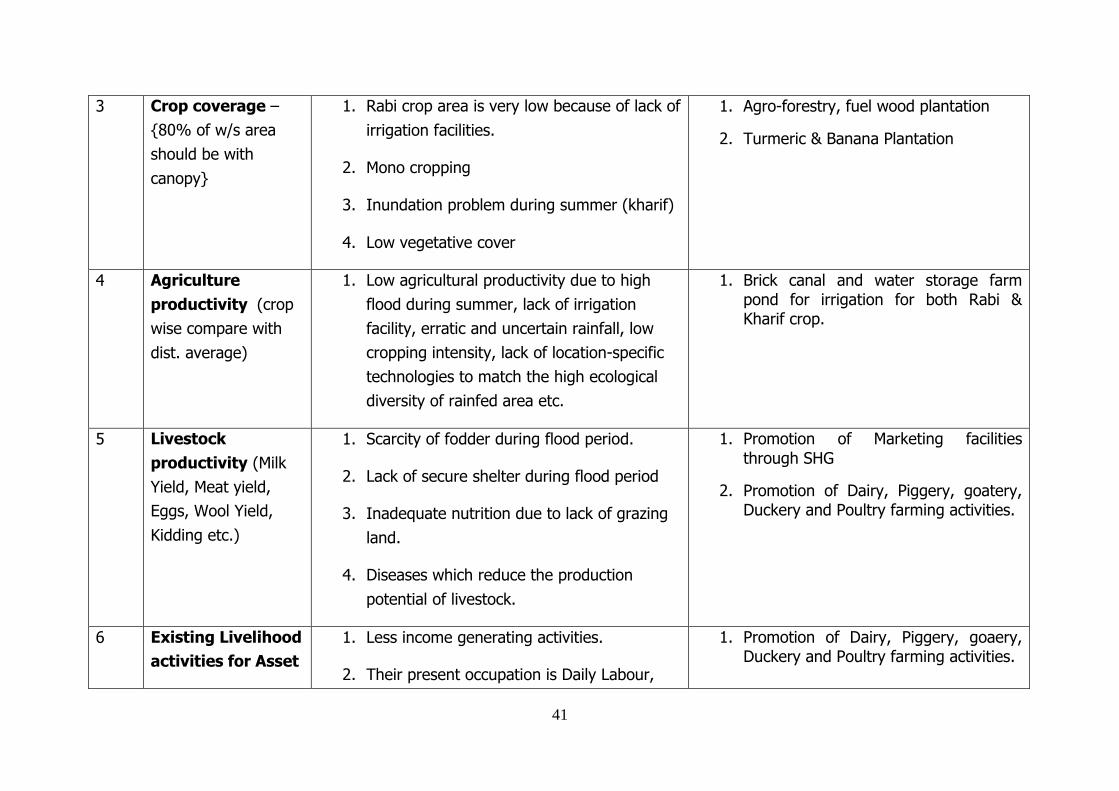
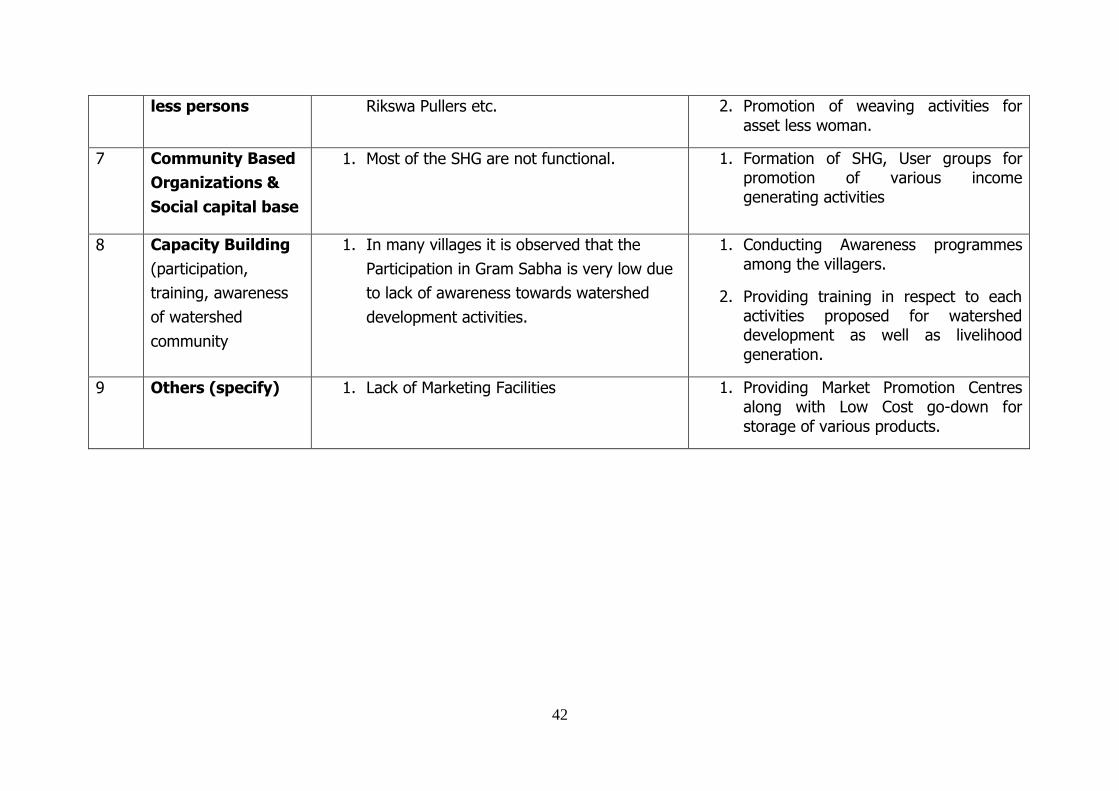
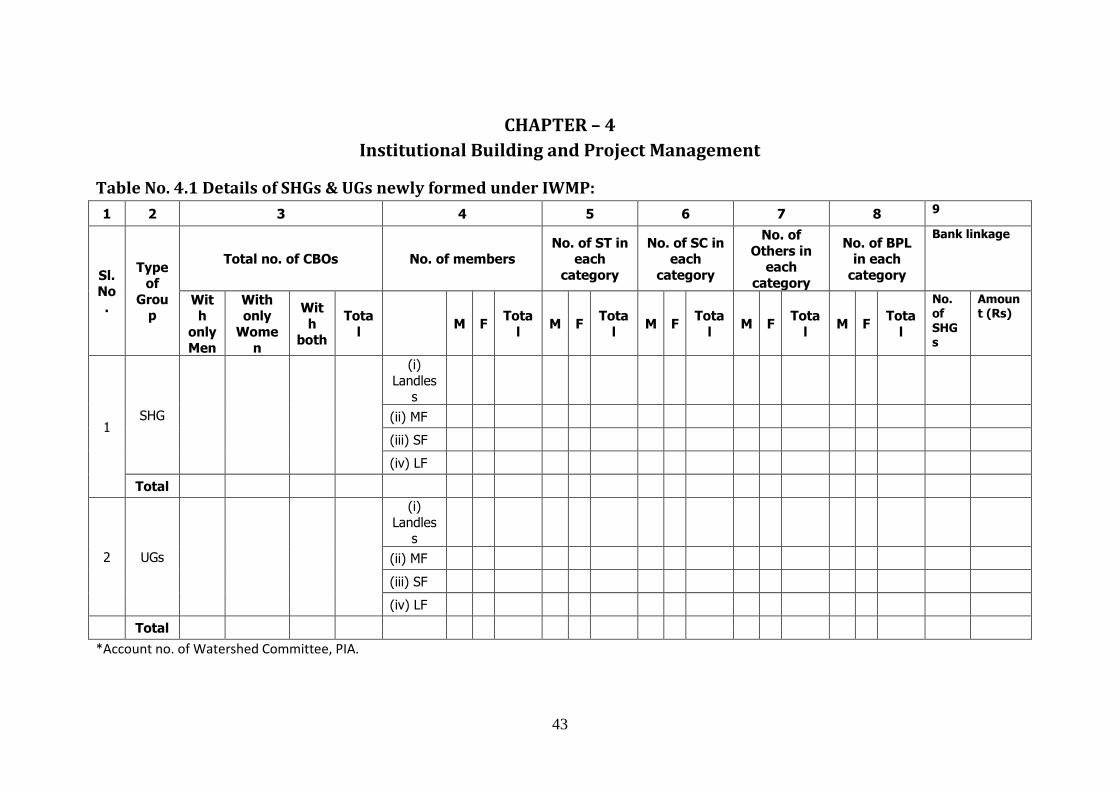
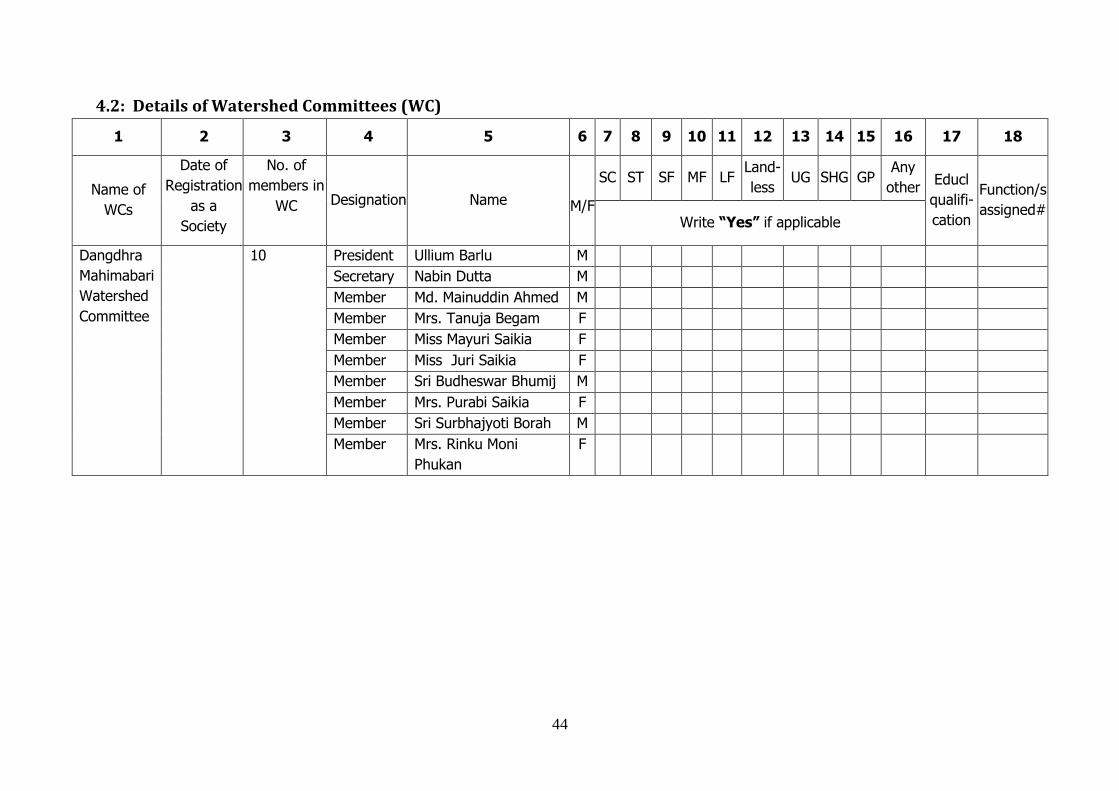
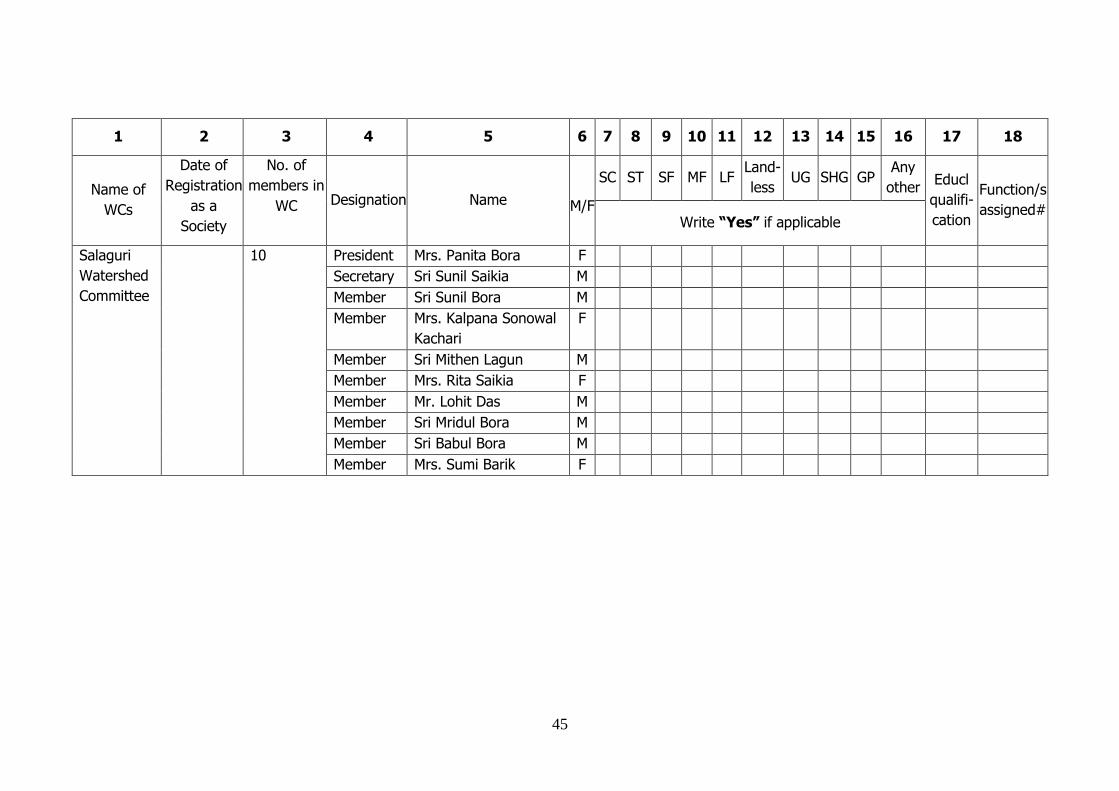
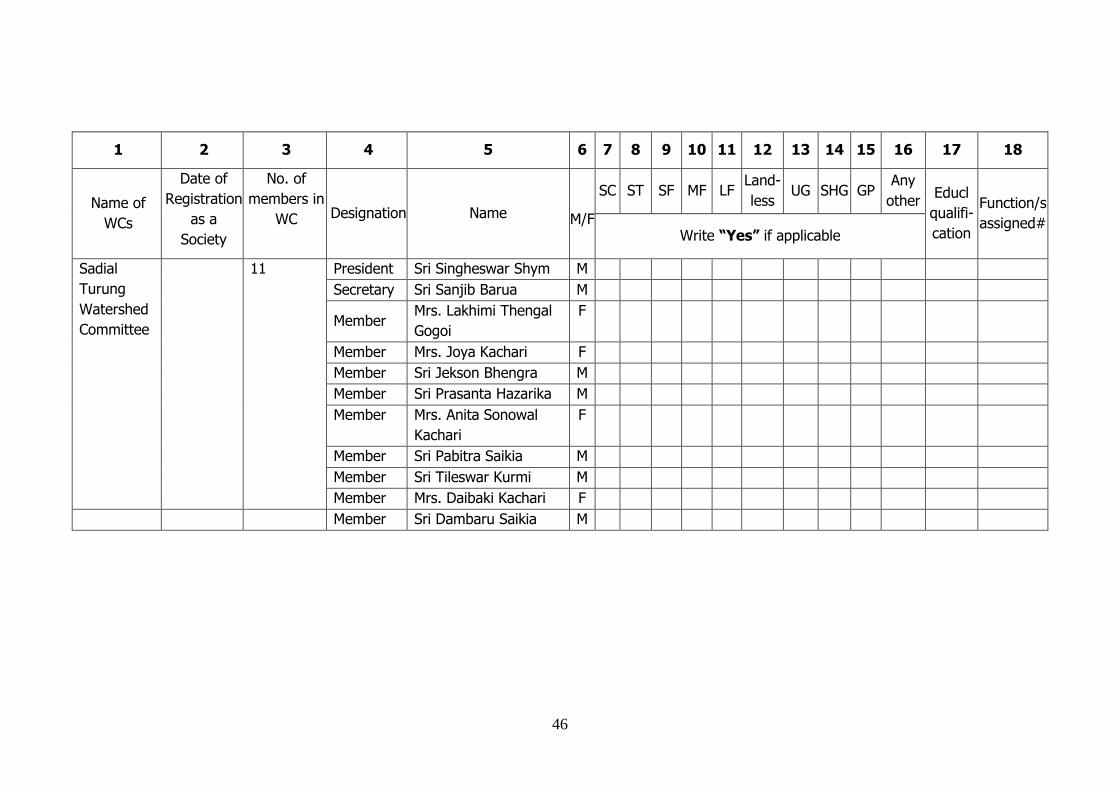
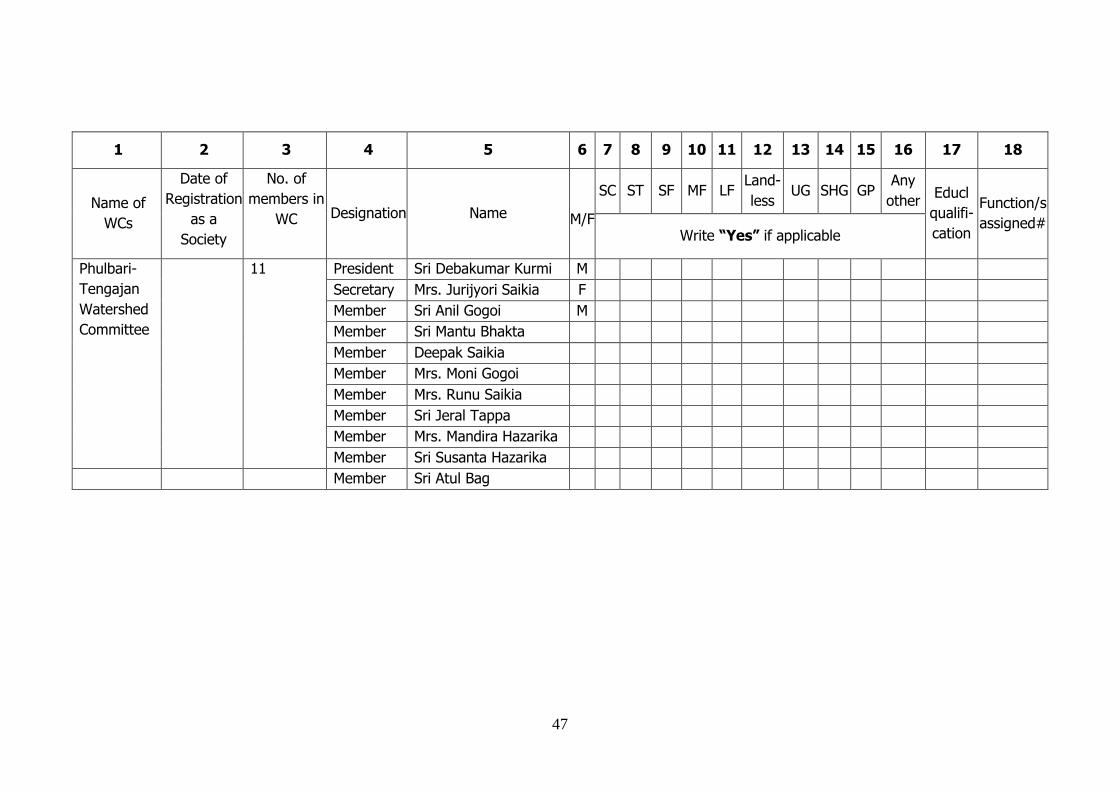
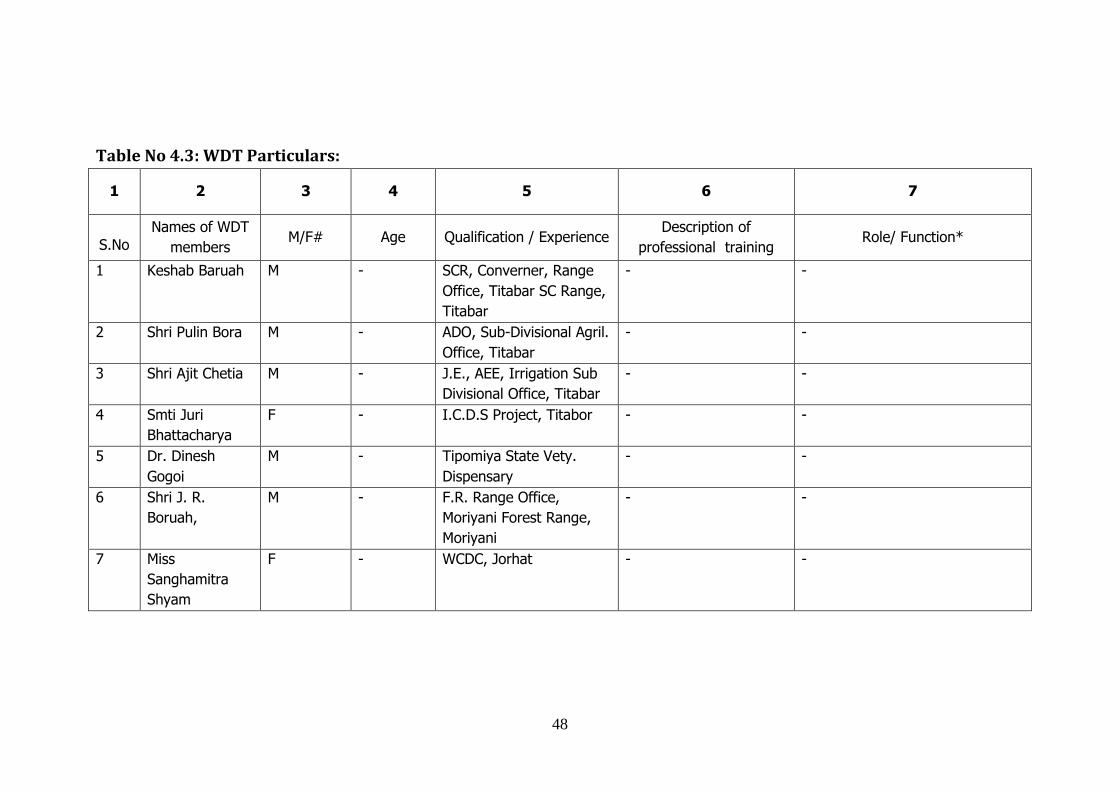
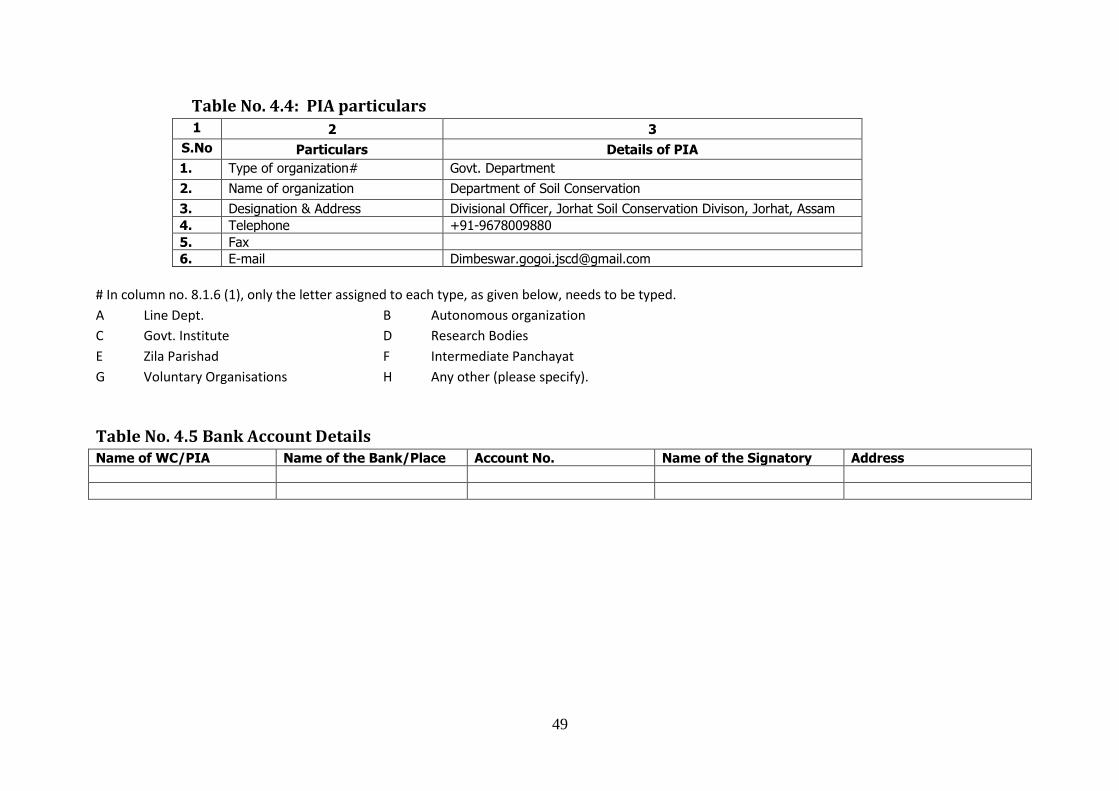
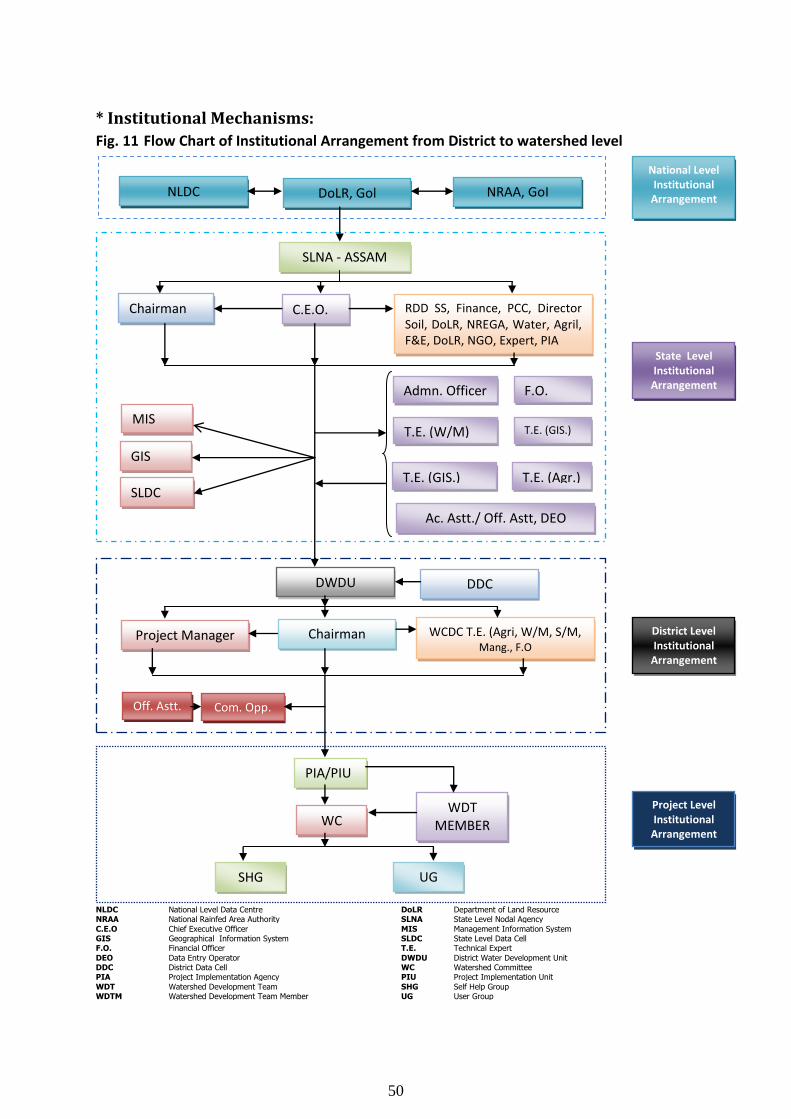
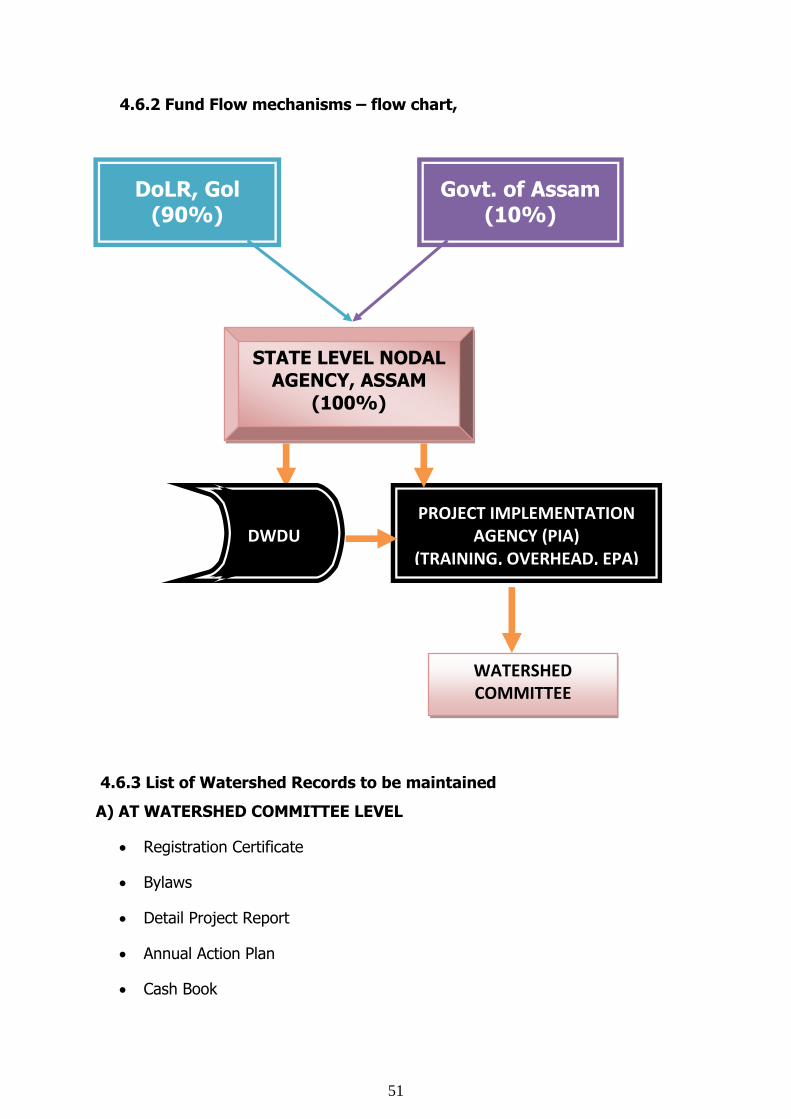
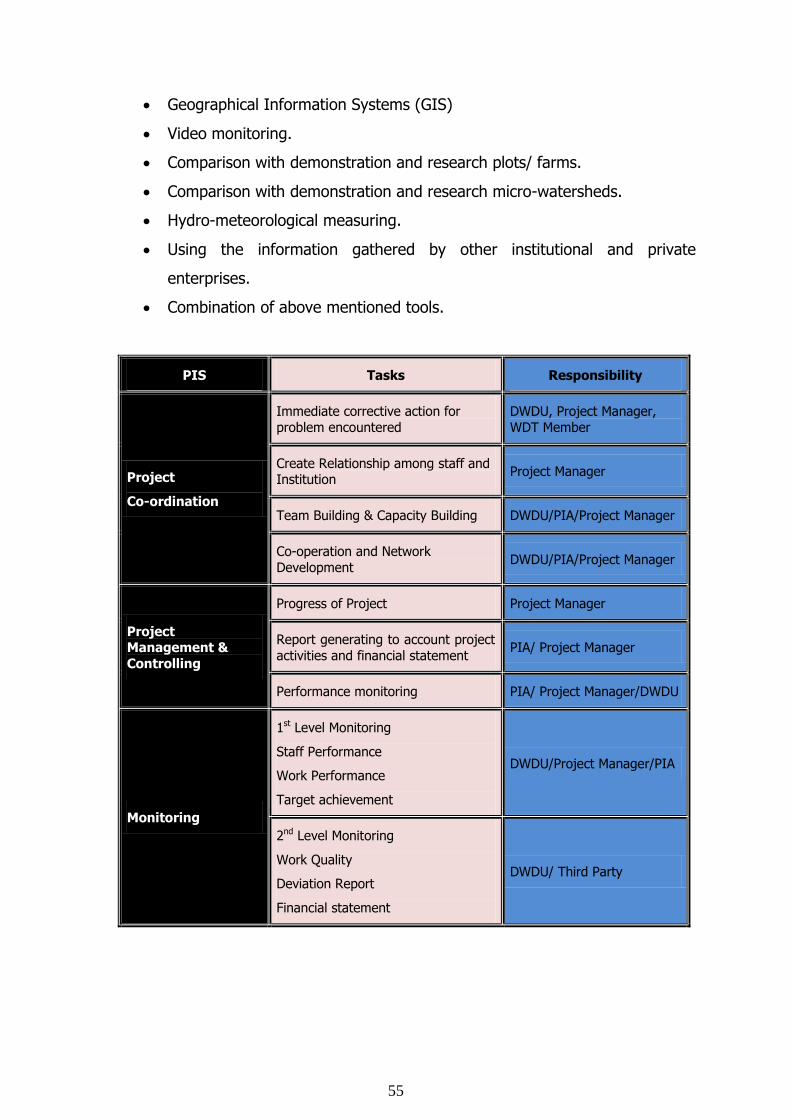
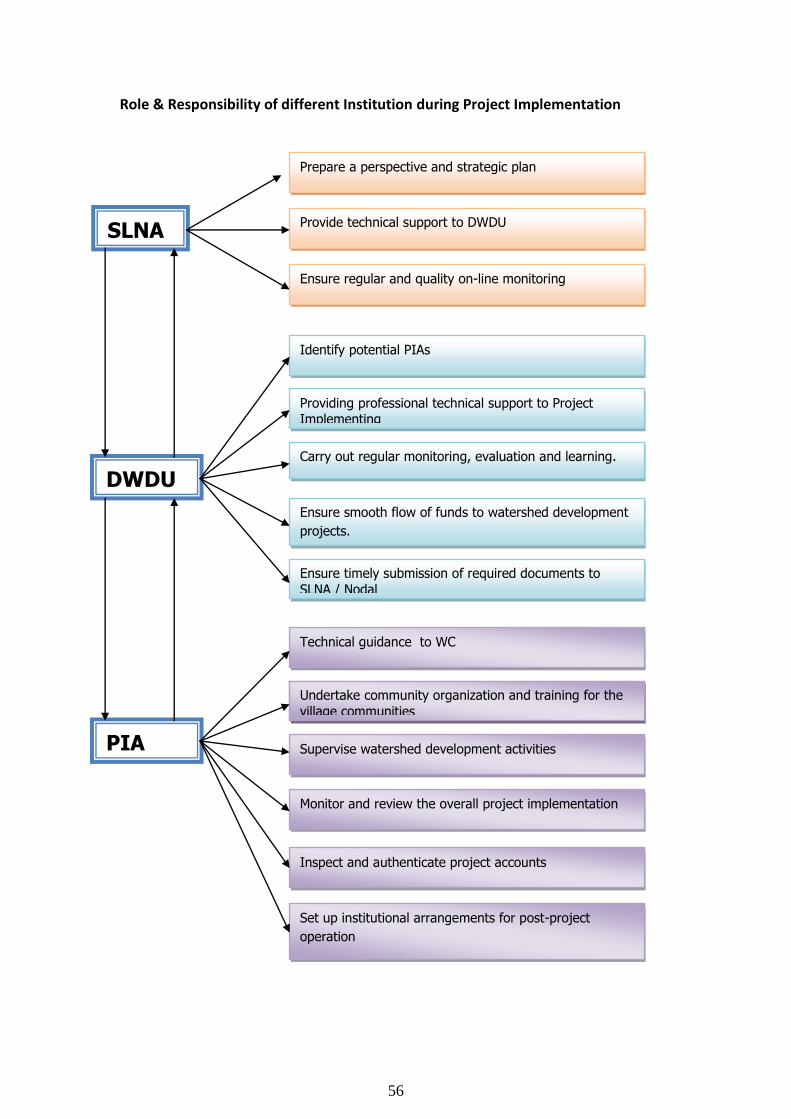
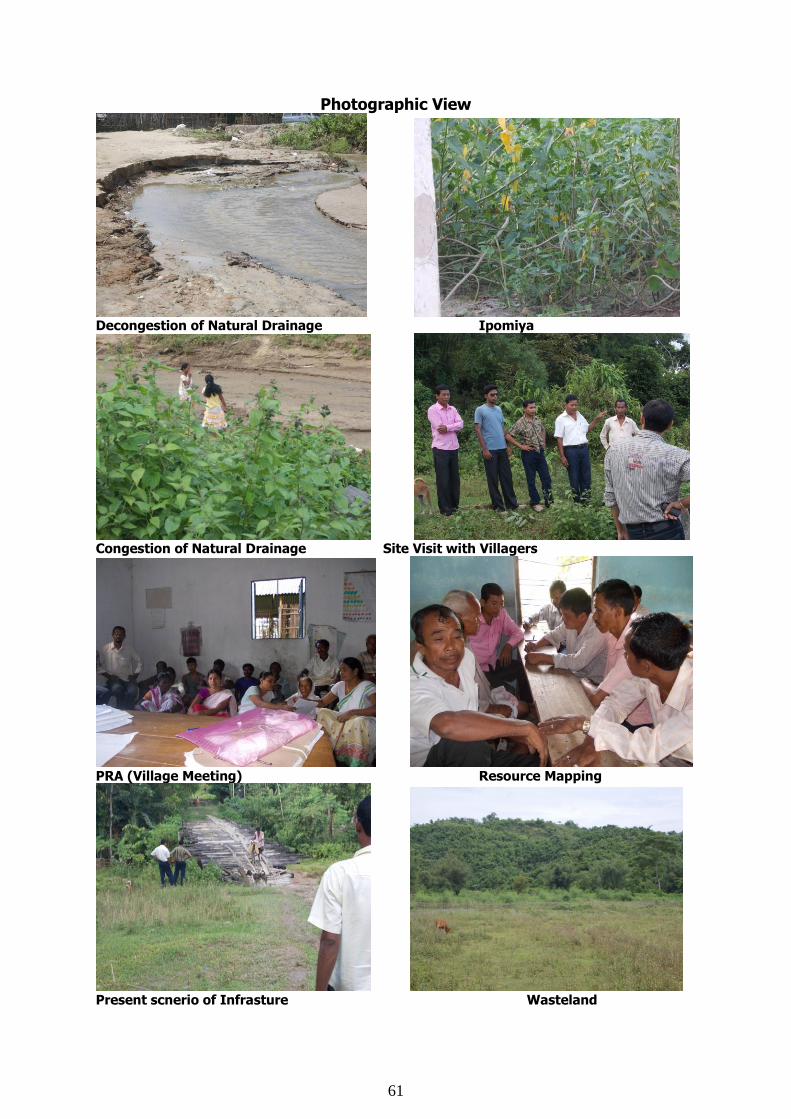
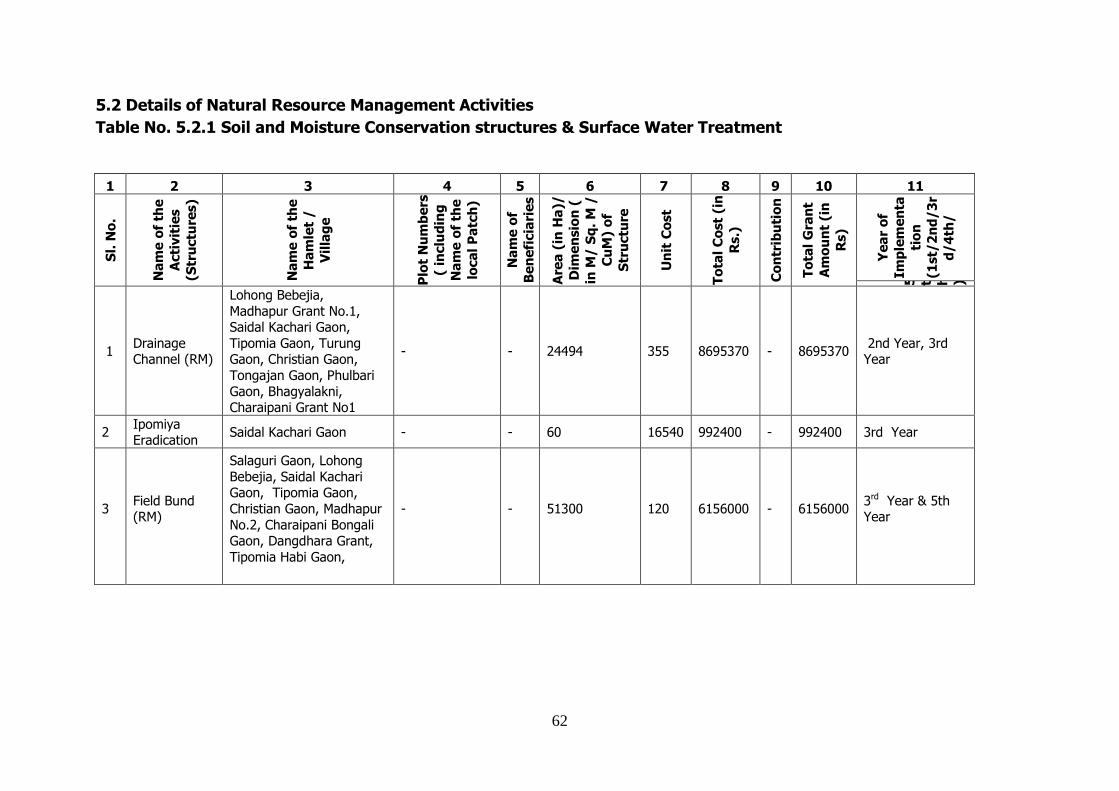
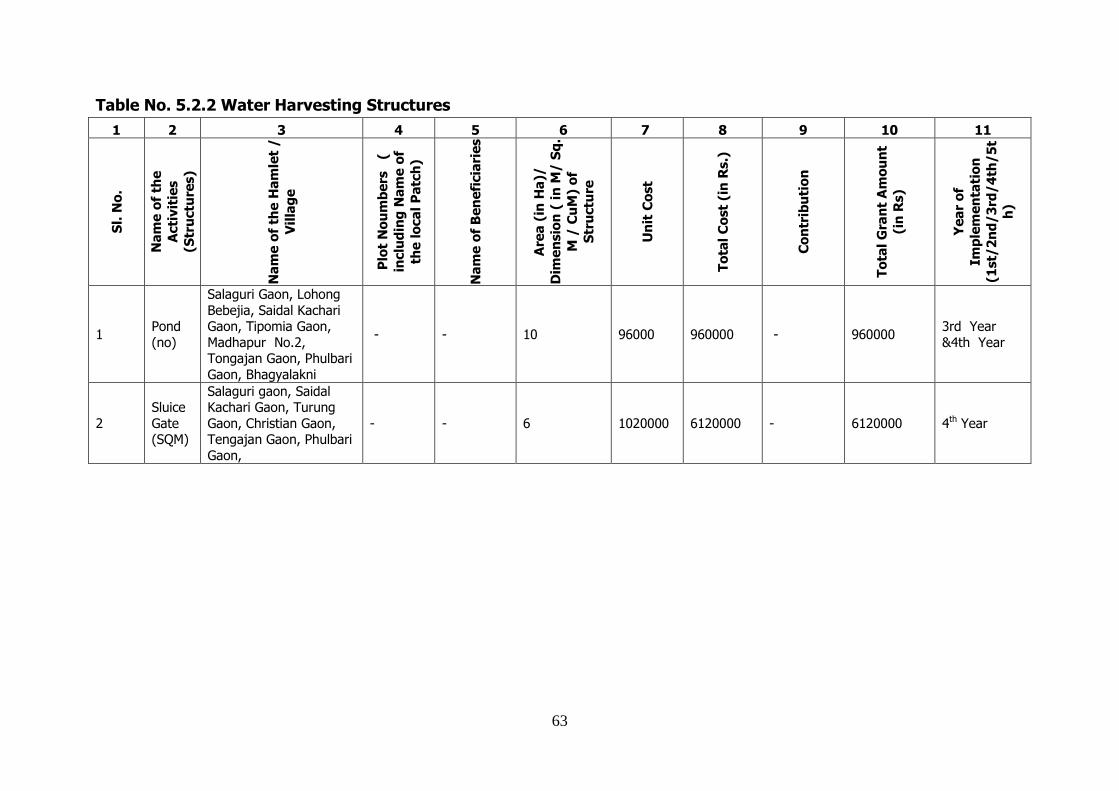
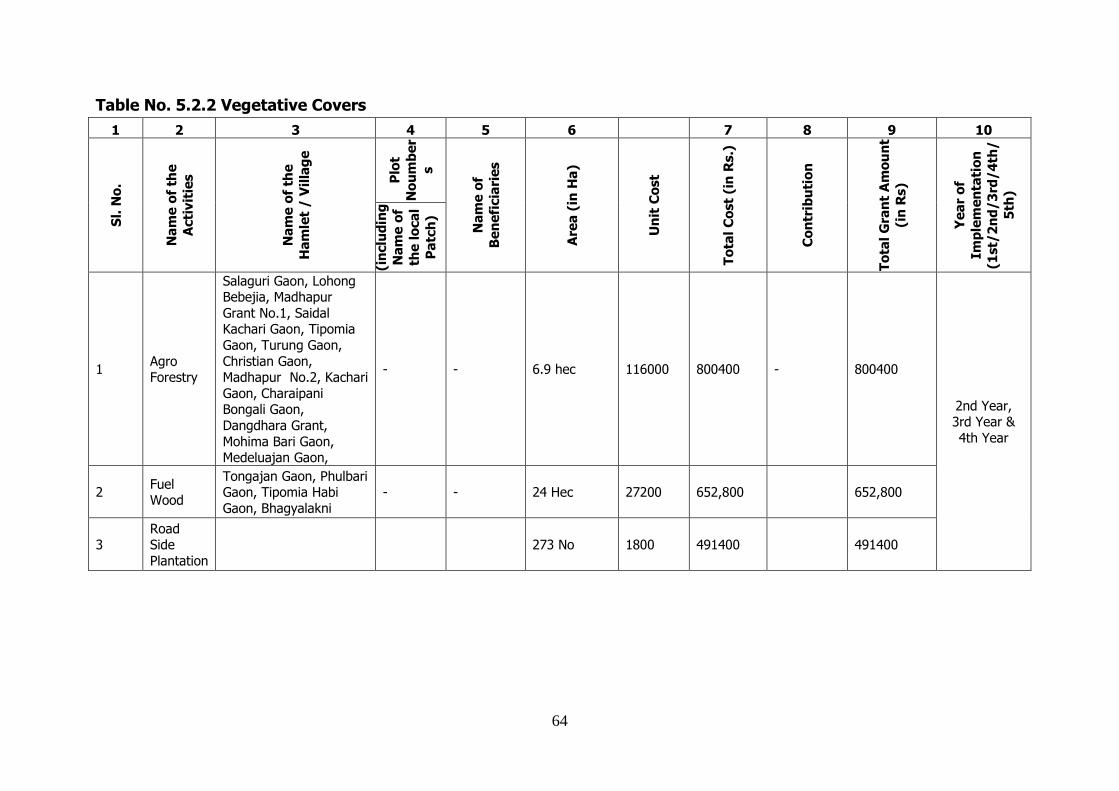
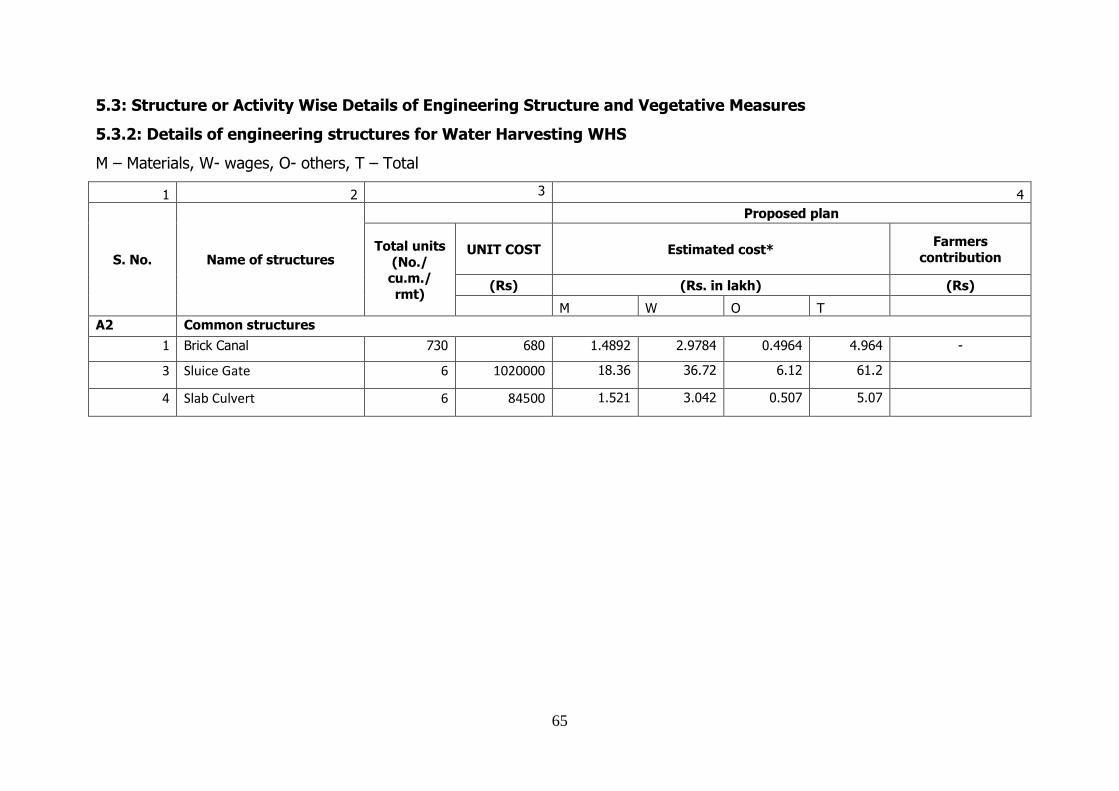
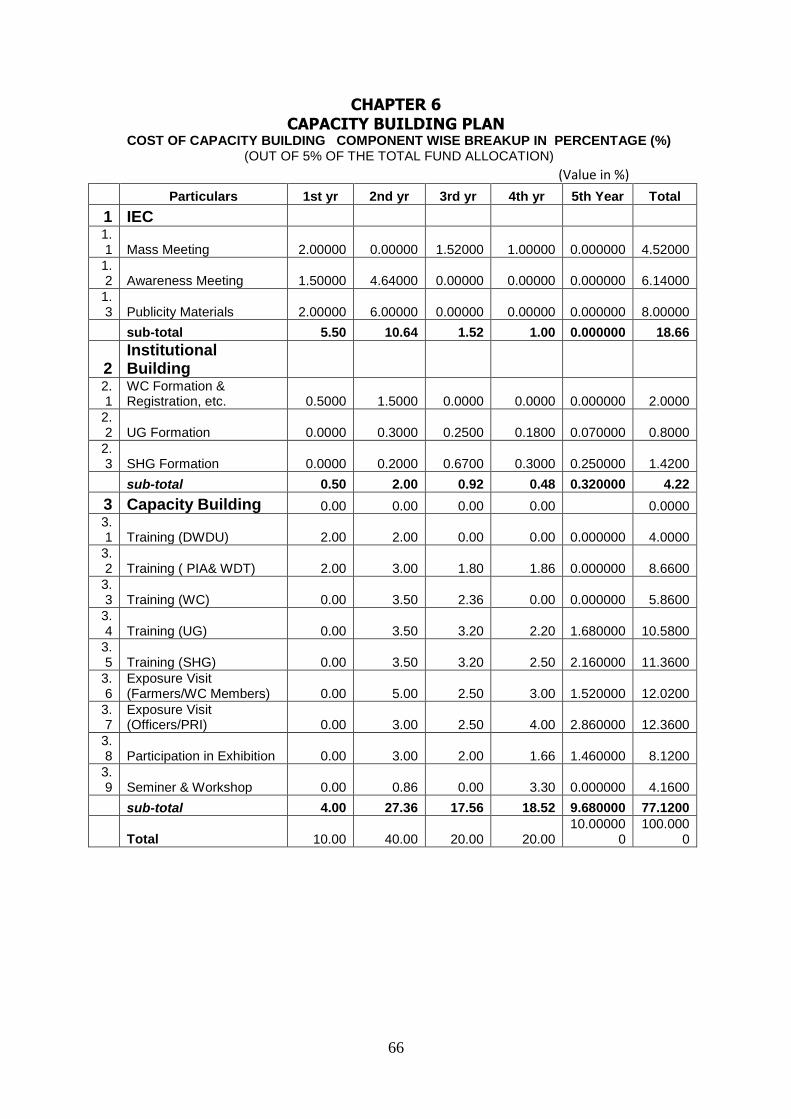
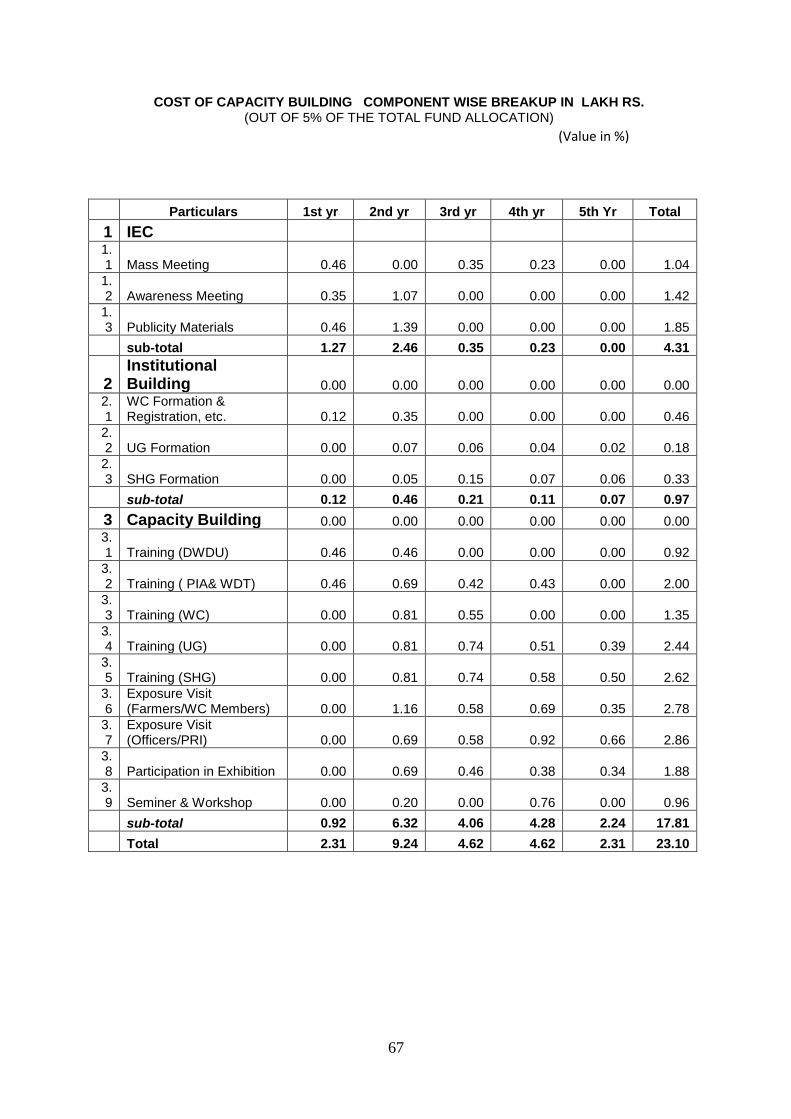
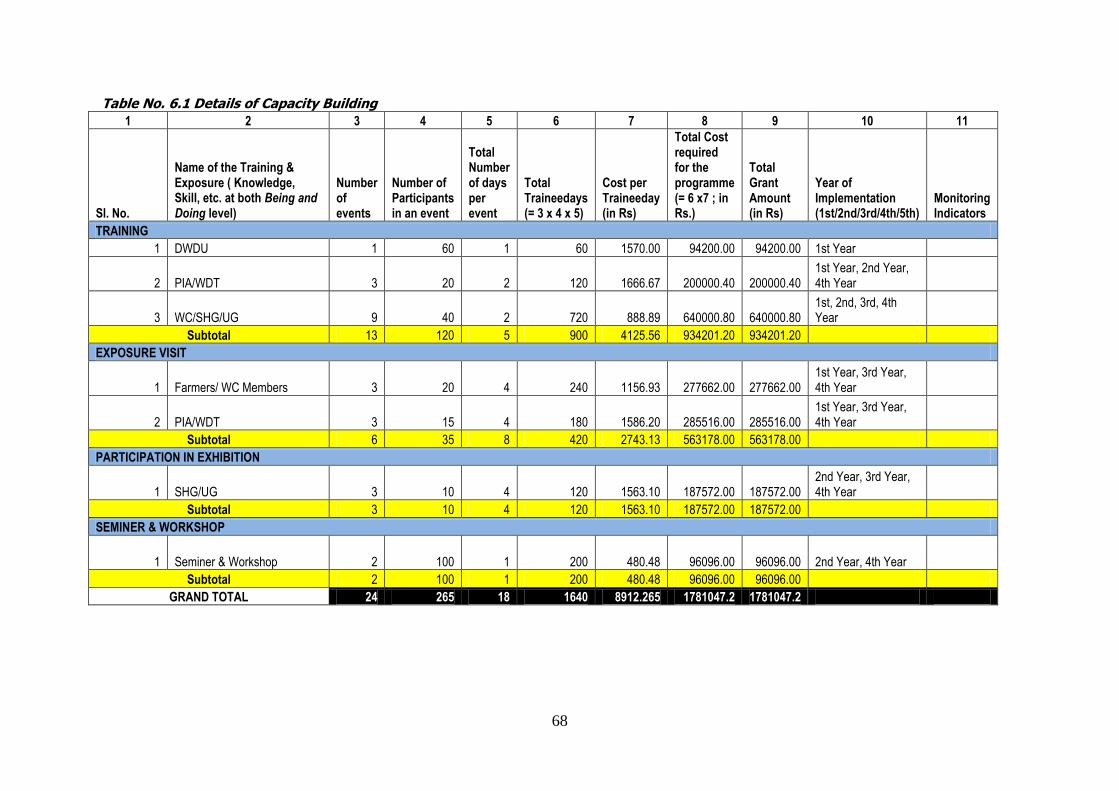
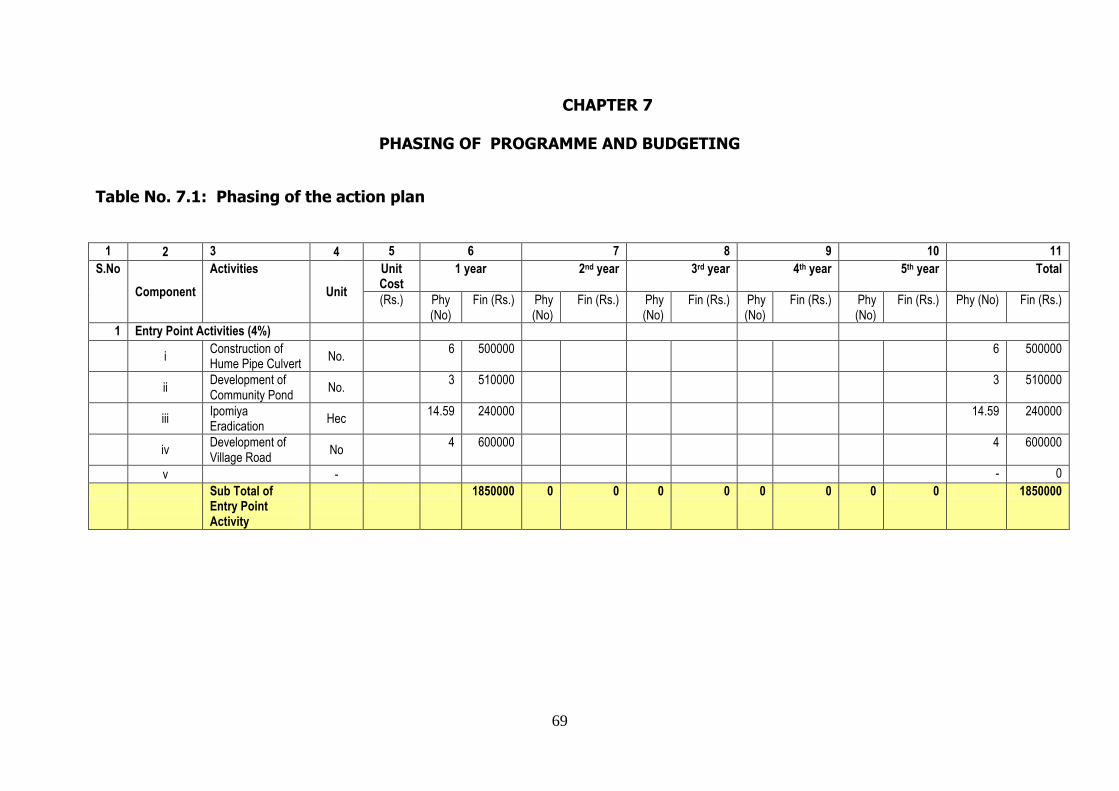
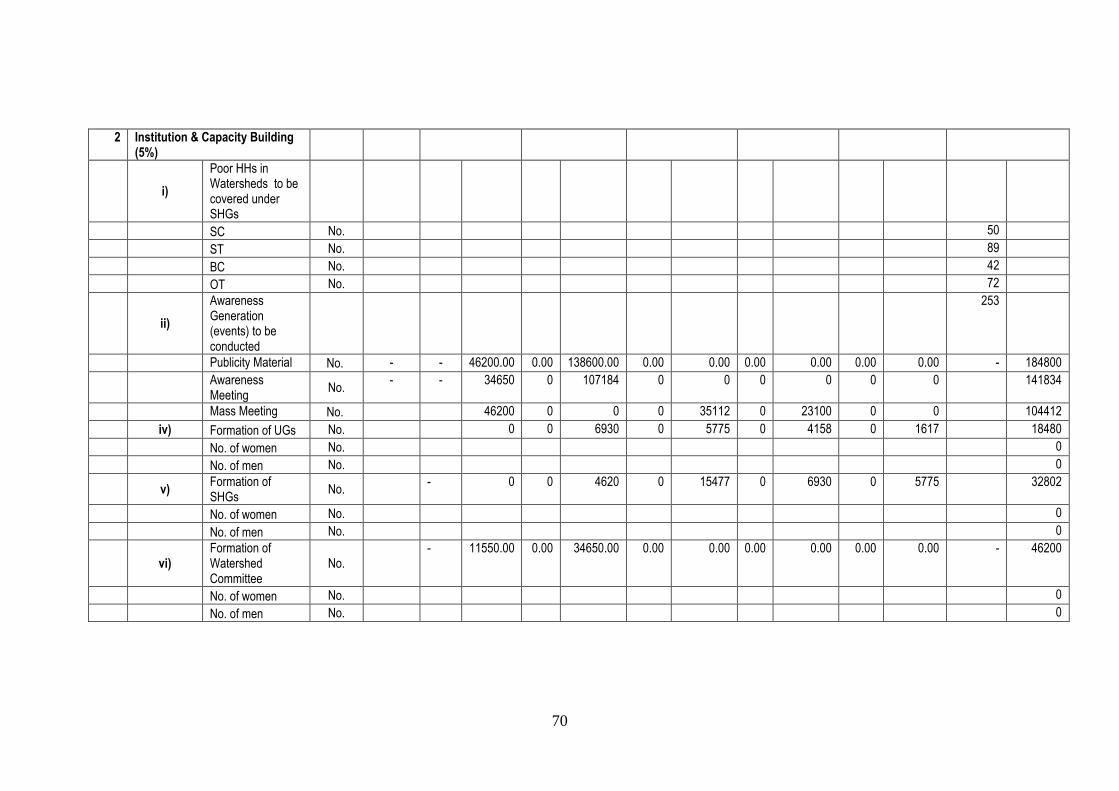
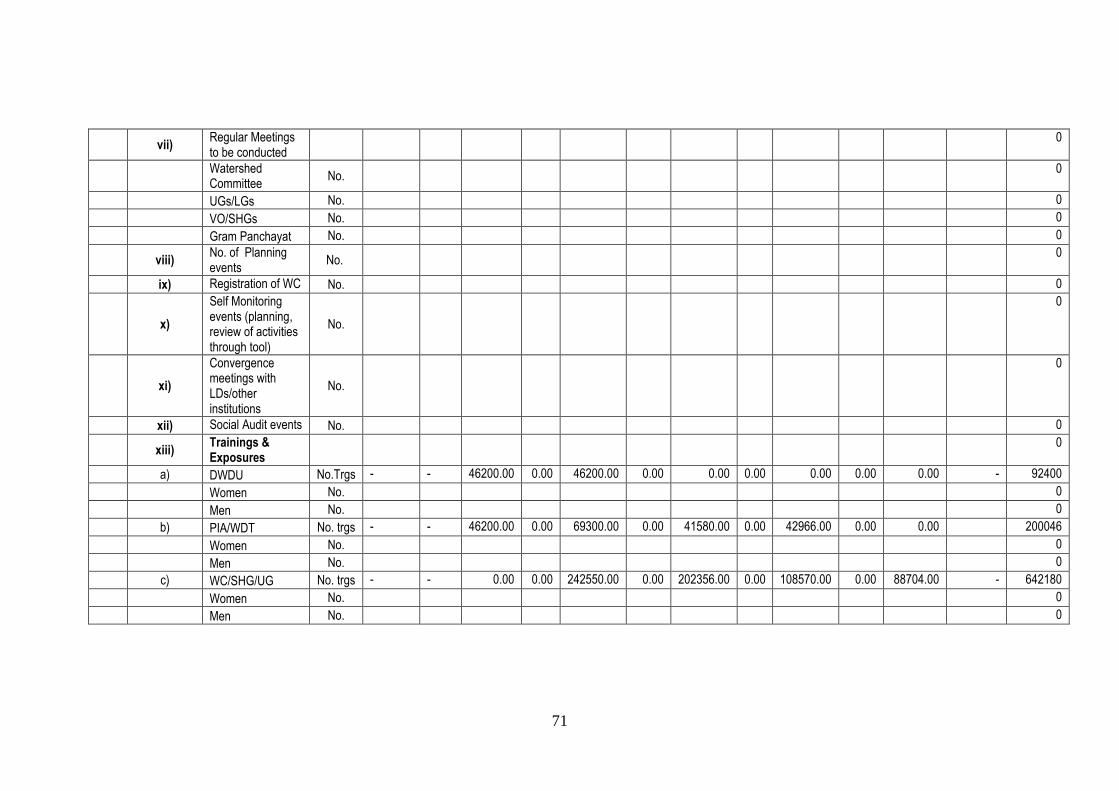
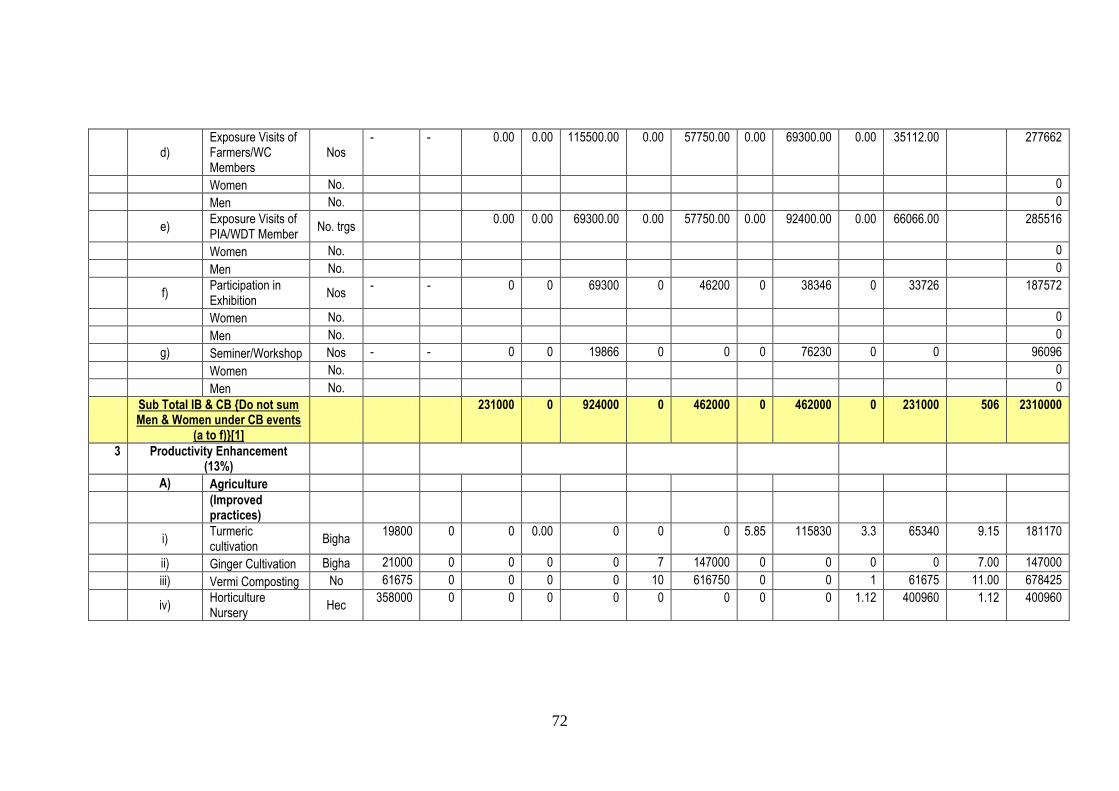
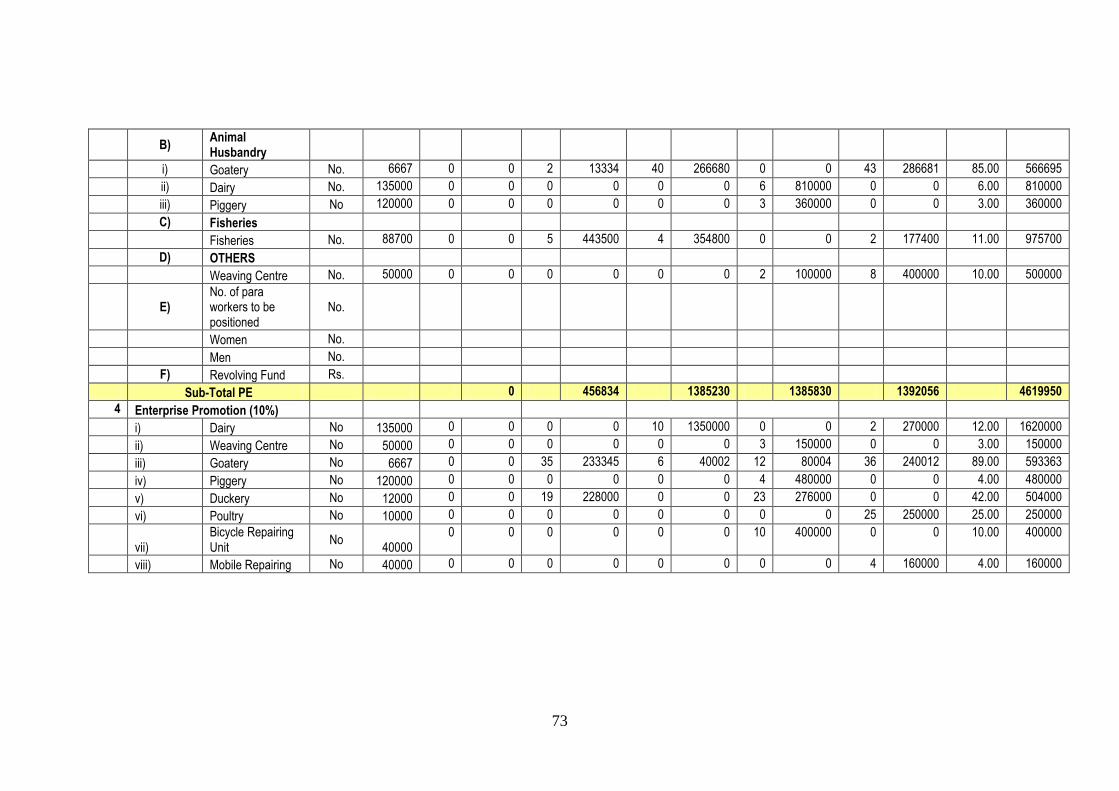
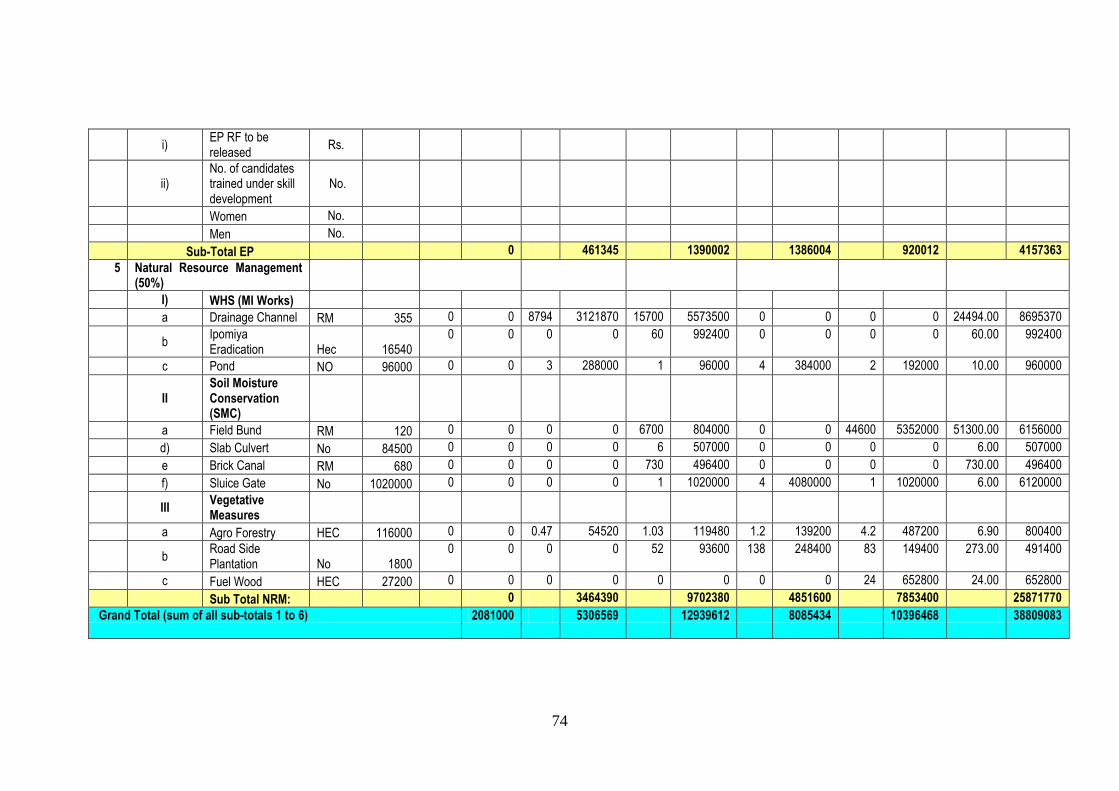
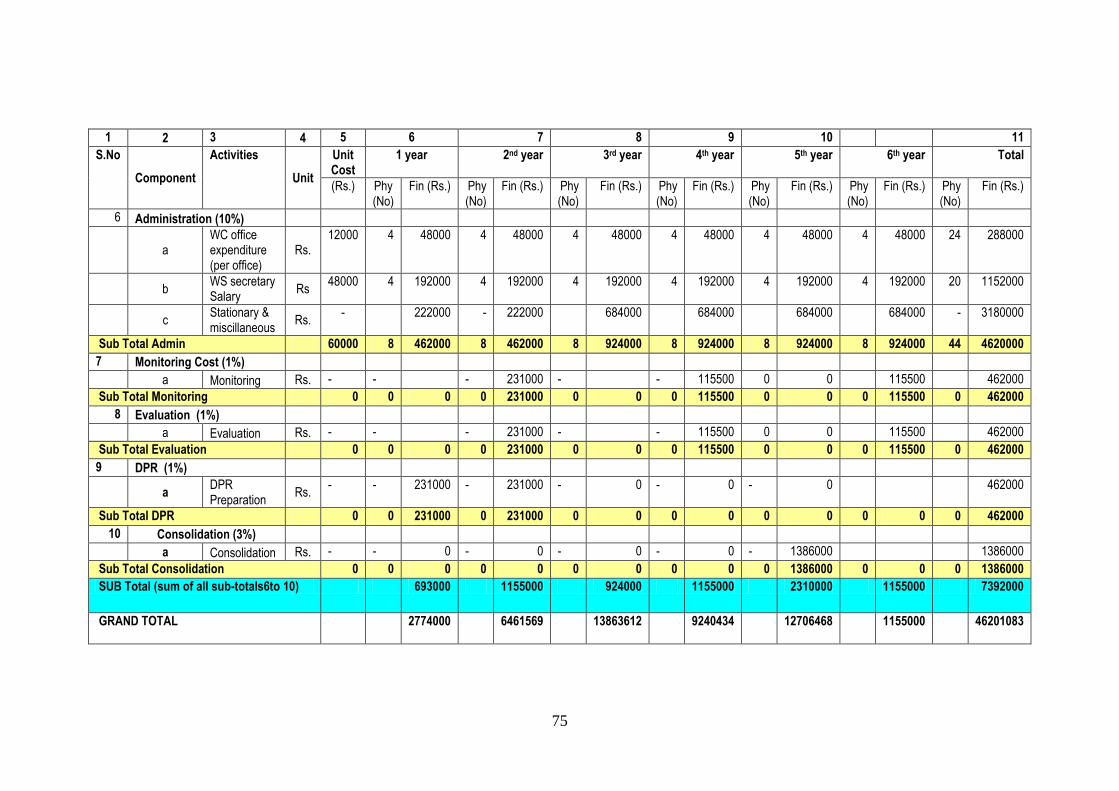
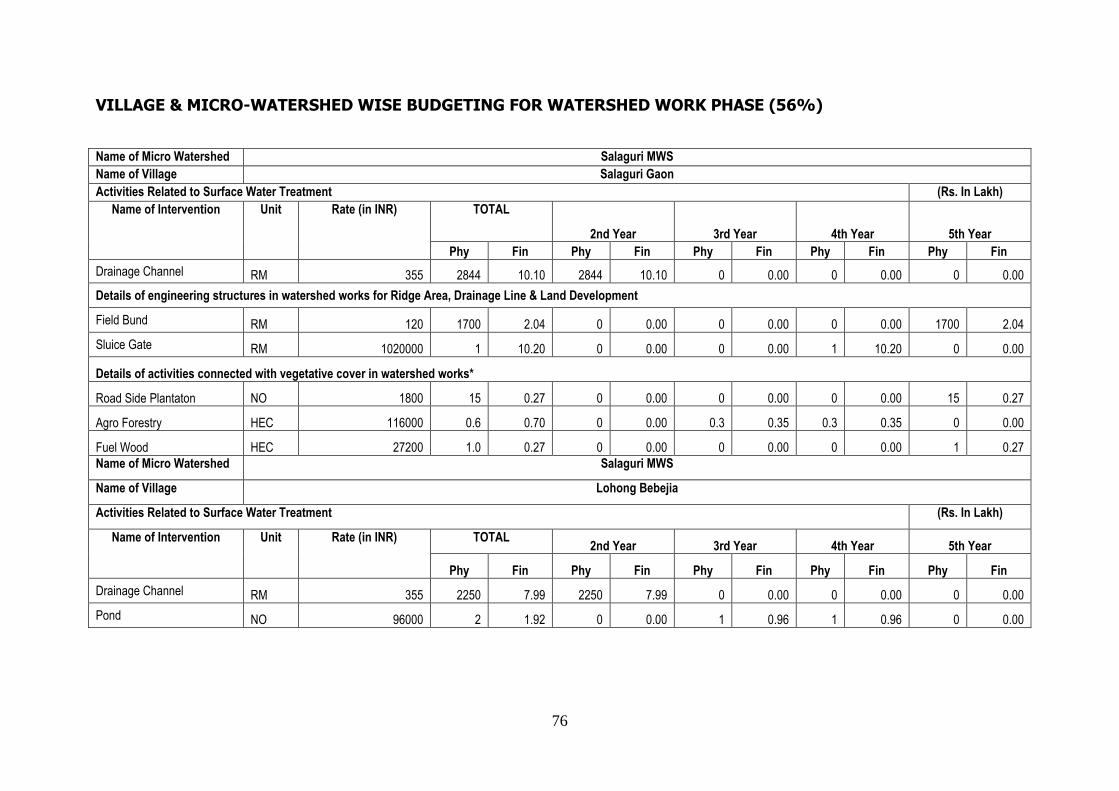
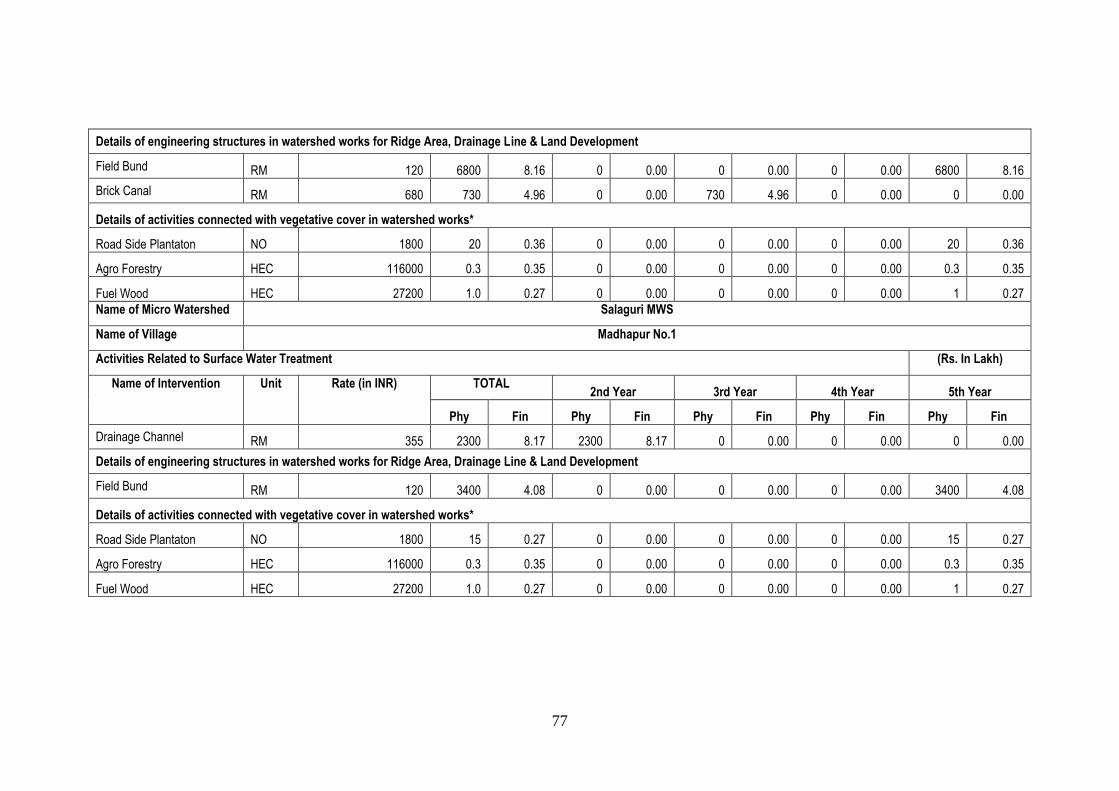
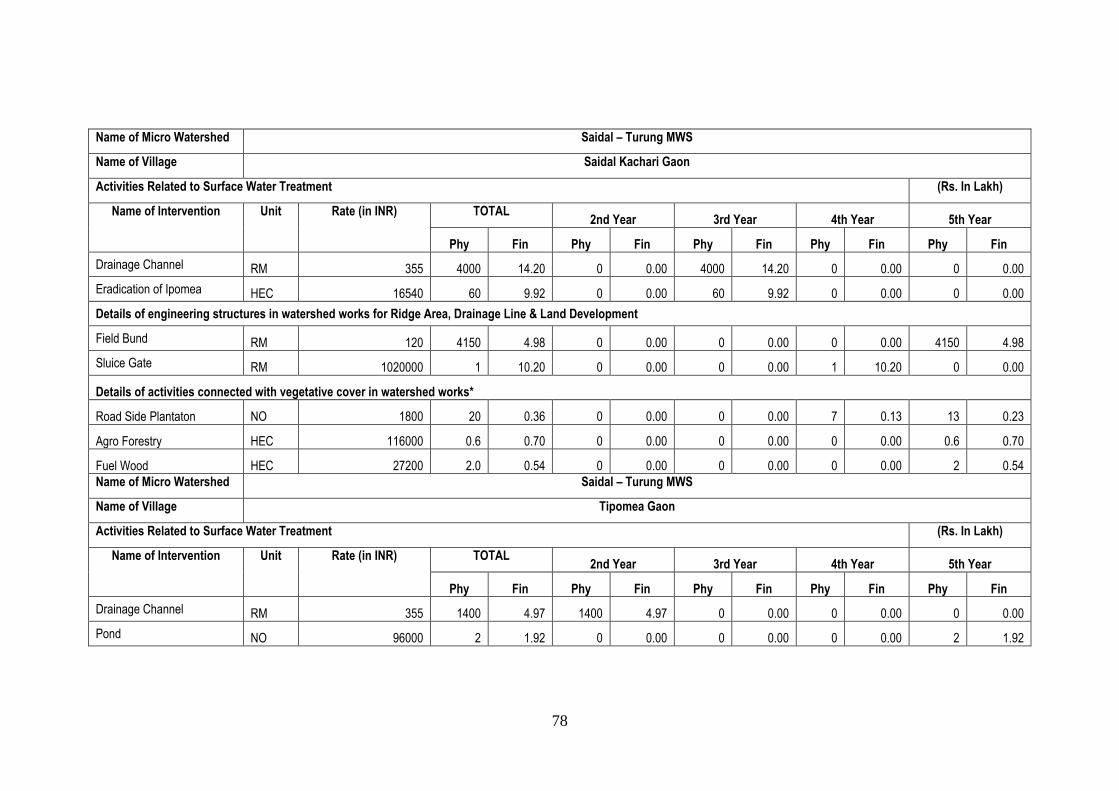
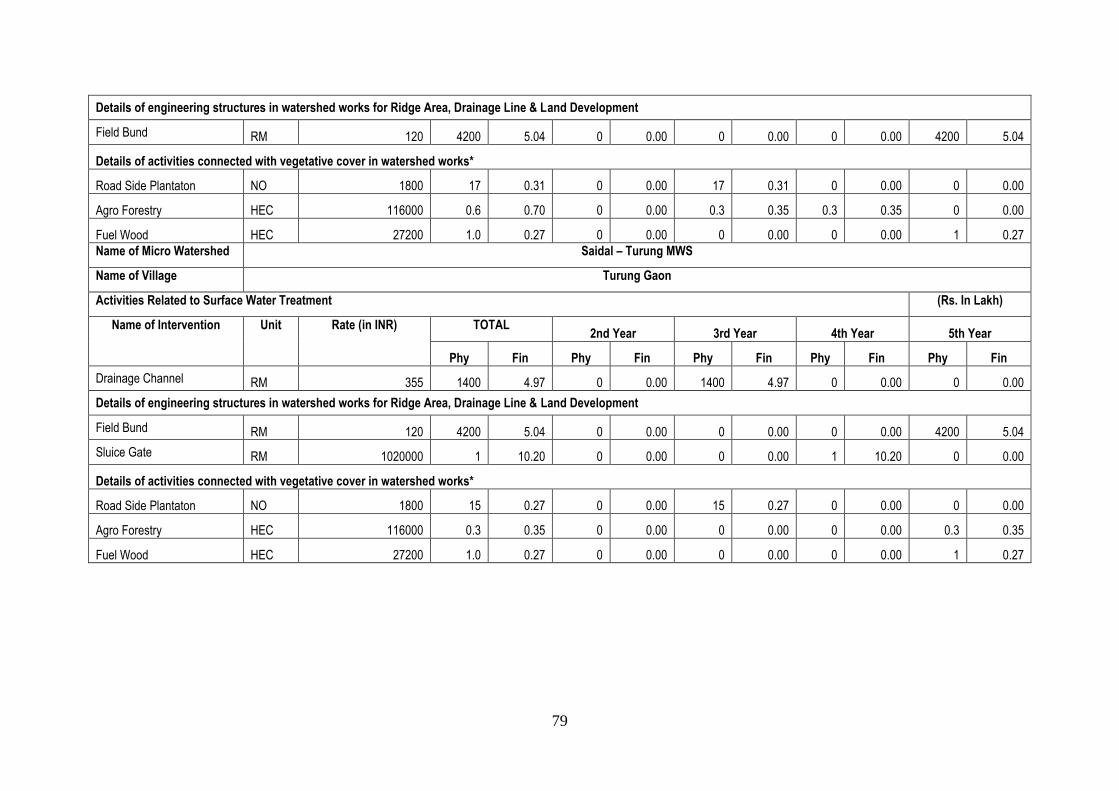
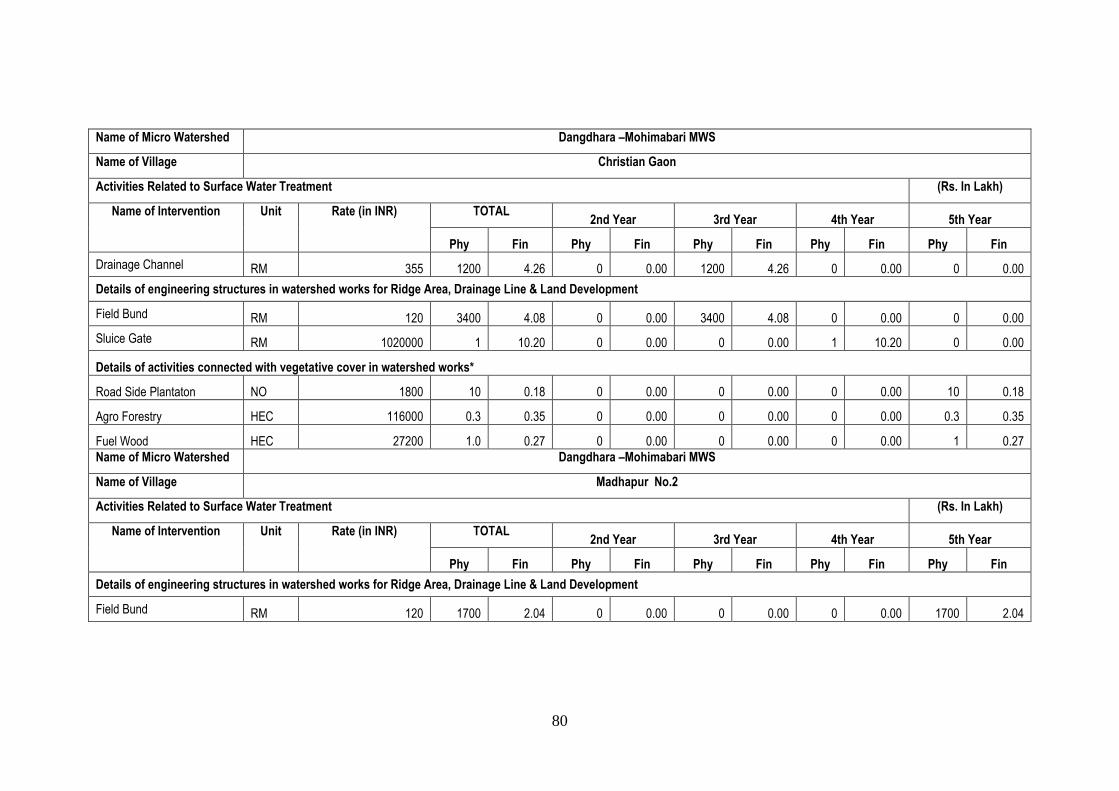
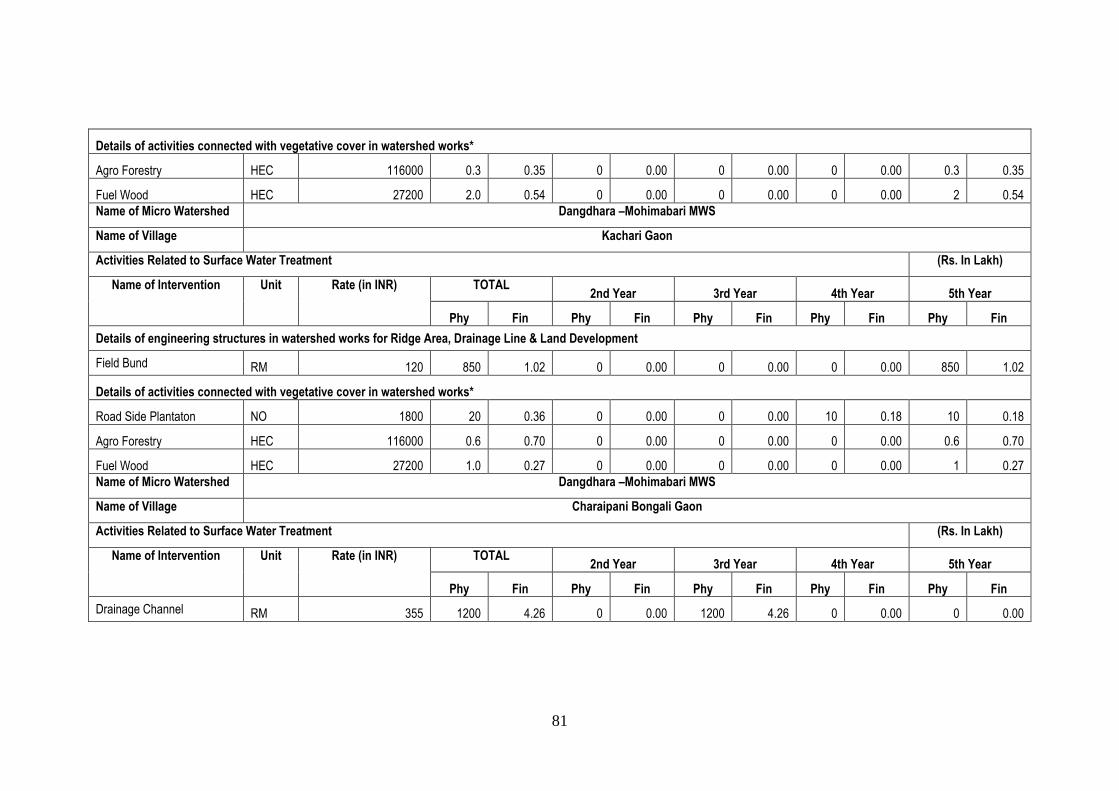
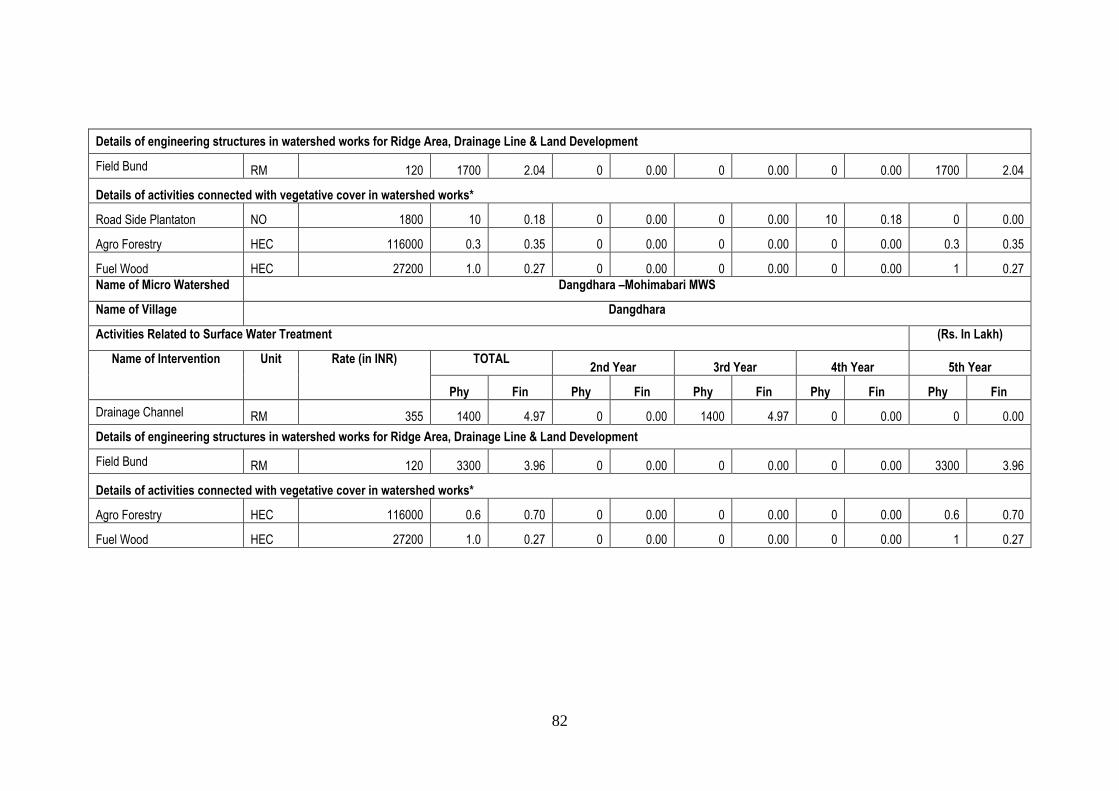
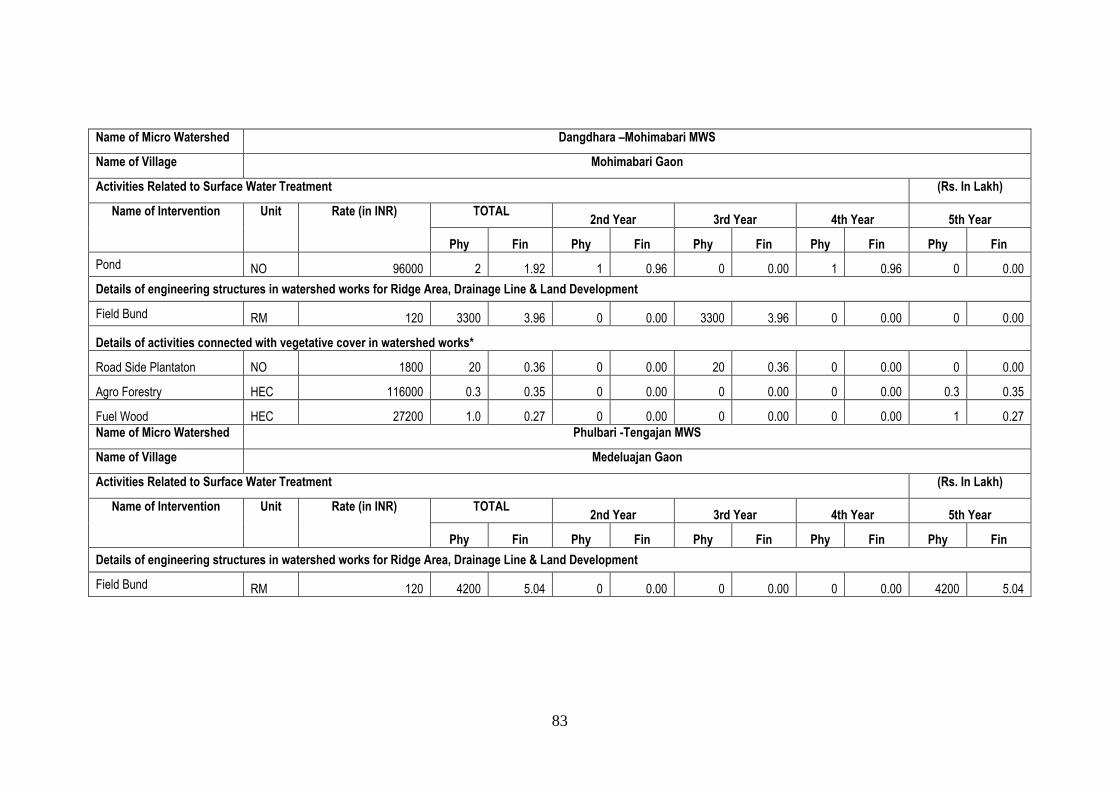
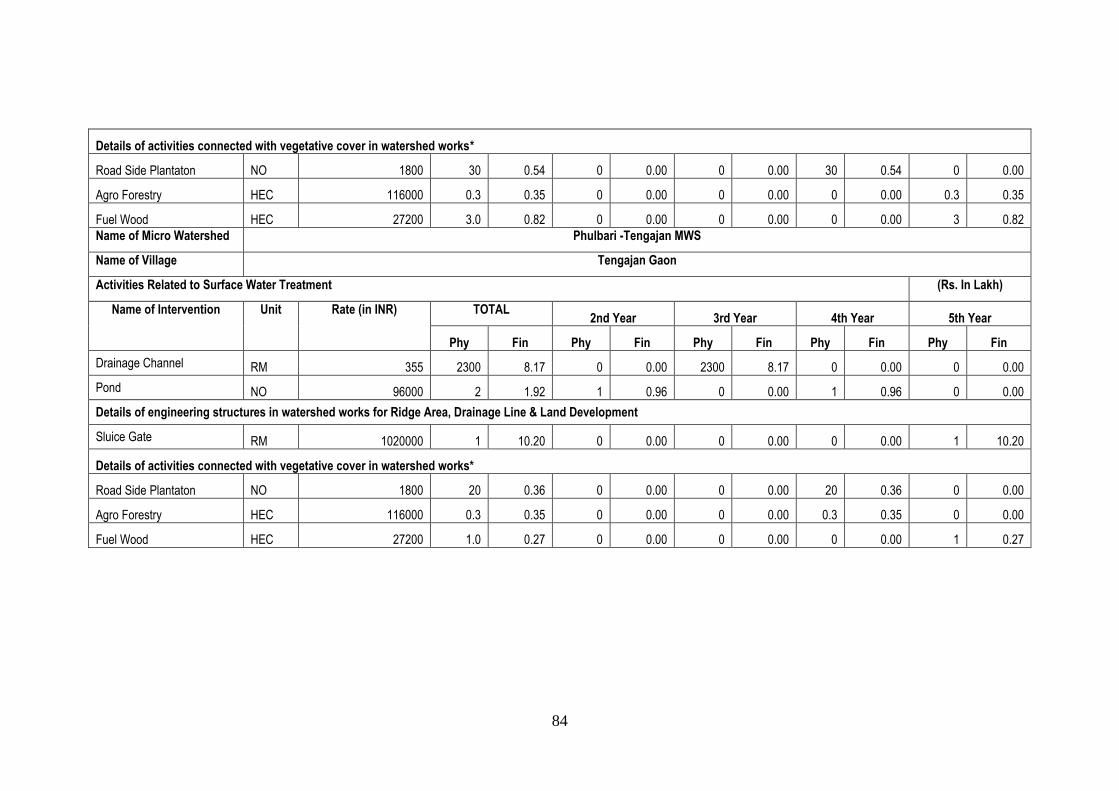
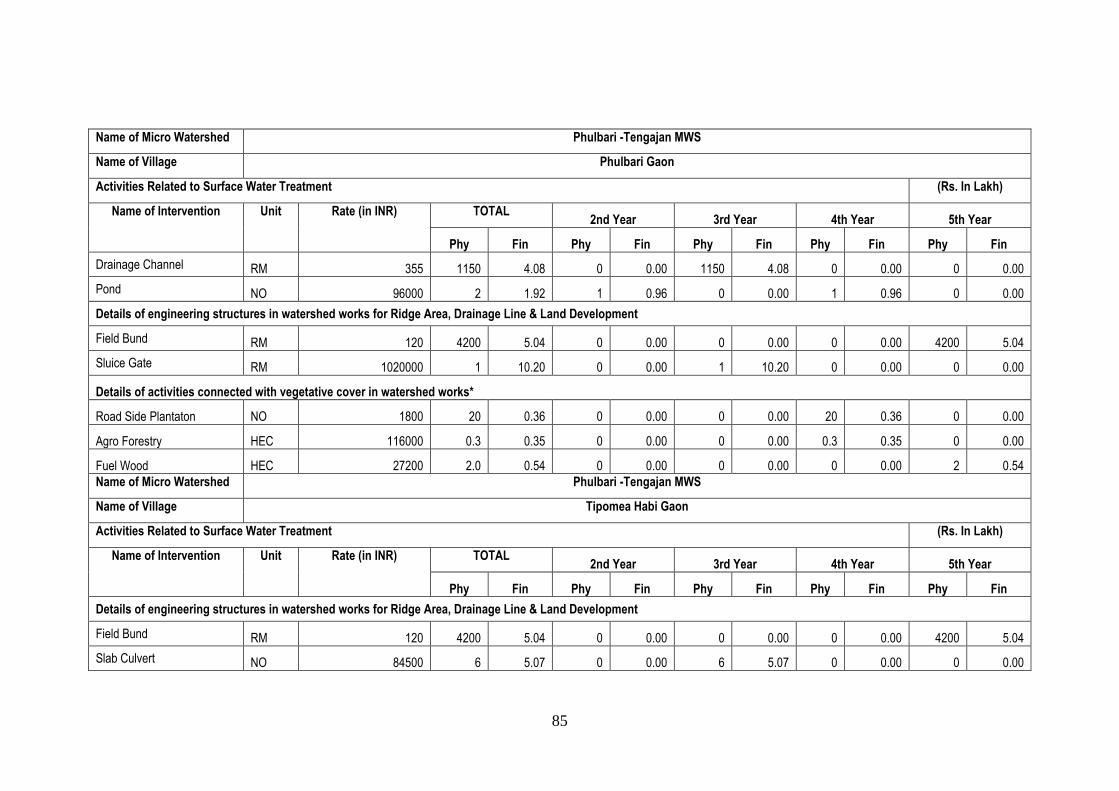
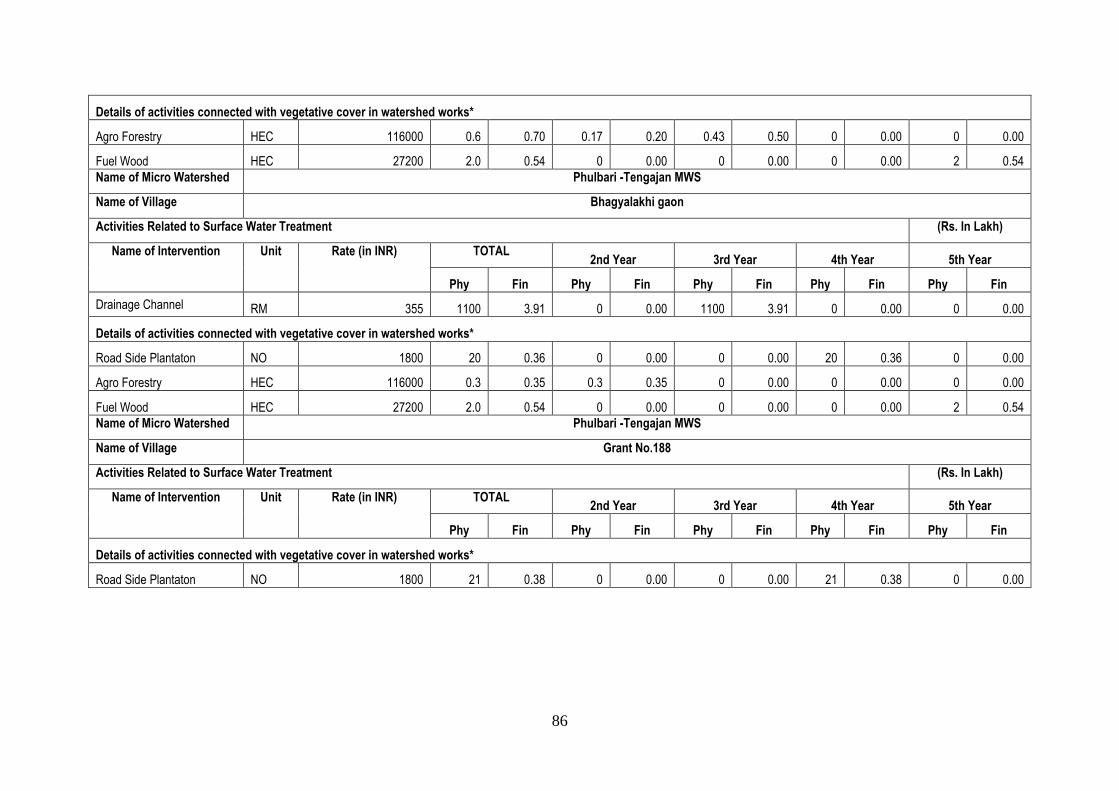
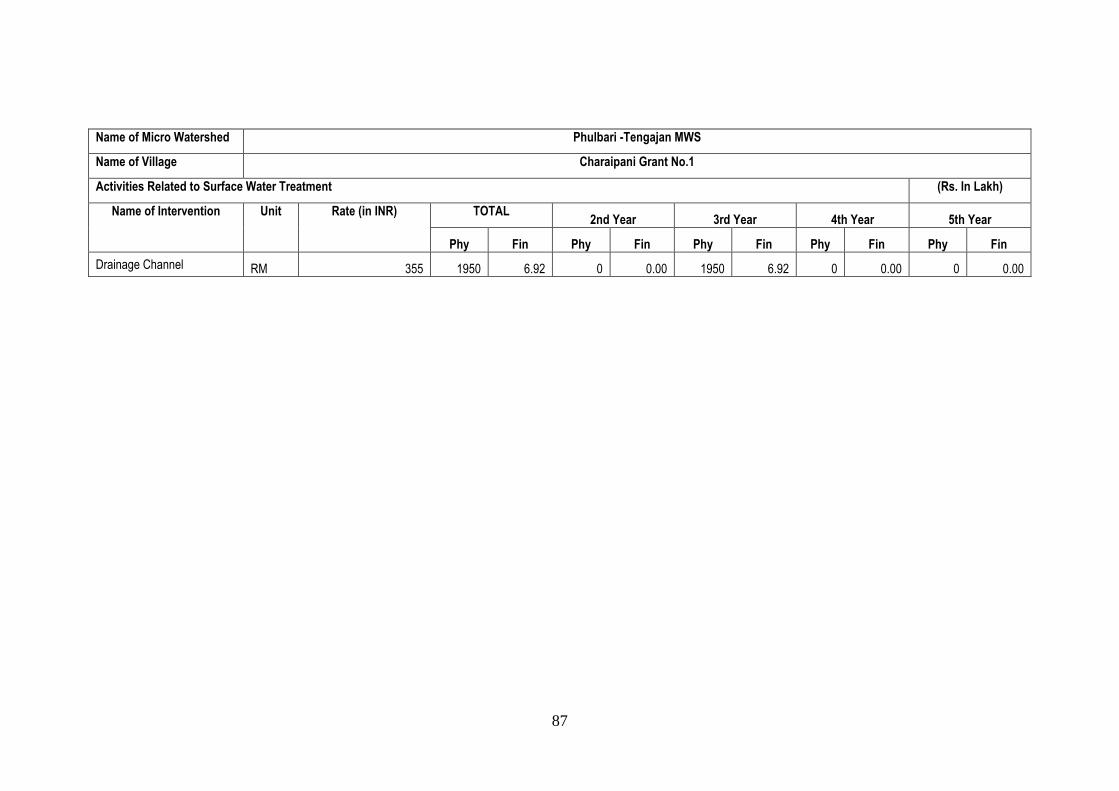
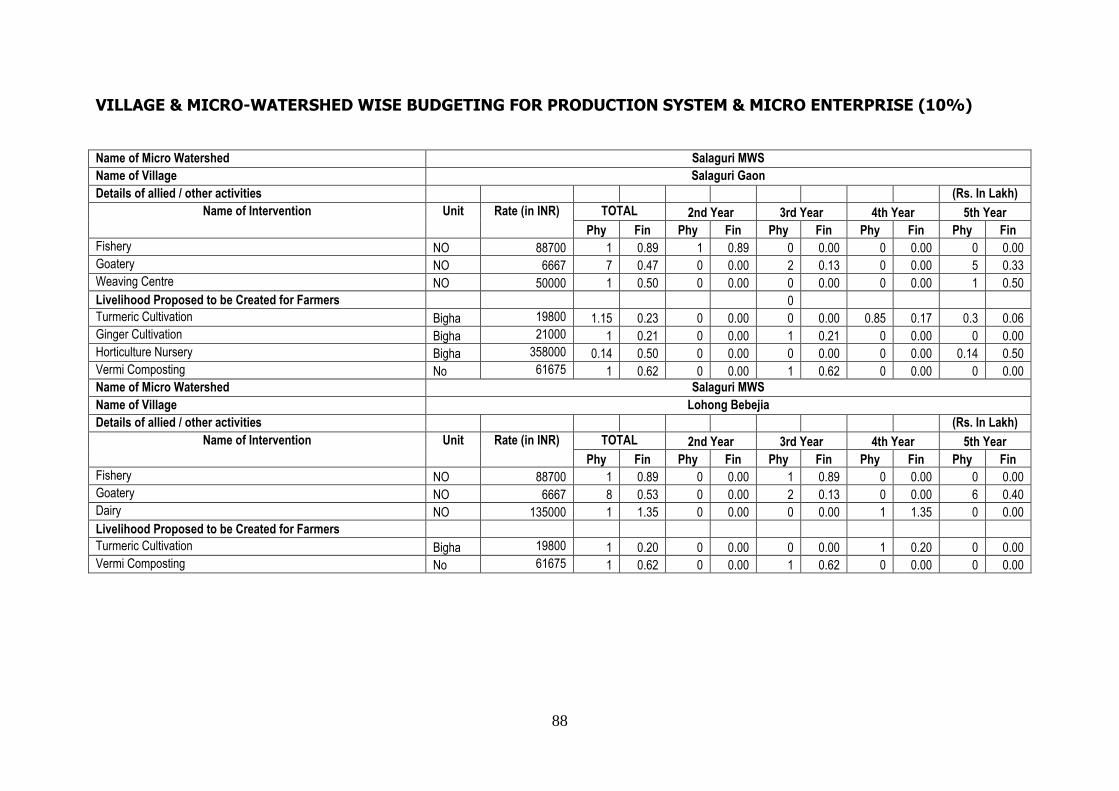
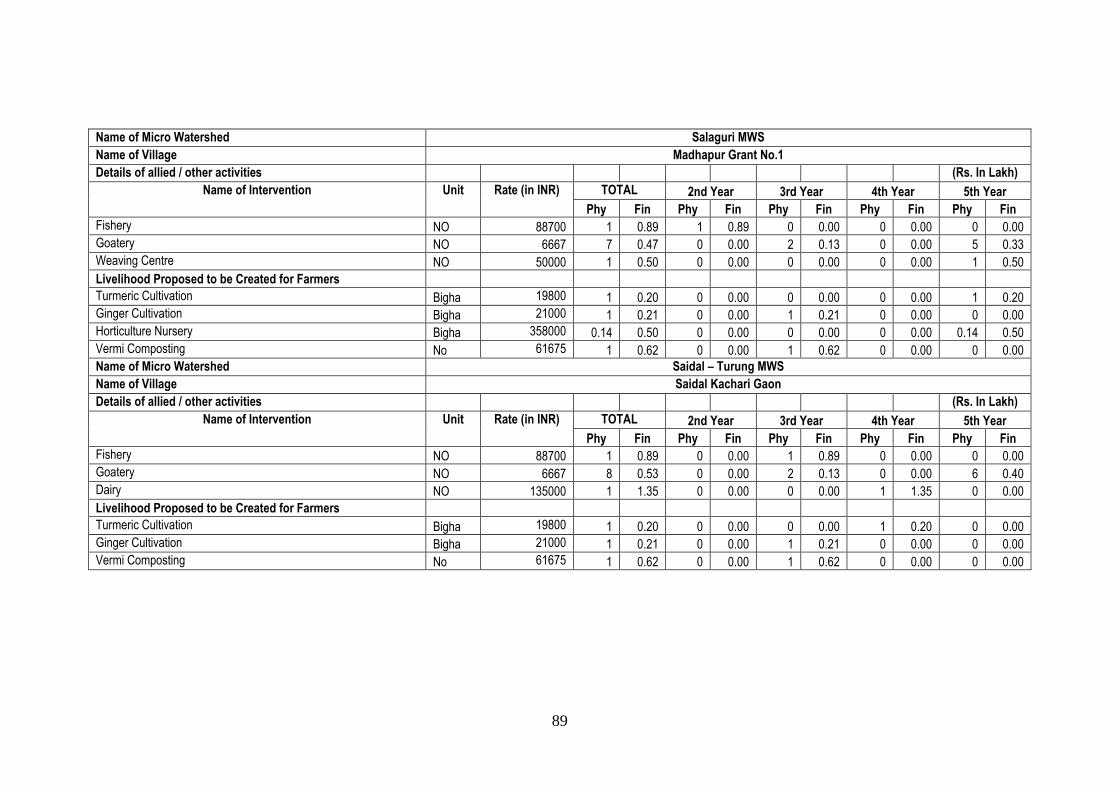
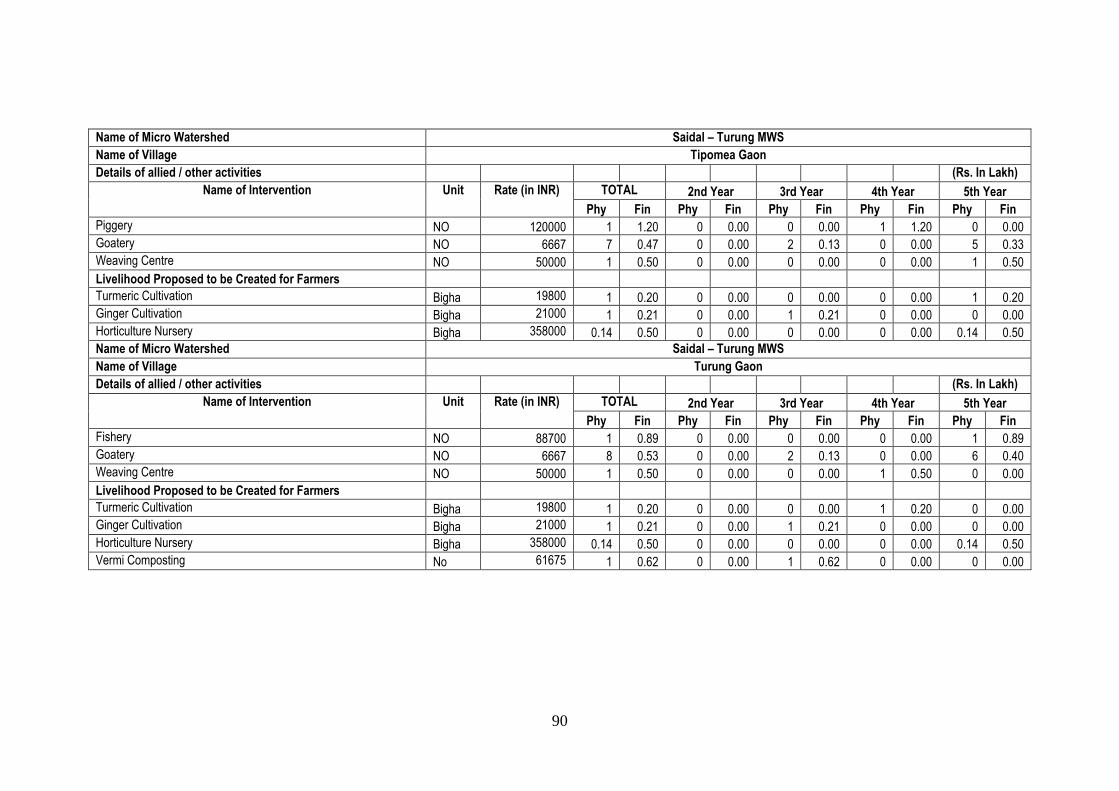
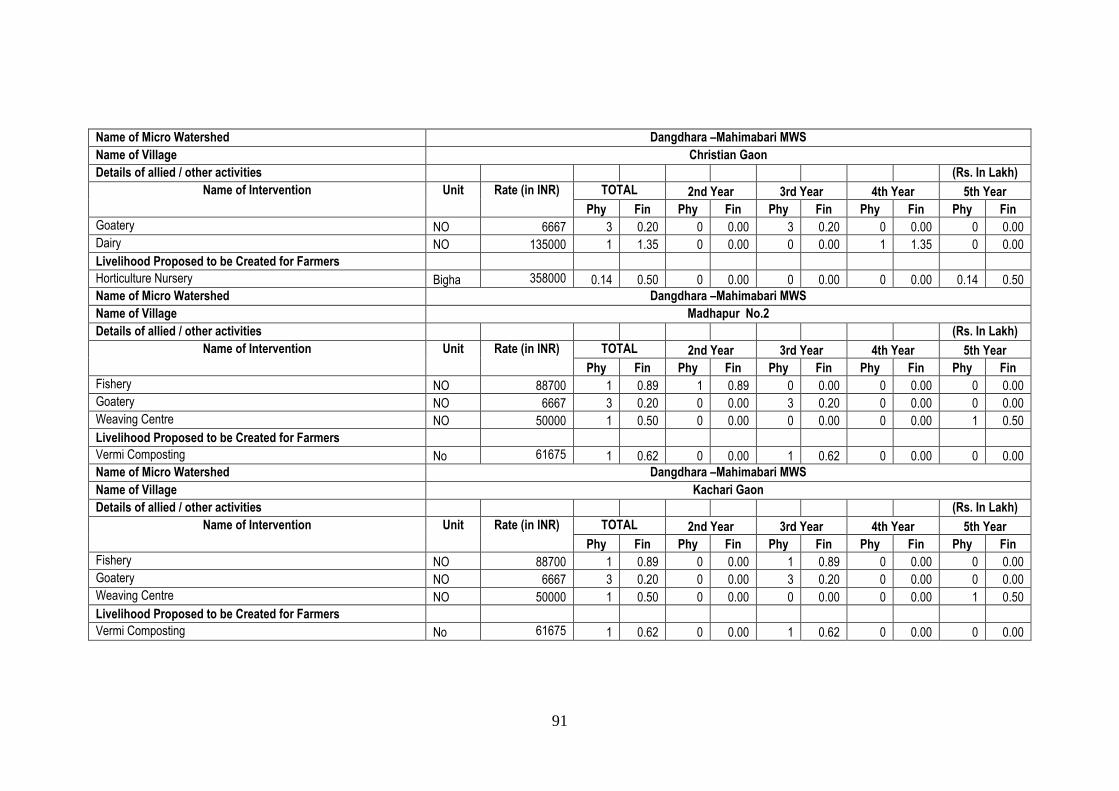
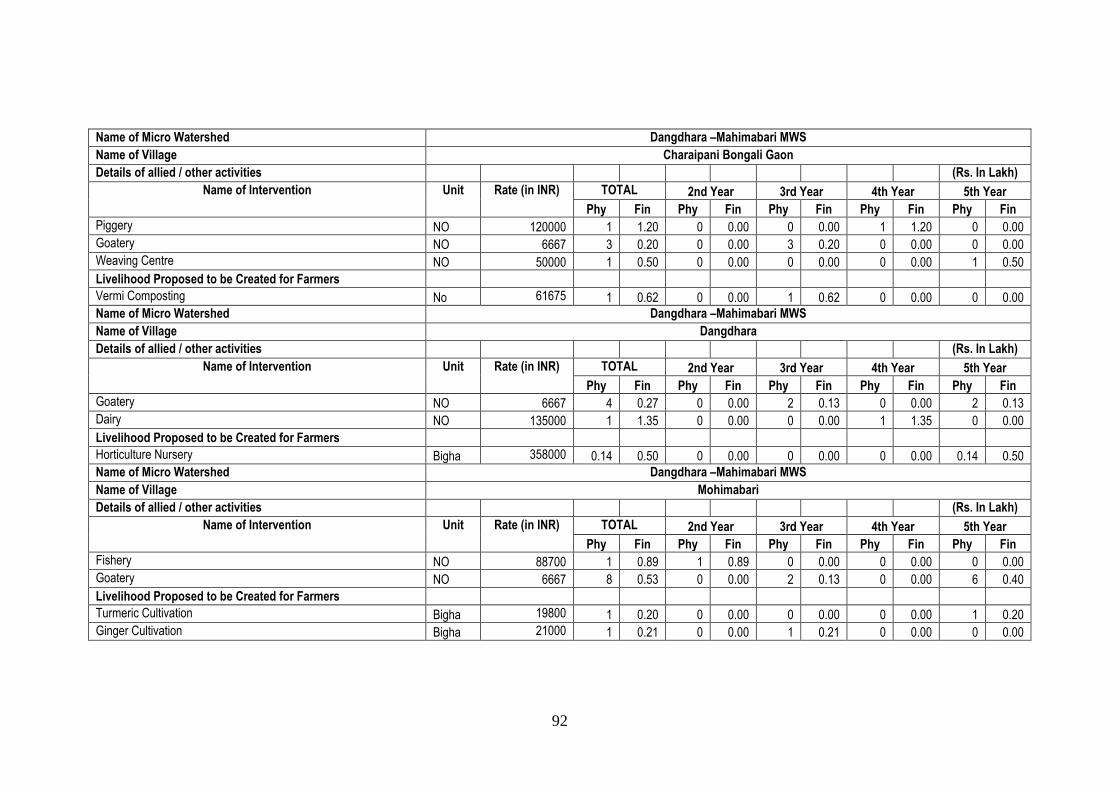
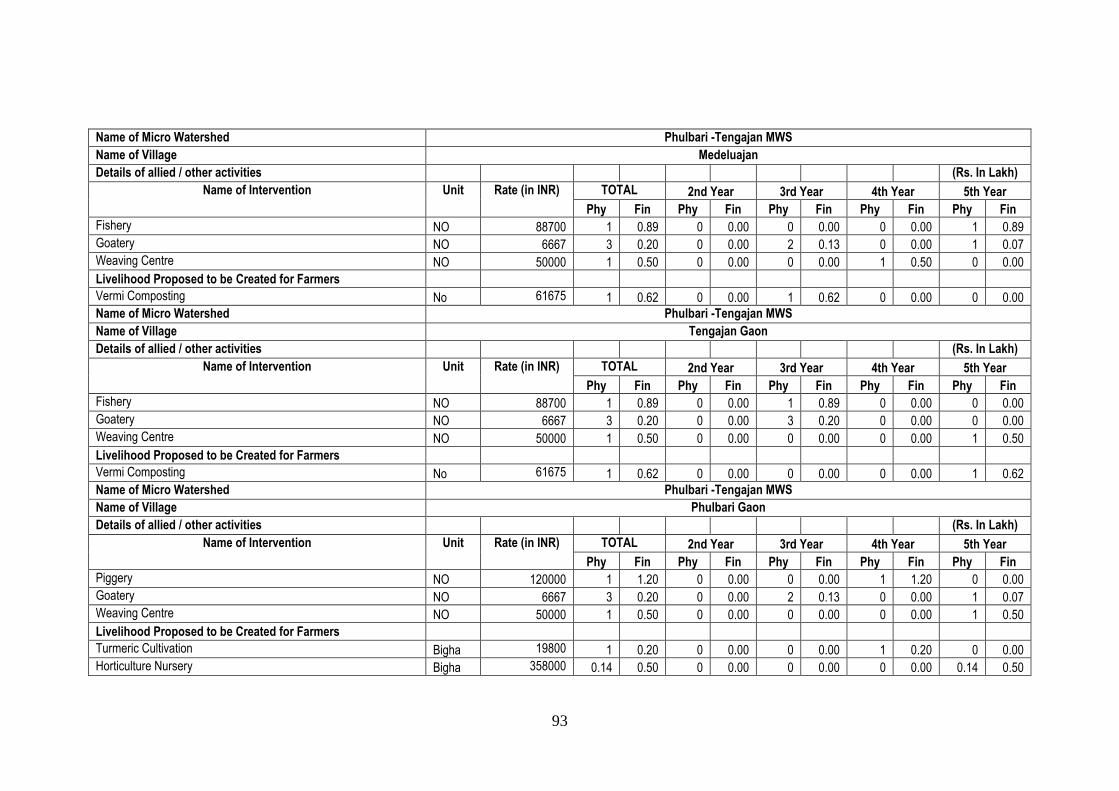
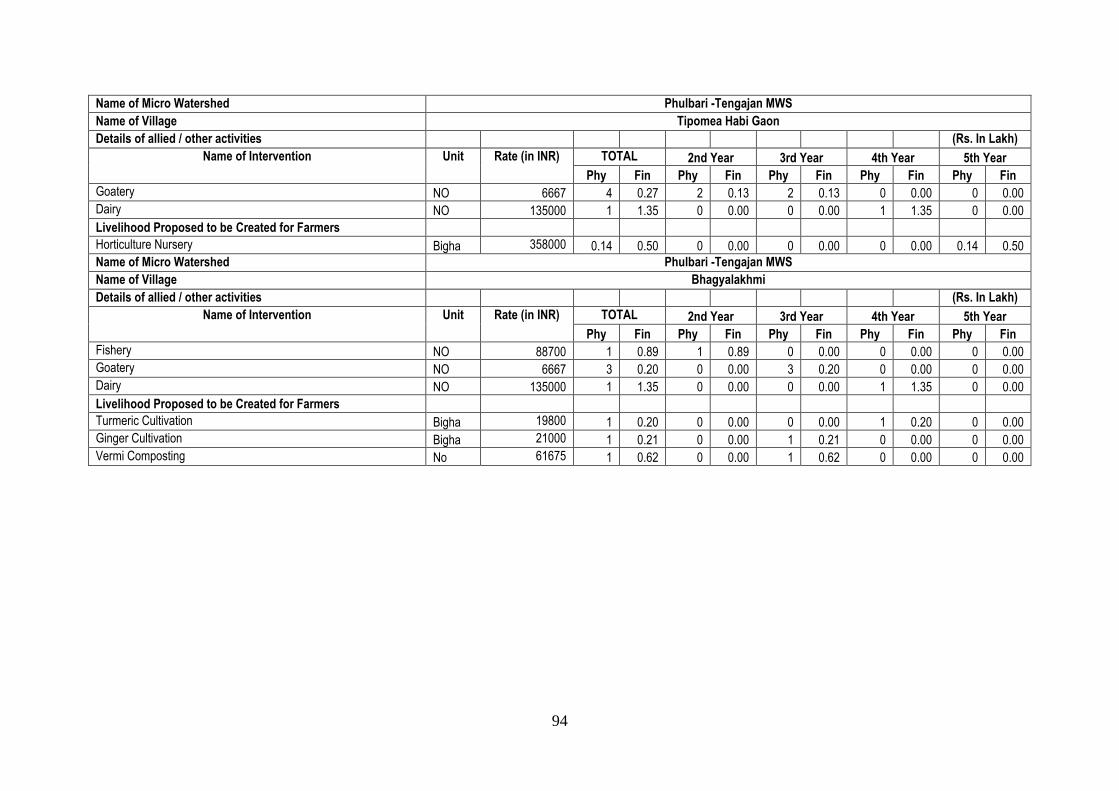
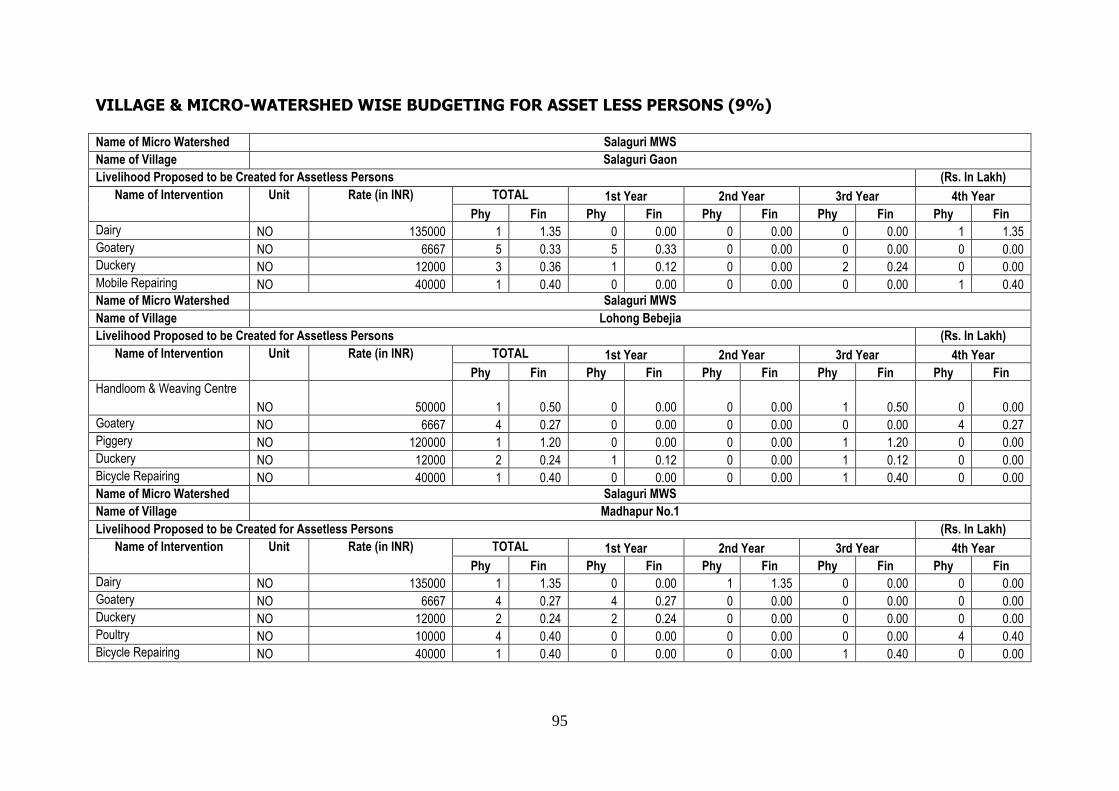
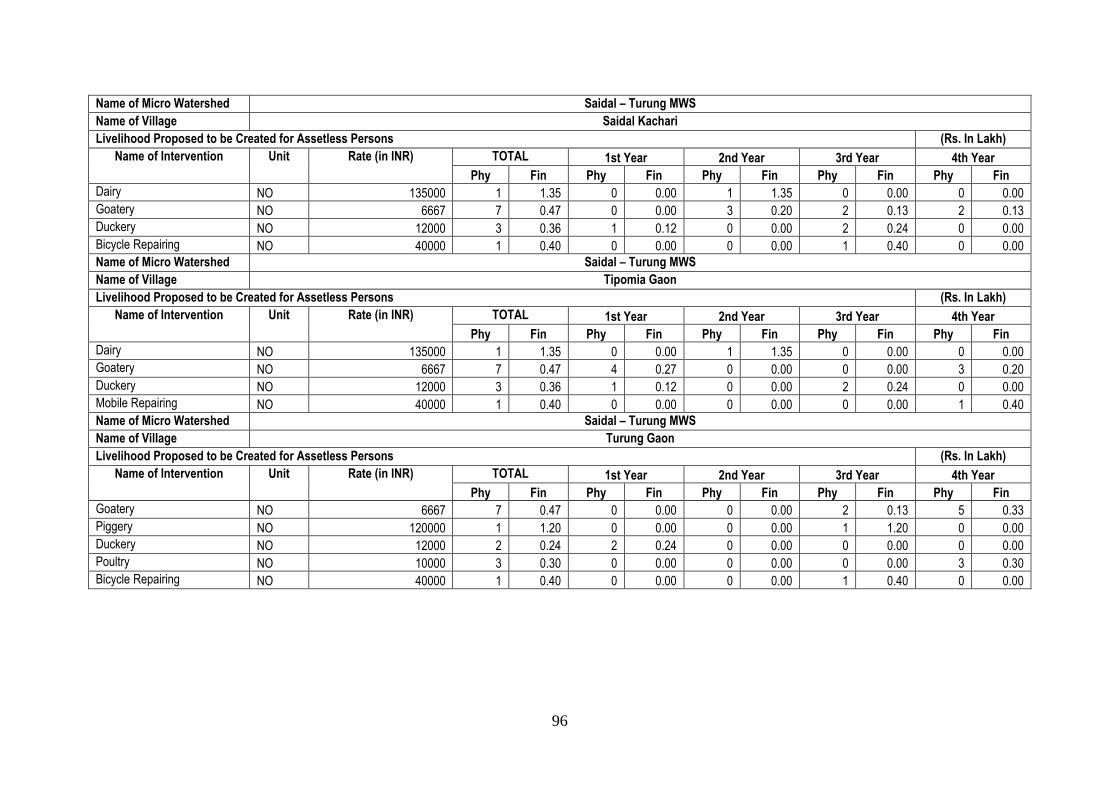
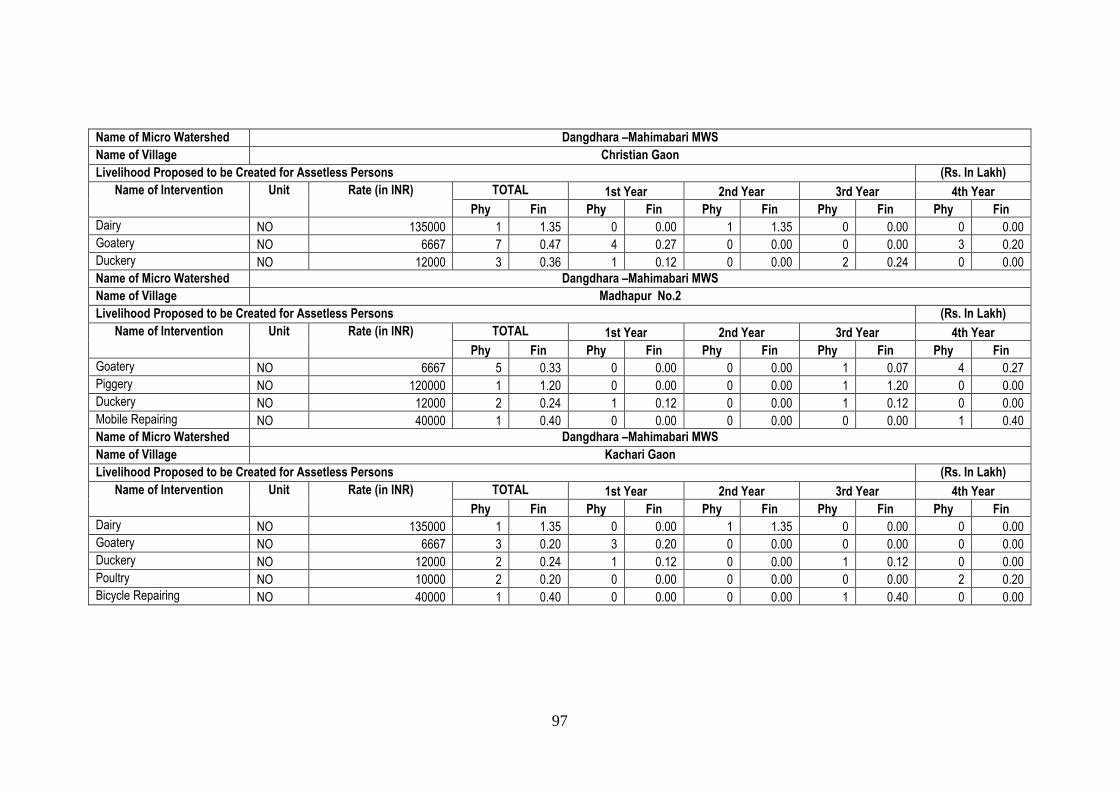
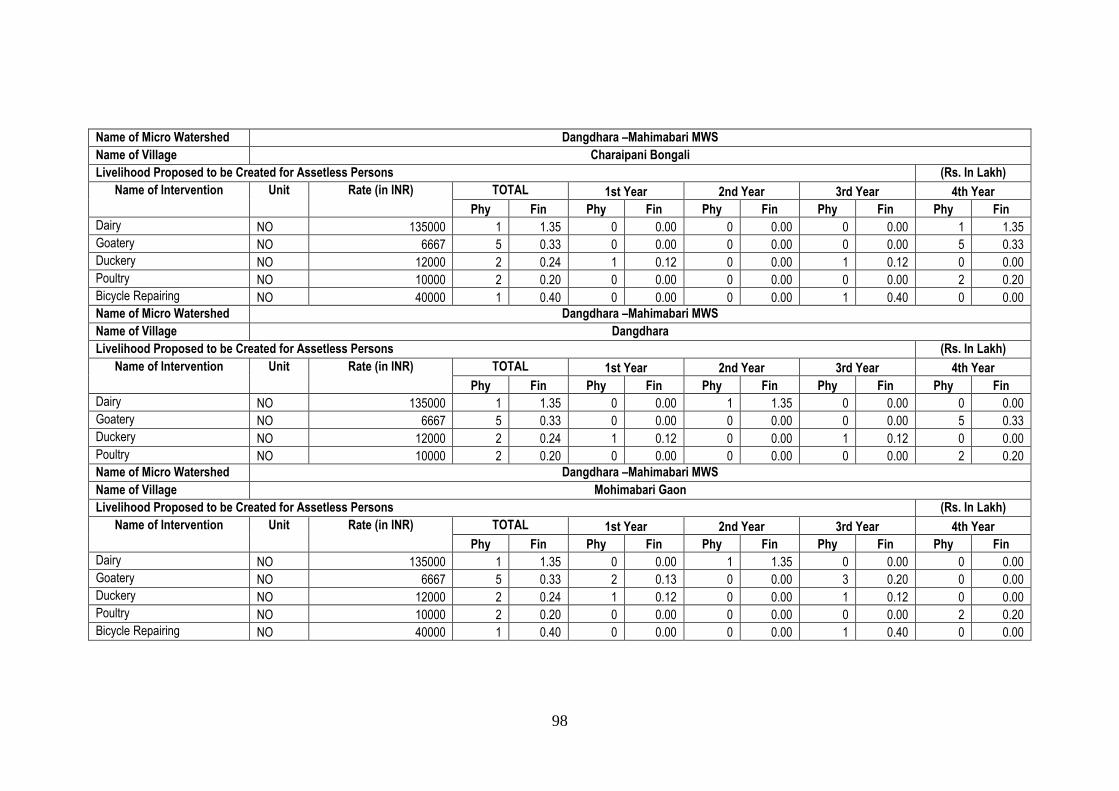
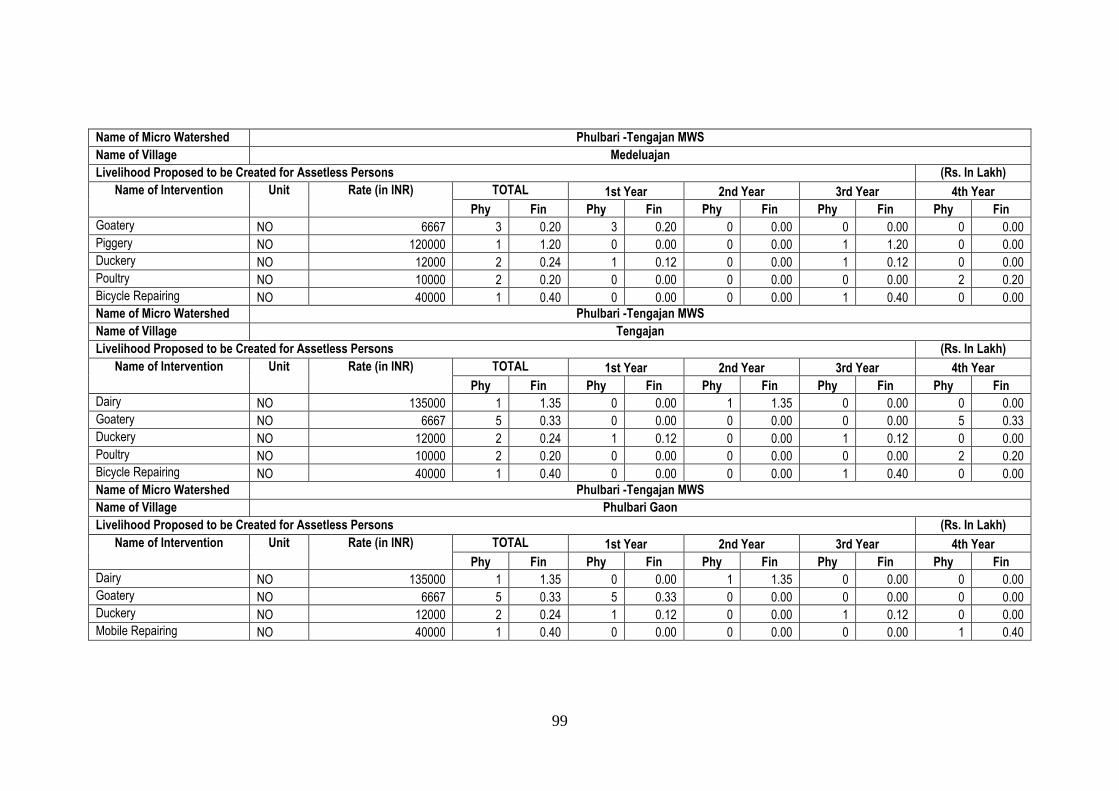
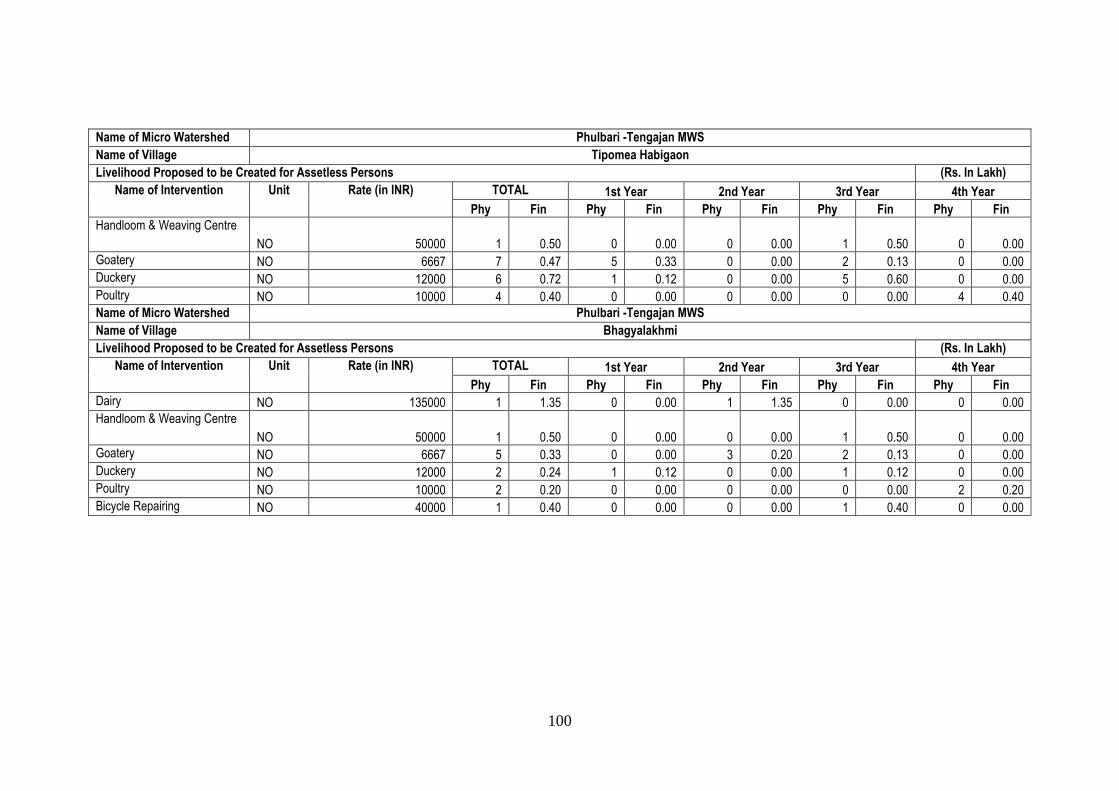
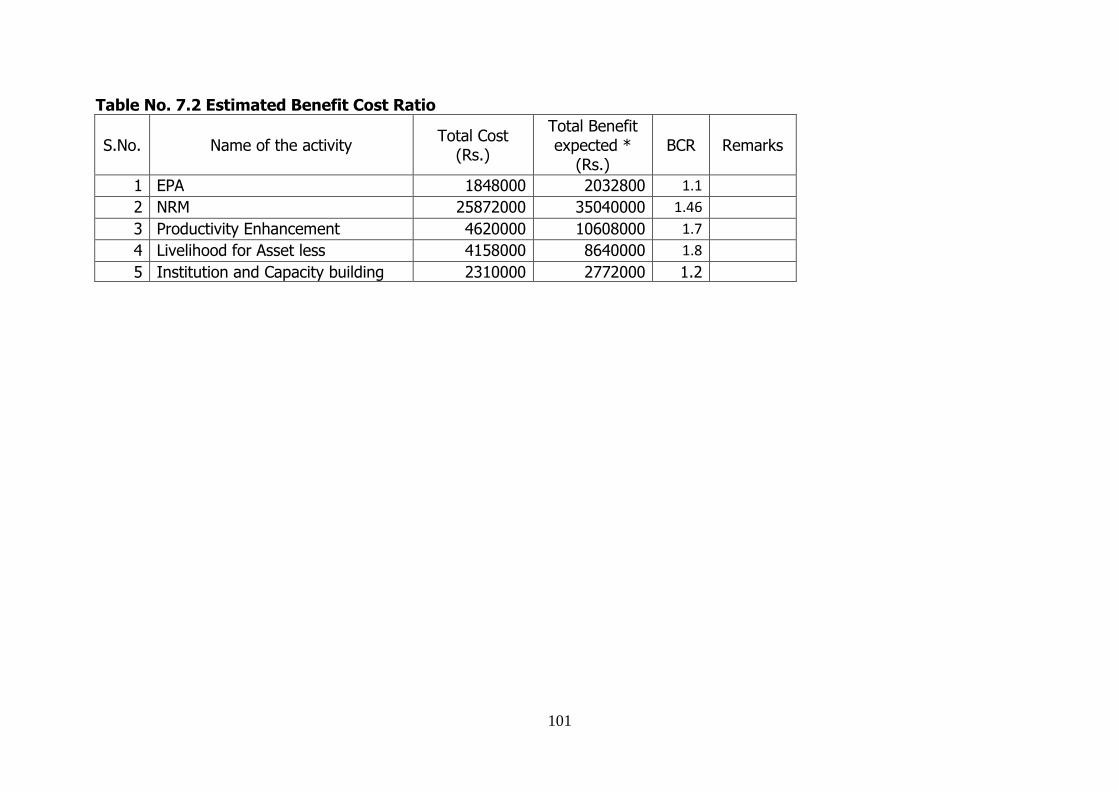
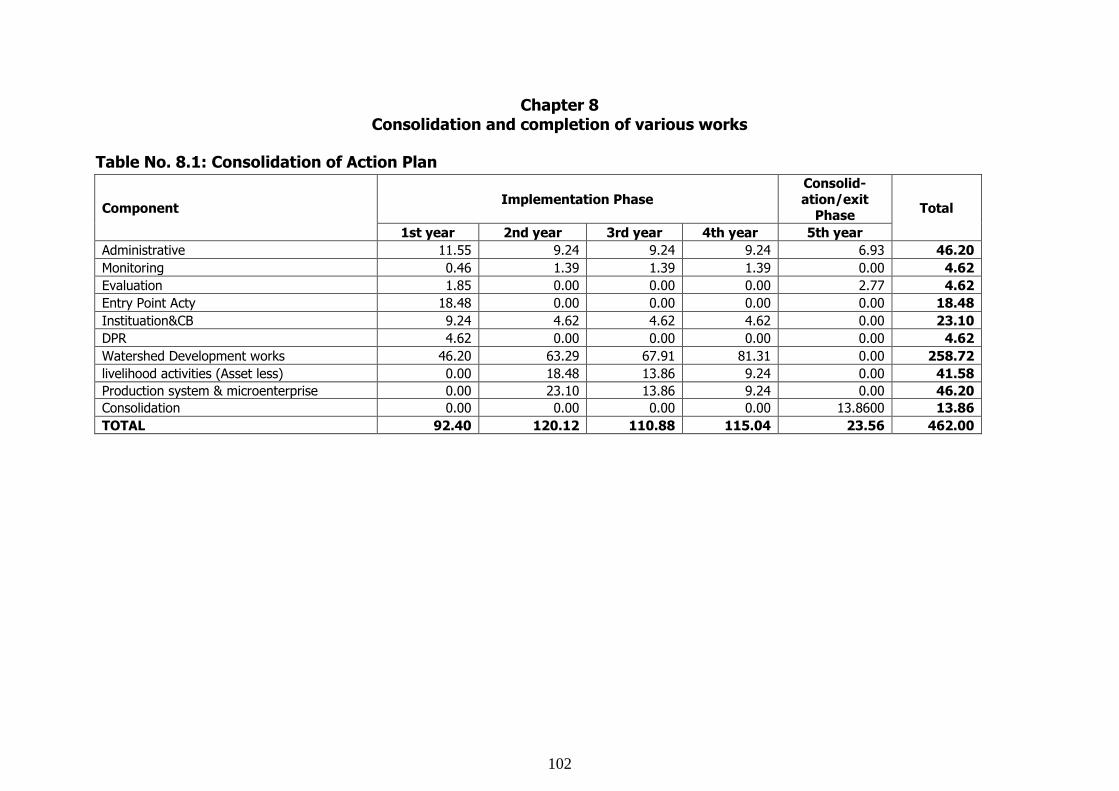
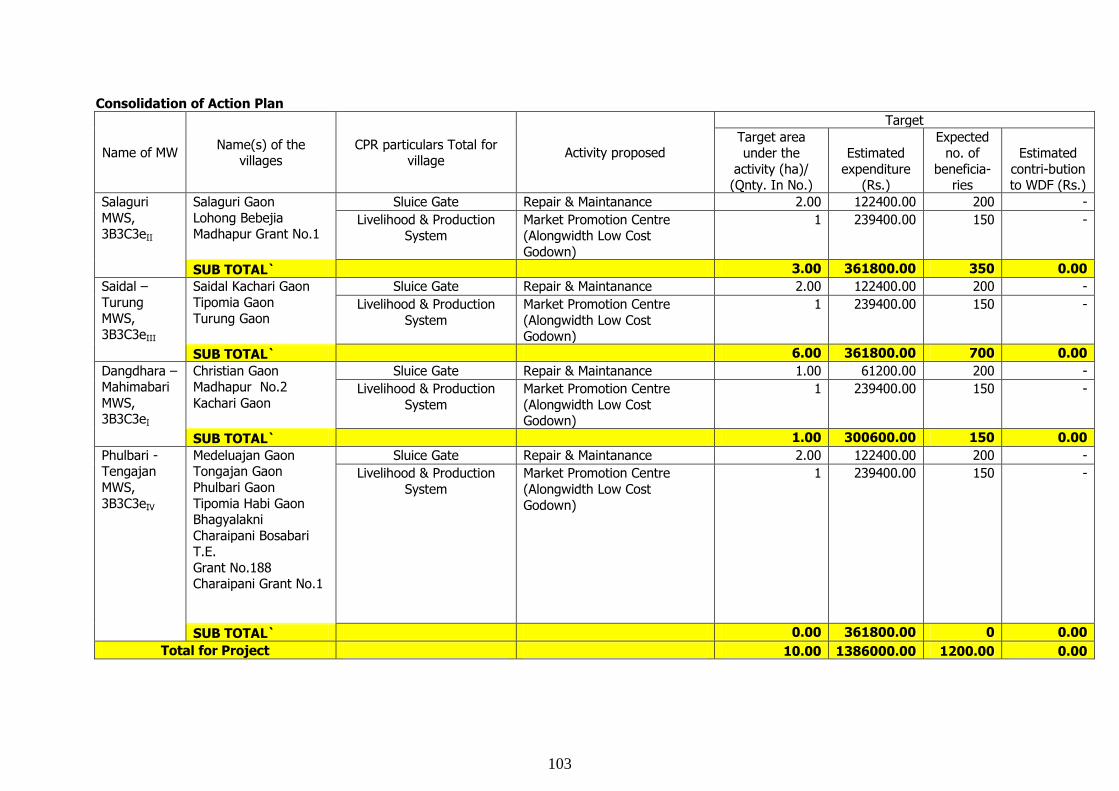
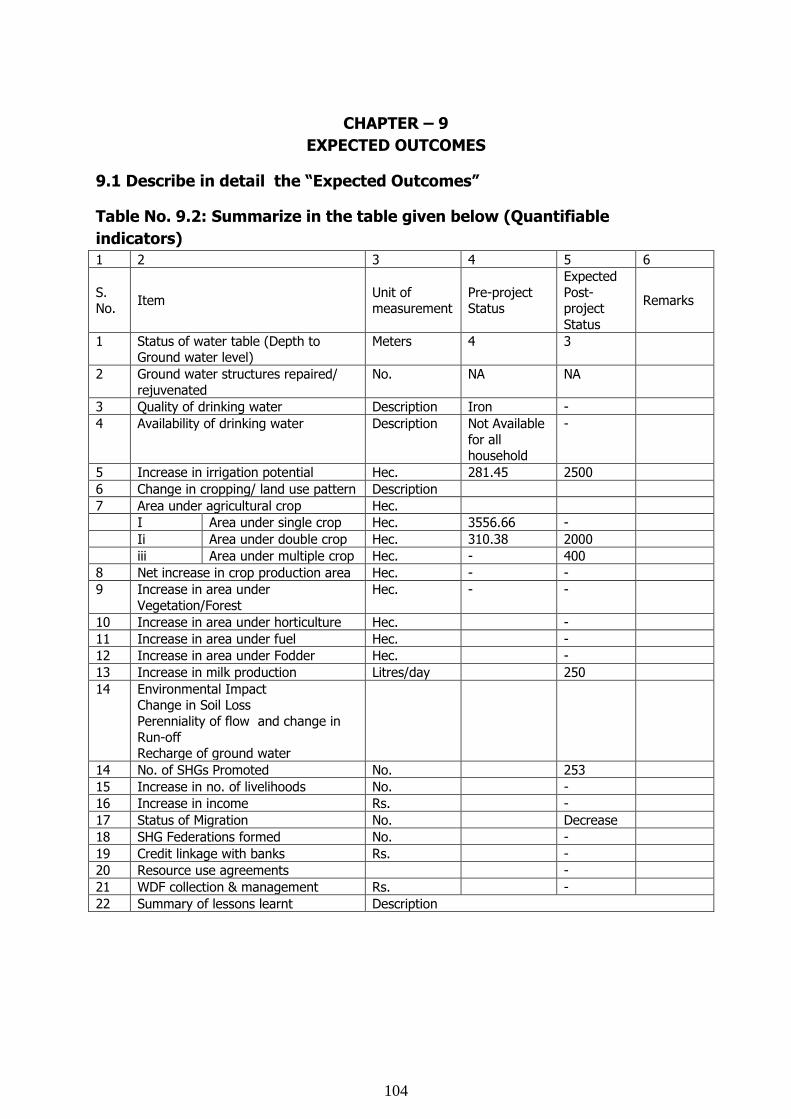
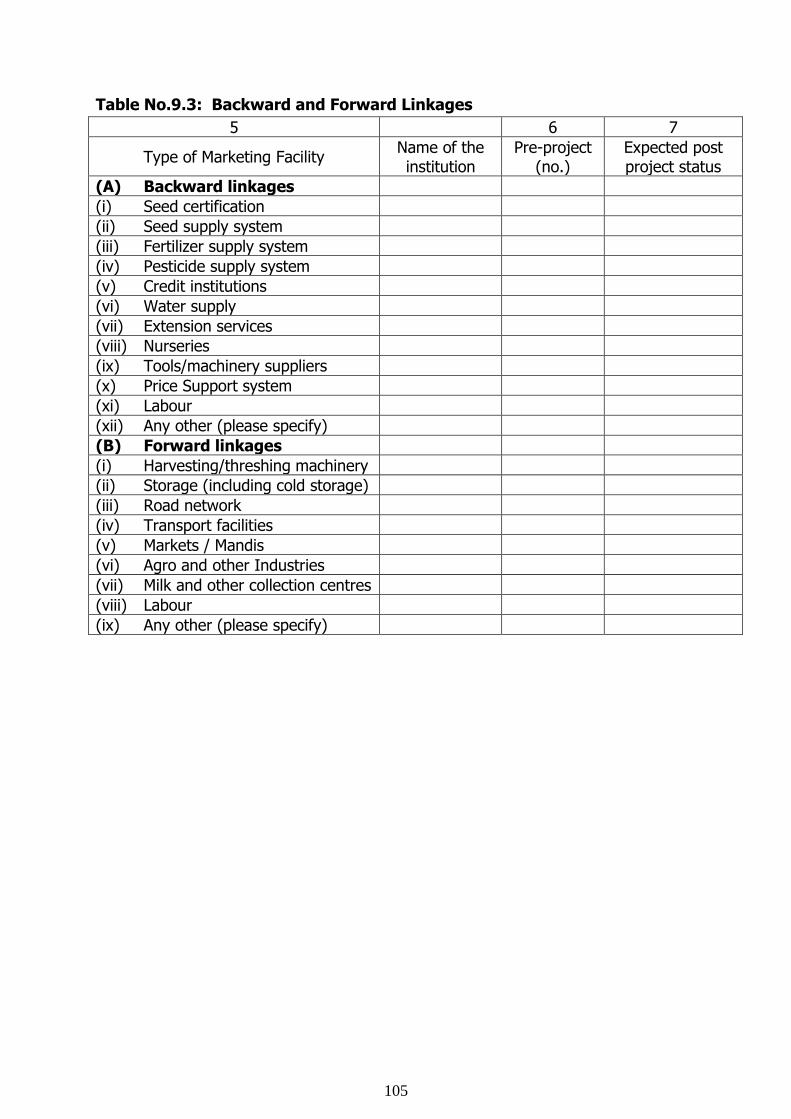
![IWMP-XIII-Rampur, Shimla, Himachal Pradesh 2011-12hprural.nic.in/IWMP_XIII_Rampur_Shimla.pdfIWMP -XIII (2011-12) Rampur[Page-1] DETAILED PROJECT REPORT IWMP-XIII-Rampur, Shimla, Himachal](https://static.documents.pub/doc/80x56/5b39fb357f8b9a5a178f0088/iwmp-xiii-rampur-shimla-himachal-pradesh-2011-xiii-2011-12-rampurpage-1.jpg)


