Page 1
Economic Analysis Division Emerging Markets Analysis
BBii--WWeeeekkllyy RReeppoorrtt 1100 –– 2233 JJuullyy 22001188
NBG - Economic Analysis Division https://www.nbg.gr/en/the-group/press-office/e-spot/reports Emerging Markets Analysis Head: Michael Loufir : +30 210 33 41 211 : [email protected] Analysts:
Konstantinos Romanos-Louizos
: [email protected]
Louiza Troupi : [email protected]
Athanasios Lampousis : [email protected]
0
1
2
3
4
5
6
0
1
2
3
4
5
6
Eg
ypt
EM
DE
*
Ro
man
ia
Tur
key
Wo
rld
Bul
gari
a
Cyp
rus
Ser
bia
Alb
an
ia
EU
Gre
ece
FY
RO
M
Real GDP Growth (%, 2018F)
* EMDE: Emerging Market & Developing Economies
0
3
6
9
12
15
0
3
6
9
12
15
Cyp
rus
Gre
ece
FY
RO
M EU
Alb
ania
Ser
bia
Bu
lgar
ia
Wo
rld
Ro
man
ia
EM
DE
*
Eg
ypt
Tu
rkey
End-year Headline Inflation (%, 2018F)
* EMDE: Emerging Market & Developing Economies
-10
-8
-6
-4
-2
0
2
-10
-8
-6
-4
-2
0
2
Cy
pru
s
Se
rbia
Gre
ec
e
Bu
lga
ria
EU
Tu
rke
y
Alb
ania
FY
RO
M
Ro
ma
nia
EM
DE
*
Eg
yp
t
Fiscal Balance (% of GDP, 2018F)
* EMDE: Emerging Market & Developing Economies
-8
-6
-4
-2
0
2
4
-8
-6
-4
-2
0
2
4
Bu
lgar
ia EU
EM
DE
*
Gre
ece
FY
RO
M
Eg
ypt
Ro
man
ia
Cyp
rus
Ser
bia
Tu
rkey
Alb
ania
Current Account Balance (% of GDP, 2018F)
* EMDE: Emerging Market & Developing Economies
TURKEY . . . . . . . . . . . . . . . . . . . . . . . . . . . . . . . . . . . . . . . . . . . . . 1
The CBRT maintained unchanged its key rate – the 1-week repo rate – at 17.75%
Lending activity (FX-adjusted) slowed significantly in H1:18, mainly on the back of higher interest rates and the fading impact of the Credit Guarantee Fund scheme
Customer deposits (FX-adjusted) decelerated in H1:18, hampered by heightened uncertainty ahead of the June 24th presidential and parliamentary elections
ROMANIA . . . . . . . . . . . . . . . . . . . . . . . . . . . . . . . . . . . . . . . . . . . . 2 2
The banking sector’s bottom line improved further in Q1:18, mainly due to a slowdown in provisioning
BULGARIA . . . . . . . . . . . . . . . . . . . . . . . . . . . . . . . . . . . . . . . . . . . 3
Bulgaria moves closer to joining the euro area
Headline inflation rose to a 5½-year high of 3.2% y-o-y in June from 2.8% at end-2017, mainly due stronger demand-side pressures
SERBIA . . . . . . . . . . . . . . . . . . . . . . . . . . . . . . . . . . . . . . . . . . . . . . 4
The IMF Executive Board approved a 30-month (non-financing) Policy Coordination Instrument for Serbia
Headline inflation declined to 2.3% y-o-y in June from 3.0% in December -- within the NBS’ target range (of 3±1.5%)
FYROM . . . . . . . . . . . . . . . . . . . . . . . . . . . . . . . . . . . . . . . . . . . . . . . . . . 5
Headline inflation declined to 1.4% y-o-y in June from a 5-year high of 2.4% at end-2017
Credit to the private sector continued to recover in H1:18 (up 6.0% y-o-y)
Customer deposit growth reached a 3½-year high of 9.2% y-o-y at end-H1:18, up from 4.6% at end-2017
ALBANIA . . . . . . . . . . . . . . . . . . . . . . . . . . . . . . . . . . . . . . . . . . . . 6
Headline inflation rose to a 5½-year high of 2.4% y-o-y in June from 1.8% in December – albeit remaining well below the BoA’s target (of 3.0%) for almost seven successive years
The BoA is set to initiate a new cycle of monetary policy tightening in Q2:19
CYPRUS . . . . . . . . . . . . . . . . . . . . . . . . . . . . . . . . . . . . . . . . . . . . . 7
The EC’s 4th Post-Programme Surveillance mission stressed the need for continued fiscal discipline and enhanced reform momentum to reduce increasing downside risks to the “very positive macroeconomic outlook”
EGYPT . . . . . . . . . . . . . . . . . . . . . . . . . . . . . . . . . . . . . . . . . . . . . . 8
The IMF Executive Board completed the 3rd review of Egypt’s economic reform programme -- supported by a 3-year USD 12bn Extended Fund Facility
Headline inflation reversed its downward trend for the first time in 11 months in June, due to the implementation of a new series of subsidy cuts (through price increases)
APPENDIX: FINANCIAL MARKETS . . . . . . . . . . . . . . . . . . . . . . . . 9
Please see disclosures in page 14
Page 2
10 – 23 July 2018
NBG - Emerging Markets Analysis – Bi-Weekly Report 1
Turkey
BB- / Ba2 / BB (S&P/ Moody’s / Fitch)
6
8
10
12
14
16
18
20
22
6
8
10
12
14
16
18
20
22
01
/17
02
/17
03
/17
04
/17
05
/17
06
/17
07
/17
08
/17
09
/17
10
/17
11
/17
12
/17
01
/18
02
/18
03
/18
04
/18
05
/18
06
/18
07
/18
Interest Rates (end of period, %)
CBRT O/N Lending RateCBRT O/N Borrowing RateCBRT Effective Funding Rate
Interbank Market Overnight RateCBRT 1-week Repo Rate Late Liquidity Window Lending RateHeadline Inflation
0
5
10
15
20
25
30
35
0
5
10
15
20
25
30
35
12
:20
08
12
:20
09
12
:20
10
12
:20
11
12
:20
12
12
:20
13
12
:20
14
12
:20
15
12
:20
16
12
:20
17
06
:20
18
Loans and Deposits (y-o-y % change)L
Loans
Loans (FX Adjusted)
Deposits
Deposits (FX Adjusted)
7
9
11
13
15
17
19
21
7
9
11
13
15
17
19
21
Q2
:15
Q3
:15
Q4:1
5
Q1
:16
Q2
:16
Q3
:16
Q4
:16
Q1
:17
Q2
:17
Q3:1
7
Q4
:17
Q1
:18
Q2
:18
Interest Rates (Quarterly Average, %)
TRY Retail Loans TRY Corporate LoansCBRT Effective Funding Rate Overnight Interbank RateTRY Deposits
23 July 3-M F 6-M F 12-M F
1-m TRIBOR (%) 19.5 18.5 18.0 16.5
TRY/EUR 5.54 5.50 5.40 5.30
Sov. Spread (2020, bps) 306 280 250 180
23 July 1-W % YTD % 2-Y %
ISE 100 95,305 6.2 -17.4 32.9
2015 2016 2017 2018F 2019F
Real GDP Growth (%) 6.1 3.2 7.4 4.2 4.4
Inflation (eop, %) 8.8 8.5 11.9 14.8 12.0
Cur. Acct. Bal. (% GDP) -3.7 -3.8 -5.6 -6.0 -5.4
Fiscal Bal. (% GDP) -1.0 -1.1 -1.5 -1.9 -1.5
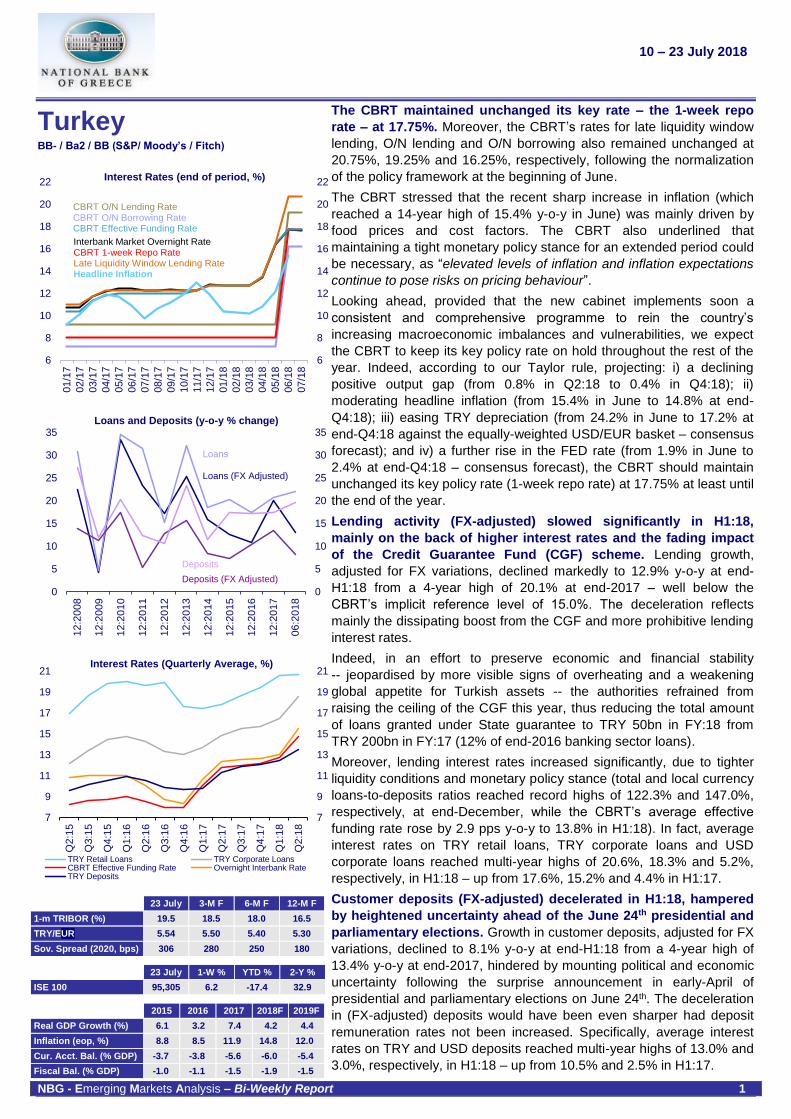
The CBRT maintained unchanged its key rate – the 1-week repo
rate – at 17.75%. Moreover, the CBRT’s rates for late liquidity window
lending, O/N lending and O/N borrowing also remained unchanged at
20.75%, 19.25% and 16.25%, respectively, following the normalization
of the policy framework at the beginning of June.
The CBRT stressed that the recent sharp increase in inflation (which
reached a 14-year high of 15.4% y-o-y in June) was mainly driven by
food prices and cost factors. The CBRT also underlined that
maintaining a tight monetary policy stance for an extended period could
be necessary, as “elevated levels of inflation and inflation expectations
continue to pose risks on pricing behaviour”.
Looking ahead, provided that the new cabinet implements soon a
consistent and comprehensive programme to rein the country’s
increasing macroeconomic imbalances and vulnerabilities, we expect
the CBRT to keep its key policy rate on hold throughout the rest of the
year. Indeed, according to our Taylor rule, projecting: i) a declining
positive output gap (from 0.8% in Q2:18 to 0.4% in Q4:18); ii)
moderating headline inflation (from 15.4% in June to 14.8% at end-
Q4:18); iii) easing TRY depreciation (from 24.2% in June to 17.2% at
end-Q4:18 against the equally-weighted USD/EUR basket – consensus
forecast); and iv) a further rise in the FED rate (from 1.9% in June to
2.4% at end-Q4:18 – consensus forecast), the CBRT should maintain
unchanged its key policy rate (1-week repo rate) at 17.75% at least until
the end of the year.
Lending activity (FX-adjusted) slowed significantly in H1:18,
mainly on the back of higher interest rates and the fading impact
of the Credit Guarantee Fund (CGF) scheme. Lending growth,
adjusted for FX variations, declined markedly to 12.9% y-o-y at end-
H1:18 from a 4-year high of 20.1% at end-2017 – well below the
CBRT’s implicit reference level of 15.0%. The deceleration reflects
mainly the dissipating boost from the CGF and more prohibitive lending
interest rates.
Indeed, in an effort to preserve economic and financial stability
-- jeopardised by more visible signs of overheating and a weakening
global appetite for Turkish assets -- the authorities refrained from
raising the ceiling of the CGF this year, thus reducing the total amount
of loans granted under State guarantee to TRY 50bn in FY:18 from
TRY 200bn in FY:17 (12% of end-2016 banking sector loans).
Moreover, lending interest rates increased significantly, due to tighter
liquidity conditions and monetary policy stance (total and local currency
loans-to-deposits ratios reached record highs of 122.3% and 147.0%,
respectively, at end-December, while the CBRT’s average effective
funding rate rose by 2.9 pps y-o-y to 13.8% in H1:18). In fact, average
interest rates on TRY retail loans, TRY corporate loans and USD
corporate loans reached multi-year highs of 20.6%, 18.3% and 5.2%,
respectively, in H1:18 – up from 17.6%, 15.2% and 4.4% in H1:17.
Customer deposits (FX-adjusted) decelerated in H1:18, hampered
by heightened uncertainty ahead of the June 24th presidential and
parliamentary elections. Growth in customer deposits, adjusted for FX
variations, declined to 8.1% y-o-y at end-H1:18 from a 4-year high of
13.4% y-o-y at end-2017, hindered by mounting political and economic
uncertainty following the surprise announcement in early-April of
presidential and parliamentary elections on June 24th. The deceleration
in (FX-adjusted) deposits would have been even sharper had deposit
remuneration rates not been increased. Specifically, average interest
rates on TRY and USD deposits reached multi-year highs of 13.0% and
3.0%, respectively, in H1:18 – up from 10.5% and 2.5% in H1:17.
Page 3
10 – 23 July 2018
NBG - Emerging Markets Analysis – Bi-Weekly Report 2
Romania BBB- / Baa3 / BBB- (S&P / Moody’s / Fitch)
-12
-8
-4
0
4
8
12
16
20
-12
-8
-4
0
4
8
12
16
20
3M
:07
9M
:07
3M
:08
9M
:08
3M
:09
9M
:09
3M
:10
9M
:10
3M
:11
9M
:11
3M
:12
9M
:12
3M
:13
9M
:13
3M
:14
9M
:14
3M
:15
9M
:15
3M
:16
9M
:16
3M
:17
9M
:17
3M
:18
ROAE (cumulative, annualised, %)
0
5
10
15
20
25
30
0
5
10
15
20
25
30
Q1:0
7Q
3:0
7Q
1:0
8Q
3:0
8Q
1:0
9Q
3:0
9Q
1:1
0Q
3:1
0Q
1:1
1Q
3:1
1Q
1:1
2Q
3:1
2Q
1:1
3Q
3:1
3Q
1:1
4Q
3:1
4Q
1:1
5Q
3:1
5Q
1:1
6Q
3:1
6Q
1:1
7Q
3:1
7Q
1:1
8
NPL Ratio (%)
Loan Loss Ratio (standard, watch, substandard, doubtful and loss with over90, 60, 30, 15 and 0 dpd, respectively)NPL Ratio (sample banks using the standard approach in credit riskassessment)NPL Ratio (all banks using the standard approach in credit risk assessment)
NPL Ratio (EBA definition, exposures more than 90 dpd or unlikely to becollected without use of the collateral regardless of the dpd)
0
3
6
9
12
15
18
21
24
0
3
6
9
12
15
18
21
24
Q1
:07
Q3
:07
Q1:0
8Q
3:0
8Q
1:0
9Q
3:0
9Q
1:1
0Q
3:1
0Q
1:1
1Q
3:1
1Q
1:1
2Q
3:1
2Q
1:1
3Q
3:1
3Q
1:1
4Q
3:1
4Q
1:1
5Q
3:1
5Q
1:1
6Q
3:1
6Q
1:1
7Q
3:1
7Q
1:1
8
Capital Adequacy Ratio (%)
Total Capital Ratio (NBR definition)
Common Equity Tier 1 Ratio (EBA definition)
23 July 3-M F 6-M F 12-M F
1-m ROBOR (%) 2.8 2.9 2.9 3.0
RON/EUR 4.64 4.64 4.65 4.68
Sov. Spread (2024, bps) 132 125 120 110
23 July 1-W % YTD % 2-Y %
BET-BK 1,619 -0.4 -2.0 37.9
2015 2016 2017 2018F 2019F
Real GDP Growth (%) 3.9 4.8 7.0 4.4 3.8
Inflation (eop, %) -0.9 -0.5 3.3 4.2 3.7
Cur. Acct. Bal. (% GDP) -1.2 -2.1 -3.3 -4.1 -4.5
Fiscal Bal. (% GDP) -1.5 -2.4 -2.8 -4.0 -4.3
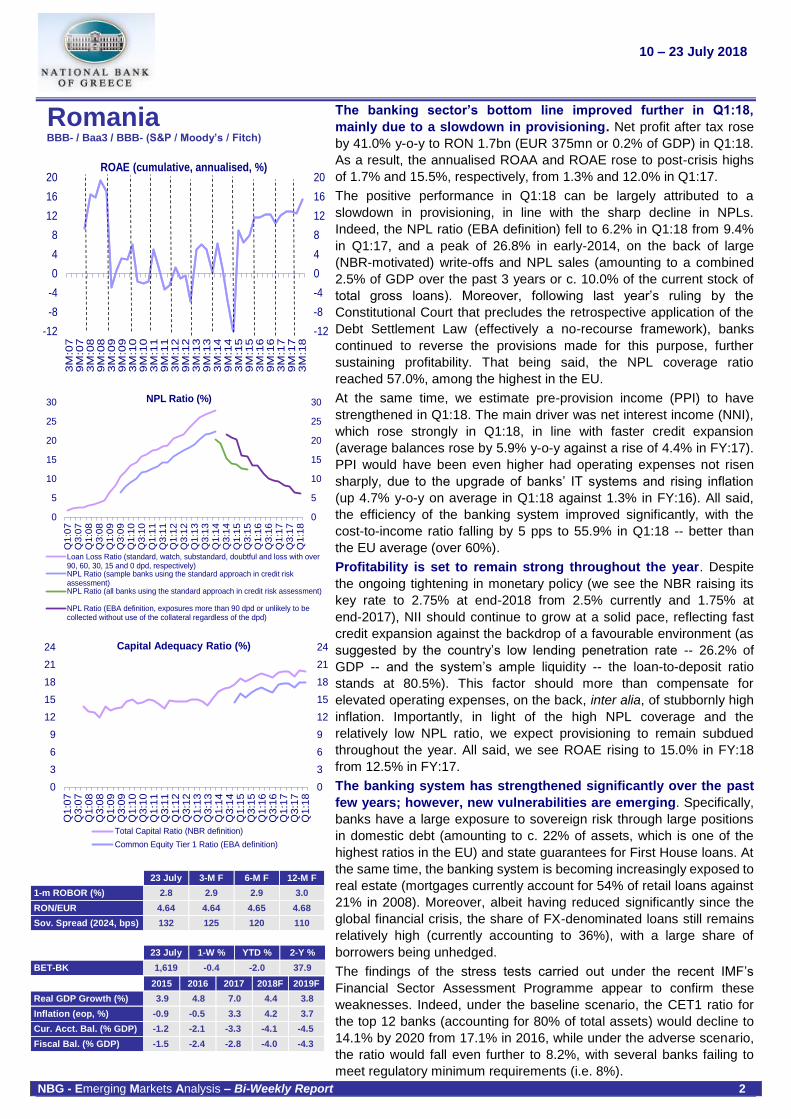
The banking sector’s bottom line improved further in Q1:18,
mainly due to a slowdown in provisioning. Net profit after tax rose
by 41.0% y-o-y to RON 1.7bn (EUR 375mn or 0.2% of GDP) in Q1:18.
As a result, the annualised ROAA and ROAE rose to post-crisis highs
of 1.7% and 15.5%, respectively, from 1.3% and 12.0% in Q1:17.
The positive performance in Q1:18 can be largely attributed to a
slowdown in provisioning, in line with the sharp decline in NPLs.
Indeed, the NPL ratio (EBA definition) fell to 6.2% in Q1:18 from 9.4%
in Q1:17, and a peak of 26.8% in early-2014, on the back of large
(NBR-motivated) write-offs and NPL sales (amounting to a combined
2.5% of GDP over the past 3 years or c. 10.0% of the current stock of
total gross loans). Moreover, following last year’s ruling by the
Constitutional Court that precludes the retrospective application of the
Debt Settlement Law (effectively a no-recourse framework), banks
continued to reverse the provisions made for this purpose, further
sustaining profitability. That being said, the NPL coverage ratio
reached 57.0%, among the highest in the EU.
At the same time, we estimate pre-provision income (PPI) to have
strengthened in Q1:18. The main driver was net interest income (NNI),
which rose strongly in Q1:18, in line with faster credit expansion
(average balances rose by 5.9% y-o-y against a rise of 4.4% in FY:17).
PPI would have been even higher had operating expenses not risen
sharply, due to the upgrade of banks’ IT systems and rising inflation
(up 4.7% y-o-y on average in Q1:18 against 1.3% in FY:16). All said,
the efficiency of the banking system improved significantly, with the
cost-to-income ratio falling by 5 pps to 55.9% in Q1:18 -- better than
the EU average (over 60%).
Profitability is set to remain strong throughout the year. Despite
the ongoing tightening in monetary policy (we see the NBR raising its
key rate to 2.75% at end-2018 from 2.5% currently and 1.75% at
end-2017), NII should continue to grow at a solid pace, reflecting fast
credit expansion against the backdrop of a favourable environment (as
suggested by the country’s low lending penetration rate -- 26.2% of
GDP -- and the system’s ample liquidity -- the loan-to-deposit ratio
stands at 80.5%). This factor should more than compensate for
elevated operating expenses, on the back, inter alia, of stubbornly high
inflation. Importantly, in light of the high NPL coverage and the
relatively low NPL ratio, we expect provisioning to remain subdued
throughout the year. All said, we see ROAE rising to 15.0% in FY:18
from 12.5% in FY:17.
The banking system has strengthened significantly over the past
few years; however, new vulnerabilities are emerging. Specifically,
banks have a large exposure to sovereign risk through large positions
in domestic debt (amounting to c. 22% of assets, which is one of the
highest ratios in the EU) and state guarantees for First House loans. At
the same time, the banking system is becoming increasingly exposed to
real estate (mortgages currently account for 54% of retail loans against
21% in 2008). Moreover, albeit having reduced significantly since the
global financial crisis, the share of FX-denominated loans still remains
relatively high (currently accounting to 36%), with a large share of
borrowers being unhedged.
The findings of the stress tests carried out under the recent IMF’s
Financial Sector Assessment Programme appear to confirm these
weaknesses. Indeed, under the baseline scenario, the CET1 ratio for
the top 12 banks (accounting for 80% of total assets) would decline to
14.1% by 2020 from 17.1% in 2016, while under the adverse scenario,
the ratio would fall even further to 8.2%, with several banks failing to
meet regulatory minimum requirements (i.e. 8%).
Page 4
10 – 23 July 2018
NBG - Emerging Markets Analysis– Bi-Weekly Report 3
Bulgaria BB+ / Baa2 / BBB- (S&P / Moody’s / Fitch)
-3
-2
-1
0
1
2
3
4
HCPI(y-o-y %change)
BudgetBalance
(% of GDP)
Long-TermInterest Rates
(%)
Gross PublicDebt
(% of GDP)
Maastricht Criteria(as of Mar. 2018)
60
40
20
0
BulgariaMaastrict Criteria
-3
-2
-1
0
1
2
3
4
-3
-2
-1
0
1
2
3
4
12
/13
12
/14
12
/15
12
/16
12
/17
06
/18
Contribution to Annual Headline CPI Inflation (pps)
Volatile Food Energy
Core Headline (y-o-y % change)*
-2
-1
0
1
2
3
4
5
6
-2
-1
0
1
2
3
4
5
6
12
/13
12
/14
12
/15
12
/16
12
/17
06
/18
Headline Inflation(y-o-y % change)
Bulgaria Romania Serbia FYROM Albania Σειρά6*
23 July 3-M F 6-M F 12-M F
Base Interest Rate (%) 0.0 0.1 0.1 0.2
BGN/EUR 1.96 1.96 1.96 1.96
Sov. Spread (2022, bps) 62 44 42 40
23 July 1-W % YTD % 2-Y %
SOFIX 639 -1.1 -5.6 45.6
2015 2016 2017E 2018F 2019F
Real GDP Growth (%) 3.6 3.9 3.6 3.8 3.5
Inflation (eop, %) -0.4 0.1 2.8 2.7 2.6
Cur. Acct. Bal. (% GDP) 0.0 2.3 4.5 3.1 1.7
Fiscal Bal. (% GDP) -2.8 1.6 0.9 -0.5 -0.3
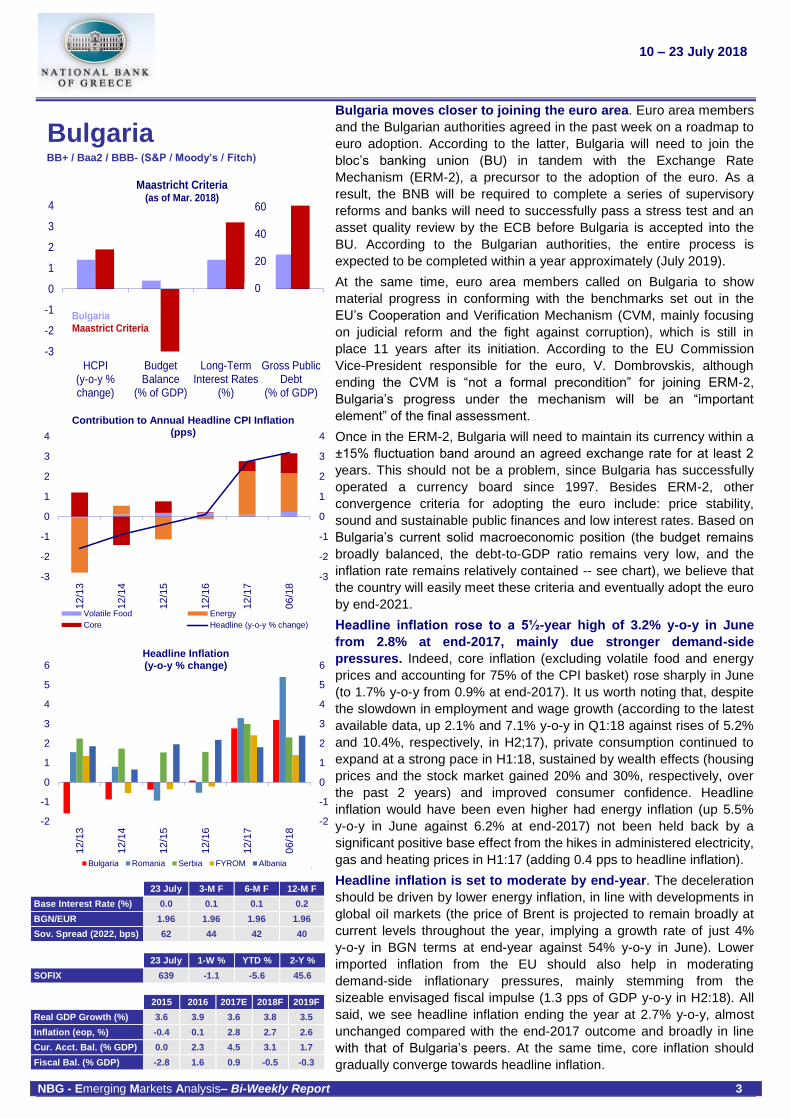
Bulgaria moves closer to joining the euro area. Euro area members
and the Bulgarian authorities agreed in the past week on a roadmap to
euro adoption. According to the latter, Bulgaria will need to join the
bloc’s banking union (BU) in tandem with the Exchange Rate
Mechanism (ERM-2), a precursor to the adoption of the euro. As a
result, the BNB will be required to complete a series of supervisory
reforms and banks will need to successfully pass a stress test and an
asset quality review by the ECB before Bulgaria is accepted into the
BU. According to the Bulgarian authorities, the entire process is
expected to be completed within a year approximately (July 2019).
At the same time, euro area members called on Bulgaria to show
material progress in conforming with the benchmarks set out in the
EU’s Cooperation and Verification Mechanism (CVM, mainly focusing
on judicial reform and the fight against corruption), which is still in
place 11 years after its initiation. According to the EU Commission
Vice-President responsible for the euro, V. Dombrovskis, although
ending the CVM is “not a formal precondition” for joining ERM-2,
Bulgaria’s progress under the mechanism will be an “important
element” of the final assessment.
Once in the ERM-2, Bulgaria will need to maintain its currency within a
±15% fluctuation band around an agreed exchange rate for at least 2
years. This should not be a problem, since Bulgaria has successfully
operated a currency board since 1997. Besides ERM-2, other
convergence criteria for adopting the euro include: price stability,
sound and sustainable public finances and low interest rates. Based on
Bulgaria’s current solid macroeconomic position (the budget remains
broadly balanced, the debt-to-GDP ratio remains very low, and the
inflation rate remains relatively contained -- see chart), we believe that
the country will easily meet these criteria and eventually adopt the euro
by end-2021.
Headline inflation rose to a 5½-year high of 3.2% y-o-y in June
from 2.8% at end-2017, mainly due stronger demand-side
pressures. Indeed, core inflation (excluding volatile food and energy
prices and accounting for 75% of the CPI basket) rose sharply in June
(to 1.7% y-o-y from 0.9% at end-2017). It us worth noting that, despite
the slowdown in employment and wage growth (according to the latest
available data, up 2.1% and 7.1% y-o-y in Q1:18 against rises of 5.2%
and 10.4%, respectively, in H2;17), private consumption continued to
expand at a strong pace in H1:18, sustained by wealth effects (housing
prices and the stock market gained 20% and 30%, respectively, over
the past 2 years) and improved consumer confidence. Headline
inflation would have been even higher had energy inflation (up 5.5%
y-o-y in June against 6.2% at end-2017) not been held back by a
significant positive base effect from the hikes in administered electricity,
gas and heating prices in H1:17 (adding 0.4 pps to headline inflation).
Headline inflation is set to moderate by end-year. The deceleration
should be driven by lower energy inflation, in line with developments in
global oil markets (the price of Brent is projected to remain broadly at
current levels throughout the year, implying a growth rate of just 4%
y-o-y in BGN terms at end-year against 54% y-o-y in June). Lower
imported inflation from the EU should also help in moderating
demand-side inflationary pressures, mainly stemming from the
sizeable envisaged fiscal impulse (1.3 pps of GDP y-o-y in H2:18). All
said, we see headline inflation ending the year at 2.7% y-o-y, almost
unchanged compared with the end-2017 outcome and broadly in line
with that of Bulgaria’s peers. At the same time, core inflation should
gradually converge towards headline inflation.
Page 5
10 – 23 July 2018
NBG - Emerging Markets Analysis – Bi-Weekly Report 4
Serbia
BB / Ba3 / BB (S&P / Moody’s / Fitch)
-1
0
1
2
3
4
-1
0
1
2
3
4
12
/13
12
/14
12
/15
12
/16
12
/17
06
/18
12
/19
Contributions to Annual Headline CPI Inflation (pps)
Energy
F&V
Core
Headline (y-o-y % change)
Forecast
0
2
4
6
8
10
12
14
0
2
4
6
8
10
12
14
12
/10
12
/11
12
/12
12
/13
12
/14
12
/15
12
/16
12
/17
06
/18
12
/19
Headline Inflation, Inflation Target and Nominal Policy Rate
Upper Bound Lower Bound
2-Week Repo Rate Inflation
Forecast
75
80
85
90
95
100
105
110
115
120
125
-400
-300
-200
-100
0
100
200
300
400
12
/08
06
/09
12
/09
06
/10
12
/10
06
/11
12
/11
06
/12
12
/12
06
/13
12
/13
06
/14
12
/14
06
/15
12
/15
06
/16
12
/16
06
/17
12
/17
06
/18
NBS Interventions & Exchange Rate
Net NBS Interventions (EUR mn, lhs)
EUR/RSD (rhs)
23 July 3-M F 6-M F 12-M F
1-m BELIBOR (%) 2.6 2.9 3.1 3.5
RSD/EUR 117.9 117.9 117.6 117.4
Sov. Spread (2021, bps) 132 132 126 120
23 July 1-W % YTD % 2-Y %
BELEX-15 727 -0.8 -4.4 19.0
2015 2016 2017 2018F 2019F
Real GDP Growth (%) 0.8 2.8 1.9 3.6 3.6
Inflation (eop, %) 1.5 1.6 3.0 2.5 2.8
Cur. Acct. Bal. (% GDP) -3.7 -3.1 -5.7 -4.9 -4.8
Fiscal Bal. (% GDP) -3.7 -1.3 1.2 0.3 0.1
The IMF Executive Board approved a 30-month (non-financing)
Policy Coordination Instrument (PCI) for Serbia. Following the
completion of its 3-year EUR 1.1bn precautionary SBA (2.7% of 2018
GDP) in February 2018, Serbia remained engaged with the IMF
through the (recently-introduced, non-financing) PCI. The agreed
policies and reforms supported by the PCI programme aim mainly to:
i) boost growth and maintain macroeconomic and financial stability. In
fact, strong fiscal position is expected to be maintained, while
accommodating growth-enhancing measures and reducing the public
debt-to-GDP ratio to c. 50% by the expiration of the programme (from
61.5% at end-2017).
ii) advance structural and institutional reforms, including public
administration and financial sector reforms, the restructuring or
resolution of SOEs, the fight against the grey economy and the
improvement in the business climate.
Although the new 30-month arrangement with the IMF in the form of a
PCI will not provide financial support to Serbia, it should: i) improve
confidence in the domestic economy, by signalling a commitment to
the agreed reform agenda under semi-annual reviews of economic
policies; and ii) provide a buffer against external shocks, as it facilitates
access to IMF funds.
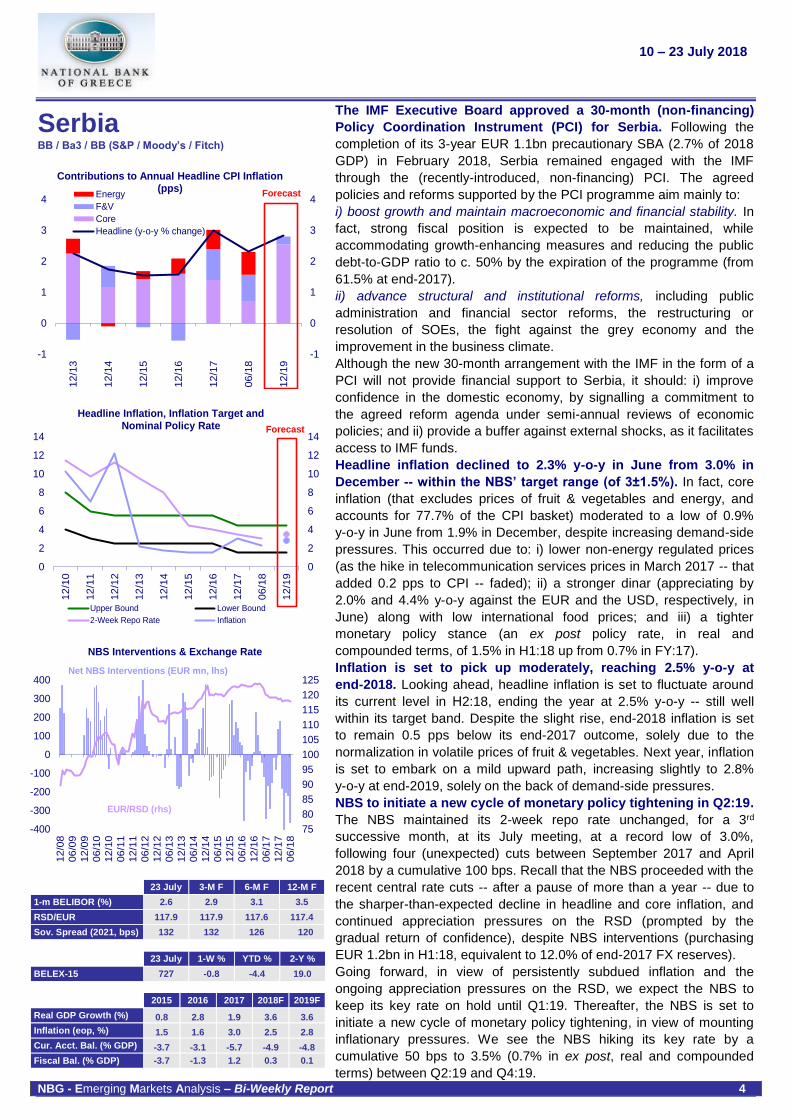
Headline inflation declined to 2.3% y-o-y in June from 3.0% in
December -- within the NBS’ target range (of 3±1.5%). In fact, core
inflation (that excludes prices of fruit & vegetables and energy, and
accounts for 77.7% of the CPI basket) moderated to a low of 0.9%
y-o-y in June from 1.9% in December, despite increasing demand-side
pressures. This occurred due to: i) lower non-energy regulated prices
(as the hike in telecommunication services prices in March 2017 -- that
added 0.2 pps to CPI -- faded); ii) a stronger dinar (appreciating by
2.0% and 4.4% y-o-y against the EUR and the USD, respectively, in
June) along with low international food prices; and iii) a tighter
monetary policy stance (an ex post policy rate, in real and
compounded terms, of 1.5% in H1:18 up from 0.7% in FY:17).
Inflation is set to pick up moderately, reaching 2.5% y-o-y at
end-2018. Looking ahead, headline inflation is set to fluctuate around
its current level in Η2:18, ending the year at 2.5% y-o-y -- still well
within its target band. Despite the slight rise, end-2018 inflation is set
to remain 0.5 pps below its end-2017 outcome, solely due to the
normalization in volatile prices of fruit & vegetables. Next year, inflation
is set to embark on a mild upward path, increasing slightly to 2.8%
y-o-y at end-2019, solely on the back of demand-side pressures.
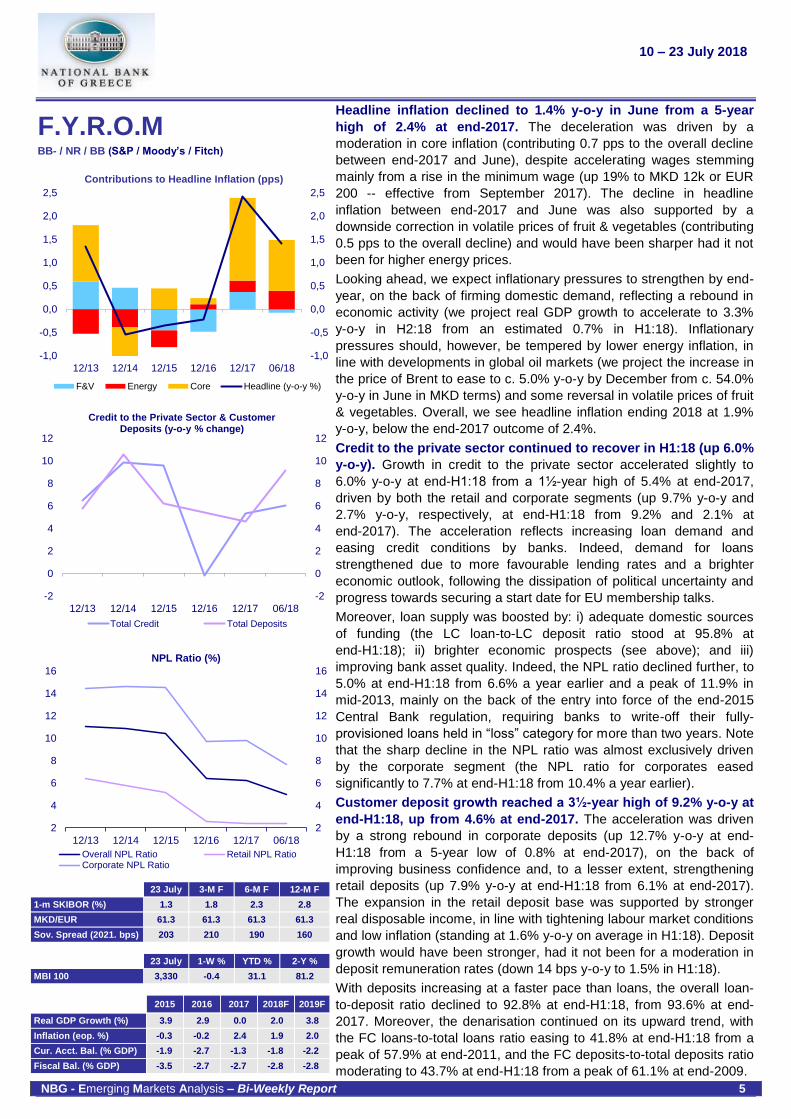
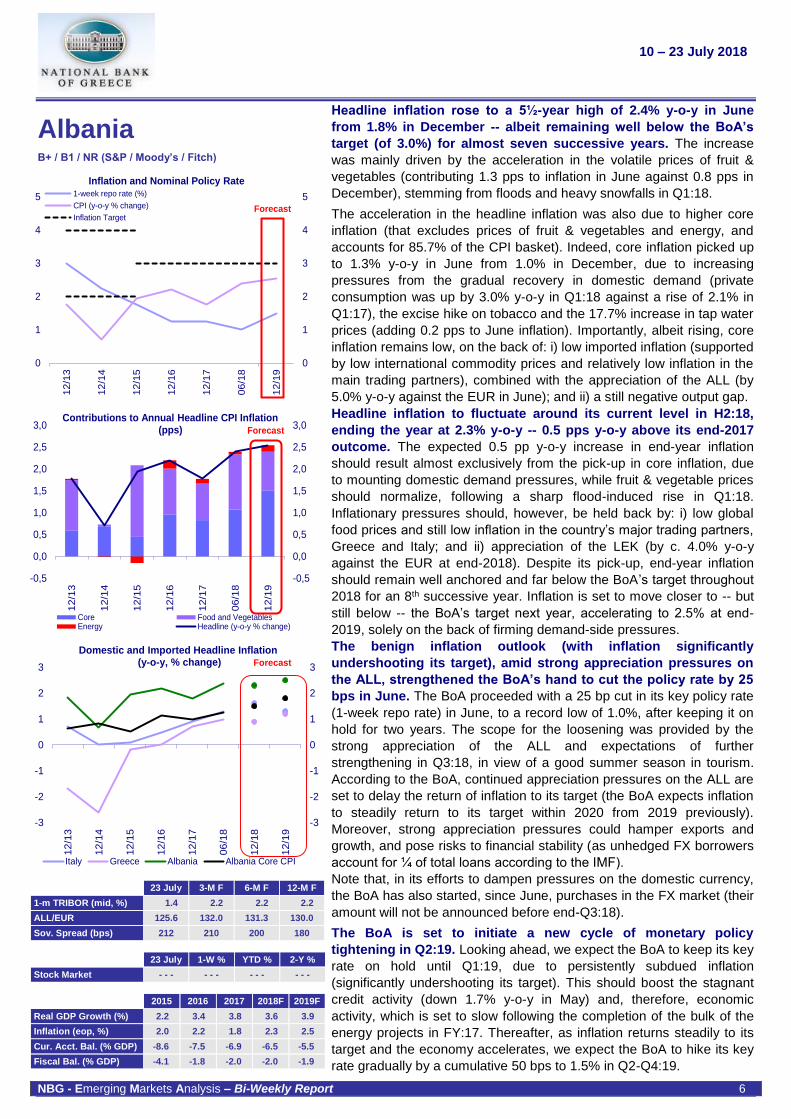
NBS to initiate a new cycle of monetary policy tightening in Q2:19.
The NBS maintained its 2-week repo rate unchanged, for a 3rd
successive month, at its July meeting, at a record low of 3.0%,
following four (unexpected) cuts between September 2017 and April
2018 by a cumulative 100 bps. Recall that the NBS proceeded with the
recent central rate cuts -- after a pause of more than a year -- due to
the sharper-than-expected decline in headline and core inflation, and
continued appreciation pressures on the RSD (prompted by the
gradual return of confidence), despite NBS interventions (purchasing
EUR 1.2bn in H1:18, equivalent to 12.0% of end-2017 FX reserves).
Going forward, in view of persistently subdued inflation and the
ongoing appreciation pressures on the RSD, we expect the NBS to
keep its key rate on hold until Q1:19. Thereafter, the NBS is set to
initiate a new cycle of monetary policy tightening, in view of mounting
inflationary pressures. We see the NBS hiking its key rate by a
cumulative 50 bps to 3.5% (0.7% in ex post, real and compounded
terms) between Q2:19 and Q4:19.
Page 6
10 – 23 July 2018
NBG - Emerging Markets Analysis – Bi-Weekly Report 5
F.Y.R.O.M BB- / NR / BB (S&P / Moody’s / Fitch)
-1,0
-0,5
0,0
0,5
1,0
1,5
2,0
2,5
-1,0
-0,5
0,0
0,5
1,0
1,5
2,0
2,5
12/13 12/14 12/15 12/16 12/17 06/18
Contributions to Headline Inflation (pps)
F&V Energy Core Headline (y-o-y %)
-2
0
2
4
6
8
10
12
-2
0
2
4
6
8
10
12
12/13 12/14 12/15 12/16 12/17 06/18
Credit to the Private Sector & Customer Deposits (y-o-y % change)
Total Credit Total Deposits
2
4
6
8
10
12
14
16
2
4
6
8
10
12
14
16
12/13 12/14 12/15 12/16 12/17 06/18
Overall NPL Ratio Retail NPL RatioCorporate NPL Ratio
NNPL Ratio (%)
23 July 3-M F 6-M F 12-M F
1-m SKIBOR (%) 1.3 1.8 2.3 2.8
MKD/EUR 61.3 61.3 61.3 61.3
Sov. Spread (2021. bps) 203 210 190 160
23 July 1-W % YTD % 2-Y %
MBI 100 3,330 -0.4 31.1 81.2
2015 2016 2017 2018F 2019F
Real GDP Growth (%) 3.9 2.9 0.0 2.0 3.8
Inflation (eop. %) -0.3 -0.2 2.4 1.9 2.0
Cur. Acct. Bal. (% GDP) -1.9 -2.7 -1.3 -1.8 -2.2
Fiscal Bal. (% GDP) -3.5 -2.7 -2.7 -2.8 -2.8
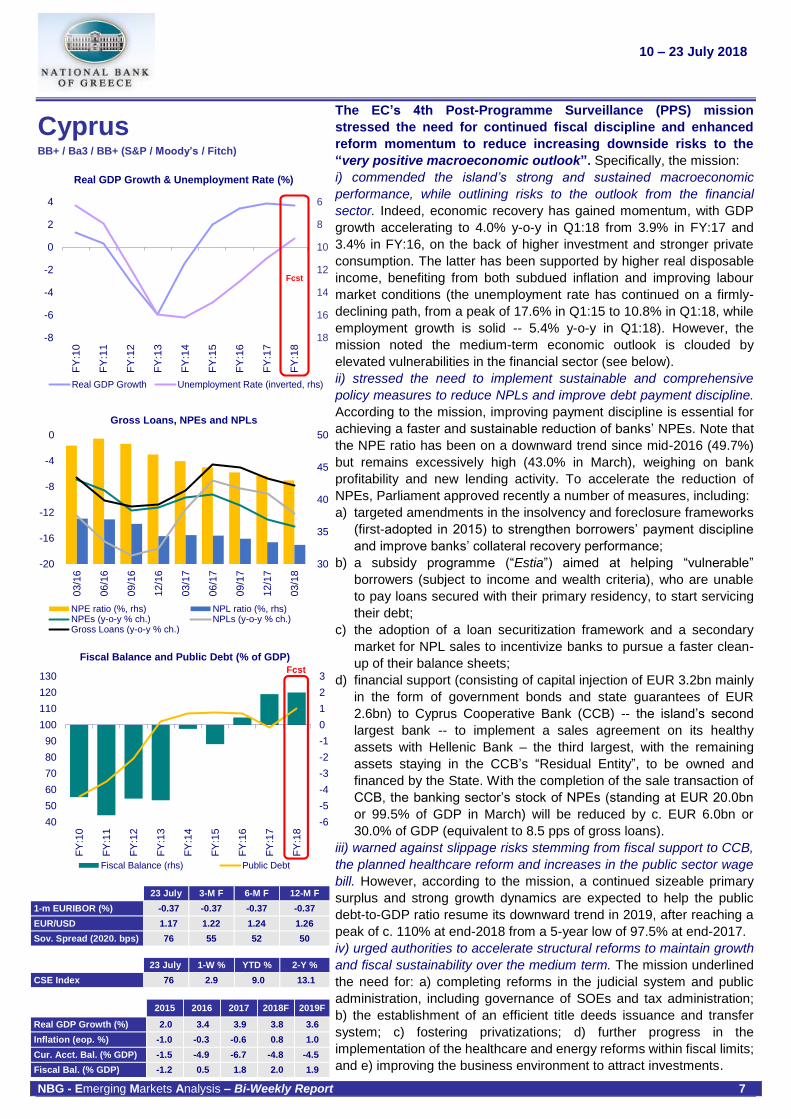
Headline inflation declined to 1.4% y-o-y in June from a 5-year
high of 2.4% at end-2017. The deceleration was driven by a
moderation in core inflation (contributing 0.7 pps to the overall decline
between end-2017 and June), despite accelerating wages stemming
mainly from a rise in the minimum wage (up 19% to MKD 12k or EUR
200 -- effective from September 2017). The decline in headline
inflation between end-2017 and June was also supported by a
downside correction in volatile prices of fruit & vegetables (contributing
0.5 pps to the overall decline) and would have been sharper had it not
been for higher energy prices.
Looking ahead, we expect inflationary pressures to strengthen by end-
year, on the back of firming domestic demand, reflecting a rebound in
economic activity (we project real GDP growth to accelerate to 3.3%
y-o-y in H2:18 from an estimated 0.7% in H1:18). Inflationary
pressures should, however, be tempered by lower energy inflation, in
line with developments in global oil markets (we project the increase in
the price of Brent to ease to c. 5.0% y-o-y by December from c. 54.0%
y-o-y in June in MKD terms) and some reversal in volatile prices of fruit
& vegetables. Overall, we see headline inflation ending 2018 at 1.9%
y-o-y, below the end-2017 outcome of 2.4%.
Credit to the private sector continued to recover in H1:18 (up 6.0%
y-o-y). Growth in credit to the private sector accelerated slightly to
6.0% y-o-y at end-H1:18 from a 1½-year high of 5.4% at end-2017,
driven by both the retail and corporate segments (up 9.7% y-o-y and
2.7% y-o-y, respectively, at end-H1:18 from 9.2% and 2.1% at
end-2017). The acceleration reflects increasing loan demand and
easing credit conditions by banks. Indeed, demand for loans
strengthened due to more favourable lending rates and a brighter
economic outlook, following the dissipation of political uncertainty and
progress towards securing a start date for EU membership talks.
Moreover, loan supply was boosted by: i) adequate domestic sources
of funding (the LC loan-to-LC deposit ratio stood at 95.8% at
end-H1:18); ii) brighter economic prospects (see above); and iii)
improving bank asset quality. Indeed, the NPL ratio declined further, to
5.0% at end-H1:18 from 6.6% a year earlier and a peak of 11.9% in
mid-2013, mainly on the back of the entry into force of the end-2015
Central Bank regulation, requiring banks to write-off their fully-
provisioned loans held in “loss” category for more than two years. Note
that the sharp decline in the NPL ratio was almost exclusively driven
by the corporate segment (the NPL ratio for corporates eased
significantly to 7.7% at end-H1:18 from 10.4% a year earlier).
Customer deposit growth reached a 3½-year high of 9.2% y-o-y at
end-H1:18, up from 4.6% at end-2017. The acceleration was driven
by a strong rebound in corporate deposits (up 12.7% y-o-y at end-
H1:18 from a 5-year low of 0.8% at end-2017), on the back of
improving business confidence and, to a lesser extent, strengthening
retail deposits (up 7.9% y-o-y at end-H1:18 from 6.1% at end-2017).
The expansion in the retail deposit base was supported by stronger
real disposable income, in line with tightening labour market conditions
and low inflation (standing at 1.6% y-o-y on average in H1:18). Deposit
growth would have been stronger, had it not been for a moderation in
deposit remuneration rates (down 14 bps y-o-y to 1.5% in H1:18).
With deposits increasing at a faster pace than loans, the overall loan-
to-deposit ratio declined to 92.8% at end-H1:18, from 93.6% at end-
2017. Moreover, the denarisation continued on its upward trend, with
the FC loans-to-total loans ratio easing to 41.8% at end-H1:18 from a
peak of 57.9% at end-2011, and the FC deposits-to-total deposits ratio
moderating to 43.7% at end-H1:18 from a peak of 61.1% at end-2009.
Page 7
10 – 23 July 2018
NBG - Emerging Markets Analysis – Bi-Weekly Report 6
Albania
B+ / B1 / NR (S&P / Moody’s / Fitch)
0
1
2
3
4
5
0
1
2
3
4
5
12
/13
12
/14
12
/15
12
/16
12
/17
06
/18
12
/19
Inflation and Nominal Policy Rate1-week repo rate (%)
CPI (y-o-y % change)
Inflation TargetForecast
-0,5
0,0
0,5
1,0
1,5
2,0
2,5
3,0
-0,5
0,0
0,5
1,0
1,5
2,0
2,5
3,0
12
/13
12
/14
12
/15
12
/16
12
/17
06
/18
12
/19
Contributions to Annual Headline CPI Inflation (pps)
Core Food and VegetablesEnergy Headline (y-o-y % change)
Forecast
-3
-2
-1
0
1
2
3
-3
-2
-1
0
1
2
3
12
/13
12
/14
12
/15
12
/16
12
/17
06
/18
12
/18
12
/19
Domestic and Imported Headline Inflation(y-o-y, % change)
Italy Greece Albania Albania Core CPI
Forecast
23 July 3-M F 6-M F 12-M F
1-m TRIBOR (mid, %) 1.4 2.2 2.2 2.2
ALL/EUR 125.6 132.0 131.3 130.0
Sov. Spread (bps) 212 210 200 180
23 July 1-W % YTD % 2-Y %
Stock Market - - - - - - - - - - - -
2015 2016 2017 2018F 2019F
Real GDP Growth (%) 2.2 3.4 3.8 3.6 3.9
Inflation (eop, %) 2.0 2.2 1.8 2.3 2.5
Cur. Acct. Bal. (% GDP) -8.6 -7.5 -6.9 -6.5 -5.5
Fiscal Bal. (% GDP) -4.1 -1.8 -2.0 -2.0 -1.9
Headline inflation rose to a 5½-year high of 2.4% y-o-y in June
from 1.8% in December -- albeit remaining well below the BoA’s
target (of 3.0%) for almost seven successive years. The increase
was mainly driven by the acceleration in the volatile prices of fruit &
vegetables (contributing 1.3 pps to inflation in June against 0.8 pps in
December), stemming from floods and heavy snowfalls in Q1:18.
The acceleration in the headline inflation was also due to higher core
inflation (that excludes prices of fruit & vegetables and energy, and
accounts for 85.7% of the CPI basket). Indeed, core inflation picked up
to 1.3% y-o-y in June from 1.0% in December, due to increasing
pressures from the gradual recovery in domestic demand (private
consumption was up by 3.0% y-o-y in Q1:18 against a rise of 2.1% in
Q1:17), the excise hike on tobacco and the 17.7% increase in tap water
prices (adding 0.2 pps to June inflation). Importantly, albeit rising, core
inflation remains low, on the back of: i) low imported inflation (supported
by low international commodity prices and relatively low inflation in the
main trading partners), combined with the appreciation of the ALL (by
5.0% y-o-y against the EUR in June); and ii) a still negative output gap.
Headline inflation to fluctuate around its current level in H2:18,
ending the year at 2.3% y-o-y -- 0.5 pps y-o-y above its end-2017
outcome. The expected 0.5 pp y-o-y increase in end-year inflation
should result almost exclusively from the pick-up in core inflation, due
to mounting domestic demand pressures, while fruit & vegetable prices
should normalize, following a sharp flood-induced rise in Q1:18.
Inflationary pressures should, however, be held back by: i) low global
food prices and still low inflation in the country’s major trading partners,
Greece and Italy; and ii) appreciation of the LEK (by c. 4.0% y-o-y
against the EUR at end-2018). Despite its pick-up, end-year inflation
should remain well anchored and far below the BoA’s target throughout
2018 for an 8th successive year. Inflation is set to move closer to -- but
still below -- the BoA’s target next year, accelerating to 2.5% at end-
2019, solely on the back of firming demand-side pressures.
The benign inflation outlook (with inflation significantly
undershooting its target), amid strong appreciation pressures on
the ALL, strengthened the BoA’s hand to cut the policy rate by 25
bps in June. The BoA proceeded with a 25 bp cut in its key policy rate
(1-week repo rate) in June, to a record low of 1.0%, after keeping it on
hold for two years. The scope for the loosening was provided by the
strong appreciation of the ALL and expectations of further
strengthening in Q3:18, in view of a good summer season in tourism.
According to the BoA, continued appreciation pressures on the ALL are
set to delay the return of inflation to its target (the BoA expects inflation
to steadily return to its target within 2020 from 2019 previously).
Moreover, strong appreciation pressures could hamper exports and
growth, and pose risks to financial stability (as unhedged FX borrowers
account for ¼ of total loans according to the IMF).
Note that, in its efforts to dampen pressures on the domestic currency,
the BoA has also started, since June, purchases in the FX market (their
amount will not be announced before end-Q3:18).
The BoA is set to initiate a new cycle of monetary policy
tightening in Q2:19. Looking ahead, we expect the BoA to keep its key
rate on hold until Q1:19, due to persistently subdued inflation
(significantly undershooting its target). This should boost the stagnant
credit activity (down 1.7% y-o-y in May) and, therefore, economic
activity, which is set to slow following the completion of the bulk of the
energy projects in FY:17. Thereafter, as inflation returns steadily to its
target and the economy accelerates, we expect the BoA to hike its key
rate gradually by a cumulative 50 bps to 1.5% in Q2-Q4:19.
Page 8
10 – 23 July 2018
NBG - Emerging Markets Analysis – Bi-Weekly Report 7
Cyprus BB+ / Ba3 / BB+ (S&P / Moody’s / Fitch)
6
8
10
12
14
16
18-8
-6
-4
-2
0
2
4
FY
:10
FY
:11
FY
:12
FY
:13
FY
:14
FY
:15
FY
:16
FY
:17
FY
:18
Real GDP Growth & Unemployment Rate (%)
Real GDP Growth Unemployment Rate (inverted, rhs)
Fcst
30
35
40
45
50
-20
-16
-12
-8
-4
0
03
/16
06
/16
09
/16
12
/16
03
/17
06
/17
09
/17
12
/17
03
/18
Gross Loans, NPEs and NPLs
NPE ratio (%, rhs) NPL ratio (%, rhs)NPEs (y-o-y % ch.) NPLs (y-o-y % ch.)Gross Loans (y-o-y % ch.)
-6
-5
-4
-3
-2
-1
0
1
2
3
40
50
60
70
80
90
100
110
120
130
FY
:10
FY
:11
FY
:12
FY
:13
FY
:14
FY
:15
FY
:16
FY
:17
FY
:18
Fiscal Balance and Public Debt (% of GDP)
Fiscal Balance (rhs) Public Debt
Fcst
23 July 3-M F 6-M F 12-M F
1-m EURIBOR (%) -0.37 -0.37 -0.37 -0.37
EUR/USD 1.17 1.22 1.24 1.26
Sov. Spread (2020. bps) 76 55 52 50
23 July 1-W % YTD % 2-Y %
CSE Index 76 2.9 9.0 13.1
2015 2016 2017 2018F 2019F
Real GDP Growth (%) 2.0 3.4 3.9 3.8 3.6
Inflation (eop. %) -1.0 -0.3 -0.6 0.8 1.0
Cur. Acct. Bal. (% GDP) -1.5 -4.9 -6.7 -4.8 -4.5
Fiscal Bal. (% GDP) -1.2 0.5 1.8 2.0 1.9
The EC’s 4th Post-Programme Surveillance (PPS) mission
stressed the need for continued fiscal discipline and enhanced
reform momentum to reduce increasing downside risks to the
“very positive macroeconomic outlook”. Specifically, the mission:
i) commended the island’s strong and sustained macroeconomic
performance, while outlining risks to the outlook from the financial
sector. Indeed, economic recovery has gained momentum, with GDP
growth accelerating to 4.0% y-o-y in Q1:18 from 3.9% in FY:17 and
3.4% in FY:16, on the back of higher investment and stronger private
consumption. The latter has been supported by higher real disposable
income, benefiting from both subdued inflation and improving labour
market conditions (the unemployment rate has continued on a firmly-
declining path, from a peak of 17.6% in Q1:15 to 10.8% in Q1:18, while
employment growth is solid -- 5.4% y-o-y in Q1:18). However, the
mission noted the medium-term economic outlook is clouded by
elevated vulnerabilities in the financial sector (see below).
ii) stressed the need to implement sustainable and comprehensive
policy measures to reduce NPLs and improve debt payment discipline.
According to the mission, improving payment discipline is essential for
achieving a faster and sustainable reduction of banks’ NPEs. Note that
the NPE ratio has been on a downward trend since mid-2016 (49.7%)
but remains excessively high (43.0% in March), weighing on bank
profitability and new lending activity. To accelerate the reduction of
NPEs, Parliament approved recently a number of measures, including:
a) targeted amendments in the insolvency and foreclosure frameworks
(first-adopted in 2015) to strengthen borrowers’ payment discipline
and improve banks’ collateral recovery performance;
b) a subsidy programme (“Estia”) aimed at helping “vulnerable”
borrowers (subject to income and wealth criteria), who are unable
to pay loans secured with their primary residency, to start servicing
their debt;
c) the adoption of a loan securitization framework and a secondary
market for NPL sales to incentivize banks to pursue a faster clean-
up of their balance sheets;
d) financial support (consisting of capital injection of EUR 3.2bn mainly
in the form of government bonds and state guarantees of EUR
2.6bn) to Cyprus Cooperative Bank (CCB) -- the island’s second
largest bank -- to implement a sales agreement on its healthy
assets with Hellenic Bank – the third largest, with the remaining
assets staying in the CCB’s “Residual Entity”, to be owned and
financed by the State. With the completion of the sale transaction of
CCB, the banking sector’s stock of NPEs (standing at EUR 20.0bn
or 99.5% of GDP in March) will be reduced by c. EUR 6.0bn or
30.0% of GDP (equivalent to 8.5 pps of gross loans).
iii) warned against slippage risks stemming from fiscal support to CCB,
the planned healthcare reform and increases in the public sector wage
bill. However, according to the mission, a continued sizeable primary
surplus and strong growth dynamics are expected to help the public
debt-to-GDP ratio resume its downward trend in 2019, after reaching a
peak of c. 110% at end-2018 from a 5-year low of 97.5% at end-2017.
iv) urged authorities to accelerate structural reforms to maintain growth
and fiscal sustainability over the medium term. The mission underlined
the need for: a) completing reforms in the judicial system and public
administration, including governance of SOEs and tax administration;
b) the establishment of an efficient title deeds issuance and transfer
system; c) fostering privatizations; d) further progress in the
implementation of the healthcare and energy reforms within fiscal limits;
and e) improving the business environment to attract investments.
Page 9
10 – 23 July 2018
NBG - Emerging Markets Analysis – Bi-Weekly Report 8
Egypt
B / B3 / B (S&P / Moody’s / Fitch)
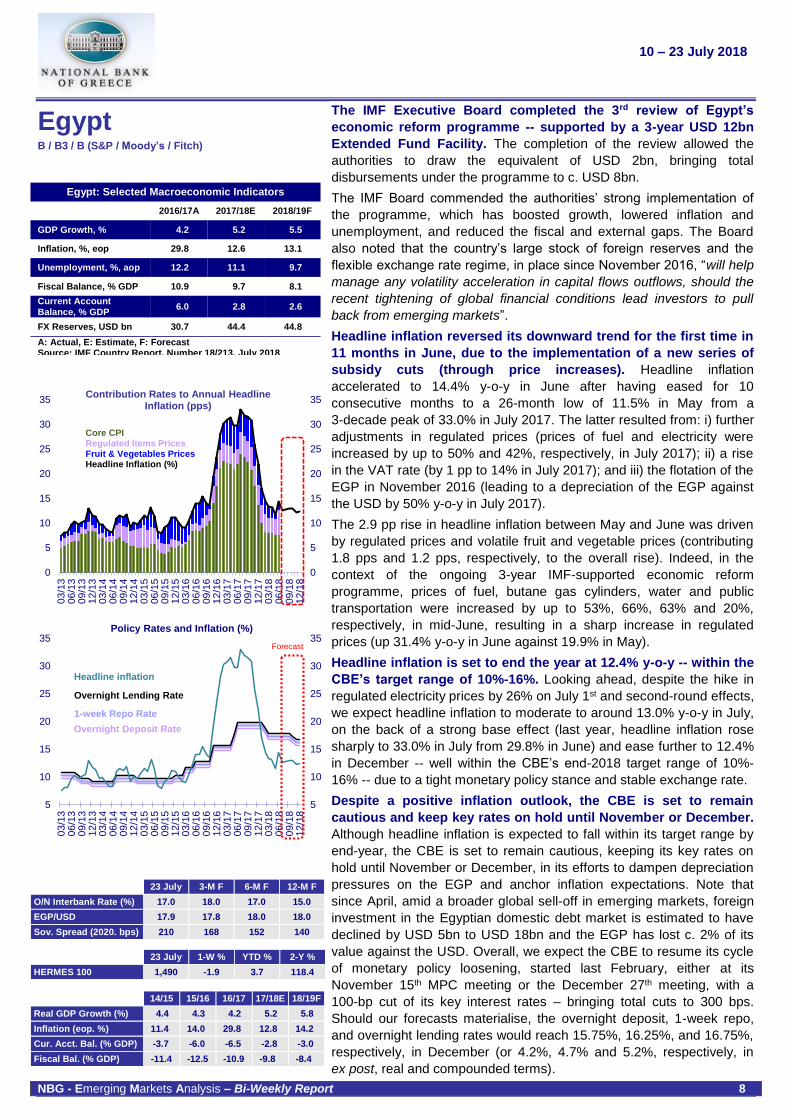
Egypt: Selected Macroeconomic Indicators
2016/17A 2017/18E 2018/19F
GDP Growth, % 4.2 5.2 5.5
Inflation, %, eop 29.8 12.6 13.1
Unemployment, %, aop 12.2 11.1 9.7
Fiscal Balance, % GDP 10.9 9.7 8.1
Current Account Balance, % GDP
6.0 2.8 2.6
FX Reserves, USD bn 30.7 44.4 44.8
A: Actual, E: Estimate, F: Forecast Source: IMF Country Report, Number 18/213, July 2018
0
5
10
15
20
25
30
35
0
5
10
15
20
25
30
35
03
/13
06
/13
09
/13
12
/13
03
/14
06
/14
09
/14
12
/14
03
/15
06
/15
09
/15
12
/15
03
/16
06
/16
09
/16
12
/16
03
/17
06
/17
09
/17
12
/17
03
/18
06
/18
09
/18
12
/18
Contribution Rates to Annual Headline Inflation (pps)
Core CPI Regulated Items PricesFruit & Vegetables Prices Headline Inflation (%)
5
10
15
20
25
30
35
5
10
15
20
25
30
35
03
/13
06
/13
09
/13
12
/13
03
/14
06
/14
09
/14
12
/14
03
/15
06
/15
09
/15
12
/15
03
/16
06
/16
09
/16
12
/16
03
/17
06
/17
09
/17
12
/17
03
/18
06
/18
09
/18
12
/18
Policy Rates and Inflation (%)
Overnight Lending Rate
Headline inflation
1-week Repo Rate
Overnight Deposit Rate
Forecast
23 July 3-M F 6-M F 12-M F
O/N Interbank Rate (%) 17.0 18.0 17.0 15.0
EGP/USD 17.9 17.8 18.0 18.0
Sov. Spread (2020. bps) 210 168 152 140
23 July 1-W % YTD % 2-Y %
HERMES 100 1,490 -1.9 3.7 118.4
14/15 15/16 16/17 17/18E 18/19F
Real GDP Growth (%) 4.4 4.3 4.2 5.2 5.8
Inflation (eop. %) 11.4 14.0 29.8 12.8 14.2
Cur. Acct. Bal. (% GDP) -3.7 -6.0 -6.5 -2.8 -3.0
Fiscal Bal. (% GDP) -11.4 -12.5 -10.9 -9.8 -8.4
The IMF Executive Board completed the 3rd review of Egypt’s
economic reform programme -- supported by a 3-year USD 12bn
Extended Fund Facility. The completion of the review allowed the
authorities to draw the equivalent of USD 2bn, bringing total
disbursements under the programme to c. USD 8bn.
The IMF Board commended the authorities’ strong implementation of
the programme, which has boosted growth, lowered inflation and
unemployment, and reduced the fiscal and external gaps. The Board
also noted that the country’s large stock of foreign reserves and the
flexible exchange rate regime, in place since November 2016, “will help
manage any volatility acceleration in capital flows outflows, should the
recent tightening of global financial conditions lead investors to pull
back from emerging markets”.
Headline inflation reversed its downward trend for the first time in
11 months in June, due to the implementation of a new series of
subsidy cuts (through price increases). Headline inflation
accelerated to 14.4% y-o-y in June after having eased for 10
consecutive months to a 26-month low of 11.5% in May from a
3-decade peak of 33.0% in July 2017. The latter resulted from: i) further
adjustments in regulated prices (prices of fuel and electricity were
increased by up to 50% and 42%, respectively, in July 2017); ii) a rise
in the VAT rate (by 1 pp to 14% in July 2017); and iii) the flotation of the
EGP in November 2016 (leading to a depreciation of the EGP against
the USD by 50% y-o-y in July 2017).
The 2.9 pp rise in headline inflation between May and June was driven
by regulated prices and volatile fruit and vegetable prices (contributing
1.8 pps and 1.2 pps, respectively, to the overall rise). Indeed, in the
context of the ongoing 3-year IMF-supported economic reform
programme, prices of fuel, butane gas cylinders, water and public
transportation were increased by up to 53%, 66%, 63% and 20%,
respectively, in mid-June, resulting in a sharp increase in regulated
prices (up 31.4% y-o-y in June against 19.9% in May).
Headline inflation is set to end the year at 12.4% y-o-y -- within the
CBE’s target range of 10%-16%. Looking ahead, despite the hike in
regulated electricity prices by 26% on July 1st and second-round effects,
we expect headline inflation to moderate to around 13.0% y-o-y in July,
on the back of a strong base effect (last year, headline inflation rose
sharply to 33.0% in July from 29.8% in June) and ease further to 12.4%
in December -- well within the CBE’s end-2018 target range of 10%-
16% -- due to a tight monetary policy stance and stable exchange rate.
Despite a positive inflation outlook, the CBE is set to remain
cautious and keep key rates on hold until November or December.
Although headline inflation is expected to fall within its target range by
end-year, the CBE is set to remain cautious, keeping its key rates on
hold until November or December, in its efforts to dampen depreciation
pressures on the EGP and anchor inflation expectations. Note that
since April, amid a broader global sell-off in emerging markets, foreign
investment in the Egyptian domestic debt market is estimated to have
declined by USD 5bn to USD 18bn and the EGP has lost c. 2% of its
value against the USD. Overall, we expect the CBE to resume its cycle
of monetary policy loosening, started last February, either at its
November 15th MPC meeting or the December 27th meeting, with a
100-bp cut of its key interest rates – bringing total cuts to 300 bps.
Should our forecasts materialise, the overnight deposit, 1-week repo,
and overnight lending rates would reach 15.75%, 16.25%, and 16.75%,
respectively, in December (or 4.2%, 4.7% and 5.2%, respectively, in
ex post, real and compounded terms).
Page 10
10 – 23 July 2018
NBG - Emerging Market Research – Bi-Weekly Report 9
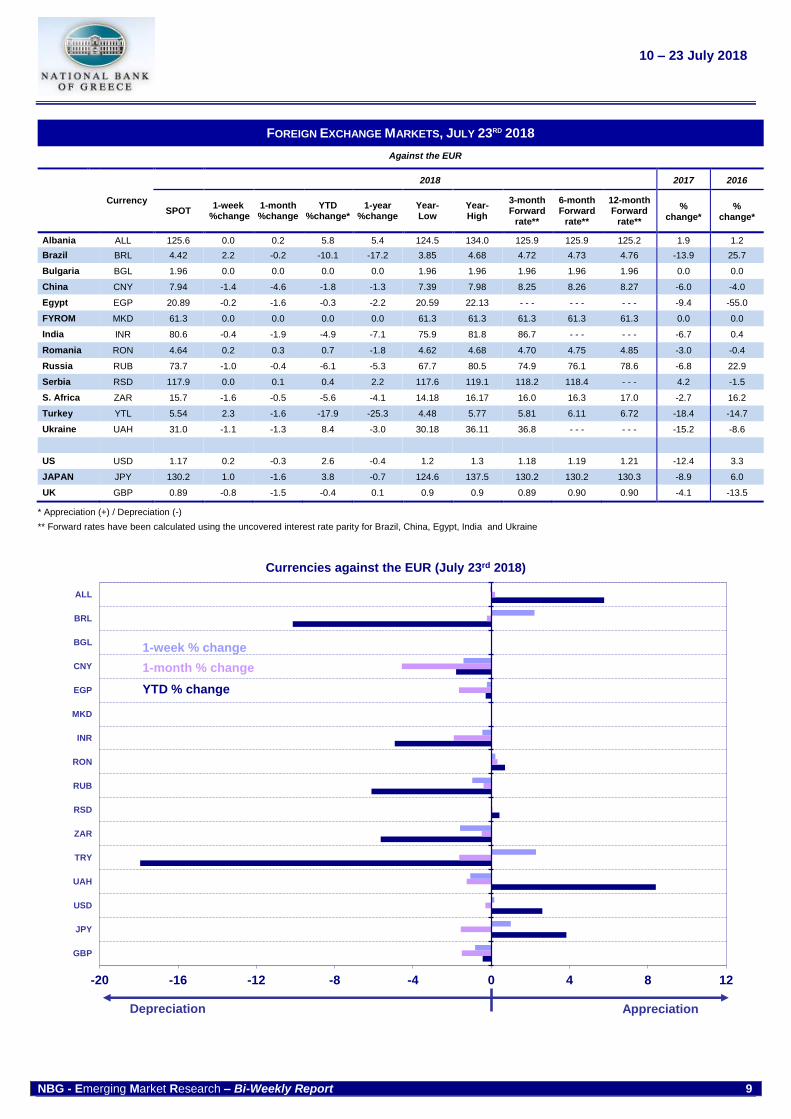
FOREIGN EXCHANGE MARKETS, JULY 23RD 2018
Against the EUR
Currency
2018 2017 2016
SPOT 1-week
%change 1-month %change
YTD %change*
1-year %change
Year- Low
Year- High
3-month Forward
rate**
6-month Forward
rate**
12-month Forward
rate**
%
change*
%
change*
Albania ALL 125.6 0.0 0.2 5.8 5.4 124.5 134.0 125.9 125.9 125.2 1.9 1.2
Brazil BRL 4.42 2.2 -0.2 -10.1 -17.2 3.85 4.68 4.72 4.73 4.76 -13.9 25.7
Bulgaria BGL 1.96 0.0 0.0 0.0 0.0 1.96 1.96 1.96 1.96 1.96 0.0 0.0
China CNY 7.94 -1.4 -4.6 -1.8 -1.3 7.39 7.98 8.25 8.26 8.27 -6.0 -4.0
Egypt EGP 20.89 -0.2 -1.6 -0.3 -2.2 20.59 22.13 - - - - - - - - - -9.4 -55.0
FYROM MKD 61.3 0.0 0.0 0.0 0.0 61.3 61.3 61.3 61.3 61.3 0.0 0.0
India INR 80.6 -0.4 -1.9 -4.9 -7.1 75.9 81.8 86.7 - - - - - - -6.7 0.4
Romania RON 4.64 0.2 0.3 0.7 -1.8 4.62 4.68 4.70 4.75 4.85 -3.0 -0.4
Russia RUB 73.7 -1.0 -0.4 -6.1 -5.3 67.7 80.5 74.9 76.1 78.6 -6.8 22.9
Serbia RSD 117.9 0.0 0.1 0.4 2.2 117.6 119.1 118.2 118.4 - - - 4.2 -1.5
S. Africa ZAR 15.7 -1.6 -0.5 -5.6 -4.1 14.18 16.17 16.0 16.3 17.0 -2.7 16.2
Turkey YTL 5.54 2.3 -1.6 -17.9 -25.3 4.48 5.77 5.81 6.11 6.72 -18.4 -14.7
Ukraine UAH 31.0 -1.1 -1.3 8.4 -3.0 30.18 36.11 36.8 - - - - - - -15.2 -8.6
US USD 1.17 0.2 -0.3 2.6 -0.4 1.2 1.3 1.18 1.19 1.21 -12.4 3.3
JAPAN JPY 130.2 1.0 -1.6 3.8 -0.7 124.6 137.5 130.2 130.2 130.3 -8.9 6.0
UK GBP 0.89 -0.8 -1.5 -0.4 0.1 0.9 0.9 0.89 0.90 0.90 -4.1 -13.5
* Appreciation (+) / Depreciation (-)
** Forward rates have been calculated using the uncovered interest rate parity for Brazil, China, Egypt, India and Ukraine
-20 -16 -12 -8 -4 0 4 8 12
GBP
JPY
USD
UAH
TRY
ZAR
RSD
RUB
RON
INR
MKD
EGP
CNY
BGL
BRL
ALL
Currencies against the EUR (July 23rd 2018)
1-week % change
1-month % change
YTD % change
Depreciation Appreciation
Page 11
10 – 23 July 2018
NBG - Emerging Market Research – Bi-Weekly Report 10
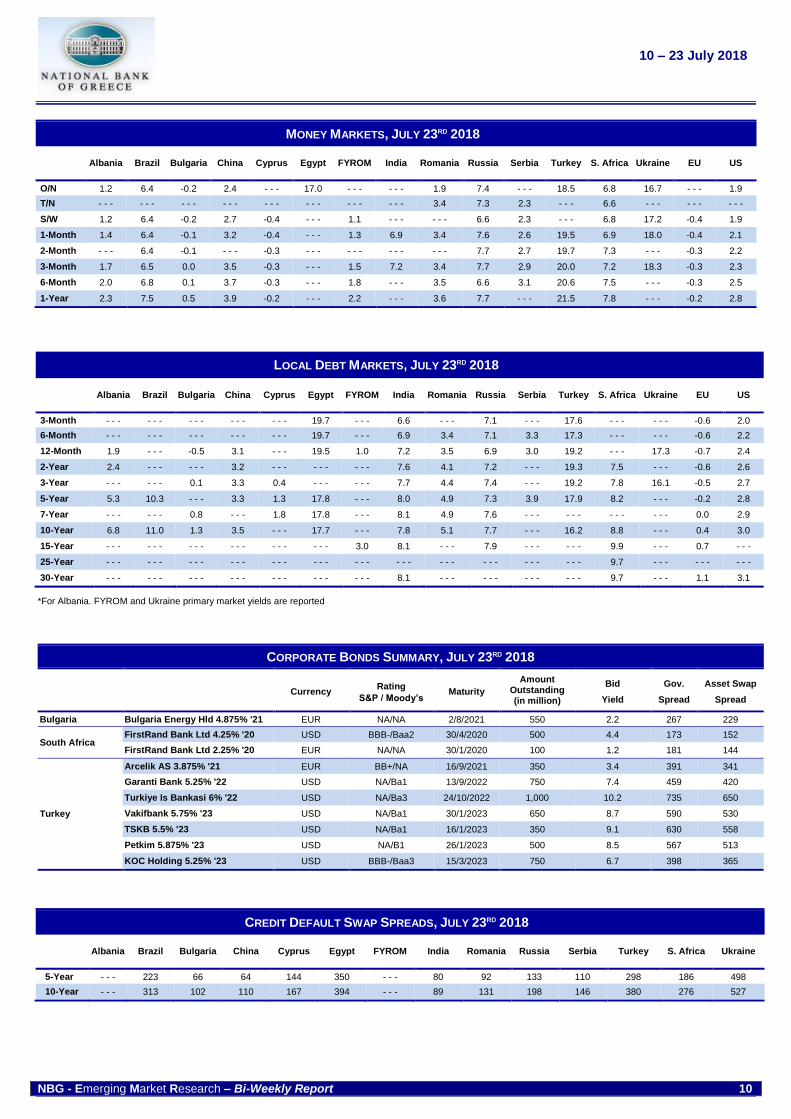
MONEY MARKETS, JULY 23RD 2018
Albania Brazil Bulgaria China Cyprus Egypt FYROM India Romania Russia Serbia Turkey S. Africa Ukraine EU US
O/N 1.2 6.4 -0.2 2.4 - - - 17.0 - - - - - - 1.9 7.4 - - - 18.5 6.8 16.7 - - - 1.9
T/N - - - - - - - - - - - - - - - - - - - - - - - - 3.4 7.3 2.3 - - - 6.6 - - - - - - - - -
S/W 1.2 6.4 -0.2 2.7 -0.4 - - - 1.1 - - - - - - 6.6 2.3 - - - 6.8 17.2 -0.4 1.9
1-Month 1.4 6.4 -0.1 3.2 -0.4 - - - 1.3 6.9 3.4 7.6 2.6 19.5 6.9 18.0 -0.4 2.1
2-Month - - - 6.4 -0.1 - - - -0.3 - - - - - - - - - - - - 7.7 2.7 19.7 7.3 - - - -0.3 2.2
3-Month 1.7 6.5 0.0 3.5 -0.3 - - - 1.5 7.2 3.4 7.7 2.9 20.0 7.2 18.3 -0.3 2.3
6-Month 2.0 6.8 0.1 3.7 -0.3 - - - 1.8 - - - 3.5 6.6 3.1 20.6 7.5 - - - -0.3 2.5
1-Year 2.3 7.5 0.5 3.9 -0.2 - - - 2.2 - - - 3.6 7.7 - - - 21.5 7.8 - - - -0.2 2.8
LOCAL DEBT MARKETS, JULY 23RD 2018
Albania
Brazil
Bulgaria China Cyprus Egypt FYROM India Romania Russia Serbia Turkey S. Africa Ukraine EU US
3-Month - - - - - - - - - - - - - - - 19.7 - - - 6.6 - - - 7.1 - - - 17.6 - - - - - - -0.6 2.0
6-Month - - - - - - - - - - - - - - - 19.7 - - - 6.9 3.4 7.1 3.3 17.3 - - - - - - -0.6 2.2
12-Month 1.9 - - - -0.5 3.1 - - - 19.5 1.0 7.2 3.5 6.9 3.0 19.2 - - - 17.3 -0.7 2.4
2-Year 2.4 - - - - - - 3.2 - - - - - - - - - 7.6 4.1 7.2 - - - 19.3 7.5 - - - -0.6 2.6
3-Year - - - - - - 0.1 3.3 0.4 - - - - - - 7.7 4.4 7.4 - - - 19.2 7.8 16.1 -0.5 2.7
5-Year 5.3 10.3 - - - 3.3 1.3 17.8 - - - 8.0 4.9 7.3 3.9 17.9 8.2 - - - -0.2 2.8
7-Year - - - - - - 0.8 - - - 1.8 17.8 - - - 8.1 4.9 7.6 - - - - - - - - - - - - 0.0 2.9
10-Year 6.8 11.0 1.3 3.5 - - - 17.7 - - - 7.8 5.1 7.7 - - - 16.2 8.8 - - - 0.4 3.0
15-Year - - - - - - - - - - - - - - - - - - 3.0 8.1 - - - 7.9 - - - - - - 9.9 - - - 0.7 - - -
25-Year - - - - - - - - - - - - - - - - - - - - - - - - - - - - - - - - - - - - 9.7 - - - - - - - - -
30-Year - - - - - - - - - - - - - - - - - - - - - 8.1 - - - - - - - - - - - - 9.7 - - - 1.1 3.1
*For Albania. FYROM and Ukraine primary market yields are reported
CORPORATE BONDS SUMMARY, JULY 23RD 2018
Currency
Rating
S&P / Moody’s Maturity
Amount Outstanding (in million)
Bid
Yield
Gov.
Spread
Asset Swap
Spread
Bulgaria Bulgaria Energy Hld 4.875% '21 EUR NA/NA 2/8/2021 550 2.2 267 229
South Africa FirstRand Bank Ltd 4.25% '20 USD BBB-/Baa2 30/4/2020 500 4.4 173 152
FirstRand Bank Ltd 2.25% '20 EUR NA/NA 30/1/2020 100 1.2 181 144
Turkey
Arcelik AS 3.875% '21 EUR BB+/NA 16/9/2021 350 3.4 391 341
Garanti Bank 5.25% '22 USD NA/Ba1 13/9/2022 750 7.4 459 420
Turkiye Is Bankasi 6% '22 USD NA/Ba3 24/10/2022 1,000 10.2 735 650
Vakifbank 5.75% '23 USD NA/Ba1 30/1/2023 650 8.7 590 530
TSKB 5.5% '23 USD NA/Ba1 16/1/2023 350 9.1 630 558
Petkim 5.875% '23 USD NA/B1 26/1/2023 500 8.5 567 513
KOC Holding 5.25% '23 USD BBB-/Baa3 15/3/2023 750 6.7 398 365
CREDIT DEFAULT SWAP SPREADS, JULY 23RD 2018
Albania Brazil Bulgaria China Cyprus Egypt FYROM India Romania Russia Serbia Turkey S. Africa Ukraine
5-Year - - - 223 66 64 144 350 - - - 80 92 133 110 298 186 498
10-Year - - - 313 102 110 167 394 - - - 89 131 198 146 380 276 527
Page 12
10 – 23 July 2018
NBG - Emerging Market Research – Bi-Weekly Report 11
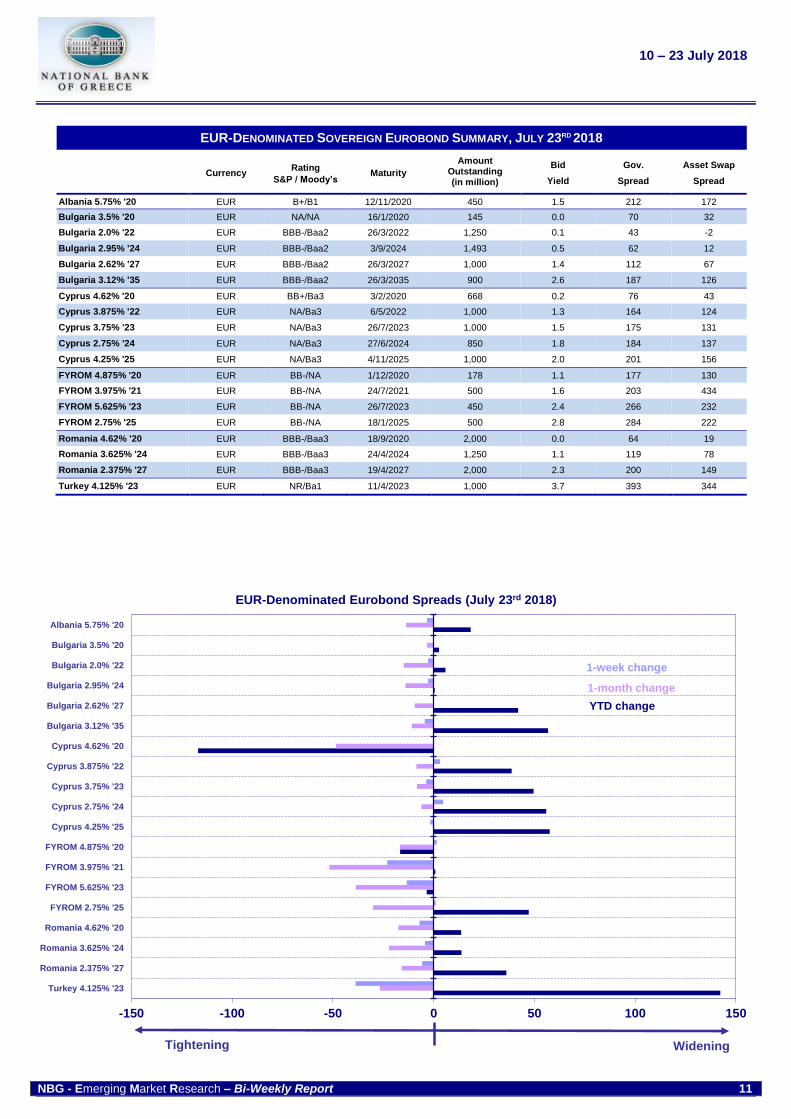
EUR-DENOMINATED SOVEREIGN EUROBOND SUMMARY, JULY 23RD 2018
Currency
Rating
S&P / Moody’s Maturity
Amount Outstanding (in million)
Bid
Yield
Gov.
Spread
Asset Swap
Spread
Albania 5.75% '20 EUR B+/B1 12/11/2020 450 1.5 212 172
Bulgaria 3.5% '20 EUR NA/NA 16/1/2020 145 0.0 70 32
Bulgaria 2.0% '22 EUR BBB-/Baa2 26/3/2022 1,250 0.1 43 -2
Bulgaria 2.95% '24 EUR BBB-/Baa2 3/9/2024 1,493 0.5 62 12
Bulgaria 2.62% '27 EUR BBB-/Baa2 26/3/2027 1,000 1.4 112 67
Bulgaria 3.12% '35 EUR BBB-/Baa2 26/3/2035 900 2.6 187 126
Cyprus 4.62% '20 EUR BB+/Ba3 3/2/2020 668 0.2 76 43
Cyprus 3.875% '22 EUR NA/Ba3 6/5/2022 1,000 1.3 164 124
Cyprus 3.75% '23 EUR NA/Ba3 26/7/2023 1,000 1.5 175 131
Cyprus 2.75% '24 EUR NA/Ba3 27/6/2024 850 1.8 184 137
Cyprus 4.25% '25 EUR NA/Ba3 4/11/2025 1,000 2.0 201 156
FYROM 4.875% '20 EUR BB-/NA 1/12/2020 178 1.1 177 130
FYROM 3.975% '21 EUR BB-/NA 24/7/2021 500 1.6 203 434
FYROM 5.625% '23 EUR BB-/NA 26/7/2023 450 2.4 266 232
FYROM 2.75% '25 EUR BB-/NA 18/1/2025 500 2.8 284 222
Romania 4.62% '20 EUR BBB-/Baa3 18/9/2020 2,000 0.0 64 19
Romania 3.625% '24 EUR BBB-/Baa3 24/4/2024 1,250 1.1 119 78
Romania 2.375% '27 EUR BBB-/Baa3 19/4/2027 2,000 2.3 200 149
Turkey 4.125% '23 EUR NR/Ba1 11/4/2023 1,000 3.7 393 344
-150 -100 -50 0 50 100 150
Turkey 4.125% '23
Romania 2.375% '27
Romania 3.625% '24
Romania 4.62% '20
FYROM 2.75% '25
FYROM 5.625% '23
FYROM 3.975% '21
FYROM 4.875% '20
Cyprus 4.25% '25
Cyprus 2.75% '24
Cyprus 3.75% '23
Cyprus 3.875% '22
Cyprus 4.62% '20
Bulgaria 3.12% '35
Bulgaria 2.62% '27
Bulgaria 2.95% '24
Bulgaria 2.0% '22
Bulgaria 3.5% '20
Albania 5.75% '20
EUR-Denominated Eurobond Spreads (July 23rd 2018)
Tightening Widening
YTD change
1-week change
1-month change
Page 13
10 – 23 July 2018
NBG - Emerging Market Research – Bi-Weekly Report 12
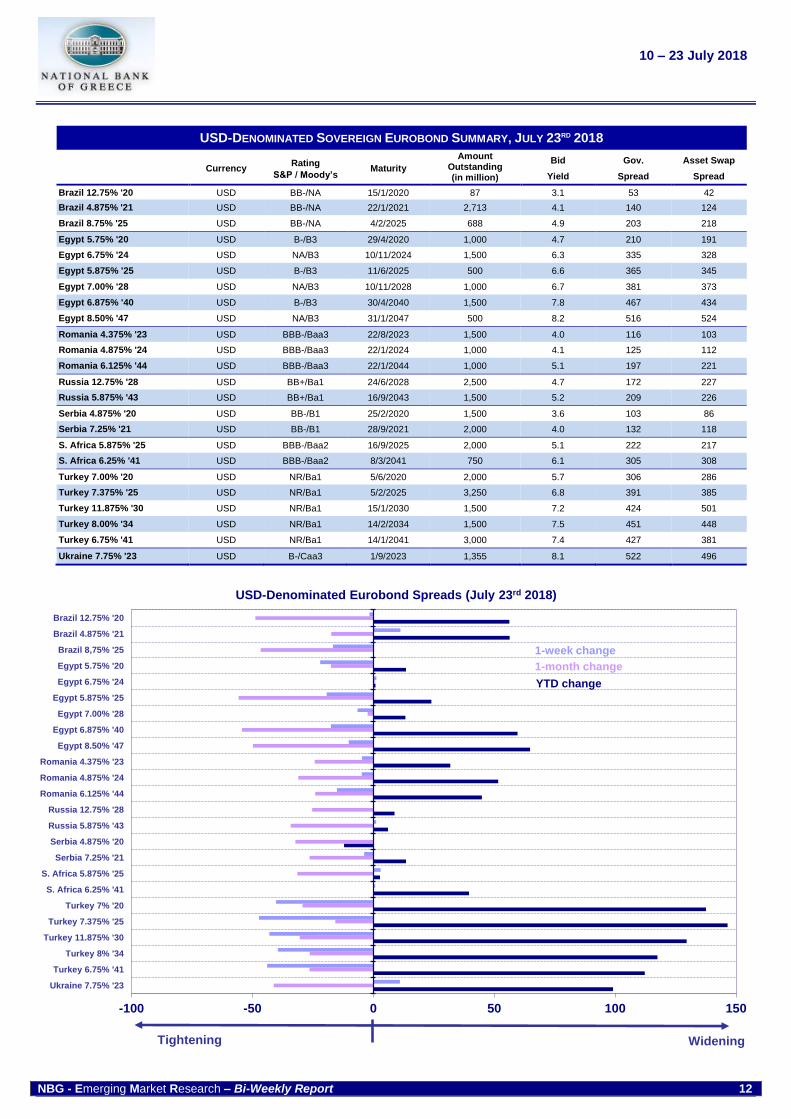
USD-DENOMINATED SOVEREIGN EUROBOND SUMMARY, JULY 23RD 2018
Currency
Rating
S&P / Moody’s Maturity
Amount Outstanding (in million)
Bid
Yield
Gov.
Spread
Asset Swap
Spread
Brazil 12.75% '20 USD BB-/NA 15/1/2020 87 3.1 53 42
Brazil 4.875% '21 USD BB-/NA 22/1/2021 2,713 4.1 140 124
Brazil 8.75% '25 USD BB-/NA 4/2/2025 688 4.9 203 218
Egypt 5.75% '20 USD B-/B3 29/4/2020 1,000 4.7 210 191
Egypt 6.75% '24 USD NA/B3 10/11/2024 1,500 6.3 335 328
Egypt 5.875% '25 USD B-/B3 11/6/2025 500 6.6 365 345
Egypt 7.00% '28 USD NA/B3 10/11/2028 1,000 6.7 381 373
Egypt 6.875% '40 USD B-/B3 30/4/2040 1,500 7.8 467 434
Egypt 8.50% '47 USD NA/B3 31/1/2047 500 8.2 516 524
Romania 4.375% '23 USD BBB-/Baa3 22/8/2023 1,500 4.0 116 103
Romania 4.875% '24 USD BBB-/Baa3 22/1/2024 1,000 4.1 125 112
Romania 6.125% '44 USD BBB-/Baa3 22/1/2044 1,000 5.1 197 221
Russia 12.75% '28 USD BB+/Ba1 24/6/2028 2,500 4.7 172 227
Russia 5.875% '43 USD BB+/Ba1 16/9/2043 1,500 5.2 209 226
Serbia 4.875% '20 USD BB-/B1 25/2/2020 1,500 3.6 103 86
Serbia 7.25% '21 USD BB-/B1 28/9/2021 2,000 4.0 132 118
S. Africa 5.875% '25 USD BBB-/Baa2 16/9/2025 2,000 5.1 222 217
S. Africa 6.25% '41 USD BBB-/Baa2 8/3/2041 750 6.1 305 308
Turkey 7.00% '20 USD NR/Ba1 5/6/2020 2,000 5.7 306 286
Turkey 7.375% '25 USD NR/Ba1 5/2/2025 3,250 6.8 391 385
Turkey 11.875% '30 USD NR/Ba1 15/1/2030 1,500 7.2 424 501
Turkey 8.00% '34 USD NR/Ba1 14/2/2034 1,500 7.5 451 448
Turkey 6.75% '41 USD NR/Ba1 14/1/2041 3,000 7.4 427 381
Ukraine 7.75% '23 USD B-/Caa3 1/9/2023 1,355 8.1 522 496
-100 -50 0 50 100 150
Ukraine 7.75% '23
Turkey 6.75% '41
Turkey 8% '34
Turkey 11.875% '30
Turkey 7.375% '25
Turkey 7% '20
S. Africa 6.25% '41
S. Africa 5.875% '25
Serbia 7.25% '21
Serbia 4.875% '20
Russia 5.875% '43
Russia 12.75% '28
Romania 6.125% '44
Romania 4.875% '24
Romania 4.375% '23
Egypt 8.50% '47
Egypt 6.875% '40
Egypt 7.00% '28
Egypt 5.875% '25
Egypt 6.75% '24
Egypt 5.75% '20
Brazil 8,75% '25
Brazil 4.875% '21
Brazil 12.75% '20
USD-Denominated Eurobond Spreads (July 23rd 2018)
Tightening Widening
YTD change
1-week change
1-month change
Page 14
10 – 23 July 2018
NBG - Emerging Market Research – Bi-Weekly Report 13
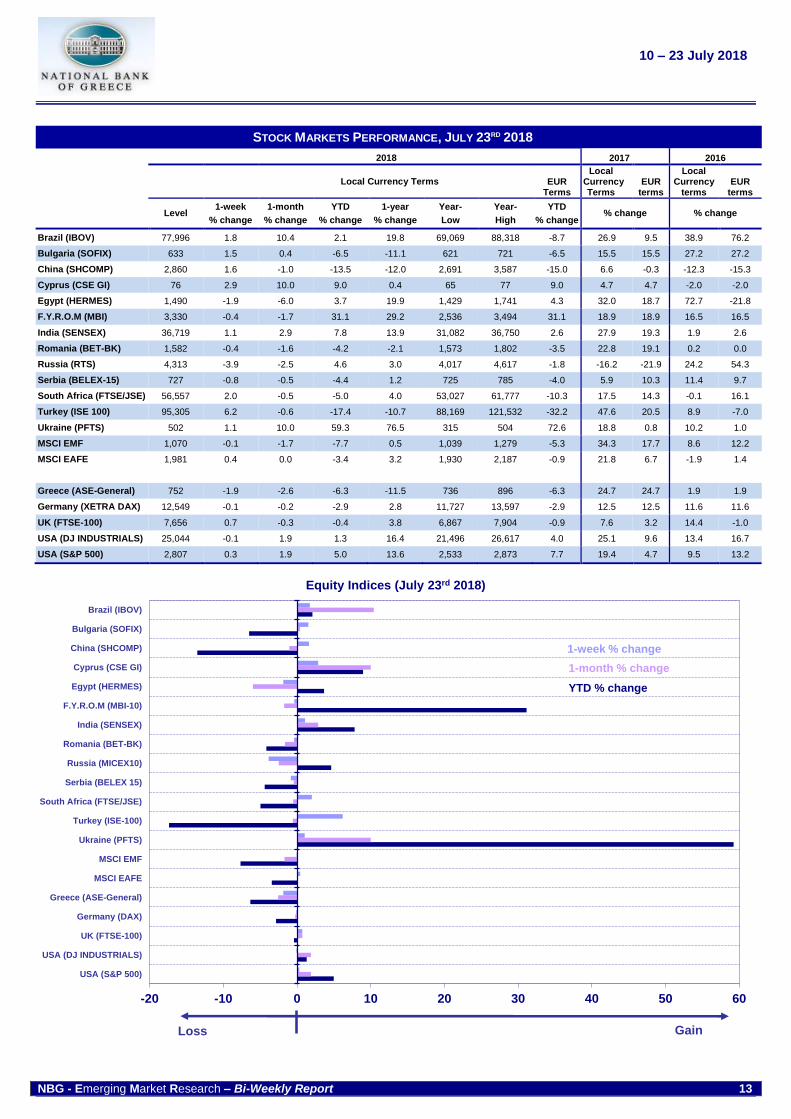
STOCK MARKETS PERFORMANCE, JULY 23RD 2018
2018 2017 2016
Local Currency Terms
EUR Terms
Local Currency
Terms
EUR
terms
Local Currency
terms
EUR
terms
Level 1-week
% change
1-month
% change
YTD
% change
1-year
% change
Year-
Low
Year-
High
YTD
% change % change % change
Brazil (IBOV) 77,996 1.8 10.4 2.1 19.8 69,069 88,318 -8.7 26.9 9.5 38.9 76.2
Bulgaria (SOFIX) 633 1.5 0.4 -6.5 -11.1 621 721 -6.5 15.5 15.5 27.2 27.2
China (SHCOMP) 2,860 1.6 -1.0 -13.5 -12.0 2,691 3,587 -15.0 6.6 -0.3 -12.3 -15.3
Cyprus (CSE GI) 76 2.9 10.0 9.0 0.4 65 77 9.0 4.7 4.7 -2.0 -2.0
Egypt (HERMES) 1,490 -1.9 -6.0 3.7 19.9 1,429 1,741 4.3 32.0 18.7 72.7 -21.8
F.Y.R.O.M (MBI) 3,330 -0.4 -1.7 31.1 29.2 2,536 3,494 31.1 18.9 18.9 16.5 16.5
India (SENSEX) 36,719 1.1 2.9 7.8 13.9 31,082 36,750 2.6 27.9 19.3 1.9 2.6
Romania (BET-BK) 1,582 -0.4 -1.6 -4.2 -2.1 1,573 1,802 -3.5 22.8 19.1 0.2 0.0
Russia (RTS) 4,313 -3.9 -2.5 4.6 3.0 4,017 4,617 -1.8 -16.2 -21.9 24.2 54.3
Serbia (BELEX-15) 727 -0.8 -0.5 -4.4 1.2 725 785 -4.0 5.9 10.3 11.4 9.7
South Africa (FTSE/JSE) 56,557 2.0 -0.5 -5.0 4.0 53,027 61,777 -10.3 17.5 14.3 -0.1 16.1
Turkey (ISE 100) 95,305 6.2 -0.6 -17.4 -10.7 88,169 121,532 -32.2 47.6 20.5 8.9 -7.0
Ukraine (PFTS) 502 1.1 10.0 59.3 76.5 315 504 72.6 18.8 0.8 10.2 1.0
MSCI EMF 1,070 -0.1 -1.7 -7.7 0.5 1,039 1,279 -5.3 34.3 17.7 8.6 12.2
MSCI EAFE 1,981 0.4 0.0 -3.4 3.2 1,930 2,187 -0.9 21.8 6.7 -1.9 1.4
Greece (ASE-General) 752 -1.9 -2.6 -6.3 -11.5 736 896 -6.3 24.7 24.7 1.9 1.9
Germany (XETRA DAX) 12,549 -0.1 -0.2 -2.9 2.8 11,727 13,597 -2.9 12.5 12.5 11.6 11.6
UK (FTSE-100) 7,656 0.7 -0.3 -0.4 3.8 6,867 7,904 -0.9 7.6 3.2 14.4 -1.0
USA (DJ INDUSTRIALS) 25,044 -0.1 1.9 1.3 16.4 21,496 26,617 4.0 25.1 9.6 13.4 16.7
USA (S&P 500) 2,807 0.3 1.9 5.0 13.6 2,533 2,873 7.7 19.4 4.7 9.5 13.2
-20 -10 0 10 20 30 40 50 60
USA (S&P 500)
USA (DJ INDUSTRIALS)
UK (FTSE-100)
Germany (DAX)
Greece (ASE-General)
MSCI EAFE
MSCI EMF
Ukraine (PFTS)
Turkey (ISE-100)
South Africa (FTSE/JSE)
Serbia (BELEX 15)
Russia (MICEX10)
Romania (BET-BK)
India (SENSEX)
F.Y.R.O.M (MBI-10)
Egypt (HERMES)
Cyprus (CSE GI)
China (SHCOMP)
Bulgaria (SOFIX)
Brazil (IBOV)
Equity Indices (July 23rd 2018)
Loss Gain
1-week % change
1-month % change
YTD % change
Page 15
10 – 23 July 2018
NBG - Emerging Market Analysis – Bi-Weekly Report 14
DISCLOSURES: This report has been produced by the Economic Analysis Division of the National Bank of Greece, which is regulated by the Bank of Greece, and is provided solely for the information of professional investors who are expected to make their own investment decisions without undue reliance on its contents, i.e. only after effecting their own independent enquiry from sources of the investors’ sole choice. The information contained in this report does not constitute the provision of investment advice and under no circumstances is it to be used or considered as an offer or an invitation to buy or sell or a solicitation of an offer or invitation to buy or sell or enter into any agreement with respect to any financial asset, service or investment. Any data provided in this report has been obtained from sources believed to be reliable but have to be not been independently verified. Because of the possibility of error on the part of such sources, National Bank of Greece does not guarantee the accuracy, timeliness or usefulness of any information. The National Bank of Greece and its affiliate companies, its representatives, its managers and/or its personnel or other persons related to it, accept no liability for any direct or consequential loss arising from any use of this report. The final investment decision must be made by the investor and the responsibility for the investment must be taken by the investor. This report is not directed to, nor intended for distribution to use or used by, any person or entity that is a citizen or resident of or located in any locality, state, country or other jurisdiction where such a distribution, publication, availability or use would be contrary to any law, regulation or rule. The report is protected under intellectual property laws and may not be altered, reproduced or redistributed, to any other party, in whole or in part, without the prior written consent of National Bank of Greece.