1 EXPLORING THE SPATIAL AND TEMPORAL PATTERNS OF BUSINESS CONCENTRATION AND DISPERSION: A CASE-STUDY ANALYSIS FOR COUNTY OF SANTA BARBARA Srinath Ravulaparthy Graduate Student, Department of Geography and GeoTrans Lab University of California, Santa Barbara Santa Barbara, CA 93106 Phone: 805-893-3663 E-mail: [email protected]Konstadinos G. Goulias Professor, Department of Geography and GeoTrans Lab University of California, Santa Barbara Santa Barbara, CA 93106 Phone: 805-893-3663 E-mail: [email protected]Stuart Sweeney Associate Professor, Department of Geography University of California, Santa Barbara Santa Barbara, CA 93106 Phone: 805-618-8317 E-mail: [email protected]Phaedon C. Kyriakidis Professor, Department of Geography University of California, Santa Barbara Santa Barbara, CA 93106 Phone: 805-893-3663 E-mail: [email protected]Manuscript Prepared on October 15, 2012 To be submitted to 52 nd Annual Meeting of Western Regional Science Association Santa Barbara, California, February 24 – 27, 2013
Transcript
! 1!
EXPLORING THE SPATIAL AND TEMPORAL PATTERNS OF BUSINESS CONCENTRATION AND DISPERSION: A CASE-STUDY ANALYSIS FOR COUNTY
OF SANTA BARBARA Srinath Ravulaparthy Graduate Student, Department of Geography and GeoTrans Lab University of California, Santa Barbara Santa Barbara, CA 93106 Phone: 805-893-3663 E-mail: [email protected] Konstadinos G. Goulias Professor, Department of Geography and GeoTrans Lab University of California, Santa Barbara Santa Barbara, CA 93106 Phone: 805-893-3663 E-mail: [email protected] Stuart Sweeney Associate Professor, Department of Geography University of California, Santa Barbara Santa Barbara, CA 93106 Phone: 805-618-8317 E-mail: [email protected] Phaedon C. Kyriakidis Professor, Department of Geography University of California, Santa Barbara Santa Barbara, CA 93106 Phone: 805-893-3663 E-mail: [email protected]
Manuscript Prepared on October 15, 2012
To be submitted to 52nd Annual Meeting of Western Regional Science Association
Santa Barbara, California, February 24 – 27, 2013
! 2!
ABSTRACT To build large scale microsimulation model systems for policy analysis we exploit findings based on economic activity, location and spatial concentration in fields of spatial economics and new economic geography. Various methods have been proposed and implemented by both geographers and economists to measure agglomeration economies in a region. Building on recent work by Arbia et al. (2010), our focus is on the dynamic nature of localization of businesses in space and time in a region. In this paper, we attempt to explore and identify the spatial and temporal patterns that exist when businesses co-locate, thereby creating a dynamic system of agglomeration of economies. It is crucial to explicitly recognize these trends as they are critical in behavioral-based modeling of business location choices and their decision making processes. The research here is based on the data from 2011 National Establishment Time Series (NETS) database that specifically tracks individual business establishments from years 1990 to 2010.
Spatial analytical methods are used to compute a set of regional and neighborhood indicators to explore the space-time evolution of concentration and dispersion of retail trade and healthcare services in County of Santa Barbara. The results clearly indicate a significant variation in spatial and temporal distribution of concentration and dispersion of economic activities in the region. There is also a strong presence and temporal stability of spatial clustering in retail trade businesses in the region. Localization economies are dominant at the neighborhood level when compared with regional scale across both healthcare services and retail trade with very little variation in spatial and temporal patterns. Furthermore, the results also strongly suggest that it is more suitable to analyze the distribution of economic activities in a network space than in Cartesian space. Keywords: point-pattern analysis, agglomeration economies, spatial and temporal patterns, network space and business location and co-location !
!
!
!
! 3!
INTRODUCTION Throughout the United States and particularly among Metropolitan Planning Organizations (MPOs) there has been a revival of interest in large scale integrated land-use transportation microsimulation models that are applied to environmental policy assessment. For example, in California we have legislation that explicitly dictates MPOs and the California Department of Transportation to develop land use change strategies to meet Greenhouse Gas emission targets. This requires behavioral understanding of business and residents location and relocation patterns and the development of behavioral models that can be used in microsimulation frameworks and associated software. As we build these scenario planning models we also discover gaps in empirically testable models of location and relocation. In this paper we focus on business establishment location and its evolution over time in the form of an exploratory analysis. Building on the work from Arbia et al. (2010) who emphasize the dynamic nature of agglomeration economies, we first attempt to understand the types of changes we observe in the number of business establishments in a specific geographic region or city, differences between cities, differences among industries, and possible explanations of these changes. From a transportation viewpoint and GHG emissions the relative physical location and colocation of business establishments may inhibit or amplify the need to travel and therefore impact emissions in desirable and undesirable ways respectively. Moreover, if clustering of business establishments is already reaching "saturation" any new land use policies will not have the desirable impacts. Spatial structure becomes of critical importance to assess exactly this. Over the past decades, a significant portion of geographic literature has focused on urban places as service centers surrounded by population settlements, that are generally oriented towards service related activities and does not include manufacturing (Christaller 1933; Losch 1944; Berry et al. 1988; King 1985; Ghosh and McLafferty 1987). This structure can be classified in two different ways as described by Anas et al. (1998). The first operates at the citywide level and is concerned with the overall decentralization trends in mono-centric cities. The second approach focuses on the local variability of activities that lead to the formation of a polycentric or dispersed pattern in a city. Broadly, this concentration of economic activities and population in a region is referred to as agglomeration.
In an economic context, agglomeration refers to clustering of businesses at a particular location in an urban space. In this context, the literature on agglomeration economies is classified into three categories (Marshall 1920; Ohlin 1935; and Jacobs 1969), economies of scale is one in which an industry or an establishment seeks profits or increasing returns to scale by concentrating production or services in one location, localization economies is defined as clustering or concentration of businesses (or firms) within the same industry type at a location and urbanization economies refer to concentration or clustering of businesses (or firms) from different industry types. Economies of scale are internal to the firm (or establishment) and involve decisions about large scale production or services being offered to lower cost and concentrate production or services in one location. This incurs with trade-off between location and distance (or transportation costs). Localization economies are external to the firm but
! 4!
internal to the specific industry type involving decisions like locating near firms of same business type in taking advantage of new ideas, procedures and local communication. For example, Silicon Valley in San Jose, CA, is specialized in technology sectors with presence of major players like Google Inc., and Apple Inc. Access to specialized pool of labor pool and technical expertise is also part of localization economies. Urbanization economies are more general and are external to both the firm and the industry type. Such economies arise across different industries, where businesses col-locate in large urban area to benefit from cross fertilization by diverse factors such as access to multi-functional labor pool and presence of good infrastructure. Furthermore, as stated by Fujita and Thisse (2002), the spatial configuration of an urban area is an outcome of processes involving two types of forces: agglomeration (or centripetal) force and dispersion (or centrifugal force). Traditionally spatial distributions of economic activities in a given region have used concentration measures at a single geographic level. Some of these measures are Herfindahl index as applied by Henderson (1997), Gini coefficient (Gini 1936) or the concentration index of Ellison and Glaeser (Ellison and Glaeser 1997). These concentration measures are at single geographic level leading to inferential issues due to the modifiable area unit problem. However, with the availability of micro-data at the establishment level (or point level) Euclidean distance-based methods in spatial point pattern analysis have dominated measures to characterize concentration and dispersion of economic activities as applicable to agglomeration economies (Arbia 1989; Sweeney and Feser 1998; Duranton and Overman 2005 and Macron and Puech 2003). Several studies have indicated the positive and negative effects of agglomeration economies on a firm’s values in its locational decisions. These studies have also contended that agglomeration economies are at the heart of urban processes and their use in explaining co-location of businesses is fundamental (Shukla and Waddell 1991; Waddell and Shukla 1993; Frenkel 2001, Wu 1999, Maoh and Kanarouglou 2007 and Bodenmann 2011). It is widely accepted that localization of firms in space is essentially a dynamic phenomenon, where spatial and temporal dependencies exist when businesses co-locate. The spatial and temporal dependencies on measures of agglomeration can be due to several factors such as nature of the local institution and the regulatory environment; the character of industrial organization in a place; regional urban spatial structure and prevailing social and cultural norms. In this line, Henderson (1986) and Mori (1997) argue that the dynamics of agglomeration economies must be considered in business location models because in the early stages some firms may prefer locating in larger cities taking advantage of localization and urbanization economies. These firms when grown move to hinterland followed by movement of other firms thereby creating a small city. Eventually, the city may merge producing a ‘megalopolis’. Furthermore, Sweeney and Feser (2003) note that it is important to understand the historical evolution of the agglomeration of economies, which leave a footprint on the spatial structure of cities and regions.
Yet the literature and studies on measuring spatial clustering of firms do not account for the dynamics of agglomeration economies. As identified by Arbia et al. (2010) this literature has
! 5!
followed two separate paths – time series methods on analysis of business cycles and empirical spatial analysis of concentration of businesses. The analyses of clusters in space and time have followed these paths with no interactions between them. With the only exception, Arbia et al. (2010) partially fills this gap in literature by developing a space-time K-function for cluster detection of Information and Communication Technology (ICT) businesses in Rome, Italy.
It is therefore important to recognize both spatial and temporal dynamics as they play a crucial role in understanding the business location choices and their preferences leading to the observed spatial and temporal distribution of economic activities. This is especially important in the context of firm demography or economic demography processes that model firm birth, death, migration and location choices as well as expansion and contraction (Van Wissen 2000). When implemented in a microsimulation framework, the common objective of firm demography is also to model location choices of new firms and relocation decisions of existing firms.
Furthermore, Sweeney and Feser (2003) and Eberts and McMillen (1999) recognize that measuring the dynamics of spatial business externalities (or agglomeration economies) would be best represented with optimal data and measures that would emerge from longitudinal data that have recorded observed location decisions of businesses over several periods. Moreover, Eberts and McMillen (1999) also acknowledge that no one has used longitudinal data to estimate agglomeration of economies in the U.S..
To partially fill this gap in literature, in this research study we attempt to explore the space-time patterns of spatial concentration and dispersion of business establishments. In this study, we also make a case to reconsider the use of earlier Euclidean distance-based measures used in studying spatial concentration of economic activities. This research study makes use of the National Establishment Time Series (NETS) database, which is a longitudinal database that tracks an individual business establishment from years 1990 to 2010. To make the analysis tractable we use data from Santa Barbara County on retail trade and healthcare services as defined by the two-digit SIC code. We extract from the county two smaller areas that are the South Coast region, which includes the cities of Santa Barbara and Goleta and a second area, which is the City of Santa Maria. We select these two regions as they are significantly different in their urban form and structure and explore the commonalities and differences in space-time patterns of evolution of concentration and dispersion in economic activities. We introduce two forms of analysis – (a) space-time patterns for all business establishments and (b) business anchor points which explore the space-time patterns of new business establishments relative to existing businesses. We use the 2003 urban roadway network to compute network distance-based measures at both regional and neighborhood level of analysis. Based on the results we compare and contrast the evolution of a variety of indicators to explore the space-time patterns of clusters and dispersion in retail trade and healthcare services for the two study areas.
The remainder of the paper is organized as follows. The next section describes the data that were used for this study. The following section describes in detail the framework and methodology adopted for this research along with results and discussion. The final section of this paper concludes with the summary of findings and next steps.
! 6!
DATA AND STUDY AREA The data for this research is based on the 2011 National Establishment Time-Series (NETS) Database that includes more than 44.5 million business establishments nationwide with longitudinal information about their industries, location, headquarters and performance (revenues) over the period 1990 – 2010. The NETS database is constructed by taking a series of “snapshots” based on the Dun and Bradstreet (D&B) archival national establishment data that has been thoroughly quality controlled and updated (Walls, 2007). The unit of observation in the NETS database is a business establishment that produces goods or services at a single physical location – for example, a single store or an establishment. This database tracks every establishment from its birth, through any physical moves it makes, capturing any changes of ownership and recording the establishment’s death if it occurs. In the process the database also records information on location of the business establishment, employment, sales and industry type for each year. One of the highly desirable features of the NETS database is that it covers all the establishments in the study area, which reflects the fact that NETS is designed to capture the universe rather than a sample of establishments. Moreover, the NETS data also capture the business relocation that is in contrast to other data sources that researchers have used to study business establishment and employment dynamics (Neumark et al. 2005). Although, the NETS data offers many advantages over traditional sources like ES-202 data it also has its limitations that should be kept in mind as we explore the data. For example, as noted by Kunkle (2011) NETS reports higher total employment at the national and regional levels primarily because it covers more businesses than ES-202 based data. This is especially true for small businesses. Overall, the NETS database offers an exceptionally deep view of employment dynamics in the economy (Kolko and Neumark 2007, Acs et al. 2008 and Neumark et al. 2005). In order to truly understand the changes in economic activity in a region, we would prefer to capture these changes at the establishment level. Furthermore, to summarize these changes location is an important determinant in economic development as some regions have different values attached to it in-terms of geography, socio-economic and demographic characteristics. Thus, to overcome this issue, we isolate the second-order characteristics of the location process from the first-order as suggested by Sweeney and Feser (2003). In a spatial setting or spatial processes first-order effects are defined as the mean number of events per unit area and second-order is the dependence that exists between events in different areas. Therefore, this research study compares and contrasts the dynamics of economic activity at the establishment level in South Coast of Santa Barbara and City of Santa Maria which are located in the County of Santa Barbara. The South Coast of Santa Barbara consists of City of Santa Barbara and City of Goleta. This study specifically focuses on the spatial and temporal patterns in retail trade and healthcare services for the two regions as defined by the two-digit Standard Industry Classification (SIC) codes. The resulting data extracted from the NETS database includes geo-referenced retail trade and healthcare business establishments from years 1990 to 2010 for the two regions of South
! 7!
Coast of Santa Barbara (referred to as South Coast hereafter) and City of Santa Maria. The study area as in red boundary is illustrated in Figure 1. The total resident population of South Coast is 118,298 as reported by 2010 U.S. Census Bureau and contains the UCSB campus and the Santa Barbara Community College campus. The total resident population of Santa Maria is 99,553 as reported by the 2010 U.S. Census and contains the Hancock community college and is adjacent to the Vandenberg Air Force Base. The main regional airport of Santa Barbara is in South Coast and Santa Maria has a smaller airport with regional flights to LAX.
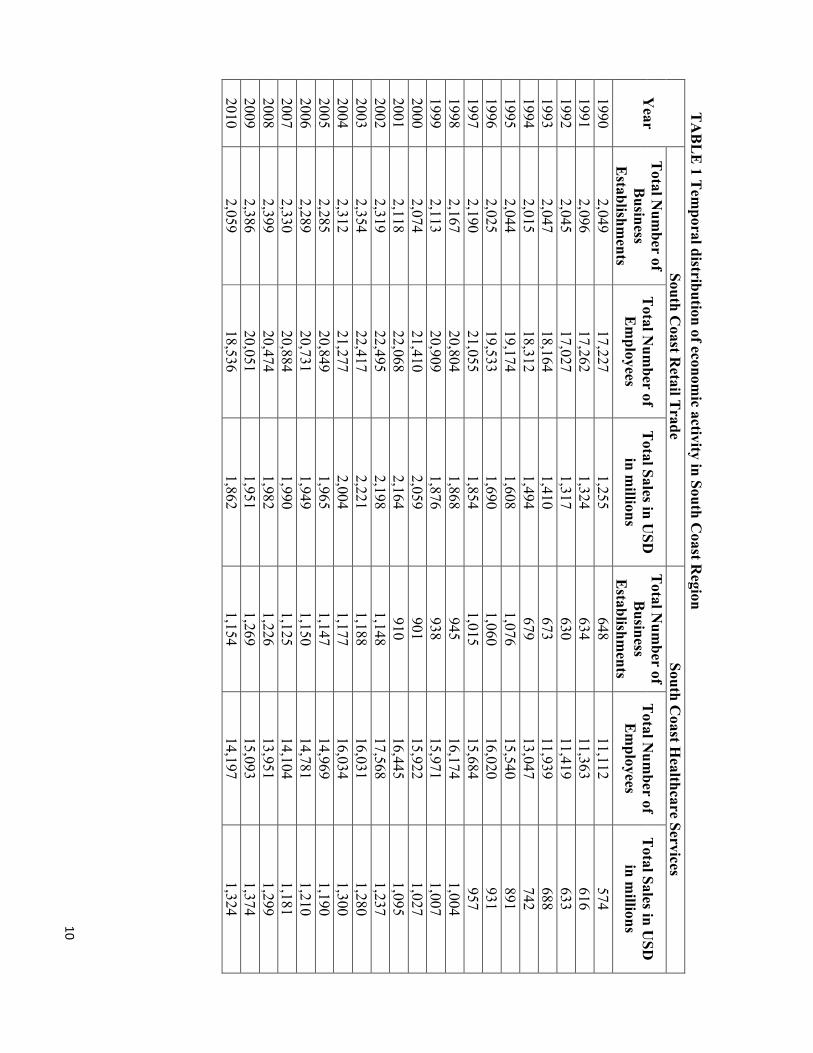
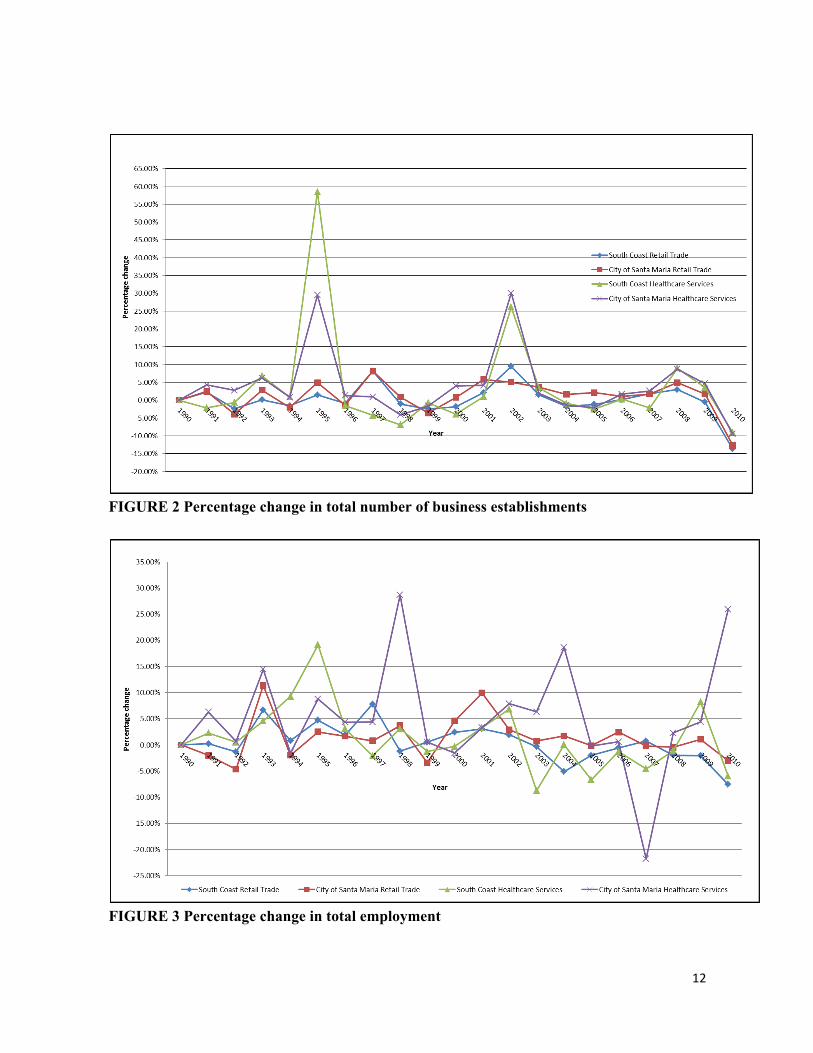
FIGURE 1 Map representing the study area In this research we are interested in unraveling the spatial and temporal patterns of economic activity in a region that is constrained by network-led spatial configurations such as road transport network in an urban area. Therefore, for this analysis we use the 2003 Santa Barbara County Association of Governments (SBCAG) roadway network that is part of the regional travel demand model. The roadway network is detailed as it contains major roadways like freeways, highways, arterial and local roads to capture the variation on roadway infrastructure. As extracted from the NETS database Table 1 and Table 2 illustrate the temporal distribution of total number of business establishments in retail trade and healthcare services from 1990 to 2010 for the study regions. We also report the total number of employees and sales in USD for these years as recorded at the establishment level. We further report the percentage
! 8!
change in total number of business establishments, employees and sales as shown in Figure 2 through Figure 4 respectively. As it can be seen from Figure 2 the percentage changes in total number of businesses for retail trade in South Coast and City of Santa Maria are almost the same. Moreover, there is a significant change in business establishments related to healthcare services for both the regions. However, the percentage change in healthcare services is significantly higher (58%) in South Coast region for the year 1995. Furthermore, the data also reveal the impact of the “recession” with significant reduction in total businesses, employment and sales as seen for years 2008 through 2010. CARTESIAN SPACE OR NETWORK SPACE In recent years, the role of economic activity, location and spatial concentration have played a more prominent role in economics with renewed interest in spatial economics owing to recent works and models in the new economic geography (Krugman, 1991 and 2011, Duranton 1997, Ottaviano and Puga 1998 Fujita and Thisse 2002). To assess the geographic distribution of activity in a given region, economists have traditionally relied on concentration indices such as Gini (Gini 1936) and Ellison and Glaeser (1997). However, these measures evaluate the heterogeneity of spatial structure at a single geographic scale (typically at administrative boundaries) leading to the scale issue of the modifiable areal unit problem (MAUP). That is inferences from the evaluation of these concentration measures of a zoning area may depend on the scale chosen. Therefore, to overcome this issue Arbia (1989) proposed the use of distance-based methods that are continuous functions of space and provide information about economic concentration at all scales simultaneously. Also as noted by Eberts and McMillen (1999) one would ideally capture the concepts of agglomeration economies at the business establishment level that are “points in space” which precisely describe spatial distribution of economic activities. With very detailed data becoming available at the establishment-level spatial point-pattern analysis is becoming quite dominant in characterizing first-order (mean number of events per unit area) and second-order properties (spatial dependence between events in an area) of spatial concentration of economic activities. Of these the use of Ripley’s K-function and alternative transformations of this function like D-function and L-function are used increasingly for analyzing business location and co-location patterns in continuous space (Barff 1987; Arbia 1989; Sweeney and Feser 1998; Feser and Sweeney 2000; Marcon and Puech 2003 and 2010 ;Duranton and Overman 2005). For a complete review of distance-based measures of concentration refer to Marcon and Puech (2012). Generally, many phenomena can be considered as point processes and therefore can be studied by spatial point pattern analysis. This also applies to economic-events that are geo-referenced as point events in space and time at different levels of precision. Analyses of these point distributions generally use spatial methods and procedures that assume space as continuous, homogenous and isotropic with computation of Euclidean distances in Cartesian space (Bailey and Gatrell 1995). However, this is a strong limitation in the context of business
! 9!
establishments and economic activity as most of the events related to economic phenomena are distributed over non-homogenous spaces such as network-constrained structures. For example, the distribution of shopping malls, hospitals and retail stores are alongside a roadway network. In this context, many researchers have noted the major issues in analyzing spatial phenomena with the assumption of a Cartesian (or continuous or planar) space and representation in a GIS environment (Batty 2005; Miller 1999; Okabe and Kitamura 1996; Borruso 2008). Moreover, some authors have also proposed methods for analyzing point patterns over network structures like nearest neighbor distances on networks, network K-function and network kernel density estimation (Okabe et al. 1995; Okabe and Yamada 2001; Borruso 2008). These methods are based on the greater efficiency of shortest-path versus Euclidean distance measures as noted by Yamada and Thill (2004). The methodology described in the next section is adopted in this study to explore the differences that exist between network and Euclidean distances. This methodology also illustrates the exploratory analysis to be conducted for spatial and temporal patterns of retail trade and healthcare service business establishments.
!10!
TA
BL
E 1 T
emporal distribution of econom
ic activity in South Coast R
egion
Year
South Coast R
etail Trade
South Coast H
ealthcare Services T
otal Num
ber of B
usiness E
stablishments
Total N
umber of
Em
ployees T
otal Sales in USD
in m
illions
Total N
umber of
Business
Establishm
ents
Total N
umber of
Em
ployees T
otal Sales in USD
in m
illions
1990 2,049
17,227 1,255
648 11,112
574 1991
2,096 17,262
1,324 634
11,363 616
1992 2,045
17,027 1,317
630 11,419
633 1993
2,047 18,164
1,410 673
11,939 688
1994 2,015
18,312 1,494
679 13,047
742 1995
2,044 19,174
1,608 1,076
15,540 891
1996 2,025
19,533 1,690
1,060 16,020
931 1997
2,190 21,055
1,854 1,015
15,684 957
1998 2,167
20,804 1,868
945 16,174
1,004 1999
2,113 20,909
1,876 938
15,971 1,007
2000 2,074
21,410 2,059
901 15,922
1,027 2001
2,118 22,068
2,164 910
16,445 1,095
2002 2,319
22,495 2,198
1,148 17,568
1,237 2003
2,354 22,417
2,221 1,188
16,031 1,280
2004 2,312
21,277 2,004
1,177 16,034
1,300 2005
2,285 20,849
1,965 1,147
14,969 1,190
2006 2,289
20,731 1,949
1,150 14,781
1,210 2007
2,330 20,884
1,990 1,125
14,104 1,181
2008 2,399
20,474 1,982
1,226 13,951
1,299 2009
2,386 20,051
1,951 1,269
15,093 1,374
2010 2,059
18,536 1,862
1,154 14,197
1,324
!11!
TA
BL
E 2 T
emporal distribution of econom
ic activity in City of Santa M
aria
City of Santa M
aria Retail T
rade C
ity of Santa Maria H
ealthcare Services
Year
Total N
umber of
Business
Establishm
ents
Total N
umber of
Em
ployees T
otal Sales in USD
in m
illions
Total N
umber of
Business
Establishm
ents
Total N
umber
of Em
ployees
Total Sales in
USD
in m
illions 1990
823 7,462
640 210
2,328 113
1991 843
7,311 660
219 2,474
130 1992
810 6,971
628 225
2,490 132
1993 833
7,764 740
239 2,850
152 1994
816 7,610
776 241
2,806 153
1995 856
7,798 832
312 3,052
175 1996
844 7,928
888 316
3,184 189
1997 913
7,990 934
319 3,323
202 1998
921 8,284
991 306
4,274 266
1999 888
8,001 1,024
301 4,297
273 2000
895 8,367
1,086 313
4,229 278
2001 947
9,196 1,278
326 4,368
292 2002
995 9,463
1,358 424
4,712 330
2003 1,031
9,534 1,379
432 5,009
361 2004
1,048 9,697
1,414 426
5,941 434
2005 1,070
9,681 1,464
417 5,930
419 2006
1,081 9,917
1,489 424
5,964 437
2007 1,100
9,899 1,476
435 4,665
336 2008
1,154 9,854
1,505 473
4,772 348
2009 1,174
9,961 1,509
495 4,982
368 2010
1,025 9,659
1,474 448
6,272 361
! 12!
FIGURE 2 Percentage change in total number of business establishments
FIGURE 3 Percentage change in total employment
! 13!
FIGURE 4 Percentage change in total sales in USD METHODOLOGY Figure 5 illustrates the methodology adopted in this study to explore the spatial and temporal patterns of retail trade and healthcare services in South Coast and City of Santa Maria study areas for the years 1990 to 2010. As seen from Figure 5, we approach this analysis in two ways. In the first case, for each year we consider all the business establishments in the two areas separately and develop the Euclidean and network-based distance measures for quantifying spatial structure in retail trade and healthcare services respectively. In the second case, for each year we consider only the new business establishments with reference to the business establishments that were observed (or existed) throughout the study period from 1990 to 2010 in the two study regions. We refer to these "stayer" businesses as anchor points in the region. We then develop only the network-based distance measures for retail trade and healthcare services respectively. The aim of the first case is to explore and understand the large-scale space-time evolution patterns of clustering (where firms tend to attract each other) or spreading (where firms tend to repulse each other). This can be achieved by considering the population of all businesses observed for each time period from 1990 to 2010 by including all the birth, death and relocation of business establishments. Similarly, the aim of the second case is to explicitly explore the evolution of space-time patterns of clusters of new business establishments relative to the existing businesses in the region. This method is similar to case-control studies in environmental epidemiology that study presence of a source pollution on the health risks of the population in proximity (Calculli et al. 2011). This sheds light on the factors like centralization and
! 14!
decentralization in a region which is a critical component in location choice preferences for businesses (Dorantes et al. 2011). As part of the first case for all the business establishments, we compute Euclidean distance measures and network-based distance measures of spatial structure. The Euclidean distance is the pairwise distance between two points in a Cartesian space. The network-based distance is the shortest-path distance on an undirected network between any two points computed using Dijkstra’s algorithm (Dijkstra 1959). The network-based distance was computed by using the shortest-path tool in Network Analyst tool in ArcGIS. For the Euclidean measures we compute the pairwise distance and Ripley K-function. Similarly, we also compute the network pairwise distance and network K-function as proposed by Okabe and Yamada (2001) for studying the spatial clustering or dispersion in the study regions. In Cartesian space, Ripley’s K-function counts each firm’s number of neighbors (or other firms) within a given distance. We then calculate the average number of neighbors of every firm at each defined distance. Similarly, for the network K-function the firms are located alongside a roadway network and one counts the firm’s number of neighbors (or other firms) within a given distance. Ripley’s K-function uses Euclidean straight-line distance, whereas network K-function uses the shortest-path distance on a network. Both measures are used for comparison against their counterparts stemming from a completely random point process (Complete Spatial Randomness or CSR) in which firms are located randomly and independently of each other.
We compute these measures for both retail trade and healthcare services for each year separately from 1990 to 2010. In the next section we compare and contrast these measures. For both the cases, we further compute two different measures of spatial concentration based on the distribution of network pairwise distances for each year – (a) regional measures, which are useful in understanding the large-scale space-time patterns of concentration or dispersion of businesses and (b) neighborhood measures, which are useful in analyzing neighborhood space-time patterns of concentration or dispersion of businesses. We define regional measures for any business establishment that is within a distance of 6000 meters, which is the median network pairwise distance. Neighborhood measures are developed for any business establishment that is within a distance of 2500 meters, which is the 25th percentile of network pairwise distance. For both regional and neighborhood measures we compute two descriptors Mh
and Sh as shown in Equations (1) and (2) below. Mh is the median distance to a business establishment and Sh ,a cumulative measure, is the total number of business establishments within a distance h. !ℎ = !"#$%&(! < ℎ) (1) !ℎ = !(! < ℎ)!!
!!! (2) Where, d is the network distance from a business establishment to all other business establishments; Ii is an indicator function for each business establishment i=1, 2, …n that takes a
! 15!
value of 1 if d < h and h is the cutoff distance that takes values of 6000 meters and 2500 meters for regional and neighborhood measures respectively.
It should be noted that both regional and neighborhood measures are computed using network-based distance only. Furthermore, these measures are computed for both retail trade and healthcare services from 1990 to 2010 for South Coast and City of Santa Maria regions. The next section compares and contrasts these results in detail for both the regions in space and over time.
FIGURE 5 Flowchart of the adopted methodology RESULTS AND DISCUSSION In the following subsections, we provide the results and discussion based on the described methodology to explore spatial and temporal patterns of concentration of retail trade and healthcare services in South Coast and City of Santa Maria regions. Exploring Differences in Cartesian and Network Spatial Analysis The starting point of our analysis is to examine the spatial and temporal patterns of economic concentration (or business concentration) or dispersion from the available NETS data. The unit
! 16!
of analysis is an individual establishment location or a point, and such points can be either assumed to be located in a Cartesian space or alongside an urban roadway network.
Point pattern analysis (be it in Cartesian or network space) provides methods to examine if the distribution of events over an urban area is clustered, dispersed or random. These events in our case are business establishments provided by their location coordinates in space and over time from 1990 to 2010. As noted earlier, very few studies have applied point pattern approaches to study the change in structure of urban form or the clustering of economic activities (Maoh and Kanaroglou 2007). Various statistical tests are applied to explore spatial concentration or dispersion of businesses over space. A typical approach to conduct point pattern analysis is via kernel density estimation and univariate K-function analysis. However, in this study for Cartesian space we conduct point pattern analysis using (a) pairwise distance and (b) univariate K-function. These two measures are estimated for both retail trade and healthcare services for years 1990 to 2010. In Cartesian space, pairwise distance is the Euclidean distance between any two points (or business establishments in this case). Univariate K-function estimation is conducted on the population of business establishments for both retail trade and healthcare services to test for spatial clustering or dispersion, considering complete spatial randomness (CSR) as the alternative hypothesis. The estimated K-function provides the expected number of businesses within a given distance and is then compared to a set of simulated K-functions for the same number of businesses that are constructed based on the CSR assumption. Marcon and Puech (2003) provide detailed implementation and formulation of univariate K-function as applicable to spatial clustering of businesses.
In point pattern analysis in network space, however, points or events of interest are strongly constrained by networks. These points or events are called network constrained events (Yamada and Thill 2007) or network events. Okabe and Sugihara (2012) classify network events into two classes – on-network events that occur directly on a network (e.g. traffic accidents on a road) and alongside-network events that occur alongside a street network (e.g. restaurants and shops located alongside a street). Therefore, to explore the spatial concentration or dispersion of economic activities (or businesses) over a network space we conduct point pattern analysis using (a) pairwise shortest-path (network) distance between any two network events (in this case business establishment) and (b) univariate network K-function. These two measures are estimated for both retail trade and healthcare services for years 1990 to 2010 using the 2003 Santa Barbara County Association of Governments roadway network. The network K-function method as proposed by Okabe and Yamada (2001) extends the K-function method in a Cartesian space to a network space. This method accounts for two properties of the network-based point pattern, namely locations of businesses are restricted to a network and that distances are measured as network shortest-path distance.
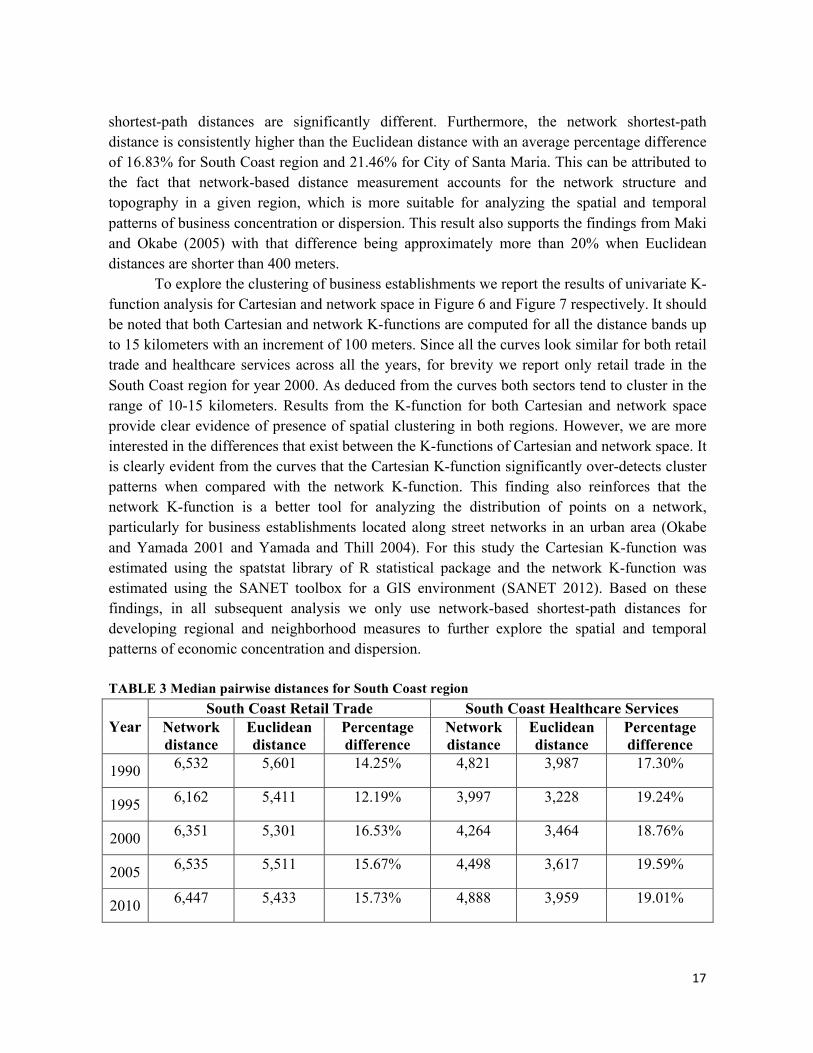
Table 3 and Table 4 report the median pairwise distance of retail trade and healthcare services using both Euclidian and network-based distance measurements for South Coast and City of Santa Maria respectively. For comparison we only report the values from 1990 to 2010 with five year increments. As seen from the table, Euclidean distances and their corresponding
! 17!
shortest-path distances are significantly different. Furthermore, the network shortest-path distance is consistently higher than the Euclidean distance with an average percentage difference of 16.83% for South Coast region and 21.46% for City of Santa Maria. This can be attributed to the fact that network-based distance measurement accounts for the network structure and topography in a given region, which is more suitable for analyzing the spatial and temporal patterns of business concentration or dispersion. This result also supports the findings from Maki and Okabe (2005) with that difference being approximately more than 20% when Euclidean distances are shorter than 400 meters.
To explore the clustering of business establishments we report the results of univariate K-function analysis for Cartesian and network space in Figure 6 and Figure 7 respectively. It should be noted that both Cartesian and network K-functions are computed for all the distance bands up to 15 kilometers with an increment of 100 meters. Since all the curves look similar for both retail trade and healthcare services across all the years, for brevity we report only retail trade in the South Coast region for year 2000. As deduced from the curves both sectors tend to cluster in the range of 10-15 kilometers. Results from the K-function for both Cartesian and network space provide clear evidence of presence of spatial clustering in both regions. However, we are more interested in the differences that exist between the K-functions of Cartesian and network space. It is clearly evident from the curves that the Cartesian K-function significantly over-detects cluster patterns when compared with the network K-function. This finding also reinforces that the network K-function is a better tool for analyzing the distribution of points on a network, particularly for business establishments located along street networks in an urban area (Okabe and Yamada 2001 and Yamada and Thill 2004). For this study the Cartesian K-function was estimated using the spatstat library of R statistical package and the network K-function was estimated using the SANET toolbox for a GIS environment (SANET 2012). Based on these findings, in all subsequent analysis we only use network-based shortest-path distances for developing regional and neighborhood measures to further explore the spatial and temporal patterns of economic concentration and dispersion. TABLE 3 Median pairwise distances for South Coast region
Year South Coast Retail Trade South Coast Healthcare Services
Network distance
Euclidean distance
Percentage difference
Network distance
Euclidean distance
Percentage difference
1990 6,532 5,601 14.25% 4,821 3,987 17.30%
1995 6,162 5,411 12.19% 3,997 3,228 19.24%
2000 6,351 5,301 16.53% 4,264 3,464 18.76%
2005 6,535 5,511 15.67% 4,498 3,617 19.59%
2010 6,447 5,433 15.73% 4,888 3,959 19.01%
! 18!
TABLE 4 Median pairwise distances for City of Santa Maria region
Year City of Santa Maria Retail Trade City of Santa Maria Healthcare Services
Network distance
Euclidean distance
Percentage difference
Network distance
Euclidean distance
Percentage difference
1990 4,529 3,684 18.66% 3,163 2,339 26.05%
1995 4,166 3,423 17.83% 3,149 2,339 25.72%
2000 4,221 3,511 16.82% 3,043 2,290 24.75%
2005 4,167 3,447 17.28% 3,217 2,409 25.12%
2010 4,201 3,466 17.50% 3,223 2,421 24.88%
FIGURE 6 Cartesian K-function of retail trade for year 2000 in South Coast region
! 19!
FIGURE 7 Network K-function of retail trade for year 2000 in South Coast region Regional Space-Time Patterns of Business Concentration and Dispersion The dominating feature of economic activities in a region is the concentration and dispersion of businesses in space and time. The observed business concentrations are both time and place dependent. Relative location is an important determinant of development in an urban area as historical processes leave a footprint on the spatial structure of cities and regions (Sweeney and Feser, 2003). In this section we attempt to understand the evolution of spatial structure of South Coast and City of Santa Maria regions. This analysis is undertaken for both retail trade and healthcare service business establishments in the region. To explore the large-scale spatial and temporal variations of observed economic distribution Figures 8, 9, and 10 illustrate the evolution of percentage change in median pairwise distance (network distance) from 1990 to 2010. It should be noted that if the percentage change in median pairwise distance decreases, then this is attributed to the effect of centralization (or concentration and clustering) in economic activities. Conversely, if the percentage changes in median pairwise distance increases, then this is taken as an effect of decentralization (or dispersion or spreading) of economic activities. In all the figures retail trade in South Coast is represented in blue, retail trade in City of Santa Maria represented in red, followed by healthcare services represented in green in South Coast and healthcare services in City of Santa Maria illustrated in purple.
! 20!
Figure 8 specifically describes evolution of percentage change in median pairwise distance for all the observed business establishments in each year by sector type. Overall, the plot clearly reveals the centralization and decentralization trends over time for both retail trade and healthcare services in both the regions. As observed, in the year 1995 there is a centralization (or spatial clustering) effect of both retail trade and healthcare services in both regions. The centralization effect is dominant in healthcare services in South Coast region with a change in percentage of -15.12% from year 1994 to 1995. Furthermore, decentralization trends are observed from year 2003 to 2004 and from year 2008 to 2009 with change in percentages of 4% and 4.75% respectively. However, as reported from Figure 8, the large-scale spatial structure of retail trade for both the regions is fairly stable over time as this can be attributed to various causes such as Hotelling’s principle of pure competition (Hotelling, 1929), economies of scale, market-size effect and or new forms of large-scale retailing (Borchert, 1998). Furthermore, the large-scale spatial structure of healthcare services in City of Santa Maria is very stable with a maximum change in percentage of 2.2% as recorded from year 2004 to 2005.
To further explore the large-scale variations in business concentration or dispersion Figure 9 describes the evolution of percentage change in Mh -median distance from a business establishment to all other business establishments within h = 6000 meters. The plot from Figure 9 shows the evidence of spatial and temporal stability of concentration of businesses within 6000 meters for both retail trade and healthcare services. This plot also characterizes the extent of spatial clusters and their formation and evolution in the study regions. For example, healthcare services in South Coast region shows a trend of decentralization from years 1991 to 1993 with an increase in change in percentage of 4.5%; in contrast to a centralization trend from years 2009 to 2010 with a decrease in change in percentage of -9.5%. Furthermore, the evolution of Mh as a regional measure also characterizes the dominant presence of agglomeration of economies in both retail trade and healthcare services within a spatial extent of 6000 meters. The spatial distribution of economic activities influences profoundly urban organization and development. Within this context, it is worthwhile exploring the spatial and temporal patterns of new business establishments relative to existing business establishments (referred to as anchor points) that were observed for the time period from 1990 to 2010. Figure 10 illustrates the evolution of percentage change in median pairwise distance of all new business establishments relative to the anchor points (or existing business establishments) for both retail trade and healthcare services. It should be noted from the figure that any significant increase in percentage change in median pairwise distance is an indication of decentralization or a movement away from the anchor points.
As seen from Figure 10, the percentage difference in median pairwise distance is relatively very small for retail trade in both study regions indicating, that new retail business establishments might be locating closer to anchor points. This preference might be due to the dominant force of agglomeration of economies and more specifically localization economies – that is defined as co-location of businesses within the same industry type (Marshall 1920 and Eberts and McMillen 1999). This pattern further reinforces that the large-scale space-time
! 21!
structure of retail trade in both South Coast and City of Santa Maria regions is fairly stable. However, there are significant percentage differences of median pairwise distance of healthcare services in both study regions. For example, healthcare services in South Coast region have a difference of 28.9% from year 1992 to 1993 and 27.6% from year 2002 to 2003 point to a clear trend of dispersion of new healthcare services relative to anchor points. Interestingly, concentration (or centralization) of healthcare services are observed right next to the dispersion trends (in temporal scale) with decrease in percentage difference of -20.26% from year 1991 to 1992 and -22.94% from year 2001 to 2002. Furthermore, there are also clear concentration and dispersion trends observed in healthcare services in City of Santa Maria especially for the years 2004 to 2006. The anchor point analysis also sheds further light into the location choice preferences of new business establishments relative to existing businesses as new firms appear to be both attracted to locations with large concentrations of firms in their industry and more productive in these locations (Hanson 2001).
FIGURE 8 Evolution of percentage change in median pairwise distance for all business establishments
! 22!
FIGURE 9 Evolution of Mh – median distance from a business establishment to all other business establishments within a distance of 6000 meters
FIGURE 10 Evolution of percentage change in median pairwise distance for new business establishments relative to anchor points
! 23!
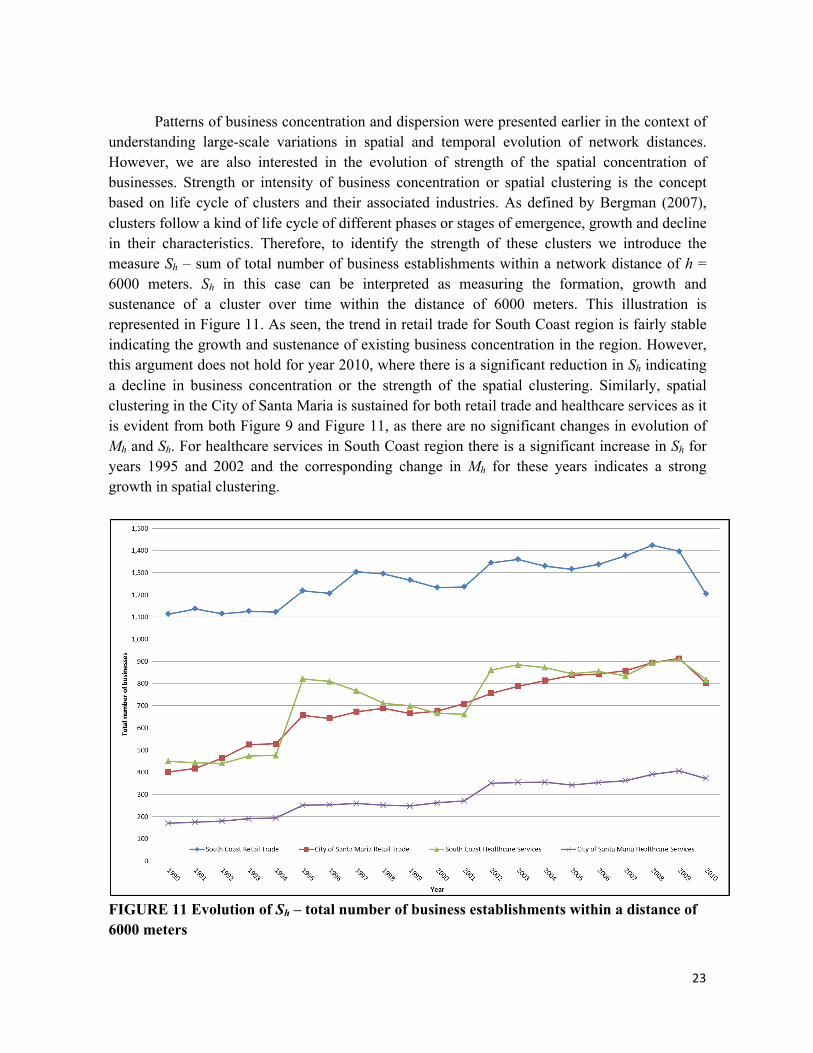
Patterns of business concentration and dispersion were presented earlier in the context of understanding large-scale variations in spatial and temporal evolution of network distances. However, we are also interested in the evolution of strength of the spatial concentration of businesses. Strength or intensity of business concentration or spatial clustering is the concept based on life cycle of clusters and their associated industries. As defined by Bergman (2007), clusters follow a kind of life cycle of different phases or stages of emergence, growth and decline in their characteristics. Therefore, to identify the strength of these clusters we introduce the measure Sh – sum of total number of business establishments within a network distance of h = 6000 meters. Sh in this case can be interpreted as measuring the formation, growth and sustenance of a cluster over time within the distance of 6000 meters. This illustration is represented in Figure 11. As seen, the trend in retail trade for South Coast region is fairly stable indicating the growth and sustenance of existing business concentration in the region. However, this argument does not hold for year 2010, where there is a significant reduction in Sh indicating a decline in business concentration or the strength of the spatial clustering. Similarly, spatial clustering in the City of Santa Maria is sustained for both retail trade and healthcare services as it is evident from both Figure 9 and Figure 11, as there are no significant changes in evolution of Mh and Sh. For healthcare services in South Coast region there is a significant increase in Sh for years 1995 and 2002 and the corresponding change in Mh for these years indicates a strong growth in spatial clustering.
FIGURE 11 Evolution of Sh – total number of business establishments within a distance of 6000 meters
! 24!
Neighborhood Space-Time Patterns of Business Concentration and Dispersion In this subsection we will discuss the space-time patterns of concentration and dispersion of economic activities at a neighborhood level. The identification of spatial clustering of businesses at neighborhood level is especially significant as agglomeration of economies operates at different spatial scales and it is important to take this into account for location choice preferences of business establishments. Businesses locate near each other to reduce cost and increase productivity, in retail trade car dealers or restaurants’ clustering together is an obvious example. For this purpose, we create a neighborhood measure as the number of business establishments that are within a distance of 2500 meters from another business establishment and the measures Mh and Sh are as plotted in Figure 12 to Figure 15. Figure 12 illustrates the evolution of percentage change in Mh – median distance from a business establishment to all other business establishments within a distance of h = 2500 meters. As seen, there is not a significant change in Mh for both South Coast and City of Santa Maria regions indicating a strong presence of localization economies at the neighborhood level. The smallest recorded change in Mh for South Coast region was -4.04% in healthcare services for years 1994 to 1995, which is an evidence of centralization (or clustering) of business activities. Similarly, healthcare services in City of Santa Maria recorded the lowest change in Mh of -6.59% for years 2009 to 2010. It should be noted that Figure 12 illustrates the percentage change in Mh for all business establishments considered. It is worthwhile also exploring the location patterns of new business establishments relative to existing businesses (or anchor points) as this sheds light on location choice preferences of new business establishments. This structural change in represented in Figure 13 which illustrates the evolution of percentage change in Mh – median distance of new business establishments relative to anchor points (or existing businesses) within 2500 meters. Figure 13 clearly provides an evidence of sustained centralization (or clustering) of retail trade business in both South Coast and City of Santa Maria regions. This again reinforces the notion that businesses in retail trade tend to locate near each other for increased productivity and reduction in costs (Weltevreden et al., 2005). However, this is not the case of healthcare services in both regions. For example, in City of Santa Maria there is a clear trend of centralization and decentralization as observed for years 1995 to 1996 (percentage change is -51.43%) and 1998 to 1999 (percentage change is 105.13%) respectively. This result can be interpreted as growth of existing clusters and formation of new clusters. Similar trends are also observed in healthcare services for South Coast region; however, the percentage changes are not as high as City of Santa Maria. Furthermore, for healthcare services in City of Santa Maria the attractions of new businesses to these clusters can be viewed as formation and emergence of cluster in year 1995 and 2000 respectively. As noted in the previous subsection, we are also interested in the associated structural changes of spatial clusters over time. This is specifically important at the neighborhood level as it can be viewed as a direct measure of growth and decline of clusters where business establishments locate. This again relates back to the concept of cluster lifecycles as proposed by
! 25!
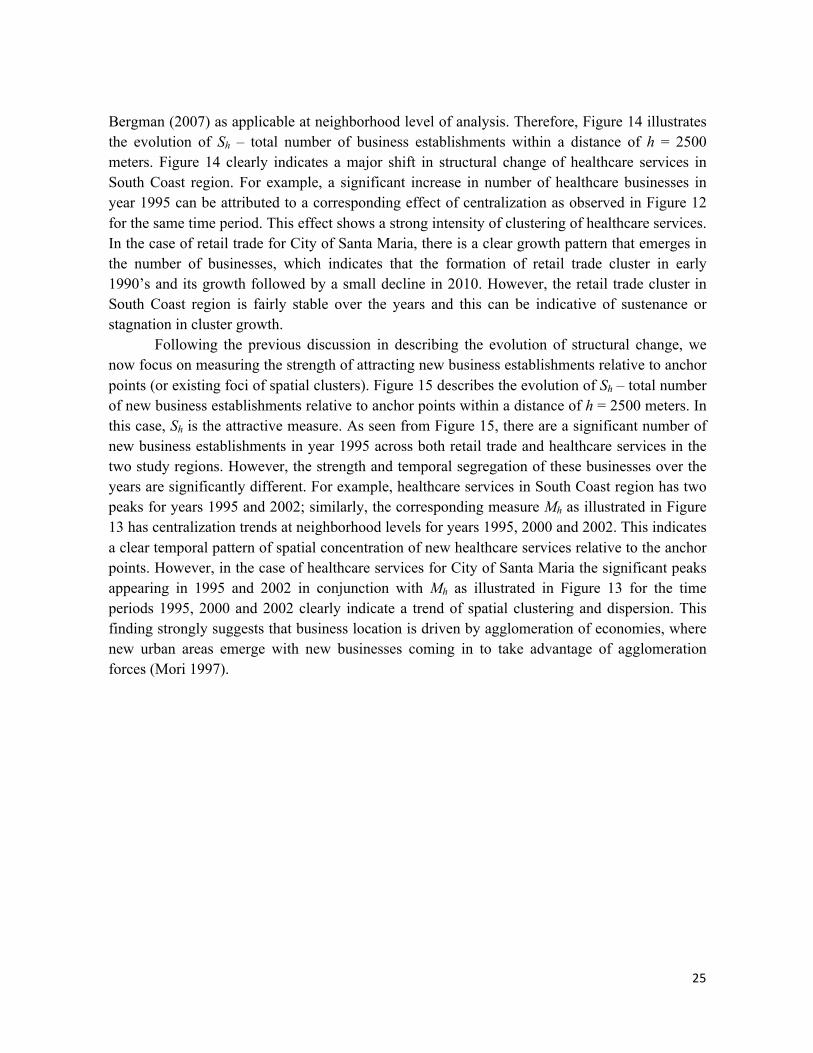
Bergman (2007) as applicable at neighborhood level of analysis. Therefore, Figure 14 illustrates the evolution of Sh – total number of business establishments within a distance of h = 2500 meters. Figure 14 clearly indicates a major shift in structural change of healthcare services in South Coast region. For example, a significant increase in number of healthcare businesses in year 1995 can be attributed to a corresponding effect of centralization as observed in Figure 12 for the same time period. This effect shows a strong intensity of clustering of healthcare services. In the case of retail trade for City of Santa Maria, there is a clear growth pattern that emerges in the number of businesses, which indicates that the formation of retail trade cluster in early 1990’s and its growth followed by a small decline in 2010. However, the retail trade cluster in South Coast region is fairly stable over the years and this can be indicative of sustenance or stagnation in cluster growth. Following the previous discussion in describing the evolution of structural change, we now focus on measuring the strength of attracting new business establishments relative to anchor points (or existing foci of spatial clusters). Figure 15 describes the evolution of Sh – total number of new business establishments relative to anchor points within a distance of h = 2500 meters. In this case, Sh is the attractive measure. As seen from Figure 15, there are a significant number of new business establishments in year 1995 across both retail trade and healthcare services in the two study regions. However, the strength and temporal segregation of these businesses over the years are significantly different. For example, healthcare services in South Coast region has two peaks for years 1995 and 2002; similarly, the corresponding measure Mh as illustrated in Figure 13 has centralization trends at neighborhood levels for years 1995, 2000 and 2002. This indicates a clear temporal pattern of spatial concentration of new healthcare services relative to the anchor points. However, in the case of healthcare services for City of Santa Maria the significant peaks appearing in 1995 and 2002 in conjunction with Mh as illustrated in Figure 13 for the time periods 1995, 2000 and 2002 clearly indicate a trend of spatial clustering and dispersion. This finding strongly suggests that business location is driven by agglomeration of economies, where new urban areas emerge with new businesses coming in to take advantage of agglomeration forces (Mori 1997).
! 26!
FIGURE 12 Evolution of Mh – median distance from a business establishment to all other business establishments within a distance of 2500 meters
FIGURE 13 Evolution of Mh – median distance from new business establishments relative to the anchor points within a distance of 2500 meters
! 27!
FIGURE 14 Evolution of Sh – total number of business establishments with in a distance of 2500 meters
FIGURE 15 Evolution of Sh – total number of new business establishments relative to anchor points within a distance of 2500 meters
! 28!
We further explore the spatial and temporal patterns of Sh – the total number of business establishments in healthcare businesses within a 2500 meters buffer (network distance) of a hospital. We define a hospital based on the four-digit SIC code that includes general medical and surgical hospitals, psychiatric hospitals and specialty hospitals. This analysis is performed for two cases – (a) the distribution of all healthcare services from all hospitals and (b) the distribution of all new healthcare services relative to the hospitals as anchor points. We conduct this analysis for years 1990, 1995, 2002 and 2010 for both the cases, as these years have significant variation in spatial and temporal patterns as seen in Figure 14 and Figure 15. However, it should be noted that when reporting new business establishments or healthcare services relative to the anchor points the first year when a new business was observed is from year 1991. This analysis also accounts for the composition or sectorial dynamics within healthcare services. This sheds light on the spatial and temporal distribution of individual healthcare services around a hospital, which is a significant component in modeling disaggregate business location decisions for healthcare services. The healthcare services is further decomposed into – general medical doctors that include cardiologists, neurologists, oncologists etc.; dentists and their offices and clinics; specialty doctors like chiropractors, physicians and optometrists; hospitals; medical laboratories and others. This classification is based on the four-digit SIC code. The results for both South Coast region and City of Santa Maria are illustrated as in Table 5 and Table 6 for all and new healthcare services respectively. As seen from Table 5, general medical doctors form a significant percentage (an average of 46.5%) of healthcare businesses concentrated around a hospital over time for both South Coast and City of Santa Maria regions. However, the concentration of dentists around a hospital decreases from 20.59% to 15.85% for years 1990 and 2010 respectively in the South Coast region. In City of Santa Maria, the concentration of dentists decreases significantly from 20.4% in year 1990 to 15.4% in 2002 and increases to 23.3% in 2010. Similarly, specialty doctors and medical labs also concentrate around a hospital indicating the presence of strong localization economies for both the regions. Furthermore, there is also a presence of small percentage of other hospitals within the 2500 meters buffer. The presence of a hospital as an anchor-point serves as an indicator of existing healthcare facilities in the region and the new healthcare services agglomerate around this hospital to benefit from co-location where other new healthcare services are also further attracted. This creates the emergence of a strong clustering effect with its growth, sustenance and decline over time. These results are presented in Table 6. There is a significant attraction and concentration of general medical and specialty doctors surrounding the existing hospitals in both the regions. However, general medical doctors form a major portion (an average of 64%) of new healthcare services surrounding the anchor hospital in City of Santa Maria. Furthermore, for year 1995 most of the concentration of healthcare services is from dentists and specialty doctors with 17.07% and 21.95% respectively. In the South Coast region, there is also a significant increase in concentration of medical laboratories in year 2010, when compared with other years. Moreover, the concentration of dentists decreases rapidly for years 1995 and 2002 with 4.94% and 5.76%
! 29!
respectively. These years also report a major number of new healthcare services in this region. It should be noted that for City of Santa Maria there is only one anchor-point hospital for the study period 1990 to 2010. These results clearly indicate that hospitals act as major attractors for other healthcare services reinforcing the notion of localization economies. However, there are different spatial and temporal patterns that are observed within healthcare services. These results point to the fact that agglomeration economies varies within the same sector at different levels of industry code. This also supports the argument by Fratesi (2008) that very little importance is given to sectorial scale when developing measures of agglomeration of economies. TABLE 5 Sectorial compositions of healthcare services within 2500 meters of all hospitals
Year South Coast Healthcare Services City of Santa Maria Healthcare Services
1990 1995 2002 2010 1990 1995 2002 2010 Average number of healthcare services (Sh)
We also present the sectorial composition retail trade in the following tables for years 1990, 1995, 2002 and 2010. The classification of the retail trade is based on the two-digit SIC code into – building materials that include hardware, garden supply and mobile home dealers; general merchandise that include department, duty free and variety stores; food stores include grocery
! 30!
stores, supermarkets and convenience stores; automotive dealers; apparel and accessory stores; home furniture and furnishing stores; eating and drinking places and miscellaneous retail. TABLE 7 Sectorial compositions of retail trade business establishments within 2500 meters of all retail trade businesses
Year South Coast Retail Trade City of Santa Maria Retail Trade 1990 1995 2002 2010 1990 1995 2002 2010
SUMMARY AND CONCLUSIONS In this study we explore the spatial differences and changes in a twenty year period of concentration and dispersion of business establishments in Santa Barbara. This is the first step towards developing models of location and relocation for large scale microsimulation forecasting systems. The current literature on this subject ignored the dynamic nature of localization of businesses especially from the context of quantifying centralization and decentralization trends. We explore these dynamic patterns at the business establishment level using the 2011 NETS database, which is a longitudinal database that tracks an individual business establishment from year 1990 to 2010 at yearly intervals.
! 31!
We also present a spatial analysis approach to generate regional and neighborhood measures for exploring the space-time patterns of business concentration and dispersion. In short, the method consists of – (a) for all business establishments compute the network-based pairwise distance and Euclidean pairwise-distance; (b) using network-based distances from (a) compute the metrics of Mh - median distance from a business establishment to all other businesses for all business establishments within a distance h and Sh – total number of business establishments within a distance h; (c) compute network-based pairwise for all new business establishments relative to the anchor points and (d) based on network-based distances from (c) compute the metrics Mh – median distance from a new business establishment to an anchor point within a distance h and Sh – total number of new business establishments from an anchor point within a distance h. We define regional measures for h = 6000 meters and neighborhood measures for h = 2500 meters. This analysis is conducted for retail trade and healthcare services located in the areas of South Coast Santa Barbara and City of Santa Maria.
The results in this study clearly indicate that there is a significant variation in spatial and temporal patterns of concentration and dispersion of businesses in the region. The findings from Cartesian and network space analysis, suggest that it is appropriate to analyze distribution of economic activities in a network space as spatial analysis in Cartesian space can over-detect clustering effects.
Exploration of large-scale (or regional) patterns from Figure 8 reveal that for year 1995 there is clustering and dispersion of businesses in both study areas, and this is especially dominant in healthcare services in the South Coast area with a change in percentage of pairwise-distance of -15.2%. At a larger scale, there is evidence of spatial and temporal stability of concentration of businesses especially for retail trade within 6000 meters as the change in Mh is very small as seen from Figure 9. However, there is a significant effect of centralization and decentralization (change in pairwise distance) that occurs over time for new healthcare services relative to anchor points in both areas. This finding also supports that firms appear to be attracted to locations with large concentrations of firms in their industry (Hanson 2001).
There seems to be a strong presence of localization economies at the neighborhood level when compared with the regional scale across both the industries for both the regions as there is very little spatial and temporal variation in Mh. Furthermore, the anchor-point analysis also suggests that both in South Coast and City of Santa Maria there is an evidence of sustenance in centralization for retail trade. This reinforces the notion that businesses in retail trade tend to locate near each other for increased productivity and reduction in costs (Weltvreden et al. 2005). At the neighborhood level there is a clear indication of major structural shifts over time in healthcare services in South Coast region, with centralization occurring in years 1995, 2000 and 2002 with significant increase in number of new healthcare services. However, for healthcare services in City of Santa Maria there seems to be evidence of clustering and dispersion for years 1995, 2000 and 2002 respectively.
Overall, the findings of this analysis do suggest a significant presence of spatial and temporal dynamics in agglomeration economies for both regions and these findings suggest that
! 32!
these trends should be taken into account for business location choice models. The results from the case study also suggest that there is a strong presence of spatial clustering in the retail trade business for both South Coast and City of Santa Maria regions. These spatial clusters are further sustained over time with dominant force of localization economies thereby attracting new retail businesses relative to the anchor points (or existing businesses) where clusters exist. City of Santa Maria, also records a consistent growth in attracting new retail trade businesses as observed over time. However, in the case of healthcare services for both regions the space-time patterns are significantly different when compared to retail trade indicating centralization and decentralization trends, which is dominant in City of Santa Maria specially observed at the neighborhood level. In terms of next steps in model development, the findings here suggest that we should develop business relocation models that account for the spatial and temporal context and possibly identify hierarchies within the same industry but also relationships with other industries.
Our study is limited in many ways. First, the analysis provided here is purely descriptive and inferences are based on observed trends and exploratory in nature. Second, by isolating the two regions and industries we do not account for any types of interactions that might exist between Santa Maria and South Coast Santa Barbara. Third, we also do not account for any spatial and temporal dependencies that exist among all industries in the region and their location patterns. Fourth, we consider the regional roadway network to be fixed for year 2003 and perform the analysis using location of establishments as if the network did not change. This is mainly due to the limitation of the availability of network data over time. However, no new major facilities were built during the observation period and most improvements increased the speed but also the amount of traffic. Finally, we also do not include any other variables like market areas, competition, built environment and other factors that might influence the location decisions of businesses. In the immediate next steps of this analysis we will develop statistical models that will sort the significance of a variety of factors in explaining concentration and dispersion of business establishments in a wider variety of spatio-temporal contexts. ACKNOWLEDGEMENTS Funding for this research was provided by the University of California Transportation Center and the University of California Office of the President for the Multi-campus Research Program Initiative on Sustainable Transportation and the Southern California Association of Governments. This paper does not constitute a policy or regulation of any Local, State or Federal agency.
! 33!
REFEERENCES
Acs, Z.J., Parsons, W. and Tracy, S. (2008). High-Impact Firms Gazelles Revisited. Report prepared for Small Business Association, Office of Advocacy.
Anas, A., Arnott, R. and Small, K. (1998). Urban spatial structure. Journal of Economic Literature, vol.36, pp.1426-1464.
Arbia, G. (1989). Spatial data configuration in statistical analysis of regional rconomic and related problems. Dordrecht: Kluwer.
Arbia, G., Espa, G., Giuliani, D. and Mazzitelli, A. (2010). Detecting the existence of space-time clustering of firms. Regional Science and Urban Economics, vol.40, pp.311 – 323.
Bailey, T. and Gatrell, A. (1995). Interactive Spatial Data Analysis. Prentice Hall Publications.
Barff, R.A. (1987). Industrial Clustering and the Organization of Production: A Point Pattern Analysis of Manufacturing in Cincinatti, Ohio. Annals of the Association of American Geographers, vol.77, no.1, pp.89-103.
Batty, M. (2005). Network geography: Relations, interactions, scaling and spatial processes in GIS. In Unwin, D.J. and Fisher, P. (eds). Re-presenting Geographical Information Systems. Chichester, John Wiley and Sons: 149-170.
Bergman, E.M. (2007). Cluster life cycles: an emerging synthesis. In C. Karlsson (ed.) Handbook of Research on Cluster Theory. Edward Elegar: Cheltenham, U.K., pp.114-132.
Berry, B.J.L., Epstein, B.J., Ghosh, A., Smith, R.H.T. and Parr, J.B. (1988). Market Centers and Retail Location Theory and Applications. Prentice Hall, Eglewood Cliffs, NJ, USA
Bodenmann, B.R. (2011). Modelling firm (re)-location choice in UrbanSim. Paper presented at the 51st ERSA Congress, Barcelona, 30 August – 3 September, 2011.
Borchert, J.G. (1998). Spatial dynamics of retail structure and the venerable retail hierarchy. GeoJournal, vol.45, pp.327-336.
Bossuso, G. (2008). Network density estimation: A GIS approach for analysing point patterns in a network space. Transactions in GIS, vol.12, no.3, pp.377-402.
! 34!
Christaller, W. (1933). The Central Places of Southern Germany. Prentice Hall, NJ reprint 1966.
Calculli, C., Pollice, A. and Serinelli, M. (2011). Spatial analysis of the risk of multiple cancers in relation to a petrochemical plant. Envirometrics, vol.23, pp.175-182.
Dijkstra, E.W. (1959). A note on two problems in connexion with graphs. Numerische Mathematik, vol.1, pp.269-271.
Dorantes, L., Paez, A. and Vasallo, J.M. (2011). Transportation infrastructure impacts on firm location: the effect of a new metro line in the suburbs of Madrid. Journal of Transport Geography, vol.22, pp.236-250.
Duranton, G. (1997). The new economic geography: agglomeration and dispersion. Economie et Prevision, vol.131, no.5.
Duranton, G. and Overman, H.G. (2005). Testing for localisation using micro-geographic data. Review of Economic Studies, vol.72, no.4, pp.1077-1106.
Eberts, R.W. and McMillen, D.P. (1999). Agglomeration Economies and Urban Public Infrastructure. Handbook of Regional and Urban Economics, Eds., E.S. Mills and P. Cheshire.
Ellison, G. and Glaeser, E.L. (1997). Geographic concentration in U.S. manufacturing industries: A dartboard approach. Journal of Political Economy, vol.105, no.5, pp.889-927
Feser, E. and Sweeney, S. (2000). A test for the coincident economic and spatial clustering of business enterprises. Journal of Geographical Systems, vol.2, no.4, pp.349-373.
Feser, E.J. (1998). Enterprises, externalities and economic development. Journal of Planning Literature, vol.12, no.3, pp.283-302.
Fratesi, U. (2008). Issues in the measurement of localization. Environment and Planning A, vol.40, pp.733 – 758.
Frenkel, A. (2001). Why high technology firms choose to locate in or near metropolitan areas. Urban Studies, vol.38, pp.1083-1102.
! 35!
Fujita, M. and Thisse, J.F. (2002). Economies of agglomeration: cities, industrial location, and regional growth. Cambridge University Press.
Ghosh, A. and McLafferty, S.L. (1987). Location Strategies for Retail and Service Firms. Lexington Books, Lexington MA.
Gini, C. (1936). On the measure of concentration with special reference to income and wealth. Cowles Commission Research Conference on Economics and Statistics, Colorado College Publication, General Series No.208, pp.73-79.
Hanson, H.H. (2001). Scale economies and the geographic concentration of industry. Journal of Economic Geography, vol.1, pp. 255-276.
Henderson, V. (1986). Efficiency of resource usage and city size. Journal of Urban Economics, vol.19, pp.47-70.
Henderson, V. (1997). Medium size cities. Regional Science and Urban Economics, vol.27. no.6, pp.583-612.
Hotelling, H. (1929). Stability in competition. The Economic Journal, vol.39, pp.41-57.
Jacobs, J. (1969). The Economy of Cities. Vintage Books, New York.
King, L.J. (1985). Central Place Theory. Scientific Geography, vol1, eds. Grant Ian Thrall.
Kolko, J. and Neumark, D. (2007). Are California’s Companies Shifting Their Employment to Other States? Public Policy Institute of California.
Krugman, P. (1991). Increasing returns and economic geography. Journal of Political Economy, vol.99, no.3, pp.483-499.
Krugman, P. (2011). The new economic geography, now middle-aged. Regional Studies, vol.45, no.1, pp.1-7.
Kunkle, G. (2011). Business Establishment Employment Data: NETS versus ES-202. Edward Lowe Foundation’s Institute for Exceptional Growth Companies.
! 36!
Losch, A. (1944). The economies of location. Yali University Press, New Haven, CN.
Maki, N. and Okabe, A. (2005). Spatio-temporal analysis of aged members of a fitness club in suburbs. Proceedings of the Geographical Information Systems Association, vol.14, pp.29-34.
Maoh, H. and Kanaroglou, P. (2007). Business establishment mobility behavior in urban areas: a microanalytical model for the City of Hamilton in Ontario, Canada. Journal of Geographical Systems, vol.9, pp.229-252.
Maoh, H. and Kanaroglou, P. (2007). Geographic clustering of firms and urban form: a multivariate analysis. Journal of Geographic Systems, vol.9, pp.29-52.
Marcon, E. and Puech, F. (2003). Evaluating the geographic concentration of industries using distance-based methods. Journal of Economic Geography, vol.3, pp.409-428.
Marcon, E. and Puech, F. (2012). A Typology of Distance-based Measures of Spatial Concentration. Working paper, Pasteur Institute of Guiane in Cayenne.
Marshall, A. (1920). Principals of Economies. 8th edition, MacMillan, Reprint 1994.
Miller, H.J. (1999). Measuring space-time accessibility benefits within transportation networks: Basic theory and computational methods. Geographical Analysis, vol.31, pp.187-212.
Mori, T. (1997). A modeling of megapolis formation: the maturing of city systems. Journal of Urban Economics, vol.42, pp.133 – 157.
Neumark, D., Wall, B. and Zhang, J. (2005). Business Establishment Dynamics and Employment Growth. Entrepreneurship Seminar Series, Hudson Institute Center for Employment Policy.
Ohlin, B. (1933). Inter-regional and International Trade. Harvard University Press.
Okabe, A. and Kitamura, M. (1996). A computational method for market analysis on a network. Geographical Analysis, vol.28, pp.330-349.
Okabe, A. and Sugihara, K. (2012). Spatial Analysis along Networks: Statistical and Computational Methods. First Edition, John Wiley and Sons Ltd.
! 37!
Okabe, A. and Yamada, I. (2001). The K-function method on a network and its computational implementation. Geographical Analysis, vol.33, pp.271-290.
Ottoviano, G.I.P. and Puga, D. (1998). Agglomeration in the global economy: a survey of the new economic geography. The World Economy, vol.21, no.6, pp.707-731.
SANET (2012). A Spatial Analysis along Networks (Ver 4.1) Atsu Okabe, Kei-ichi Okunuki and SANET Team, Tokyo, Japan.
Shukla, V., & Waddell, P. (1991). Firm location and land use in discrete urban space: A study of the spatial structure of Dallas-Fort Worth. Regional Science and Urban Economics, 21, 225-253.
Sweeney, S. and Feser, E. (2003). Business location and spatial externalities: Tying concepts to measures. In: Spatially Integrated Social Science – Examples in Best Practice, Ed., M. Goodchild and D. Janelle, 19, Oxford University Press, pp.239-262.
Sweeney, S.H. and Feser, E.J. (1998). Plant size and clustering of manufacturing activity. Geographical Analysis, vol.30, no.1, pp.45-64.
Van Wissen, L.J.G. (2000). A Micro-Simulation model of firms: Applications of concepts of demography of the firm. Papers in Regional Science, vol.79, pp.111 – 134.
Waddell, P., & Shukla, V. (1993). Manufacturing location in a polycentric urban area: a study in the composition and attractiveness of employment sub-centers. Urban Geography, 14, 277-296.
Walls, D. (2007). National Establishment Time Series Database: Data Overview. Presented at 2007 Kauffman Symposium on Entrepreneurship and Innovation Data.
Welevreden, J., Atzema, O. and Frenken, K. (2005). Evolution in city center retailing: the case of Utrecht (1974 – 2003). International Journal of Retail and Distribution Management, vol.33, pp.824-841.
Wu, F. (1999). Interametropolitan FDI firm location in Guanzhou, China: a poisson an negative binomial analysis. Annals of Regional Science, vol.33, pp.535-555.
Yamada, I. and Thill, J. (2007). Comparison of planar and network K-functions in traffic accident analysis. Journal of Transport Geography, vol.12, pp.149-158.