6£0« }/A"'fAS~~~':Py JSC-13745 - LARGE AREA CROP INVENTORY EXPERIMENT (lACIE) - --- NASA NOAA USDA FINAL TECHNICAL EVALUATION SUMMARY REPORT NI\SI\ National Aeronautics and Space Administration Lyndon B. Johnson Space Center October I, 1978
R. B. MacDonald, ManagerLarge Area Crop Inventory Experiment
PREFACE
The purpose of this document is to describe theLarge Area Crop Inventory Experiment - its back-ground, technical approach, results, and majorconclusions.
iii
CONTENTS,
Section
SUMMARY
INTRODUCTION.The Agro-EconomiciSituationThe Need for Improved InformationThe Background of LACIE .LACIE Management.Roles of the Federal Agencies •Role of Universities and Industry
EXPERIMENTAL OBJECTIVES, SCOPE, AND TECHNICAL APPROACH ..Experimental ObjectivesScope and Schedule.Technical Approach.
RESULTSPhase III U.S.S.R. Results ..U.S., U.S.S.R., and Canadian Results - Phase I ThroughPhase III .Phase III U.S. Results.Phase II Results in U.S., U.S.S.R., and Canada.Foreign Exploratory Investigations.Technological Achievements and Problems RequiringFurther Attention •.........
USDA USER SYSTEM.
CONCLUSIONS
OUTLOOK ..
REFERENCES.
BIBLIOGRAPHY.
v
Page
1
5
5
6
8
9
9
10
11
11
1215
1919
32
32
36
38
39
41
43
47
49
51
. ,
Table
1
2
3
4
5
TABLES
SOVIET WHEAT AND TOTAL GRAINS PRODUCTION FOR THEYEARS 1971 THROUGH 1976 ...•...•.•...•....LACIE 1977 RECOMPUTED ESTIMATES AND RD'S WITHSOVIET 1977 WINTER WHEAT FINAL FIGURES .LACIE 1977 IN-SEASON RELEASES, CV'S, AND RD'SWITH SOVIET SPRING WHEAT FINAL FIGURES ....LACIE 1977 SOVIET TOTAL RECOMPUTED WINTER WHEATAND IN-SEASON SPRING WHEAT FORECASTS, CV'S, ANDRD'S WITH SOVIET FINAL FIGURES .RESULTS OF AN EVALUATION OF THE LACIE PHASE IIIU.S. YIELD MODELS ON 10 YEARS OF INDEPENDENT TEST DATA
vii
Page
20
23
23
24
33
Figure
1
2
3
4
5
6
7
8
9
10
11
12
13
14
FIGURES
u.s. trade balance for net agriculture, nonagriculture,and the difference ...••....••.•......•••Net exports and imports of grain and wheat for majorcountries .Wheat variability - U.S.S.R. and U.S.Roles of LACIE participants .Major wheat-producing regions considered in LACIEOriginal LACIE schedule ...Major wheat-producing regions considered within thethree phases of LACIELACIE technical approach.LACIE estimates of 1977 Soviet wheat productionThe contributions of LACIE Soviet winter and springwheat production estimates to the LACIE totalproductions shown in figure 9 ..Percent of normal for May-June temperature in Sovietspring wheat regions .••............•.Percent of normal for May-June monthly precipitation(millimeters) in Soviet spring wheat regions ..•.Percent deviation from normal in moisture supply inSoviet spring wheat regions .Percent deviation from trend yields forecast by LACIESoviet spring wheat models .•.•...
Page
6
6
7
101213
141519
21
25
26
27
2815 Landsat monitoring of drought
wheat ..•..1977 U.S.S.R. spring
2916
17
181920
21
Landsat imagery from Omsk and Kokchetav, illustratingdrought effects .Time series of historical Soviet spring wheat yieldsshowing trends as computed from best linear fit andas projected by LACIE yield models .....Phase III, U.S. nine-state region estimatesPhase III, LACIE estimates for U.S. spring wheat.Comparison of LACIE segments estimates and groundobserved estima~es of wheat area proportions - U.S.yardstick test sites ....•...Landsat segment images in the U.S., U.S.S.R., andChina illustrating strip fields, large fields,and small fields .
ix
30
3133
34
35
37
SUMMARY
The Large Area Crop InventoryExperiment (LACIE) was conductedover three crop seasons from 1974through 1977 by the u.s. Depart-ment of Agriculture (USDA), theNational Oceanic and AtmosphericAdministration (NOAA), the NationalAeronautics and Space Administra-tion (NASA), and supporting indus-tries and research institutions.The experiment was officially con-cluded in June 1978; the analysisand interpretation results andthe final documentation are nowin the final stages of completion.These results indicate the experi-ment met its primary objectives:• Demonstrate an economically
important application of repeti-tive multispectral remote sens-ing from space.
• Test the capability of the Land-sat, together with climatological,meteorological, and conventionaldata sources, to estimate theproduction of wheat - an impor-tant world crop.
• Validate the technology and pro-cedures for its use, which couldprovide improved agriculturalinformation on a global basis.
Three years of intensive evaluationof the remote sensing technology inthe U.S. and 2 years of Sovietwheat forecast experience indicatethat, in important foreign wheatregions, the achievable forecastaccuracies would support and pos-sibly exceed USDA foreign produc-tion forecast performance goals.The USDA "90/90" accuracy goal atharvest of being within ±10 percentof the true production with a con-fidence level of 90 percent wassupported and possibly exceeded by
the LACIE Soviet forecast accura-cies in both years of experimenta-tion. In 1977, the LACIE winterand spring wheat forecastsreleased 2 months prior to the com-pletion of harvesting accuratelyforecast a bumper winter wheatcrop and a significant shortfallin the spring wheat crop. TheLACIE August forecast for totalwheat was within 6 percent of thefinal Soviet figure released6 months later. The LACIE finalestimate, which used data acquiredthrough harvest, agreed with theSoviet figure to within 1 percent.The statistical precision of thoseforecasts was much better thanrequired, thus achieving the repeat-ability necessary to support the"90/90" criterion. These results,which are further corroborated bymore intensive U.s. testing, demon-strate the capability to make accu-rate preharvest and at-harvestforecasts under similar future cir-cumstances. In view of the conven-tional forecast system's significantunderestimates of the Soviet wheatcrop in 1976 and the significantoverestimates in 1977, it is clearthat LACIE technology can make animmediate contribution to the accu-racy and timeliness of existingcommodity forecast information.
'Experimentors began to assemble aresearch and development system in1974 from the available technologybase developed through research con-ducted over the prior decade.Emphasis was placed on utilizingautomated information extractiontechniques wherever possible in orderto pursue the goals of producingtimely information over large areasin a way that would prove cost effec-tive for future operational systems.
This experimental system was thenapplied to the task of estimatingwheat production in important wheat-producing areas of the world. Manymodifications were made to the sys-tem. The procedures for its use,as well as the accuracy and effi-ciency, were steadily improved dur-ing the course of the experiment.
The basic technical approach of LACIEwas to develop wheat production esti-mates by combining independent areaand yield estimates. A productionregion was compartmented into agri-culturally homogeneous subregions byusing Landsat and historic data todefine the uniform "strata." Thearea in wheat was then estimatedfrom Landsat data acquired over sta-tistically selected sample sites.Yields were forecast using modelswhich relied on weather samplesfrom the World Meteorological Organi-zation network. The experiment ex-ploited high-speed digital computerprocessing of data and mathematicalmodels to extract information in atimely and objective manner.
The LACIE technology worked well inestimating wheat production in impor-tant geographic regions, but tests ofthe technology in Canada proved to bemore negative. However, the reasonsfor this were studied in consider-able detail and are fairly wellunderstood. A major factor was theinability of the current satellitesensor with its 80-meter resolutionto distinguish agricultural fieldsthat typically had dimensions ofthat size or smaller. Additionally,barley, a major confusion crop, wasso similar to wheat that it couldnot be reliably differentiated.More recent research on this prob-lem in the U.S. Great Plains (USGP)indicates that this latter problemcan be overcome. Exploratory inves-tigations in other wheat regions of
2
the world were conducted, and thecurrent acreage estimation tech-nology is believed applicable toAustralia, Argentina, and Brazil;because of small fields, improvementis required for China and India.Yield model tests in these countriesindicate that models less dependenton historic data may be required forChina, Argentina, and Brazil.
Major technological improvementswere achieved in the application ofsatellite and weather data duringthe duration of the experiment.These included improvements in thefield of global sampling utilizingLandsat data; a production estima-tion technology utilizing area andyield components; a crop area esti-mation technology that is not depend-ent on the use of ground data; and acrop yield estimation technologythat is implementable on a globalbasis. While both the technologyand understanding of the criticalproblems were significantly ad-vanced through the experiment, inthe opinion of the investigators,they are in an embryonic stage andcould be greatly advanced with con-tinued effort. Refinements to theLandsat data analysis techniquescan further improve wheat identifi-cation accuracies. Yield modelsmay be improved by utilizing Land-sat data to estimate crop appearancetogether with weather measurementsto better define a crop's responseto growing conditions. Modelswhich estimate a crop's stage ofdevelopment may similarly be im-proved to provide important data toassist in making a more reliableseparation of wheat from confusioncrops, such as barley, as well asto support improved early warningand yield forecasts.
The USDA initiated an effort earlyin 1976 to develop a data analysis
system to serve as a vehicle forthe transfer of technology fromapplied research to an applicationwithin the USDA. The USDA systemwas put in initial operation withUSDA personnel during 1978.
An evaluation of the LACIE experi-ence leads to a conclusion thatLACIE has proved to be a responseto an identified national and worldneed. It built on more than a dec-ade of prior research and develop-ment to assemble a first-generationtechnology into an experimentalsystem that was in turn rigorouslytested on a large scale to monitorthe world's most important crop inmajor producing regions of interest.It stimulated related research anddevelopment very importantly,
3
identified key problems requiringfurther attention in the future,and generally provided a basisfor a comprehensive research anddevelopment program to extend thecapability to other crops.
The encouraging results of LACIEhave led to major planning effortsamong the participating agencies toassess the information requirementsof USDA (and possibly other users)and to define a follow-on activityfor the early 1980's which willadvance the capability developed inLACIE to other important globalcrops and agricultural problems. Itis considered likely that, withsuitable effort, this technology willadvance rapidly and could be in wide-spread use in the 1980's.
, INTRODUCTION
The LACIE has been a joint ventureof the USDA, NOAA of the Departmentof Commerce, and NASA.
LACIE was initiated in 1974 as a"proof of concept" experiment toassimilate remote sensing and asso-ciated technology into an experimen-tal system and to apply that systemto the task of producing productionestimates for economically importantagricultural commodities. Wheat,the most important internationallytraded crop, was selected as thetest crop in the experiment bothbecause of its economic importanceand because its selection would fitwell with the evolution of the tech-nology. It is the crop that coversthe largest total geographic area,and field sizes range from the verylarge fields of the United Statesand the Soviet Union to the smallfield plots of India and China.Wheat is being'either grown or har-vested or sown in some part of theworld almost every day of the year.Wheat is one of the least complexcrops from an agricultural stand-point, is one of the best understoodcrops in regards to remote sensing,and was considered an excellenttechnological stepping stone becausethe technology developed should beadaptable to other crops.
THE AGRO-ECONOMIC SITUATION
Mankind is becoming increasinglyaware of the need to better managethe utilization of the Earth'sresources - its atmosphere, vegeta-tion, oceans, fresh water, soils,minerals, and petroleum supplies.As the world's population increasesand a higher standard of living issought for all, more careful plan-ning is required to make effective
5
use of these resources to produceadequate food supplies. Agricul-tural production is highly dynamicin nature and dependent on compli-cated interactions of prices,weather, soils, and technology. Theoutlook can and usually does changeas these ingredients are alteredeither through natural changes oras a result of man's decisions.Wheat, for example, is cultivatedwith a wide range of technologylevels and much is grown in semi-arid regions with marginal weather;thus, its production is subject toextreme variations. The world'swheat supply has fluctuated fromthe oversupplies of the 1950's and1960's to the critical deficienciesof the 1972 and 1974 crop years andback to the apparent oversupplies ofthe current period. These devia-tions have had severe economic impact.
Wheat is the most important of theworld's grains, and grains as a classare the most significant commoditiesin terms of global agricultural eco-nomics. Figures 1 and 2 illustratethe magnitude and value of the inter-national trade involved.The great economic importance ofagricultural products in terms of apositive contribution to the U.S.balance of trade, as shown in fig-ure 1, increases the need to obtainthe best possible global agriculturalinformation.
The increasing importance to othernations of the U.s. grain production,and of wheat production in partic-ular, is illustrated in figure 2.
Exporting and importing countriesmust maintain a delicate balance be-tween supply and demand, anticipat-ing the determining factors as far in
50 60 70 71 12 73 74 75 76 -752 62
JI
10
o Non-agriculture
B Agriculture
I Net difference33.7
advance of transactions as possible.The United States is the largest foodexporter in the world and accountsfor about one-half of the globalgrain trade and about 40 percent ofthe wheat trade in terms of tonnage.Clearly, U.S. agricultural decisionshave a far-reaching impact. Whiledecisions have been and will continueto be based upon whatever informationis available, there is a continuingneed on the part of decisionmakers,in both public and private sectors,for improved information. A keyingredient is the best possible esti-mates of national and globalproduction.
THE NEED FOR IMPROVEDINFORMATION
YearS
Source EconomiC RlIS8arch SerVIce and CounCllon tntMnatlonal Economic Policy
Figure 1.- U.S. trade balance fornet agriculture, nonagriculture,and the difference.
In recent years, various organiza-tions formed to study the world foodsituation have recognized the strongneed for a global food and fiber mon-itoring system. In the World Foodand Nutrition Study by the National
~;}U"t)' ~-',! IiO~l.-=."",D;'K
c:J ,-A'J'·~"
0' ..
IMPORTERSEXPORTERSI ~o ~~ ~ - •
~~ "~ ," e 01[ ~ II K'~
~~ CJlJ =12
110~10
~
~ BO
~'JD . i . .'"
~4D
3D
10
73-74 74-1, 7~· 76 76_77
ylAliS
Source: Foreign Agricultural Service, USDA
Figure 2.- Net exports and imports of grain and wheat for major countries.
6
Academy of Science, the followingrecommendation was made: "It isrecommended that research be under-taken towards the development andimplementation of a capability torepetitively monitor the status ofthe world's critical food producingregions and provide early warning ofpotential shortages in production.It is further recommended that acontinuing supporting research andtechnology program be organized todevelop future improvements forlater incorporation into subsequentversions of an initial monitoringsystem." A similar resolution wasmade at the 1974 World Food Confer-ence in Rome, Italy, in which an"urgent need for a worldwide foodinformation system" was cited. Itwas recommended that such a systemidentify areas with imminent foodproblems and monitor world foodsupply and demand conditions.
Current world food supply estimatesare a compilation of estimates gen-erated for the'most part by thevarious national agricultural infor-mation systems. The quality ofworld estimates, therefore, is afunction of the quality of theinformation systems in the variouscountries. The estimates rangefrom timely and reliable to almost
nonexistent. Frequently, estimatesbased on past trends, sometimesadjusted by subjective judgment,are given in lieu of objective andcorrect information.
A complicated but extremely impor-tant capability that must exist inany agricultural information system,if it is to be dependable, is theability to assess both componentswhich contribute to the variabilityof observed production - area andyield. Figure 3 shows variabilityin area, yield, and production forthe u.s. and in area and productionfor the U.S.S.R., two major wheat-producing nations. (The U.S.S.R.does not report yield. Wheneveryield estimates are presented forSoviet wheat, those estimates arecomputed from estimates of produc-tion and the area involved in thatproduction.) A comparison of thecharts indicates that in the U.S.,yield and area have fluctuatedsignificantly from year to year,while in the U.S.S.R. both areaand production have similarlyvaried.
To forecast production accuratelywith remote sensing technology, itis critical to associate the cor-rect weather with the actual area
SOURCE, U.s_S.R_ ORAIN STATISTICS. NATIONAL AHO REGIONAL ltH,1ISECONOMIC R£SIEARCH SERVICE USDA. BULLEn,. &601
SOURCE: AOR'CUL TUAAl STATISTIC$1tll. USDA
Figure 3.- Wheat variability - U.S.S.R. and U.S.
7
being affected. Where the effectsare so severe as to remove areafrom production, this abandonedarea must be correctly measured.Therefore, an effective agricul-tural information system must notonly monitor the total area har-vested, but it must also monitorthe proportion of the area affectedby weather extremes.
There is a manifest need to managethe planet's agricultural production,and improved information is criticalto better management. This needbrought into focus the feasibilityof applying remote sensing, togetherwith related technology, to the taskof developing and evaluating tech-nology that could serve an importantrole in providing the global agri-cultural information.
THE BACKGROUND OF LACIE
The foundation for LACIE was estab-lished in 1960 when the AgriculturalBoard of the National Research Coun-cil recommended that a committee beformed to investigate the potentialof aerial surveys to provide anincreased capability in monitoringagricultural conditions over largegeographic areas. An interdiscipli-nary group of scientists was selectedto serve on the Committee on RemoteSensing for Agricultural Purposes,and by late 1962 the group had de-signed experiments to assess thefeasibility of utilizing multispec-tral remote sensing to monitor cropproduction. This was followed in1965 by the establishment of anorganized research program, by theUSDA and the NASA, that led in anorderly fashion from the firstsuccessful computer recognition, in
1966, of wheat using multispectralmeasurements collected with aircraftto: (1) the identification of thespectral bands and other design char-acteristics of the first Earth Re-sources Technology Satellite (ERTS*)in 1967; (2) a simulation of ERTSdata from the S-065 multispectralphotographic system of Apollo IX in1969; (3) the successful launch ofERTS in 1972; and (4) the conduct offeasibility investigations in 1972and 1973 which demonstrated the po-tential utility of the ERTS systemto monitor important crops.
Investigations into the relation-ships between weather and crop yieldhave been an agricultural researchinterest of long standing. Theavailability in recent decades ofhigh-speed computers and worldwideweather data allowed more extensivestatistical analysis of the relation-ships of yield and weather. Someresearchers had studied individualplant response to weather factorswhile others had investigated theproblem on a larger scale to deter-mine the relationship between averageyield and the departures from normalclimatic conditions in a specificregion. Several of these studieswere undertaken at Iowa StateUniversity about 1970 to investi-gate key relationships betweenyield, technology, and climate inthe major grain-producing areas ofthe United States. Based upon thatwork, NOAA initiated a study in1973 to evaluate the likelihood ofdrought conditions reappearing inthe U.S. and the possible effectsof drought upon grain yield.
These efforts resulted in thedevelopment of an initial base of
*ERTS-l was renamed Landsat 1. Although Landsat 1 is no longer functioning,Landsats 2 and 3 are now in orbit and producing usable data.
8
technology to support agriculturalproduction monitoring. LACIE wasa logical next step in the chainof research and development. Thistechnology base consisted of earthobservation satellites, environ-mental satellites, communicationslinks, high-speed computer process-ing equipment, mathematical models,and an initial understanding of theuse of these components in such anapplication. In LACIE, these ele-ments were, for the first time,assembled into a system capable ofa large-scale application and eval-uation, and the resulting systemestablished the applicability ofthis technology to the monitoringof global wheat production.
LACIE MANAGEMENT
The LACIE experiment was guided bya tiered management structure whichinvolved personnel from the USDA,NOAA, and NASA. Senior level per-sonnel provided top level programobjectives, and approved majorchanges in program direction, bud-geting, and schedules. A manage-ment team with members from thethree agencies was responsible forreviewing the technical progress ofthe program and ensuring that theprogram was accomplished on sched-ule, within allocated resources.A third level was the LACIE ProjectManager who was responsible forproject implementation and day-to-day operations. The major decisionsand directions for the LACIE experi-ment were made using this manage-ment structure to ensure that useragencies' needs were being met andthat all agencies were active
9
participants in all phases of theproject.
ROLES OF' THE FEDERAL AGENCIES
Each of the three U.S. Governmentagencies participating in LACIEbrought specific expertise and expe-rience to the planning and implemen-tation of the experiment. Most ofthe individual LACIE tasks requiredthe integrated efforts of at leasttwo of the three agencies; however,various lead responsibilities wereassigned. The USDA was responsiblefor user requirements definition;collection of ground truth and his-toric data; compilation and releaseof production, yield, and area esti-mates; cost-effectiveness analysisand reports; and USDA prototype sys-tem design and test. NOAA wasresponsible for the acquisition andprocessing of real-time and historicworldwide meteorological data; theanalysis of meteorological data toprovide seasonally adjusted cropcalendars; the development andoperation of models to estimateyield through the growing season;and the preparation of narrativeassessments of crop growing condi-tions in regions of interest. NASAwas assigned responsibility for theproject technical management; inven-tory system requirements definition;experiment design, implementation,operation, and system performancereporting; area classification andmeasurement technique development andimplementation; and Landsat dataacquisition and processing. Figure 4illustrates the three agencies'participation.
WHEAT DATA ACQUISITIONAND ANALYSIS TO INVEN-TORY CROP AREA
WEATHER DATA ACQUISITIONCORRELATION OF YIELD TOWEATHER EVENTS
INDUSTRY AND UNIVERSITIES
AGRICULTURAL EXPERTISEPRODUCTION REPORTING
rEach of the three agencies of the U.S. Government (USDA 1NOAA, and NASA) that conducted LACIE brought particularexpertise to the experiment and were supported by indUS~ryand universities.
Figure 4.- Roles of LACIE participants.
ROLE OF UNIVERSITIES ANDINDUSTRY
Researchers from universities andindustry played a key role in support-ing the experiment through thedevelopment of improved techniquesthat were evaluated in the later
10
phases of LACIE, and through partici-pation in technical review sessionsheld periodically throughout theexperiment. In addition, throughcontracts from the agencies, keyindustries were vital to the imple-mentation and operation of theexperiment.
EXPERIMENTAL OBJECTIVES, SCOPE, AND TECHNICAL APPROACH
EXPERIMENTAL OBJECTIVES
The LACIE objectives as set forthin the Project Plan (ref. 1)prepared in March 1975 and offi-cially approved in August 1975include the following:• To demonstrate an economically
important application of repeti-tive multispectral remote sensingfrom space.
• To test the capability of theLandsat, together with climatolog-ical, meteorological, and conven-tional data sources, to estimatethe production of an importantworld crop.
• Commencing in 1975, to validatetechnology which could providetimely estimates of cropproduction.
• To provide estimates of the areaplanted to wheat from an analysisof Landsat data acquired over asample of the potential crop-producing area in major wheat-growing regions; similarly, froman analysis of historical andreal-time meteorological dataover the same regions, to pro-vide estimates of wheat yield andcombine these area and yieldfactors to estimate production .
• To provide data processing anddelivery techniques so thatselected samples can be madeavailable to the LACIE analystteams for initiation of analysisno later than 14 days after acqui-sition of the data.
• To provide a LACIE system designthat will permit a minimum ofredesign and conversion to imple-ment an operational system withinthe USDA.
11
• To monitor and assess crop prog-ress (calendar) from a surfacedata base and evaluate the modelpotential for yield from surfacedata.
Ancillary goal-oriented activitiesinclude:• Periodic crop assessment during
the growing season from plantingthrough harvest.
• Accuracy commensurate with USDArequirements.
• Supporting research and develop-ment program to improvemethodology and performance.
• Objective test and evaluationprogram to quantify results fromresearch and development.
To maintain the experimental natureof LACIE, it was decided that theperiodic crop assessment reportswould be prepared on a monthly basisduring the crop season, and mailedto the USDA LACIE office the daybefore each corresponding officialUSDA report was released. The accu-racy goal was set for productionestimates at harvest to be within±10 percent of true country produc-tion 90 percent of the time (re-ferred to as the 90/90 criterion)..An additional goal was to establishthe accuracy of these estimates fromearly in the season (the first quar-ter of the crop cycle) and throughthe harvest period. The three agen-cies agreed that achievinq the 90/90criterion would provide an improve-ment over information currentlyavailable at harvest utilizing con-ventional data sources in selectedforeign countries. Also, anevaluation of the accuracy of theperiodic assessments would establish
the accuracy capability of the tech-nology from early season throughthe crop year.
SCOPE AND SCHEDULE
The LACIE was focused on monitoringproduction in selected major wheat-producing regions of the world. Theexperiment extended over three globalcrop seasons, and was designed forexpansion up to eight regions(figure 5). All phases of the exper-iment utilized a "yardstick" wheat-growing region of the U.S.; the nine-state, hard-red-wheat region in theUSGP, where current informationrelative to wheat production and thecomponents of production were avail-able to permit quantitative evalua-tion of the technology in use withinthe LACIE. The experiment includedexploratory studies for monitoringwheat production in five other majorproducing regions: India, People's
Republic of China, Australia, Argen-tina, and Brazil (figure 5). As theexperiment progressed, a combinationof programmatic policy decisions,availability of resources, and theLACIE experimental design permittedan orderly expansion to include themonitoring of wheat production intwo additional major producingregions, Canada and the U.S.S.R.
The LACIE extended over three over-lapping global crop seasons, each ofwhich was considered an experimentphase (figures 6 and 7). Phase I ofLACIE, global crop year 1974-75,focused on the integration andimplementation of technology com-ponents into a system to estimatethe proportion of the major produc-ing regions planted in wheat, and thedevelopment and feasibility testingof yield and production estimationsystems. An end-of-season reportfor area estimates of wheat/smallgrains in the USGP was generated.
Figure 5.- Major wheat-producing regions considered in LACIE.
12
KEY PROJECT EVENTS
LANDSAT·I
1974 197~
I 1...-.IQ7
J II. S N
IS I .T D ~H~L LI t
1977F AMIJ,'
10' I
MtlESlOM IT_tOU
SCHIOUliD COMl'Ull2 COHTJ:OUfD MILUTONI •
~ INfO'.C. MllUTONl •
V IUPl'OtT •. lLInON. '"
"'''YIlT •.•.II •.•NI c:::::::::::J1'1001155 TO COM'lITIQN ~
nATUS UNt
IXNeTlD LATI SlAI' V- ¢"HClIO IAIlI ST'" ¢-------~:-------vCONmAfHtu,,*
1 GO/NO WO° DlCISION TO DUIT' SPI"'O W"Ar•..• , .•.s
~ <~s...DKtSION ON fOllOW-ON IUPPOIT 130u~.'NV' ,J,J Il"rT1'j' ~J. IN ~, •••:.tJKTDlCISIQJt W,O LANDSAT,( I IDICISIOH WITH ANDs •••'·e
LEGEND
'.'~'IM,".u. II'''011~
Of!;
;
IE
••••
AN. UTili Of IXNlIMBlTA ••DGMINfi IN DTNII U.S. llOtONSANO IN 01"11 IfUCnD .IIAS
RT~:LD'" _...-mnST !MU,I .
IVAWAnoN AND DOCUMINTAlION
NOaa "-AN AND SYAIM--IINCUID ••• TlIlI Of TlCMNOLOGT)
TIlT Of AYAtLAILI SUi'yRtM<__
MIA ••••••••• ftONS POIMIlAr •• GlIAl "-UQ I
PHASE IIOPiIATlONS
UlA. ".LO AND "00UCTt0N INMULftCOUN"'"
PHASE I
PHASE III
_ATlONS••••• ytILD AND NODUCnON •••MU\llCO"""
IYA-LUATtON Of ••••••• 1M,,1lID-.•....,
•••••••RAM AI Of, 1/20/75
Figure 6.- Original LACIE schedule.
In addition, at the end of Phase I,key USDA management decisionsresulted in the incorporation of aUSDA-User System within the USDA-LACIE effort.
effort was expended to deal withsignificant problem areas and toincorporate solutions into theLACIE analysis systems for use dur-ing Phase III.
In Phase II, global crop year1975-76, the technology, as modi-fied during Phase I, was evaluatedfor monitoring wheat production forthe USGP and Canada, and "indicatorregions" in the U.S.S.R. Monthlyreports of area, yield, and produc-tion of wheat for these threemajor producing regions were gen-erated. A substantial level of
During Phase III, global crop year1976-77, new technology developedduring Phase II was implemented andevaluated for monitoring wheatproduction for the USGP and theU.S.S.R. Monthly reports of area,yield, and production estimates ofwheat for these major producingregions were generated.
13
(a) Phase I study areas.In global crop year 1974-75, integra-tion and implementation of technologycomponents (developed in pre-LACIEresearch and development efforts)into a system to estimate the pro-portion of the major producing re-gion planted to wheat, developmentand feasibility testing of yield,and production estimation systemswere accomplished. An end-of-season report for area estimates ofwheat/small grains in the USGP wasgenerated. Exploratory experimentswere begun in wheat areas of interest.
• AREAS OF lACIE ANAl YSIS
(lIIi) WHlAT fXPIORATORy- STUDy AREAS
(b) Phase II study areas.In global crop year 1975-76, thetechnology, as modified duringPhase I, was evaluated for moni-toring wheat production for theUSGP, Canada, and "indicatorregions" in the U.S.S.R. Monthlyreports of area, yield, and produc-,tion of wheat for these three majorproducing regions were generated.Exploratory experiments were con-ducted in the other five countries .
(c) Phase III study areas.In global crop year 1976-77, newtechnology was implemented andevaluated for monitoring wheat pro-duction for the USGP and theU.S.S.R. Monthly reports of area,yield, and production estimation ofwheat for these major producingregions were generated. Additionaltests of area technology overCanadian ground truth sites wereconducted .
••• AREAS OF lAC IE ANAL YSIS
• WHEAT EXPlORATORYSTUDY AREAS
• AREAS OF LACIE ANAL YS'S
8 WHEAT EXPLORATORYSTUDY AREAS
Figure 7.- Major wheat-producing regions consideredwithin the three phases of LACIE.
14
TECHNICAL APPROACH
The technical approach to LACIE(figure 8) was to estimate produc-tion of wheat on a region-by-regionbasis where production is theproduct of area and yield. Both
area and yield were estimated forlocal areas and aggregated toregional and country levels basedupon a sample strategy over theregions in which wheat was a majorcrop. Maximum use was made ofcomputer-aided analysis in order
CROP
IDENTIFICATION
FROM SELECTEDSEGMENTS
I DENTI FI ED
TECHNICAL
ISSUES
VERIFIED
SUITABLE
TECHNOLOGY
FIELD DATA
FROM USDA
ASSESSMENTREPORTS
FOREIGN
ESTIMATES
ESCSDOMESTIC
ESTIMATES
PRODUCTIONREPORTS
STANDARDS
FOR
COMPARISON
MONTHLY AREA.
YIELD AND
USDA
jlril ,"""nO'
.- , ' '\~
,....,;~•..~...--~
SAMPLE
SEGMENT WHEAT
YIELD STRATA
ESTIMATES
AREA MEASUREMENT
YIELD ESTIMATION
SAMPLING AND
AGGREGATION
STRATEGY
Figure 8.- LACIE technical approach.
15
to provide the most timely esti-mates possible. Estimates of pro-duction, area, and yield were madethroughout the crop season andevaluations conducted to verify theLACIE technology and to isolate andidentify key technical issues.
Area was derived by analyst/computercrop identification and measurementfrom Landsat 2 multispectral scan-ner (MSS) data acquired over 5- by6-nautical-mile sample segments.Utilization of Landsat full-frameimagery allowed samples to bedrawn only from agricultural areasand required only 2 percent of thearea to be analyzed with the contri-bution of sampling error to thearea estimate being less than2 percent. The digital, computer-aided statistical pattern recogni-tion techniques employed in LACIEwere designed to take advantage ofthe changing spectral response ofcrop types over time in order tomaximize the accuracy of the areameasurement. Thus, Landsat datawere acquired throughout the cropseason, screened for cloud cover,registered to previous acquisitions,and the sample segments extractedin digital format. Since in situground truth was not to be used,training of the pattern recognitionalgorithms was performed by trainedanalyst interpreters who labeleda small amount (less than 1 percent)of each sample segment as eitherwheat or nonwheat.* This labelingwas based on the appearance ofwheat as observed over time on
digital, film imagery of each seg-ment and on graphical plots indicat-ing the response in each of thespectral channels. Because thespectral appearance of the crop isa strong function of growth stage,models were implemented which esti-mated the growth stage of wheatbased on local weather data. Ana-lysts were also provided with ancil-lary information for each regionwhich summarized seasonal weatherand local cropping practices.
Yield was estimated using statis-tical regression models based uponrecorded historical wheat yieldsand weather in each region. Theseregression models forecast yieldfor fairly broad geographic regions(yield strata) using calendar-
monthly values of average air tem-perature and cumulative precipitationover the stratum. Meteorologicaldata for input to these yield models(and, in addition, the growth stage
models and weather summaries) in theUSGP were obtained primarily fromthe surface observation stations ofthe National Weather Service, Fed-eral Aviation Agency, and militaryservices. In foreign areas, thedata were collected by each country'sweather service and were availablevia the global telecommunicationsnetwork of the World MeteorologicalOrganization. Over both the foreignand domestic areas, environmentalsatellite imagery was used to re-fine the precipitation analyses basedupon cloud patterns. Yield modelswere developed in order to make
*In general, analysts were not able to reliably discriminate wheat from othersmall grains during LACIE. Therefore, labeling was generally performed forsmall grains and historically derived ratios were applied to small-grainsestimates to estimate wheat. A procedure for direct discrimination of springwheat from other small grains based on subtle differences in crop stages andappearances was tested late in LACIE Phase III over North Dakota.
16
estimates early in the season,throughout the growing season, andat harvest. For winter wheat in th~Northern Hemisphere, these estimates'began in December and were updateduntil harvest in June or July.
17
Spring wheat yield estimates beganas early as March and were revisedmonthly through August or September.Assessments of potential yield thuscould begin almost at the time theplant emerged from the ground.
RESULTS
without the reliable data sourcesand repeatable analysis techniquestested in LACIE, commodity produc-tion forecast techniques must relyheavily on statistics and reportsreleased by the countries them-selves. Disregarding questions as
In comparison to the accuracy andtimeliness of U.S.S.R. informationcurrently available without LACIEtechnology, LACIE forecast accura-cies demonstrate an importantadvance in the problem of globalcommodity production forecasting.
production, released on August 8,1977, was 97.6 million metric tons(MMT), over 11 percent below the mostrecent FAS July projection but only6 percent above the final U.S.S.R.wheat figure of 92.0 MMT. The finalLACIE estimate of 91.4 MMT differedfrom the U.S.S.R. final figure byabout 1 percent. The wheat produc-tion forecasts released by the FAS areshown as the dashed line in figure 9.
* OFFICIAL SOVIET_LAClf IN SEASON RfUAS£S__ LACIE RECOMPUTED f.STIMf\HS
.'_'FAS
, ,
Au,! s." 011 FIn,,1j,m FeL
1977 1978
llU
120
115
~ 105
PHASE III U.S.S.R. RESULTS
Of all the LACIE results and accom-plishments, perhaps the most impor-tant was the demonstration thatLACIE technology can provide im-proved wheat production informa-tion in important global regionsand can respond in a timely mannerto large weather-induced changesin production. The most graphicexample of this capability occurredin the 1977 LACIE inventory of thewheat crop in the U.S.S.R.
In 1977, the LACIE experimental com-modity production forecast system wasutilized to monitor the U.S.S.R.total country wheat production fromearly season through harvest. Com-modity production forecasts forwinter wheat were generated andreleased to the LACIE project officeof the USDA in.Washington, D.C., theday prior to the corresponding publicrelease by the USDA's Foreign Agri-cultural Service (FAS). LACIE initi-ated forecasts for U.S.S.R. winterwheat production on April 1, 1977;the initial LACIE forecast for springand total wheat was released onAugust 8, 1977. Shown in figure 9are the LACIE in-season forecasts forSoviet total wheat, the FAS fore-casts, and the LACIE recomputed esti-mates generated postharvest prior tothe U.S.S.R. wheat release. Therecomputed estimates are the seasonalforecasts obtained from the LACIEsystem after correction of two Land-sat data problems encountered duringthe Phase III operation: a 45- to60-day processing backlog and miss-ing data resulting from an inadvert-ent omission in a Landsat data order.
The initial 1977 LACIE in-seasonforecast of total U.S.S.R. wheat
Figure 9.- LACIE estimates of 1977Soviet wheat production.
19
to the reliability of such informa-tion, perhaps the major problem isits timeliness. The U.S.S.R. re-leases only a planning figure fortotal grain production early in theyear and a postharvest estimate oftotal grain production in earlyNovember; wheat statistics are notreleased until January or Februaryafter harvest.
In January 1977, the U.S.S.R. re-leased a 213.3-MMT planning figurefor total grains, about 13 percentabove the 1971-74 average shown intable 1 (ref. 2). Since wheat hadhistorically comprised 48 percentof the total grains, the originalU.S.S.R. goal would have containedabout 102 MMT of wheat. FAS esti-mates of total wheat began at about97 MMT in February 1977 (ref. 3).The FAS carried a total-grain fore-cast of 224 MMT, which was signifi-cantly above the Soviet figure of213.3 MMT. The FAS steadily in-creased its wheat forecasts to ahigh of 110 MMT in the July 8 report(ref. 4), primarily in response to
its assessment of a much betterthan average U.S.S.R. winter wheatcrop and a forecast of an averageto above-average spring wheat crop.As can be seen in figure 9, the FASdecreased the Soviet forecast fromthe July figure of 110 MMT by about5 MMT per month thereafter; thereduction on August 10 (ref. 5) wasprimarily in response to June andJuly drought conditions in thespring wheat regions. The 5-MMTreduction in September was primarilyin response to a mid- to late-August official Soviet release ofwinter wheat acreage information(ref. 6). The data compiled aboutJune 1 by the U.S.S.R. indicated aloss of winter wheat acreage due towinterkill during the harsh Sovietwinter. The final FAS release onOctober 20, 1977 (ref. 7) carrieda wheat estimate of 95 MMT and anestimate of total grains at 215 MMT.
On November 2, 1977, ChairmanBrezhnev announced that U.S.S.R.total grains production was expectedto be only 194 MMT. The U.S.S.R.
TABLE 1.- SOVIET WHEAT AND TOTAL GRAINS PRODUCTION FORTHE YEARS 1971 THROUGH 1976
Wheat production Ratio wheat(MMT) Grainsa to grainYear production production
aIncludes wheat, rye, barley, oats, corn, and miscellaneousother grains.
20
Figure 10.- The contributions ofLACIE Soviet winter and springwheat production estimates tothe LACIE total productionsshown in figure 9.
yield from average, this indicatedthat the U.S.S.R. spring wheat cropwould fall a disastrous 30 percentbelow average. If these trendsheld, the U.S.S.R. would achieveonly an average total wheat crop.
As figure 10 shows, the LACIEwinter wheat forecasts had in-creased from the May to Junereports. On the basis of LACIEforecast experience in the U.S.,the increase was a result ofsteadily increasing visibility toLandsat of the wheat crop as itcompleted its early spring devel-opment. Since the continued in-crease in the winter wheat hec-tarage forecasts through July andAugust had no known physical basis,it resulted from a system problem.The LACIE analysts, thus alertedto technical problems, initiatedefforts to isolate the source of
OFFICIALSOVIET
40.1.SPRINGWHEAT
OFFICIALSOVIET
519.WINTERWHEAT.
, o-----JNow F'I\8l
Jon1978
,Qd
LAClf IN SEASON WINTERWHEAT RELEASeS
-.-.----....--- -----552 55_2 552
L.Atlf IN SEASON SPRINGWHEAT RElEASES
LACIE RECOMPUTED WINTERWHEAT ESTIMATES
,
A", •••
1977
63.0
~
•. J 371.D.9 H2
34.&
,
'"',
Ju"
509
.1Moy
.5
50
JO
..
i 45.
The early-season May and June LACIEforecasts for Soviet winter wheatranging from 51 to 55 MMT wereindicating a near-record winterwheat crop (see figure 10). TheLACIE winter wheat estimate of21 million hectares indicated aIS-percent increase in U.S.S.R.plantings ahove average (ref. 8)and a 22-percent increase over the1976 figure. In addition, LACIEyield forecasts stood at 25.5 quin-tals per hectare, 11 percent abovethe U.S.S.R. average. Given thatthe U.S.S.R. could produce a springwheat crop near its 48-MMT average,its 1977 total wheat productionwould achieve near-record propor-tions of 100 to 105 MMT. The LACIEsystem was then focused on theU.S.S.R. spring wheat crop. Theearly-season August estimate of39 million hectares indicated analmost 9-percent decrease fromaverage in the U.S.S.R. 's springwheat planting. Combined with theLACIE yield model forecasts of asurprising 20.5-percent decline in
A review of the FAS reports seemsto indicate that unanticipated lossof winter wheat acreage to winter-kill and a misreading of the poorSoviet harvesting conditions werethe primary causes of the FAS win-ter wheat overestimate. The springwheat overestimate seems to havebeen a result of misreading theimpact and extent of the droughtwhich affected a majority of thespring wheat region in the U.S.S.R.
had missed its target figure by19 MMTi the FAS estimate of 2 weeksprior exceeded the figure by 21 MMT.In late January 1978, the U.S.S.R.announced its 1977 wheat productionat 92 MMT: winter wheat at 51.9 MMT(9.8 MMT above average, as shown intable 1) and spring wheat at40.1 MMT (8.1 MMT below average) •
21
this apparent increase. Thespring wheat estimates seemed tobe unaffected by the problem; theystabilized after the August fore-cast, as expected. LACIE in-seasonforecasts were continued as usualeven though the winter wheat fore-casts were believed to be inflatedby a few percent.
The winter wheat problem was quicklyisolated as being the result of aninadvertent omission in the Landsatdata acquisition order from theJohnson Space Center (JSC) to theGoddard Space Flight Center (GSFC)for the Soviet wheat region abovethe 48th parallel. The failure toorder these acquisitions affectedaccuracies in about 20 percent ofthe U.S.S.R. winter wheat samplesegments. In these segments,Landsat data were not acquiredduring March and April, the winterwheat greening and recovery periodfollowing dormancy. As a result,the Landsat analysts could notdifferentiate between winter grainsand spring grains, which had emergedsufficiently by May to be confusedwith winter grains. Fortunately,the effect on the LACIE forecastswas only a few percent and the real-time in-season forecasts for winterwheat remained reasonably accurate.To evaluate the effect of the dataorder error, "recomputed estimates"were generated in December 1977 toobtain the seasonal estimates whichwould have resulted from the LACIEsystem if planned Landsat dataorders for winter wheat had beencorrectly placed. To generate therecomputed estimates, winter wheatareas for those segments affectedby the faulty data orders werecomputed, using the original segmentarea estimates as estimates of thetotal small grains. The totalgrains estimates were then reducedto winter wheat figures, using
22
historic ratios of winter wheat tototal small grains area. Addi-tionally, a problem arising from the45- to GO-day Landsat data proc-essing backlog observed in Phase IIIwas removed by using Landsat dataacquired up to 30 days before thereporting date for each report. NoLandsat data order problem existedfor the spring wheat forecasts.Recomputed estimates for springwheat are not significantly dif-ferent from the in-season forecasts.
Tables 2, 3, and 4 tabulate therelative difference (RD) and coef-ficient of variation (CV) in percent.The soviet final yield is derivedfrom ratio of production to area, asno soviet figures are available.Area is given in millions of hec-tares (Mha); yield is given inquintals per hectare (q/ha), andproduction is given in MMT.
The recomputed LACIE winter wheatarea, yield, and production esti-mates are in very good agreementwith the U.S.S.R. figures, as shownin table 2. Early, mid-season, andat-harvest forecasts of area, yield,and production differ from theU.S.S.R.'s forecasts by less than afew percent. Table 3 shows similargood agreement with the LACIE springwheat forecasts released during theseason. The August-through-finalLACIE forecasts of U.S.S.R. totalwheat were also in good agreement(table 4) and support the 90/90accuracy criterion. It should beemphasized that the total wheatforecasts given in table 4 userecomputed winter wheat estimatesand real-time in-season releasesfor spring wheat. Total wheatestimates were also generated,using recomputed estimates for bothspring and winter wheat. These willnot be treated here because thespring wheat recomputed estimates do
models to the 1977 meteorologicalconditions in the U.S.S.R. indi-cates that these models responded toboth significantly above and belowaverage growing conditions inU.S.S.R. wheat regions. The Soviet1977 winter wheat production of51.9 MMT was 23 percent above
TABLE 4.- LACIE 1977 SOVIET TOTALRECOMPUTED WINTER WHEAT AND
aBased on Landsat data acquiredthrough the first day of theprevious month.
average. The Soviet spring wheatproduction of 40.1 MMT was 17 per-cent below average.
Clues to the potential shortfall inthe U.S.S.R. spring wheat region
24
came early in the season whenunfavorable weather conditionsbegan. The average air temperaturefor the 2-month period of May andJune was considerably above normalthroughout the spring wheat area,as shown in figure 11. During thesame period of May and June, rain-fall was below average in many ofthe crop regions noted in figure 12.The above-average demand formoisture, combined with the below-average supply, indicated a poten-tial shortfall early in the season.Figure 13 highlights the instancesin which the supply-demand dif-ference deviated most from average.The differences between precipita-tion and potential evapotranspira-tion are used in the LACIE yieldmodels to represent relative soilmoisture available to the crop.As figure 13 indicates, significantdrought effects were forecast inthe eastern and southern cropregions. An investigation of theLandsat data at subregional levelsindicated that the drought condi-tions were clearly observable inthe Landsat data. An examinationof the yield model responsesindicated that the LACIE yieldmodels responded by reducing yieldestimates in the affected regions.Figure 14 displays the model yieldreductions by crop region inresponse to the weather conditionspreseason through harvest. Notethe severe reductions in yield inthe affected regions, in many casesSO percent below normal. Thesedrought conditions were also quiteevident in the Landsat data(figure 15). In this figure, radio-
metric measurements from Landsatwhich are known to be related tothe crop canopy condition indicatedthat the shaded areas, which con-tained a significant share of thewheat acreage in regions 21, 22,23, 24, 25, 27, and 29, were under
severe drought conditions. In theseregions, LACIE yield models wereforecasting below-average yields.
Note, however, that in the northernregions LACIE was forecasting above-average yields.
10. NORTHEASTERN CAUCASUS (M)11. WESTERN BLACK SOIL (M)
12. EASTERN BLACK SOIL (M)13. CENTRAL REGION (M)14. VOLGA VYATSK (M)15. UPPER VOLGA (M)16. MIDDLE VOLGA (M)17. LOWER VOLGA (M)18. NORTHWESTERN URALS (SI19. SOUTHERN URALS (S)20. NORTHEASTERN URALS (S)21. WESTERN KAZAKHSTAN (S)22. KUSTANAY OBLAST (S)
23. TSELINOGRAD OBLAST (S)24. NORTHERN KAZAKHSTAN (S)25. PAVLODAR OBLAST (S)26. WESTERN SIBERIA (S)27. ALTAI KRAY (S)28. TRANS CAUCASUS (S)29. SOUTH KAZAKHSTAN (S)30. CENTRAL ASIA (S)31. NORTHWEST REGION (S)
W - WINTER WHEATS - SPRING WHEATM - MIXED SPRING AND WINTER WHEAT
Figure 11.- Percent of normal for May-June temperature in Sovietspring wheat regions.
25
CROP REGION YIELD STRATA LEGEND
1. BAL TICS (W)2. BELORUSSIA (W)3. WESTERN UKRAINE (W)4. NORTHCENTRAL UKRAINE (W)5. NORTHEASTERN UKRAINE (WI6. EASTERN UKRAINE (W)7. SOUTHERN UKRAINE (W)8. MOLDAVIA (W)9. KRASNODAR KRA Y (W)
10. NORTHEASTERN CAUCASUS 1M)11. WESTERN BLACK SOIL (M)
12. EASTERN BLACK SOIL (M)13. CENTRAL REGION 1M)14. VOLGA VYATSK (M)15. UPPER VOLGA (M)16. MIDDLE VOLGA (M)17. LOWER VOLGA (M)18. NORTHWESTERN URALS (S)19. SOUTHERN URALS (S)20. NORTHEASTERN URALS (S)21. WESTERN KAZAKHSTAN (S)22. KUSTANAY OBLAST (S)
23. TSELINOGRAD OBLAST IS)24. NORTHERN KAZAKHSTAN (S)25. PAVLODAR OBLAST (S)26. WESTERN SIBERIA IS)27. ALTAI KRAY (S)28. TRANS CAUCASUS (S)29. SOUTH KAZAKHSTAN (S)30. CENTRAL ASIA (S)31. NORTHWEST REGION (S)
W - WINTER WHEATS - SPRING WHEATM - MIXED SPRING AND WINTER WHEAT
Figure 12.- Percent of normal for May-June monthly precipitation(millimeters) in Soviet spring wheat regions.
10. NORTHEASTERN CAUCASUS (M)11. WESTERN BLACK SOIL (M)
12. EASTERN BLACK SOIL (MI13. CENTRAL REGION (MI14. VOLGA VYATSK (MI15. UPPER VOLGA (MI16. MIDDLE VOLGA (MI17. LOWER VOLGA (MI18. NORTHWESTERNURALS (SI19. SOUTHERN URALS (SI20. NORTHEASTERN URALS (S)21. WESTERN KAZAKHSTAN ~I22. KUSTANAY OBLAST (S)
23. TSELINOGRAD OBLAST (SI24. NORTHERN KAZAKHSTAN (S)25. PAVLODAR OBLAST (SI26. WESTERN SIBERIA (SI27. ALTAI KRAY ISI28. TRANS CAUCASUS (SI29. SOUTH KAZAKHSTAN (S)30. CENTRAL ASIA (SI31. NORTHWEST REGION (SI
W - WINTER WHEATS - SPRING WHEATM - MIXED SPRING AND WINTER WHEAT
Figure 13.- Percent deviation from normal in moisturesupply in soviet spring wheat regions.
10. NORTHEASTERN CAUCASUS (M)11. WESTERN BLACK SOIL (M)
12. EASTE RN BLACK SOl L (M)13. CENTRAL REGION (M)14. VOLGA VYATSK (M)15 UPPER VOLGA (M)16. MIDDLE VOLGA (M)17. LOWER VOLGA (M)18. NORTHWESTERN URALS (SI19. SOUTHERN URALS (S)20. NORTHEASTERN URALS (S)21. WESTERN KAZAKHSTAN (S)22. KUSTANAY OBLAST (S)
23. TSELINOGRAD OBLAST (S)24. NORTHERN KAZAKHSTAN (S)25. PAVLODAR OBLAST (S)26. WESTERN SIBERIA (S)27. ALTAI KRAY (SI28. TRANS CAUCASUS (S)29. SOUTH KAZAKHSTAN (SI30. CENTRAL ASIA (SI31. NORTHWEST REGION (S)
W - WINTER WHEATS - SPRING WHEATM - MIXED SPRING AND WINTER WHEAT
Figure 14.- Percent deviation from trend yields forecastby LACIE soviet spring wheat models.
28
~ Asea of stressed vegetation~ indicatlld by green index
10. NORTHEASTERN CAUCASUS (M)11. WESTERN BLACK SOIL (M)
12. EASTERN BLACK SOIL (M)13. CENTRAL REGION (M)14. VOLGA VYATSK (M)15. UPPER VOLGA (M)16. MIDDLE VOLGA (M)17. LOWER VOLGA (M)18. NORTHWESTERN URALS (SI19. SOUTHERN URALS (S)20. NORTHEASTERN URALS (S)21. WESTERN KAZAKHSTAN (S)22. KUSTANAY OBLAST (S)
23. TSELINOGRAD OBLAST (S)24. NORTHERN KAZAKHSTAN (S)25. PAVLODAR OBLAST (S)26. WESTERN SIBERIA (5)27. ALTAI KRAY (5)28. TRANS CAUCASUS (5)29. SOUTH KAZAKHSTAN (S)30. CENTRAL ASIA (S)31. NORTHWEST REGION (S)
W - WINTER WHEATS - SPRING WHEATM - MIXED SPRING AND WINTER WHEAT
Figure 15.- Landsat monitoring of drought - 1977 U.S.S.R.spring wheat.
29
Figure 16 illustrates the droughteffects visible on Landsat imageryof the affected area. The twosegment images on the right, col-lected on July 4, 1977, were from anormal moisture area (Omsk Oblastat the bottom). The effects ofmoisture stress are detectable by
the lack of darkness (redncss) inthe image, an indicator of cropcanopy condition. The image onthe left, collected in the previousyear for the Kokchetav segment, bycomparison shows a dramatic decreasein crop vigor in 1977.
Figure 1(,.- Landsat imagery from Omsk and Kokchctav,illustrating drought effects.
30
To quantitatively assess the impactof reduced spring wheat yield, thetotal wheat area growing in eachof these crop regions had to beestimated. The LACIE wheat areaestimates for each region weremultiplied by the forecast yieldper hectare to obtain productionestimates for each region. Whenthese individual production figureswere summed, the overall estimateof spring wheat production was36.3 MMT, a deviation of about20 percent below normal.
While the LACIE models respondedrealistically to the 1977 departurein the U.S.S.R. spring wheat yields,there is some evidence to suggestthat these models tend to under-estimate the yield. For the period
14
from 1955 to 1976, U.S.S.R.country-level spring wheat yielddata seem to have a moderatelystrong trend component, as shownby the linear best fit trend lineof figure 17. The LACIE U.S.S.R.yield models were developed at thecrop region level using 1973 data,the most recent available. Thesemodels show a trend to level offafter 1973 and as a result projecta trend value of 1.2 quintals perhectare below the linear trendprojection. Thus, it would appearthat if a larger trend value hadbeen used the LACIE final springwheat yield estimate would havebeen in closer agreement with theU.S.S.R. estimate. Note (figure 17)that the LACIE yield models didrespond to the adverse weather with
12 11.8 - TREND AS PROJECTED BYBEST LINEAR FIT
wa: 10.6 - TREND AS PROJECTED BY« LACIE MODELS~ 10(,)
SOVIET REPORTED YIELDwJ:....•..CI)
LACIE FINAL YIELD ESTIMATE...l«~ 8z50ci...lW 6:>:
T _1955 1960 1965
YEAR
1970 1975 1980
Figure 17.- Time series of historical Soviet spring wheat yieldsshowing trends as computed from best linear fit and asprojected by LACIE yield models.
31
forecasts 1.8 quintals per hectarebelow the LACIE trend projections.This response is due primarily toabove-average temperatures andbelow-average precipitation inApril and below-average availablesoil moisture in June. The above-average April temperature could nothave directly affected the mid-Mayplanted spring wheat crop; theyield forecast reduction due toApril temperature may be unwarrantedunless it can be explained as astatistical result of induced modelcorrelations between April tempera-ture and future seasonal conditionswhich reduce wheat yields (forexample, a warmer-than-average Mayand June with a correspondinglyshorter wheat development cycle).
U.S., U.S.S.R., AND CANADIANRESULTS - PHASE I THROUGHPHASE III
The performance of the LACIE yieldand acreage estimates has beenempirically estimated by a fairlylarge number of "performanceexperiments." The LACIE, Landsat-derived, acreage estimates havebeen evaluated through comparisonswith independent ground truth andUSDA estimates for the U.S., andforeign country estimates and USDAestimates in Canada and the U.S.S.R.From such experiments, it is knownwhere the technology tends to workand where it needs specific improve-ment. The LACIE yield models,whose performance is much moresensitive to weather than is theacreage technology, have beenevaluated over the same regionsdescribed above and, in addition,over 10 years of historic data.While these years and regions arequite different from each other andrepresent a reasonable sample ofpotential conditions to be encoun-tered in a global survey, empirical
32
estimates of the various performancequantities can be viewed withincreasing confidence with addi-tional replications over a numberof years. In discussions of theLACIE results which follow, s~ate-ments are made that in some casesthe LACIE technology supported90/90 and in some cases it did not.These statements represent infer-ences drawn from the performanceexperiments described above. Aquite legitimate question is, howmuch confidence can be placed inthese statements? LACIE has takena standard, statistical approach toexamining the experimental data.Using this approach, availableexperimental data have not contra-dicted the 90/90 hypothesis exceptfor the cases noted. An examinationof the experimental data does notcontradict the 90/90 for U.s. winterand U.S.S.R. total wheat. While alack of contradiction of thishypothesis implies that the LACIEtechnology may be satisfying 90/90in a region, increased confidencecan only be gained through addi-tional replications over a nwnberof years.
PHASE III U.S. RESULTS
In addition to the Phase III Sovietperformance, phase III results inthe U.S. further substantiated theconclusion that the technical modi-fications incorporated into theexperiment during Phase II workedexceedingly well. Overall, thePhase III U.S. results (figure 18)showed significant improvement overthose of Phase II. The LACIE winterwheat estimates in the U.S. andU.S.S.R., as in Phase II, wereindicative of 90/90 accuracies, aswas the Soviet spring wheat esti-mate. Additionally, there was asignificant Phase III improvementin the ability to estimate spring
AREA
io
!i
6050_0 S09 496
492 496 491 493 49S 4940
10•••.•.•. ESCS_lAClf
Vlrl D
',0
area, yield, and production esti-mates for the U.S. nine-state regionare shown in figure 18. The finalyield estimate was prepared inSeptember; however, the derivedvalue changed slightly as laterLandsat data were used to refine areaestimates at the yield strata level.
Figure 18.- Phase III, U.S. nine-state region estimates.
t02!'[C }J3JAENIE"!" I!M~A~R[ •••~R I!M~A:!:Y[JU~NrrJU~lmAm:UG!DJs~,,:::I]DC[TmN2ovmOm<cLACIE - ,.I-tnM report'"'9-nate toUlCokM'8do, K.ua, NeW"', Oklehoml, T.xas, Monuna,MinMlOu, North 0,,",,01', and South D*ou
40
20
2000
IIf>QO
'0
! 1000
i
~.~~~~!.t..?~.~ ~!.;~ E;~.1$4 249 2._9
••· .... ··ESCS__ lACIE
DEC I JAPIl HB MAR APR MAv I JUN JUl AU\' SfP OCT I NQV DEC
PRQQUCTIOPll
H.~~..t~!.~I.~~~ 1.~.~~ !~~.~.
1270 1269 1223 12'21 1232
••••••••• ESCS--LACIE
More extensive evaluations of theU.S. yield models over a 10-yearperiod indicated a performanceconsistent with 90/90 except foryears with extreme agricultural ormeteorological conditions. Table 5lists the results of a test of thePhase III yield models with his-toric data for the years 1967 to1976. The models were developedwith data for the 45 years priorto each of the test years. A non-parametric statistical test employedto analyze these data did not rejectthe 90/90 hypothesis; however, hadthe models exceeded the tolerancebounds in at least one more year asit appears to have done in 1977,
wheat area which reduced the dif-ference between the LACIE andEconomics, Statistics, and Cooper-ative Service (ESCS) estimates ofwheat area to less than 1 percentin comparison to a Phase II dif-ference of -13 percent. In contrastto the LACIE Phase I and II results,the LACIE Phase III estimates ofyield were significantly under thoseof the ESCS and were not supportiveof the 90/90 criterion. However,the yield estimates combined withthe improved Phase III areaestimates resulted in productionestimates which differed from ESCSby less than 10 percent. Statis-tical tests indicated that thePhase III U.S. production estimatescould be of 90/90 accuracy. Thus,the Phase III U.S. results werejudged to be marginally supportiveof 90/90 performance. The Phase III
33
TABLE 5.- RESULTS OF AN EVALUATION OFTHE LACIE PHASE III U.S. YIELD
Mean error = -0.1 bu/acreRMSE 1.90 bu/acreAccept 90/90
aFor comparison only, LACIE 1977 estimates.
the 90/90 hypothesis could havebeen rejected. Additionally, theroot-mean-square error (RMSE) of1.9 bushels per acre is larger thandesirable for a 90/90 estimator.It should be noted that 1974 was avery dry year in the USGP, andwheat yields were very poor. TheLACIE yield models failed to respondto this deviation and overestimatedthe yield by 4.6 bushels per acre.Without 1974, the RSME would dropfrom 1.9 bushels per acre to 1.3bushels per acre, which is notsignificantly different than thatrequired for a 90/90 estimator. Itthus appears that the yield modelsmay satisfy the 90/90 criterion inyears without extreme departuresin yield. As reported earlier, theLACIE yield models were responsiveto the departure in the 1977 Sovietspring wheat crop, which was notextreme but of great economicimportance to the U.S. and othercountries.
accurate estimates with signifi-cantly reduced data loads.
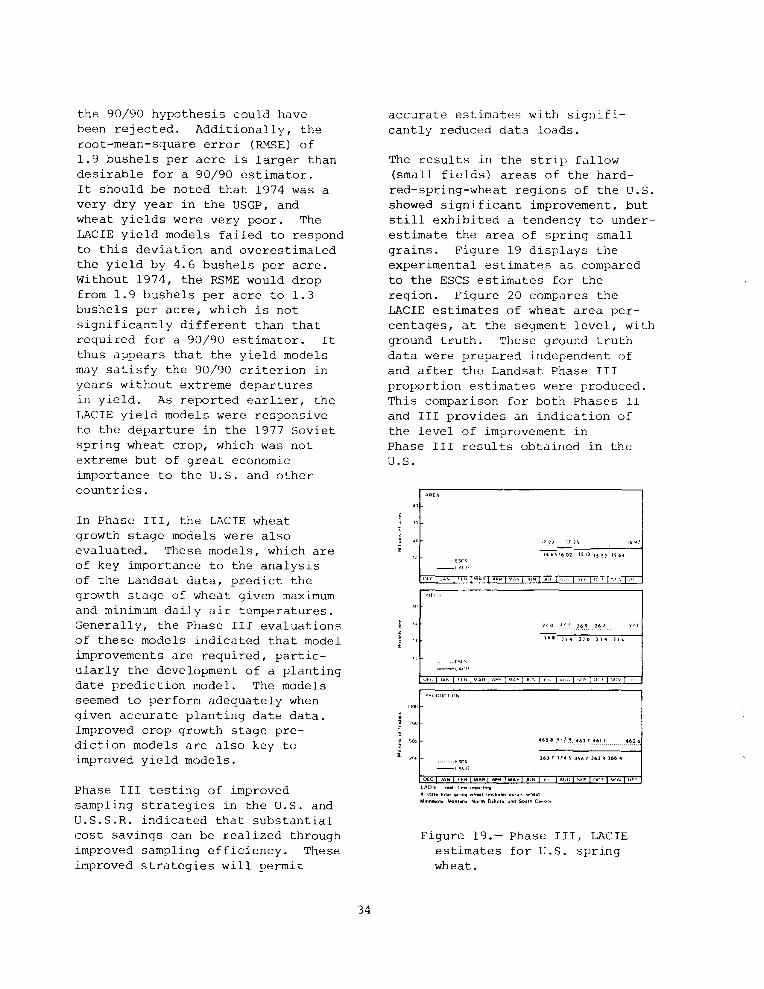
The results in the strip fallow(small fields) areas of the hard-
red-spring-wheat regions of the U.S.showed significant improvement, butstill exhibited a tendency to under-estimate the area of spring smallgrains. Figure 19 displays theexperimental estimates as comparedto the ESCS estimates for theregion. Figure 20 compares theLACIE estimates of wheat area per-centages, at the segment level, withground truth. These ground truthdata were prepared independent ofand after the Landsat Phase IIIproportion estimates were produced.This comparison for both Phases IIand III provides an indication ofthe level of improvement inPhase III results obtained in theU.S.
In Phase III, the LACIE wheatgrowth stage models were alsoevaluated. These models, which areof key importance to the analysisof the Landsat data, predict thegrowth stage of wheat given maximumand minimum daily air temperatures.Generally, the Phase III evaluationsof these models indicated that modelimprovements are required, partic-ularly the development of a plantingdate prediction model. The modelsseemed to perform adequately whengiven accurate planting date data.Improved crop growth stage pre-diction models are also key toimproved yield models.
Phase III testing of improvedsampling strategies in the u.S. andU.S.S.R. indicated that substantialcost savings can be realized throughimproved sampling efficiency. Theseimproved strategies will permit
Figure 20.- Comparison of LACIE segments estimates and groundobserved estimates of wheat area proportions - U.S.yardstick test sites.
The actual analyst contact timerequired to analyze a Landsatsegment, manually select trainingfields, compute training statis-tics, and computer process thenearly 23,000 elements of a LACIEsegment was reduced from 10 to 12hours in Phase I to 6 to 8 hoursin Phase II and to 2 to 4 hours inPhase III. It was also concludedthat the LACIE experiment demon-strated that the timeliness goal of14 days could be realized in afuture operational system.
The dispersed nature of the LACIEdata processing system has led tolong "in-work" times (from 30 to50 days) for segments of Landsatdata due to many manual steps in thelogistics and the fact that theexperiment has been run, for themost part, on a one-shift, 5-day-a-week basis. However, the actual
35
time during which a segment isundergoing active processing iswithin the revised goal of 14 daysfrom acquisition to availabilityfor aggregation, distributed asfollows:• Data acquisition, transmittal to
• JSC LACIE data base update,segment film image production,analysis packet preparation,review, and assignment to analystrequired 2-1/3 days.
• study of analysis packet data,labeling, batch processing,analyst evaluation of results,quality check, and release forproduction aggregation required3 days.
LACIE has provided the experiencewhich would allow design of asystem utilizing LACIE technologyto support a sample segment turn-around time of 14 days.
Considering that the actual analyst"contact time" is 2 to 4 hours persegment, that the computer process-ing time expended is around 5 to8 minutes per segment, and that theLACIE data processing system is, ashas been noted, an assembly ofcomponents originally designed forother purposes, a production systemcan almost certainly be engineeredthat would require a substantiallyshorter time than 14 days from dataacquisition through segmentanalysis.
PHASE II RESULTS IN U.S.,U.S.S.R., AND CANADA
While the 1977 Phase III results arevery encouraging, they are by nomeans the complete story. Resultsin the U.S. during the 3 yearsof LACIE, and in the Soviet Unionin Phase II, also substantiate thePhase III Soviet results. Resultsfor the U.S. and Canadian springwheat have also defined crop regionsfor which the remote sensing tech-nology needs improvement.
An evaluation of Phase II resultsindicated that the productionestimation approach worked wellfor winter wheat in the U.S. andfor both winter and spring wheat inthe U.S.S.R. Difficulty was en-countered in the U.S. and Canadianspring wheat regions in reliablydifferentiating spring wheat fromother spring small grains, primarilyspring barley. An additionalcomplicating factor in these sameregions was the strip fallow fieldswith widths very close to currentLandsat resolution limits.
36
Figure 21 shows typical field sizesin the northern U.S., the U.S.S.R.,and China, illustrating how fieldsize and shape are problems in someareas. On the left portion offigure 21 is an aerial photographand segment of the strip/fallowregion of the U.S. Note theprevalence of very long and narrowfields - a result of moisture-conserving strip/fallow practices.Similar practices are also commonin Canadian spring wheat areas.
These factors led to a significantPhase II underestimate of the U.S.and Canada spring wheat areas of 29and 26 percent, respectively. Inthe U.S.S.R. spring wheat regions,where field sizes arc considerablylarger and the ratios of springwheat to spring small grains aremore stable than in the U.S. andCanadian regions, the Phase IISoviet wheat area estimates were inreasonable agreement with "ballpark" estimates based on officialSoviet statistics. Availableindications of 1977 implied thatthe LACIE at-harvest estimates ofSoviet production did not differsignificantly from the Sovietfigures and other indications suchas estimates of the coefficient ofvariation of the LACIE estimatesalso indicated the LACIE estimateswere of 90/90 quality. Again, addi-tional replications are required toverify the 90/90 hypothesis. Thefinal at-harvest LACIE estimate wasto within 1 percent of the Sovietfigure. Most encouraging was theaccuracy of the estimates made earlyin the growing season. In both theu.S. winter wheat and the U.S.S.R.winter and spring wheat, the resultsindicated that similar accuracieswere achieved with Landsat andweather data acquired 1-1/2 monthsprior to harvest.
Figure 21.- Landsat segment images in the U.S., U.S.S.R., andChina illustrating strip fields, large fields, and smallfields.
Near the end of Phase II, it wasdecided that the evaluation in theU.S. yardstick region would berepeated and the region to beinventoried in the U.S.S.R. wouldbe expanded to include the regionproducing more than 90 percent ofthe U.S.S.R. total wheat production.The decision to expand the regionto be inventoried in the U.S.S.R.was prompted by the lack of trueproduction information for thePhase II U.S.S.R. indicator regionsand thus the unavailability of areliable estimate of the bias of theLACIE estimates for the U.S.S.R.
37
Also, the coverage in Canada wouldbe reduced to 30 segments, whereCanadian investigators could collectground truth to be used in anintensified evaluation of the smallfields and small grains confusionproblems. As noted earlier, changesmade prior to the 1976-1977 cropyear (Phase III of LACIE) werethought to comprise significantimprovements. These improvementsincluded an improved stratificationof the region and relocation ofselected samples using past Landsatimagery and development of Landsatanalysis procedures to differentiate
spring wheat from spring barley. Inorder to extend the life of the on-board Landsat 2 tape recorder, adecision was made not to acquiredata over the Southern Hemisphereregions and to concentrate Phase IIIinvestigations in the U.S., Canada,and the U.S.S.R.
FOREIGN EXPLORATORYINVESTIGATIONS
Exploratory investigations inArgentina, Australia, Brazil, India,and People's Republic of China con-ducted throughout LACIE providedinitial insight into the technicalissues associated with othercountries. These investigationsincluded yield model development,analysis of exploratory samplesegments, and collection of Landsat,meteorological, and agronomic data.Aggregated estimates of area, yield,and production were not attempted.• Australia - Landsat data collected
over Australia indicates fieldsizes and multitemporal signaturessimilar to those of the USGP andthe U.S.S.R. Yield models havebeen developed for five states inAustralia. A test of these modelson 10 years of independent testdata indicates they will supportthe 90/90 criterion. Crop growthstage prediction models developedin the U.S. have been implementedin Australia, but difficultieshave been encountered in theiruse because of varietal dif-ferences from the U.S., the modelwas designed for winter wheatwith a dormancy period, but theAustralian wheat does not gointo dormancy.
• India - The average field inIndia is smaller than the currentLandsat resolution element,however, fields tend to beadjacent and may be less of a
38
problem than those associated withsmall strip fields in the U.S. andCanada. In India, yield modelshave been developed for 15 statesand exploratory segments analyzed.Although not evaluated opera-tionally, two of the modelstested on independent historicdata indicate they will supportthe 90/90 criterion. Crop growthstage models were evaluated inIndia and showed very poorresults, this can again be largelyattributed to differences in U.S.and Indian wheat. Indian wheatdoes not go into dormancy and hasa shorter growth cycle.
• Argentina and Brazil - Analysis ofthe Landsat data indicates thatArgentina field sizes in theolder, more populated areas ofArgentina are similar to those inKansas, and field sizes in lesspopulated frontier areas aresimilar to those in the U.S.S.R.In both of these countries, ancil-lary data are extremely limited andthus affects both interpretiveanalysis and yield models. Yieldregression models have beendeveloped for five provinces inArgentina and one state in Brazil;however, the quality of data forbuilding these foreign models islower than for equivalent U.S.areas. Tests of the Argentina andBrazilian yield models over10 years of independent test dataindicate that the models forthese countries will not supportthe 90/90 criterion. In general,crop signatures were typical ofthose encountered in the U.s.Based on limited experience,Landsat acquisition over theBrazilian wheat-growing regionsindicate more frequent cloud coverthan was experienced in the U.S.
• China - China, like India, hasextremely small fields in the more
densely populated areas, but inthe newly developed spring wheatregion, field sizes are comparableto those in the U.S. Historicaldata have not been found uponwhich to develop the ancillarydata equivalent to othercountries. This deficiency couldresult in a lower confidence levelin the results of China segmentanalysis than for the U.S., dueto lack of adequate crop growthstage and confusion cropinformation.
within the LACIE, several signifi-cant technological achievementswere realized, some of whichresulted in significant improvementsin area, yield, and productionestimation. Others were evaluatedin parallel to the main efforts inthe experiment and representpotential future improvements. Themajor achievements are:• Improved computer-aided Landsat
data processing procedures• Development of regression models
for estimating wheat yield• Development of growth stage models
for wheat• Improved sampling efficiency
through stratification based onLandsat data
• Development of improved statis-tical methods for accuracyassessment
LACIE has also crystallized andprioritized problems that continueto exist in the technology andshortcomings in an understanding ofcertain aspects of underlyingphenomena. Problems in need of
39
special attention in the futureinclude the following:• Yield models based on daily or
weekly, rather than monthly,averages of temperature andprecipitation that more closelysimulate critical biologicalfunctions of the plant and theirinteractions with the externalenvironment, and thus haveresponse characteristics withmore fidelity to a wider range ofconditions.
• Analysis techniques to deal moreeffectively with the spatialinformation in Landsat data andto improve area estimationaccuracies in regions having ahigh percentage of fields withsizes near the resolution limitof Landsat. Additionally, theanticipated improvements in areaestimation as a result of theincreased resolution of Landsat-Dmust be investigated, as well asspatial resolution requirementsfor future Landsat satellites.
• The possible need for Landsatcoverage at intervals morefrequent than 18 days and theaddition of spectral channels tomore reliably identify vegetationstress and to more reliablydifferentiate crops of interestfrom confusion vegetation. Also,the additional spectral channelsof Landsat-D must be evaluated,along with definition of recom-mended spectral channels forfuture Landsat satellites.
• Crops in tropical regions withtheir distinctly differentcharacteristics. Crop varietiesand the remote sensing conditionstend to be significantly differentin a region such as India.
• The effects of cloud cover as itprevents the acquisition ofusable Landsat data at critical
periods in the crop season needto be better quantified, partic-ularly in more humid environmentssuch as the u.s. Corn Belt .
• The trade-offs between the needto shorten the time between dataacquisition, analysis, andreporting and the costs ofobtaining such shortened response.
40
While considerable improvementscan be made, considerable costsmay be required to obtain them.
• Effective transfer of technologyto significantly complement capa-bilities of existing systems isdeserving of further attention.This must be important to tech-nology developers and users alike.
USDA USER SYSTEM
A decision was made by the USDAearly in 1976 to initiate anadditional activity to develop adata analysis system to transferand exploit the emerging LACIE tech-nology for USDA use. This prototypewas approved in January 1976 toserve as the vehicle for thetransfer of technology from appliedresearch to an application testwithin USDA.
The initial goal of this activity wasto develop the basic analytical capa-bilities, hardware, and software tosupport the testing and evaluationfor USDA use of the technology devel-oped during LACIE. Toward the end ofLACIE, the effort was realigned inresponse to changing Departmentalpriorities to concentrate on utiliz-ing the capabilities of the technol-ogy for early warning and changedetection, and to consider the
41
potential for application to othercrops. The current objectives are:• To have a USDA facility (equip-
ment, personnel, procedures)capable of performance testing andevaluating remote sensing tech-nology against USDA requirements.
• To develop, test, and implement adata management system for agri-cultural analyses which includegeographically oriented data(soils, climate, agriculturalstatistics, etc.) of a scopenecessary to support a test ofearly warning techniques andregional crop condition assess-ment capabilities.
The USDA-led effort within the LACIEinvolved the active participation byNASA and NOAA in providing assist-ance in the transfer of technologyfrom LACIE to the USDA user system.
CONCLUSIONS
The many results and achievementsfrom the 3 years of LACIE experi-mentation can be usefully summarizedin the context of the originallystated experiment objectives as setforth in reference 1.
"Demonstrate an economicallyimportant application of repetitivemultispectral remote sensing fromspace." The results of LACIE haveconfirmed the utility of remotesensing technology, in its currentstate, to provide improved commodityproduction forecast information.Repetitive multispectral remotesensing data played a vital role inidentification, mensuration, andcondition assessment of the wheatcrop. The periodic spectral datafrom Landsat permitted the identi-fication and mensuration of thegrowing wheat crop, without the useof ground-observed crop identitydata. This latter capability iskey to crop forecasts in inaccessi-ble foreign regions. The peri-odically acquired Landsat data wasalso successfully used to monitorthe condition of the wheat canopy,which provided important corrob-orative data for confirming fore-casts from the agrometeorologicalyield models. Experiment resultsdefined a need for a periodicityeven more frequent than the 18 daysprovided by Landsat in order todistinguish between crops withgrowth cycle differences of lessthan 14 days and to reduce theimpact of data loss to cloud cover.
"Test the capability of the Landsat,together with climatological,meteorological and conventionaldata sources, to estimate theproduction of an important worldcrop." Wheat, the most important
43
internationally traded crop, wasselected as the test crop in LACIEnot only because of its economicimportance, but also because it isgrown around the globe under a widerange of conditions. Therefore,the LACIE achievements provide astepping stone from which to adaptremote sensing technology to othercrops.
LACIE developed, engineered, anddemonstrated solutions to the majorproblems associated with theacquisition and analysis of theLandsat, climatological, meteoro-logical, and conventional datarequired for a global cropinventory. Landsat images from theLACIE test countries were success-fully used to locate and delineatewheat-growing regions in eachcountry. These regions were furtherstratified into uniform subregionsusing information derived from ananalysis of the Landsat images.This stratification permitted thedevelopment of an efficient sampledesign and reduced the potentiallyimmense data volume to a manageableload: for example, only 2 percentof the Landsat data was required toachieve accurate estimates of croparea within the survey region.Interactive computer procedures weredeveloped for rapid and reliable
"analysis of the Landsat data todetermine crop acreage and condi-tion. Yield models were developedand successfully applied. Thesemodels use only those climatologi-cal, meteorological data availableon a routine basis from the impor-tant global agricultural regions.
"Commencing in 1975, validate tech-nology which can provide timelyestimates of crop production." The
LACIE results in the second year ofthe experiment for the u.s. hard-red-winter-wheat region wereindicative of 90/90 accuracies inthis region as early as 1-1/2 monthspreharvest. Experiment results inthe u.s. and Canadian spring wheatregions indicated that technologyimprovements available on Landsat-Dwere needed to estimate acreage inregions where typical field sizeswere close to the Landsat resolutionlimits. Additionally, the need toimprove the reliability of discrim-inating between spring wheat andits look-alike, spring barley, wasdemonstrated. The LACIE forecastaccuracies for the Soviet indicatorregions in 1976 indicated thataccuracies achieved 1 month priorto harvest and at harvest for bothwinter and spring wheat weresupportive of the 90/90 criterion.The precision of the LACIE forecastswas adequate to support the 90/90criterion, and the at-harvest LACIEestimate was to within 1 percent ofthe Soviet estimate.
In the third year, U.S. results weresignificantly improved as a resultof prior year modifications in theacreage estimation technology. TheUSGP production forecasts were towithin 10 percent of the ESCS.Indications were that 90/90 esti-mates could be achieved for yearsin which crop conditions are notextreme in comparison to years onwhich the yield models weredeveloped. The U.S.S.R. forecastscorrectly predicted a spring wheatshortfall in August 1977 well beforethe November 1977 announcement of ashortfall in total grain and aFebruary 1978 Soviet confirmationof a shortfall in the Soviet springwheat crop. Additionally, LACIEmet or exceeded its performancegoal in the U.S.S.R. winter wheatarea in 1977, correctly predicting
44
a winter wheat bumper crop severalmonths preharvest.
Exploratory investigations con-ducted in Australia, Argentina,Brazil, India, and the People'sRepublic of China provided valuableinsight as to the similarities anddifferences among those regions andthe areas studied more intensely inCanada, the U.S., and the U.S.S.R.These investigations indicate thatLACIE acreage estimation technologywill be applicable to Australia,Argentina, and Brazil, but mayrequire improvements in the small-field regions within India andChina. Yield model tests in thesecountries indicate that models lessdependent on historic data may berequired for China, Argentina, andBrazil.
"Provide from an analysis of Landsatdata acquired over a sample of thepotential crop-producing area inmajor wheat-growing regions,estimates of the area planted towheat; similarly, from an analysisof historical and real-time mete-orological data over the sameregions, provide estimates of wheatyield and combine these area andyield factors to estimateproduction." A data acquisition,storage, and analysis system,incorporating the state-of-the-artremote-sensing technology, wasassembled and successfully operatedin the U.S., Canada, and theU.S.S.R. Reports of acreage, yield,and production were producedaccording to a fixed reportingschedule. A large data base ofLandsat, climatological, agronomic,and field research data wasassembled for future technologydevelopment and assessment. Thisdata base includes data from theU.S., Canada, U.S.S.R., Australia,India, Brazil, Argentina, and China.
"Provide data processing anddelivery techniques so that selectedsamples can be made available to theLACIE analyst teams for initiationof analysis no later than 14 daysafter acquisition of the data." Theanalyst contact time required toanalyze Landsat data, acquired atmultiple dates over a 5- by 6-nautical-mile agricultural site(approximately 23,000 acres), wasreduced from 10 to 12 hours in thefirst year of LACIE to 2 to 4 hoursby the end of the experiment. TheLACIE results further indicated thatLandsat data could be acquired andanalyzed within a 14-day period inan operational system.
"Provide a LACIE system design thatwill permit a minimum of redesignand conversion to implement anoperational system within the USDA."The USDA designed and is in theprocess of completing the implemen-tation of an application test systemfor further evaluation of the LACIEtechnology. All elements of theLACIE technology have been trans-ferred to the USDA system. As aresult of a realignment in Departmentpriorities toward the end of LACIE,this technology is currently beingutilized for crop condition assess-ment as opposed to the commodityproduction forecasting applicationevaluated in LACIE.
"Monitor and assess crop progress(calendar) from a surface data baseand evaluate the model potential foryield from surface data." Yieldforecasting techniques as well asmodels estimating crop phenologicalstage were developed, exercised, andevaluated over the U.S., U.S.S.R.,Canada, and five other foreign ex-ploratory regions. The growth stagemodels are of key importance to theanalysis of Landsat data and willalso play an important role in
45
advanced yield models. Phase IIIevaluations of these models indi-cated that improvements arerequired, particularly the develop-ment of a planting date predictionmodel. Extensive evaluations of thevarious yield models using 10 yearsof historic data indicated that themodels worked well in forecastingyield near harvest. Exceptions wereyears where deviations in weatherwere extreme or regions where rapidchanges in technology were notdetected by the crude trend analysismethods used in the modeling effort.
"Conduct a supporting research anddevelopment program to improvemethodology and performance." Atthe outset of LACIE, needs for tech-nology improvements were recognizedand a research and developmentprogram involving the university andindustrial research communities wasorganized. This effort has success-fully contributed new technologydevelopments in the following majorareas:• Improved machine processing
procedures for Landsat dataanalyses that reduced analystcontact time by a factor of 3during LACIE and permitted thefirst capability to reliablyprocess multiple Landsat acqui-sitions acquired at several dates(multitemporal data) .
• Improved sampling strategies thatutilize Landsat imagery, agricul-tural, and climatological data tostratify the survey region intohomogenous subregions to reducesampling variance and increaseefficiency. The improved samplestrategy for the U.S.S.R. permitsa reduction in the data processingload by 20 percent through in-creased sampling efficiency.
• Development of "signature exten-sion" methodology that will
potentially result in furthersignificant reductions in Landsatdata analyses costs. The "signa-ture extension" methodology willpermit the definition of "signa-ture strata" and a technique forefficient sampling of the signa-ture "population" for manualidentification. Using thesetechniques, manual identificationof the crop signatures can berapidly and inexpensively extendedthrough computer analyses toidentify and measure the crops ofinterest.
• Development of potentiallyimproved yield models that requireless historic data and thus mayshow improved performance inforeign regions with little or noreliable historic data, such asChina, Brazil, and Argentina.
• Development of improved cropdevelopment stage predictionmodels is necessary to both
46
Landsat data analyses and yieldmodel improvement. The con-struction of a comprehensiveresearch data base from an ongoingfield measurements program wasaccomplished.
"Establish an objective test andevaluation program to quantify theresults from the research anddevelopment activities." A testand evaluation effort was designedand successfully conducted through-out the three phases of LACIE.This effort was extremely impor-tant in that it permitted a rela-tively inexpensive and informedselection of a particular tech-nology configuration from amongmany alternatives prior to evalu-ation on a global scale. The testand evaluation effort was successfulin evaluating all major componentsof the technology produced by theresearch and development program.
OUTLOOK
As a result of (1) the continuedinterest of the USDA in exploitingthis technology to provide improvedworld crop production information,(2) the success that has beenachieved thus far with wheat, and(3) the understanding of technicalissues identified in LACIE as re-quiring further investigation, theSecretary of Agriculture announcedthe need for a new initiative. TheSecretary's initiative is for ajoint multiagency program to developimproved uses of aerospace tech-nology for agricultural purposes.The focus for the program is pro-vided by the following broad infor-mation requirements in priorityorder:
1. Early warning of changesaffecting production and qualityof renewable resources
2. Commodity production forecasts
47
3. Land use classification andmeasurement
4. Renewable resources inventoryand assessment
5. Land productivity estimates6. Conversion practices assessment7. Pollution detection and impact
evaluation
While all seven requirements are ofmajor importance to the USDA, thefirst two requirements essentiallycapture the Department's most urgentneed for better, more timely,objective information on world cropconditions and expected production.The agencies that participated inLACIE are planning a follow-onactivity for the early 1980's thatwill build on the LACIE experienceand address the broader needs ofthe USDA.
REFERENCES1. LACIE Project Plan - Baseline i
Document, LACIE-C00605, JSC-09857,Houston, Texas, Aug. 1975.
2. U.S.S.R. Agricultural Situation,Review of 1977 and Outlook for1978, USDA/ESCS, April 1978.
3. USDA/Economic Research Service:Wheat Situation. WS-239, Feb.1977.
4. Foreign Agricultural Service:Second Forecast of 1977 SovietGrain Crop. FG 10-77, July 1977.'
5. Foreign Agricultural Service:Third Forecast of the 1977 SovietGrain Crop. FG 12-77, Aug. 1977.
Document of Plenary Papers, LACIESymposium, Houston, Oct. 1978.
LACIE Phase I Evaluation Report,LACIE-00418, JSC-11663, Houston,May 1976.
LACIE Phase II Evaluation Report,LACIE-00453, JSC-11694, Houston,July 1977.
LACIE Management Plan - BaselineDocument, LACIE-C00617, JSC-11334,Houston, Sept. 1976.
MacDonald, R. B.; Hall, F. G.;and Erb, R. B.: The Use of LandsatData in a Large Area Crop Inven-tory Experiment (LACIE) in Proceed-ings of Second Symposium on MachineProcessing of Remotely Sensed Data,C. D. McGillem, Ed., Institute ofElectrical and Electronics Engi-neers, Inc., New York, 1975, pp.IB-l - IB-23.
MacDonald, R. B.; Hall, F. G.; andErb, R. B.: LACIE: An AssessmentAfter One Year of Operation, ERIMSymposium, Ann Arbor, 1976.
MacDonald, R. B.; and Hall, F. G.:LACIE: A Proof of Concept Experi-ment in Global Crop Monitoring,Midcon/77 Electronic Show andConvention, Chicago, 1977.
51
MacDonald, R. B.; and Hall, F. G.:LACIE: Experiment in Global CropForecasting, Plenary Proceedingsof the LACIE Symposium, 1978.
Memorandum of Understanding Amongthe U.S. Department of Agriculture,The National Aeronautics and SpaceAdministration and the NationalOceanic and Atmospheric Adminis-tration for the Experimental LargeScale Crop Inventory Demonstration,LACIE files, Washington, D.C.,Oct. 10, 1974.
Proceedings of the 1974 LyndonB. Johnson Space Center Wheat-Yield Conference, LACIE-T00407,Houston, April 1975.
Proceedings of the LACIE Symposium,Houston, Oct. 1978.
World Food and Nutrition Study:The Potential Contributions of Re-search Steering Committee NRD Studyon World Food and Nutrition of theCommission on International Rela-tions, National Research CouncilNational Academy of Sciences,Washington, D.C., 1977.