43
OCTOBER 2017 Program of Accompanying Research for Agricultural Innovation ƌeseaƌĐhϰagƌiŶŶoǀa�oŶ.oƌg Innovation for Sustainable Agricultural Growth in Togo
| Date post: | 10-Sep-2018 |
| Category: |
Documents |
| Upload: | nguyenkhue |
| View: | 214 times |
| Download: | 0 times |

OCTOBER 2017Program of Accompanying
Research for Agricultural Innovation esea h ag i o a� o .o g
Innovation for
Sustainable Agricultural Growth
in Togo

ACKNOWLEDGEMENTS
The pape as de eloped ithi the p oje t P og a of A o pa yi g Resea h fo Ag i ultu al I o a� o PARI , hi h is fu ded y the Ge a Fede al Mi ist y of E o o i Coope a� o a d De elop e t BM) .
COORDINATION:
This epo t as oo di ated y D . Oli e K. Ki ui )EF a d D . Fatu i Olu ole A iodu FARA .
CONTRIBUTORS TO THE COUNTRY DOSSIER TOGO
ITRA: Alpha Todje, G ake ou Koffi I yese
FARA: Ye i Aki a ijo, Fatu i Olu ole A iodu
)EF: Heike Bau ülle , Joa hi o B au , A apia De a y, Tiga u Degu Getahu , Ch is� e Hus a , Oli e K. Ki ui, Ehsa Eyshi Rezaei, Leo ie Rou� l, “oug y o a )ai atou “o e, Jus� e Akpe e Ta o, Detlef Vi ho , Do is Wies a
This epo t is o k i p og ess a d o � uously ei g updated. A y feed a k a d sugges� o s fo fu the i p o e e t a e el o e a d a e se t to pa i@u i- o .de.
SUGGESTED CITATION
)EF, FARA, ITRA . Country Dossier: Inno ai on for Sustaina le Agri ultural Gro th in Togo. P og a of A o pa yi g Resea h fo Ag i ultu al I o a� o . Bo , A a a d Lo é: Ce te fo De elop e t Resea h, Fo u fo Ag i ultu al Resea h i Af i a a d I s� tut Togolaise de Re he he Ag o o i ue.
Layout & Edi� g: E ely Ba aké, “e as� a E ke t, Katha i a Galla t, Ha ah Jae i ke, Yesi Pa al, Katha i a )i

About this study
In 12 African countries and India Green Innovation Centers (GICs) have been established under the O e Wo ld, No Hu ge I itiati e “EWOH of the Ge a go e e t a d othe i esto s. The ai
of the GICs is to promote agricultural innovation, improve food and nutrition security and build sustainable value chains in the agri-food sector of these countries. The Program of Accompanying Research for Agricultural Innovation (PARI) has been providing independent research to the SEWOH since 2015. PARI is led by the Center for Development Research (ZEF) at the University of Bonn in close collaboration with the Forum for Agricultural Research in Africa (FARA) and its network of national and regional partners in Africa, the African Growth and Development Policy Modeling Consortium (AGRODEP) facilitated by the International Food Policy Research Institute (IFPRI, Africa Office) and other partners in Germany and India. This country dossier offers a situation analysis of the current state of the agri-food sector, related policies and existing agricultural innovations. It thereby provides
asi a kg ou d k o ledge e essa to ake f uitful i est e ts i li e ith the ou t s poli ies and its potentials, and to find promising partners for development cooperation.

Program of Accompanying Research for Agricultural Innovation (PARI)
2
Table of Contents
1 General background information on the agricultural and food sectors .................................... 5 1.1 Pan-African policies and strategies .......................................................................................... 6 1.2 National (and regional) policies and strategies........................................................................ 6
1.2.1 Togo s ag i ultu al de elop e t pla .............................................................................. 6 1.2.2 Strategy for Accelerated Growth and Employment Promotion (SCAPE) ......................... 7 1.2.3 National Agricultural Investment and Food Security Program (PNIASA) ......................... 8
1.3 Data on food and nutrition security in Togo and GIC region ................................................. 10 1.3.1 Socio-economic and agricultural data ............................................................................ 10 1.3.2 Consumption and nutrition status .................................................................................. 10
1.4 Data on most relevant crops and value chains ...................................................................... 17 1.4.1 Production ...................................................................................................................... 17 1.4.2 Trade ............................................................................................................................... 18
1.5 National (and regional) innovation system ............................................................................ 19 1.5.1 Research system and organizations ............................................................................... 19 1.5.2 Innovation platforms ...................................................................................................... 20 1.5.3 Extension system and organizations .............................................................................. 21 1.5.4 Private Research and Development activities ................................................................ 22
1.6 Key challenges, emerging needs and potentials in the agricultural sector ........................... 22 1.7 Potential areas for investment in Togo .................................................................................. 22
2 Most relevant value chains in the country ........................................................................... 25 2.1 GIC value chains ..................................................................................................................... 25
2.1.1 Groundnut ...................................................................................................................... 25 2.1.2 Cashew ............................................................................................................................ 25 2.1.3 Soybean .......................................................................................................................... 25
2.2 Other relevant value chains ................................................................................................... 26 2.2.1 Cassava ........................................................................................................................... 26 2.2.2 Yam ................................................................................................................................. 26 2.2.3 Maize .............................................................................................................................. 26 2.2.4 Sorghum/Millet ............................................................................................................... 27 2.2.5 Coffee/Cocoa .................................................................................................................. 27 2.2.6 Cotton ............................................................................................................................. 27
2.3 Promising agricultural products and value chains ................................................................. 27 2.4 Summary on the selection of agricultural products and value chains ................................... 29
3 Innovations in value chains in the past 20 years ................................................................... 30 3.1 Main limiting factors .............................................................................................................. 30 3.2 Important value-chain related and cross-cutting innovations............................................... 30
3.2.1 GIC value chains .............................................................................................................. 31 3.2.2 Other value chains and cross-cutting innovations ......................................................... 31
4 Suggestions for collaboration .............................................................................................. 32
References ................................................................................................................................. 34
Annex A: Background Information on Nutrition ........................................................................... 37

Country Dossier Togo
3
List of Tables
Table 1: Selected national economic and health-related data ............................................................. 10 Table 2: Food and nutrition security indicators .................................................................................... 11 Table 3: Child feeding practices by region, 2013-14 ............................................................................. 15 Table 4: Child nutrition status by region, 2013-14 ................................................................................ 15 Table : Wo e s ut itio status egio , -14 ......................................................................... 16 Table 6: Top 10 crops produced by area, volume and value ................................................................ 17 Table 7: Overall agricultural growth indicators ..................................................................................... 18 Ta le : Togo s i po ts ......................................................................................................................... 18 Ta le : Togo s e po ts .......................................................................................................................... 19 Table 10: Togo performance indicators ................................................................................................ 23 Table 11: Selection of promising agricultural products /value chains .................................................. 29 Table 12: Summary of all value chains .................................................................................................. 30
List of Figures
Figure 1: Prevalence of undernourishment and food over-acquisition (1990-92 to 2014-16) ............. 12 Figure 2: Supply of non-staple foods (1990-2011) ................................................................................ 13 Figure 3: Percentage of infants and young children consuming foods from selected food groups (2013-14) ............................................................................................................................................... 14 Figure 4: Underweight, overweight and obesity among women of reproductive age (1998-2014) .... 14 Figure 5: Distance to markets ................................................................................................................ 24

Program of Accompanying Research for Agricultural Innovation (PARI)
4
Acronyms/Abbreviations
2 SCALE Toward Sustainable Clusters in Agribusiness through Learning in Entrepreneurship project
CAADP Comprehensive Africa Agriculture Development Program CORAF/WECARD Conseil Ouest et Centre Africain pour la Recherche et le Développement Agricoles
/West and Central African Council for Agricultural Research and Development CRA Centre de recherche agronomique / Agricultural research center DHS Demographic and Health Surveys DONATA Dissemination of New Agricultural Technologies in Africa ECOWAP ECOWAS Agricultural Policy ECOWAS Economic Community Of West African States FAO Food and Agriculture Organization FARA Forum for Agricultural Research in Africa FBS Farmer Business School FCFA Franc des Communautés F a opho es d Af i ue GDP Gross Domestic Product GHI Global Hunger Index GIC Green innovation center GIZ Deutsche Gesellschaft für Internationale Zusammenarbeit / German Agency for
International Cooperation GNI Gross National Income
ICAT Institut de Conseil et d'Appui Technique / Institute for extension services IFPRI International Food Policy Research Institute IP Innovation Platform ITRA Institut Togolais de Recherche Agronomique / Togolese Agricultural Research
Institute MAEH Ministère de l Ag i ultu e, de l Ele age et de l H d auli ue / Ministry of
Agriculture, Livestock and Water MAEP Ministère de l'Agriculture, de l'Élevage et de la Pêche / Ministry of Agriculture,
Livestock and Fisheries NEPAD New Partnership fo Af i a s De elop e t NGO Non-governmental organization NSDS National Sustainable Development Strategy PARI Program of Accompanying Research for Agricultural Innovation PNIASA Programme national d i estisse e t ag icole et de sécurité alimentaire /
National Agricultural Investment and Food Security Program PPP Purchasing Power Parity ProDRA Programme pour le développe e t u al et l ag i ultu e / Rural Development Program PSTAD Promotion of Science and Technology for Agricultural Development R&D Research and Development RCA Revealed Comparative Advantage SCAPE Stratégie de Croissance Accélérée et de Promotion de l'Emploi / Strategy for
Accelerated Growth and Employment Promotion SEWOH O e Wo ld, No Hunger Initiative SPPO Service Provider and Producer Organization SUN Scaling Up Nutrition TFP Total Factor Productivity UNICEF United Nations International Child e s E e ge Fu d USAID United States Agency for International Development WHO World Health Organization ZEF Zentrum für Entwicklungsforschung / Center for Development Research

Country Dossier Togo
5
1 General background information on the agricultural and food sectors
Togo is located in West Africa, bordering the Bight of Benin, between Benin and Ghana. Its total land area is 56,785 km2, the climate is tropical in the southern region and semiarid in the North. Of the total land area, 44% is utilized for cultivated crops, while another 2% supports permanent crops such as fruit- and nut-bearing trees. Agriculture is the most important sector of Togo s e o o . The sector employs 75% of the active population, it accounts for 41% of Gross Domestic Product (GDP), and it is the predominant livelihood means for the population. Food crops (mainly cassava, yams, maize, millet and sorghum) account for two-thirds of production and are mostly consumed domestically. The cash crops produced in Togo are cocoa, coffee, cotton and, to a lesser extent, palm oil. These crops provide su sta tial i o e fo s allholde fa e s, a d o stitute % of the ou t s e po t o odities. Togo is a net importer of food. The main imported foodstuff is rice, although local rice production has increased significantly in the last two decades.
Togo s agricultural export is dominated by cotton. Cotton production is recovering after a long crisis and reached 82,000 tons for the 2012-2013 agricultural season. Growth in cereal production (including maize) has also increased remarkably, rising from 741,000 tons in 2000 to 1,265,000 tons in 2012; Togo has now become a net exporter of maize in the sub-region.
Environmental issues facing Togo include deforestation due to slash-and-burn agriculture, the use of wood for fuel and water pollution. Soil degradation is an emerging problem that threatens cotton production. Most cotton farmers are under production contract with private companies that possess the sole export and processing rights for cotton. Cocoa and coffee production appears less important than cotton, but informal cross-border trade affects the state records on these commodities. Togo is also known for the export of its rock phosphate, which constitutes a major industry driving the economy; Togo is the world largest exporter of rock phosphate.
Agricultural productivity is low in Togo for several reasons, including lack of access to production assets, minimal training in the use of advanced production techniques, soil fertility maintenance issues, poor access to inputs and output market, among others.
The government of Togo put together the National Agricultural Investment and Food Security Program (PNIASA) that aims to transform the sector and ensure poverty reduction and national development. The program concentrates on the following issues: (i) improving water management, (ii) the sustainability of farms, (iii) improved management of other natural resources, (iv)the development of the agricultural sector and the strengthening of the market, (v) the consolidation of institutions.
The agricultural investment plan will address five sub-programs are as follows: (i) promotion of plant sectors, (ii) development of livestock production, (iii) development of fishery products, (iv) agricultural research and consultancy, (v) institutional strengthening and sectorial coordination.
Agricultural research capacity in Togo is sub-optimal and requires consistent upgrading to foster innovation. Togo s Agricultural Science and Technology Indicators evaluation1 showed that the number of agricultural researchers in Togo increased rapidly in response to a general public-sector recruitment competition in 2009, which prompted the influx of a large number of (mostly Master of Science- ualified esea he s. Togo s ag i ultu al esea he s a e either in their thirties or fifties. Given that a large number of researchers are set to retire in the coming years, further recruitment efforts are urgently needed. Agricultural research in Togo lies with the Institut Togolais de Recherche Agronomique or Togolese Agricultural Research Institute (ITRA), which was heavily dependent on the support it received from the World Bank through the National Agricultural Services Support Project. A number of other research organization and non-governmental organizations (NGOs) are also carrying out research activities in Togo.
1 http://www.asti.cgiar.org/togo

Program of Accompanying Research for Agricultural Innovation (PARI)
6
In twelve African countries, including Togo, Green Innovation Centers (GICs) have been established in sele ted egio s u de the O e Wo ld, No Hu ge I itiati e “EWOH of the Ge a go e e t and other investors. The aim of the GICs is to promote agricultural innovation, improve food and nutrition security and build sustainable value chains in the agri-food sector. The selected value chains in Togo are soya, peanut, cashew. Cashew and pulses (soya) are export products with potential importance for the economy and food security. These value chains are also compatible with bilateral programs and the goals of the government.
1.1 Pan-African policies and strategies
Togo signed the Comprehensive Africa Agriculture Development Programme (CAADP) compact in July . As a i teg al pa t of the Ne Pa t e ship fo Af i a s De elop e t NEPAD , the CAADP is
Af i a s poli f a e o k fo ag i ultu al t a sfo atio , ealth eatio , food se u it a d ut itio , economic growth and prosperity for all. CAADP represents the commitments of presidents of African countries to commit at least 10% of their budget to agriculture and increase the agricultural sector at a a ual g o th ate of %. Togo has failed to eet CAADP s % udget allo atio ta get a d has exceeded the annual 6% growth rate target only four times between 2005 and 2014 (see Table 10). Togo also adopted the Economic Community of West African States (ECOWAS) Agricultural Policy (ECOWAP), which was initiated in 2005 to ensure food security, economic and social development, and poverty reduction in the region. Another objective of ECOWAP is to operationalize the CAADP process in West Africa.
Togo became the 48th country to join the Scaling Up Nutrition (SUN) Movement in March 2014. SUN consists of 55 countries that have committed to scaling up nutrition and working collectively as a movement. The movement unites people—from governments, civil society, the United Nations, donors, businesses and researchers—in a collective effort to improve nutrition. Within the SUN Movement, governments are prioritizing efforts to address malnutrition.
1.2 National (and regional) policies and strategies
The CAADP is the focus of efforts by African governments at the initiative of the African Union and the New Partnership fo Af i a s Development (NEPAD) to accelerate growth and reduce poverty and hunger in Africa. The main objective of CAADP is to help African countries to reach a higher level of economic growth through agriculture-led development, to reduce hunger, poverty and food insecurity and enable the development of exports.
In West Africa, the Economic Community of West African States (ECOWAS) is the responsible body for the implementation of CAADP/NEPAD. Based on CAADP policies, ECOWAS developed its regional agricultural policy, ECOWAP, which was adopted in January 2005.
In Togo, the ECOWAP/CAADP implementation process started with the harmonization of its policies, strategies and programs with the principles and objectives of CAADP. Togo is the first West African country to have signed a CAADP compact in 2009. Togo has not met the CAADP 10% expenditure target. The country has, however, surpassed the CAADP 6% growth target in 2005, 2008, and 2011.
1.2.1 Togo’s agricultural development plan
Togo s main objectives are reflected in the Strategy for Accelerated Growth and Employment Promotion (SCAPE) document, which is based on lessons learned from the implementation of the interim and comprehensive poverty reduction strategy documents. It is a medium-term development framework (2013-2017) to achieve the objectives of the Government Policy Statement, the Millennium Development Goals and the Authorities Vision for an emerging Togo by 2030.
A scenario considered for that purpose is a strong and sustainable growth of about 7.1%, supported by ambitious policies such as the modernization of agriculture. Thus, the general objectives of Togo s

Country Dossier Togo
7
National Policy on Agricultural Development are to promote sustained agricultural growth of at least 6% per year, and to substantially improve the income of producers in order to support an annual rural poverty reduction especially for the most vulnerable (women, youth) by at least 5%, and to achieve sustained improvements in food and nutrition security. The attainment of these objectives depends, among other things, on creating rural wealth through competitive and sustainable agriculture, which is based on the promotion of small and medium-sized agricultural holdings by professionals and organized small producers. These projects are also consistent with (i) the Comprehensive Poverty Reduction Strategic Paper with regard to the strategic objective 1 (increase in agricultural productivity) in area 3 (promoting sources of growth) of Pillar 2 (consolidation of the foundations of strong and sustainable growth) and (ii) the National Agricultural Investment and Food Security Program
(PNIASA), that serves as reference for all activities in the agricultural sector which mainly aims at increasing the income of farmers and improve their living conditions on a sustainable basis.
1.2.2 Strategy for Accelerated Growth and Employment Promotion (SCAPE)
In the long term, there is strong political ambition for Togo to be in the group of emerging countries in the next 15-20 years. Comparative tracking of emerging countries indicates that in order to do this, Togo will have to profoundly transform the current structure of its economy; develop the secondary sector, specifically the manufacturing industry; intensify the primary sector and improve the service sector from its informal stage to a more efficient and more professional level. It must reach the stage of middle-income countries in which the employment and income will be better distributed and poverty will be highly reduced.
This industrialization effort must obviously be based on the development of infrastructure, improvement of the business environment, reduction of the costs of factors of production (inputs) and a commitment to be more innovative and open to the world financial system. In its National Sustainable Development Strategy (NSDS), Togo intends to build, by 2030, an environmentally friendly society based on a harmonious social and economic development that safeguard cultural heritage. The priorities identified by the government in the SCAPE to accelerate progress towards sustainable development for the next ten years are reflected in the four strategic areas of the NSDS. These are: (i) the consolidation of economic recovery and the promotion of sustainable production and consumption, (ii) boosting the development of social sectors and promoting principles of social equity, (iii) improving environmental governance and the sustainable management of natural resources, (iv) promoting education and capacity building for sustainable development.
The mid-term (2013-2017) economic policy of the government will mainly seek to lay and strengthen the foundations of the vision for an emerging Togo by 2030. To achieve this, and in response to the challenges mentioned above, there is a need to adopt new priorities relating to: (i) accelerated growth, (ii) employment and inclusion, (iii) strengthening governance, (iv) reduction of regional disparities and the promotion of grassroots development. The first policy direction adopted focuses on strengthening the foundations of the economy and enhancing its potential to achieve an accelerated growth rate to advance the double objective of improving income and creating jobs on the one hand, and to consolidate other export potential on the other. Over the coming years, investment will be the main driver of economic growth in Togo. The ambition is to achieve an overall investment rate that is consistently above 20% with a medium-term goal of 25% of GDP. The public investment effort will be important initially and will be mainly channeled into the construction of basic infrastructure, production of essential public goods, and building up capacity and competitiveness of the domestic private sector, which must imperatively be strengthened in order to play a leading role in growth during the implementation of future economic programs.
A large part of private investment, which is expected to grow gradually to supplement public investment in the mid-term, should indeed come for from foreign direct investors and the diaspora. It could essentially focus on mining, agriculture, infrastructure that has proven economic and financial profitability, the finance sector and construction.
Program of Accompanying Research for Agricultural Innovation (PARI)
8
Finally, to make growth inclusive and pro-poor, investment in human capital is also a priority. To ensure the sustainability of economic growth, the government will seek to establish strong foundations of growth on development across the country and to consolidate the sub-regional economic integration of Togo. To achieve this, the government seeks to implement the strategic concept of development corridors .
1.2.3 National Agricultural Investment and Food Security Program (PNIASA)
The first stage in the national implementation of CAADP was the adoption by the different partners of the PNIASA through a signed treaty spelling out the stakeholde s espo si ilities i the implementation of this program. The PNIASA is the Priority Action Plan of the Poverty Reduction Strategy Paper for the agricultural sector. It is part of the Pillar II devoted to the consolidation of foundations for strong and sustainable growth. This second strategic pillar reflects the willingness of the government to create, over the next three years, a new foundation for a progressively strong, sustainable and sustained growth. To do this, interventions to promote growth are channeled through nine priority areas. These are: (i) strengthening structural reforms, (ii) improving the business environment, (iii) promoting the sources of growth, (iv) developing growth-supporting infrastructures, (v) strengthening regional integration, (vi) managing effective of natural resources, the environment and the living environment, (vii) redistributing the fruits of growth, (viii) creating jobs and (ix) promoting research.
For the implementation of the ECOWAS/CAADP/NEPAD project, Togo developed a PNIASA operation plan with a hierarchical framework of actions to be undertaken in the agricultural sector so as to meet the objectives of poverty reduction and food insecurity by 2015. By 2015, the PNIASA aims to reach an agricultural annual growth rate of at least 6%. It is organized into five sub-programs, among which three focus on essential subsectors, namely agriculture, livestock farming, and fishing. Two cross-cutting sub-programs focus on agricultural research and advice and on institution strengthening and sector coordination. The program is based on sustainable investments for achieving an annual growth rate estimated at 6% for plant production, 4.1% for animal production and 4.3% for fish production by 2012.
PNIASA’s Sub-programmes
Sub-programme 1: Promoting the plant industry
This sub-programme aims at meeting the ou t s eeds i terms of food products, increasing exports of traditional products and promoting new export crops. This sub-programme involves a farming workforce estimated to 1,500,000 in 2009, di ided i to fa e s o ga izatio s, and farming over 45,000 ha in 2008. The first component of this sub-programme is focusing on the sustainable management of natural resources. It focuses on the fight against the deterioration of natural resources, the restoration of wasted lands and resources due to anthropic activities and the promotion of forestry. The second component, rural infrastructures, is devoted to the full control of the water needed to increase production and for infrastructure projects that can foster the marketing of products. With regards to the third component, food products, PNIASA focuses on intensive production of cereals, particularly maize, rice and sorghum, roots and tubers including cassava and yam. For the fourth component, promoting and diversifying export products, PNIA“A s i est e ts ill p i a il focus on traditional value chains, notably: (a) cotton, whose annual production will reach more than 75,000 tons in 2015, (b) coffee, whose production will reach 26,000 tons, and (c) cocoa, whose production will be about 14,300 tons in 2015. Apart from these products, PNIASA aims at promoting new export products, including pineapple, cashew nut and banana. The objective is to reach 65,000 tons in 2015 with an induced growth rate of 22.5%.

Country Dossier Togo
9
Sub-programme 2: Animal production
It aims to meet the national needs in terms of livestock products through intensive livestock farming and by fostering small and medium enterprises in that sector. According to 2009 estimates, the actions of this sub-programme will benefit 1,225,100 livestock farmers. PNIASA also plans to support the promotion of small and medium enterprises to develop agribusiness value chains such as eggs, meat, and milk.
Sub-programme 3: Fish production
It will help meet national needs in terms of fish products through the development of fish farming on one hand, and the development of continental and maritime fishing on the other hand. The first component, intensification of fish production, will cover the following key activities: construction and pond management, production and distribution of fry, and production and distribution of feedstuffs. It will cover a target population of 8,500 fish farmers, according to 2015 estimates. The second component aims to support continental and maritime fishing. Targeted production and growth objectives in 2015 are 39.59 tons and 6.5% respectively.
Sub-programme 4: Agricultural research and advice
This, sub-programme is essentially dedicated to development research and aims to increase productivity and adapt to climate change through the development of new genetic materials; the development of integrated management technologies for soil fertility, phytosanitary and zoosanitary protection, and processing products; and the funding of research to sustain the intensification of crop systems and increasing production of growth-generating products.
Sub-programme 5: Institution strengthening and sector coordination
It aims to establish a political, legal and institutional environment for the development of agriculture and the achievement of food security. It will contribute to: (i) improving the institutional environment of the sector, (ii) capacity building of public officials and the profession, (iii) improving service delivery by public and private structures, (iv) developing an agricultural development policy, (v) centralizing information on the performance of the sector, (vi) improving planning, implementation, and concerted monitoring and evaluation of investment operations, (vii) improving the absorption capacity of funding and (viii) improving food and nutrition security in Togo and in the sub region.

Program of Accompanying Research for Agricultural Innovation (PARI)
10
1.3 Data on food and nutrition security in Togo and GIC region
The following section includes information about important socio-economic and agricultural indicators and data on diet quantity, diet quality and nutrition status.
1.3.1 Socio-economic and agricultural data
Table 1: Selected national economic and health-related data
Indicator Value Year
Population, total 6,993,244 2014
Population growth (annual %) 1.7 2014 Rural population (% of total population) 61 2014
GDP per capita, PPP (constant 2011 international $) 1,387 2014 GNI per capita, PPP (constant 2011 international $) 1,228 2014
Poverty headcount ratio at $2 a day (PPP) (% of population) 73 2011
Poverty headcount ratio at $1.25 a day (PPP) (% of population) 52 2011
Poverty headcount ratio at national poverty lines (% of population) 59 2011
Rural poverty headcount ratio at national poverty lines (% of rural population) 73 2011
Agricultural land (% of land area) 71 2012 Agricultural irrigated land (% of total agricultural land) no data
Agriculture value added per worker (constant 2005 US$) 681 2014
Agriculture, value added (% of GDP) 42 2014
Access to electricity, rural (% of rural population) 9 2012 Employees, agriculture, female (% of female employment) 48 2006
Employees, agriculture, male (% of male employment) 61 2006 Employment in agriculture (% of total employment) 54 2006
Literacy rate, adult total (% of people ages 15 and above) 60 2011 Ratio of female to male secondary enrollment (%) 53 2007
Mortality rate, under-5 (per 1,000 live births) 85 2013 Maternal mortality ratio (modeled estimate, per 100,000 live births) 450 2013
Source: World Bank, http://data.worldbank.org/country Note: GDP refers to Gross Domestic Product; GNI refers to GNI; PPP refers to Purchasing Power Parity
1.3.2 Consumption and nutrition status
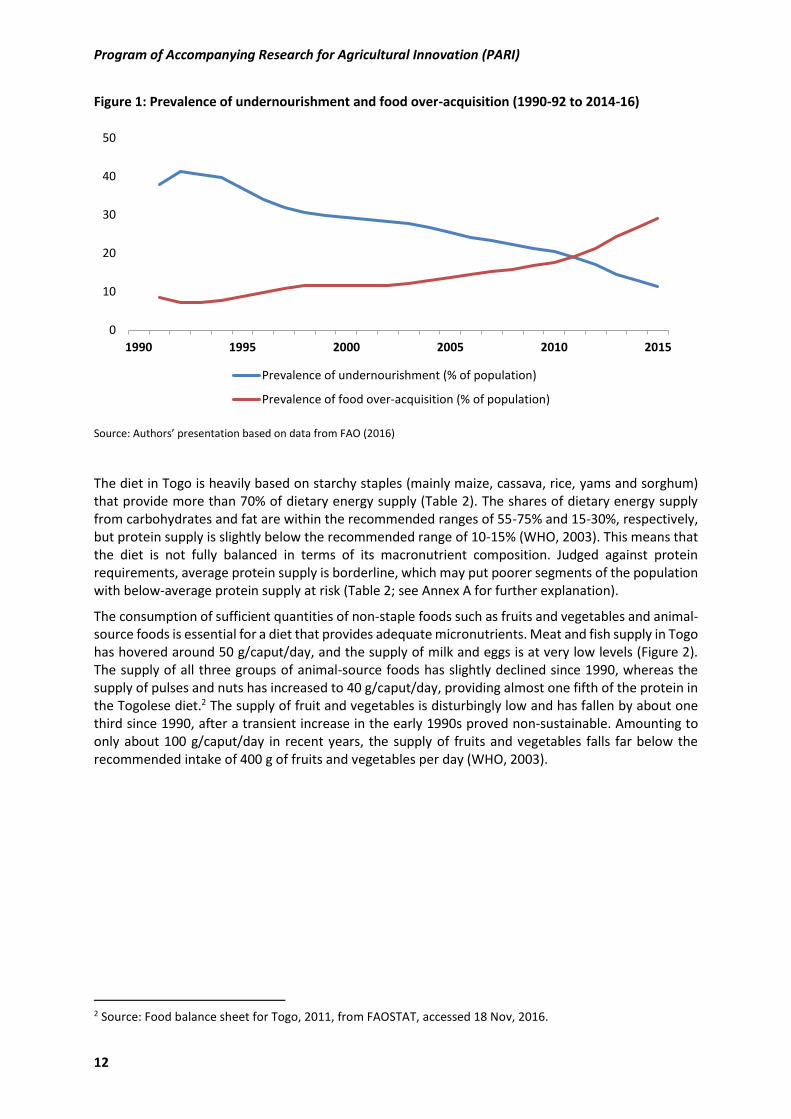
Data on diet quantity, diet quality and nutrition status are relevant for assessing food and nutrition security. Overall, dietary energy supply per capita – a measure of diet quantity – is sufficient in Togo, exceeding the average dietary energy requirement of the population by about 20% (Table 2). Nevertheless, about one tenth of the population is unable to meet minimum dietary energy requirements and suffers from chronic undernourishment. Togo has reduced the prevalence of undernourishment considerably since 1990-92, by more than two thirds overall (Figure 1). Yet, the prevalence of food-overacquisition has risen steeply in recent years: The United Nations Food and Agriculture Organization (FAO) estimates that close to 30% of the Togolese population regularly acquired food in excess of dietary energy needs in 2014-16 (Table 2).

Country Dossier Togo
11
Table 2: Food and nutrition security indicators
Indicator Value Year
Diet quantity
Dietary energy supply (kcal/caput/day) 2659 2014-16
Average dietary energy supply adequacy (% of average requirement) 122 2014-16
Prevalence of undernourishment (% of population) 11 2014-16
Prevalence of food over-acquisition (% of population) 29 2014-16
Diet quality
Dietary energy supply from cereals, roots and tubers (% of total dietary energy supply)
72 2009-11
Dietary energy supply from carbohydrate (% of total dietary energy supply) 72 2009-11
Dietary energy supply from protein (% of total dietary energy supply) 9 2009-11
Dietary energy supply from fat (% of total dietary energy supply) 19 2009-11
Average protein supply (g/caput/day) 55 2009-11
Average fat supply (g/caput/day) 50 2009-11
Child feeding practices
Minimum dietary diversity: consumption of 4+ food groups (% of children 6-23 months)
20 2013-14
Consumption of foods rich in vitamin A (% of children 6-23 months) 69 2013-14
Consumption of foods rich in iron (% of children 6-23 months) 57 2013-14
Nutrition status
Child wasting (% of children under five) 7 2013-14
Child stunting (% of children under five) 28 2013-14
Child overweight (% of children under five) 2 2013-14
Adult overweight and obesity (% of adults 18+ years) 26 2014
Adult obesity (% of adults 18+ years) 8 2014
Vitamin A deficiency (% of children 6-59 months) 53 2013
Anemia in children (% of children 6-59 months) 70 2013-14
Anemia in women (% of women 15-49 years) 48 2013-14
“ou e: FAO , a d autho s al ulatio s ased o FAO ; Mi ist e de la Pla ifi atio , du D eloppe e t et de l A age e t du Territoire, Ministère de la Santé and ICF International (2015); Stevens et al. (2015), quoted in International Food Policy Research Institute (IFPRI) (2015); World Health Organization (WHO) (2015a) Note: See Annex A for definitions of the indicators.
Program of Accompanying Research for Agricultural Innovation (PARI)
12
Figure 1: Prevalence of undernourishment and food over-acquisition (1990-92 to 2014-16)
“ou e: Autho s p ese tatio ased o data f o FAO
The diet in Togo is heavily based on starchy staples (mainly maize, cassava, rice, yams and sorghum) that provide more than 70% of dietary energy supply (Table 2). The shares of dietary energy supply from carbohydrates and fat are within the recommended ranges of 55-75% and 15-30%, respectively, but protein supply is slightly below the recommended range of 10-15% (WHO, 2003). This means that the diet is not fully balanced in terms of its macronutrient composition. Judged against protein requirements, average protein supply is borderline, which may put poorer segments of the population with below-average protein supply at risk (Table 2; see Annex A for further explanation).
The consumption of sufficient quantities of non-staple foods such as fruits and vegetables and animal-source foods is essential for a diet that provides adequate micronutrients. Meat and fish supply in Togo has hovered around 50 g/caput/day, and the supply of milk and eggs is at very low levels (Figure 2). The supply of all three groups of animal-source foods has slightly declined since 1990, whereas the supply of pulses and nuts has increased to 40 g/caput/day, providing almost one fifth of the protein in the Togolese diet.2 The supply of fruit and vegetables is disturbingly low and has fallen by about one third since 1990, after a transient increase in the early 1990s proved non-sustainable. Amounting to only about 100 g/caput/day in recent years, the supply of fruits and vegetables falls far below the recommended intake of 400 g of fruits and vegetables per day (WHO, 2003).
2 Source: Food balance sheet for Togo, 2011, from FAOSTAT, accessed 18 Nov, 2016.
0
10
20
30
40
50
1990 1995 2000 2005 2010 2015
Prevalence of undernourishment (% of population)
Prevalence of food over-acquisition (% of population)

Country Dossier Togo
13
Figure 2: Supply of non-staple foods (1990-2011)
“ou e: Autho s p ese tatio ased o data f o FAO“TAT, a essed O t Note: Based on their nutrient profiles, pulses and nuts include groundnuts and soybeans, although these foods are classified by FAO as oilcrops. Coconuts are not included among pulses and nuts because they have low protein content.
I fa t a d ou g hild feedi g p a ti es a e u ial fo hild e s ut itio a d health status a d lo g-term development. Children aged 6-23 months should consume at least 4 out of 7 food groups (minimum dietary diversity) and receive iron-rich foods and foods rich in vitamin A daily. In Togo, i fa ts a d ou g hild e s diets fall sho t of these goals: o l o e fifth a hie ed i i u dietary diversity, slightly over two thirds consumed foods rich in Vitamin A, and 57% had foods rich in iron on the previous day (Table 2). Both breastfed and non-breastfed children aged 6-23 months were most frequently fed foods made from grains; other, more micronutrient-rich foods such as meat, fish and eggs, fruits and vegetables rich in vitamin A, and pulses and nuts, were given more rarely (Figure 3). Fortified baby foods, which can compensate for a lack of micronutrients in the diet, were consumed by less than 10% of breastfed and non-breastfed children.
Stunting and wasting are indicators of chronic and acute child undernutrition, respectively. In Togo, 28% of children are stunted and 7% are wasted, which means that the public health significance of both forms of undernutrition is mild (Table 2). The prevalence of stunting was cut back by one third since the late 1980s (UNICEF3/WHO/World Bank, 2016). Wasting has shown large fluctuations during this period – with prevalence rates varying between 5% and 16% – and has hardly improved overall. Overweight among children is low and at present no public health concern (Table 2).
Overweight and obesity are risk factors of chronic diseases such as diabetes (Must and McKeown 2012). About one fourth of adults in Togo are overweight or obese (Table 2). According to data from the Demographic and Health Surveys (DHS), the combined prevalence of overweight and obesity among women of reproductive age has more than doubled since the late 1990s, exceeding 30% by 2013-14, while the prevalence of obesity has more than quadrupled (Figure 4). The prevalence of underweight has fallen to a relatively low national average of 7%.4
3 UNICEF = U ited Natio s I te atio al Child e s E e ge Fu d 4 See Annex A for definitions of overweight, obesity, and underweight.
0
50
100
150
200
1990 1995 2000 2005 2010
Fruits and vegetables (g/caput/day)Meat and fish (g/caput/day)Pulses and nuts (g/caput/day)Milk (g/caput/day)Eggs (g/caput/day)

Program of Accompanying Research for Agricultural Innovation (PARI)
14
Figure 3: Percentage of infants and young children consuming foods from selected food groups
(2013-14)
“ou e: Autho s p ese tatio ased o data f o Mi ist e de la Pla ifi atio , du D eloppe e t et de l A age e t du Territoire, Ministère de la Santé and ICF International (2015)
Vitamin A deficiency is a risk factor for blindness and for mortality from measles and diarrhoea in children aged 6–59 months (Imdad et al. 2010; Imdad et al. 2011). In Togo, more than half of all children in this age group are estimated to be vitamin A deficient (Table 2). A high proportion of children aged 6-59 months – namely 70% – and almost half of all women of reproductive age suffer from anemia (Table 2). About half of the global burden of anaemia can be attributed to iron deficiency (WHO, 2015b). Anemia is also caused by malaria, which is widespread in most West African countries, including Togo (University of Oxford, 2015).
Figure 4: Underweight, overweight and obesity among women of reproductive age (1998-2014)
“ou e: Autho s p ese tatio ased o data f o ICF I te atio al , The DH“ P og a “TAT o pile , fu ded the United States Agency for International Development (USAID), accessed 12 Sept 2016
0 10 20 30 40 50 60 70 80 90 100
Grains
Roots and tubers
Meat, fish, eggs
Fruits and vegetables rich in vitamin A
Other fruits and vegetables
Fortified baby food
Pulses and nuts
Breastfed children, 6-23 months (% consuming the food on the previous day)
Non-breastfed children, 6-23 months (% consuming the food on the previous day)
0
10
20
30
1998 2014
underweight (% of women 15-49 years)overweight or obese (% of women 15-49 years)obese (% of women 15-49 years)

Country Dossier Togo
15
Regionally disaggregated data are available for indicators of nutrition status and child feeding. The di e sit of i fa ts a d ou g hild e s diets is lo est i the Ma iti e egio a d highest i the Lo region, which includes the capital city and its urban agglomeration (Table 3). The proportion of children consuming foods rich in vitamin A is highest in the Savanes region up north, whereas the proportion of children consuming iron-rich foods does not differ markedly across the regions. In the Kara, Plateaux and Centrale regions in the middle of the country, children have the highest rates of anemia (Table 4). Stunting is particularly low in the Lomé region, with a prevalence rate that amounts to only half (or less than half) the rate in other regions. The Savanes region has the worst performance on both stunting and wasting. Regarding overweight and obesity among women, the Lomé region has by far the highest prevalence, and the Savanes region the lowest, followed by the Kara region (Table 5). At the same time, the Savanes region ranks at the bottom of the list on underweight among women. Anemia prevalence among women is elevated in the Lomé and Maritime regions in the South, and below the national average in the three northernmost regions (Central, Kara, and Savanes).
Table 3: Child feeding practices by region, 2013-14
Share of children 6-23 months consuming:
4+ food groups Foods rich in vitamin A Foods rich in iron
Region (%) Region (%) Region (%)
Lomé 31 Savanes 72 Plateaux 59
Centrale 27 Lomé 70 Kara 58
Savanes 25 Maritime 69 Savanes 58
Kara 14 Kara 69 Lomé 57
Plateaux 14 Plateaux 68 Centrale 56
Maritime 12 Centrale 62 Maritime 53
“ou e: Mi ist e de la Pla ifi atio , du D eloppe e t et de l A age e t du Te itoi e, Ministère de la Santé and ICF International (2015) Notes: GIC regions are highlighted in red. See Annex A for definitions of the indicators.
Table 4: Child nutrition status by region, 2013-14
Prevalence among children under five: Prevalence among
children 6-59 months:
Stunting Wasting Overweight Anemia
Region (%) Region (%) Region (%) Region (%)
Lomé 15 Centrale 5 Plateaux 2 Lomé 64
Centrale 29 Maritime 5 Savanes 2 Savanes 69
Maritime 29 Lomé 6 Kara 2 Maritime 70
Plateaux 31 Plateaux 6 Maritime 2 Centrale 72
Kara 32 Kara 7 Centrale 2 Plateaux 73
Savanes 34 Savanes 11 Lomé 3 Kara 76
“ou e: Mi ist e de la Pla ifi atio , du D eloppe e t et de l A age e t du Te itoi e, Mi ist e de la “a t a d ICF International (2015) Notes: GIC regions are highlighted in red. See Annex A for definitions of the indicators.

Program of Accompanying Research for Agricultural Innovation (PARI)
16
Table 5: Wo e ’s utritio status b regio , -14
Prevalence among women of reproductive age (15-49 years):
Underweight Overweight + obesity Obesity Anemia
Region (%) Region (%) Region (%) Region (%)
Lomé 4 Savanes 10 Savanes 2 Centrale 38
Plateaux 5 Kara 19 Kara 7 Kara 39
Centrale 5 Plateaux 26 Centrale 8 Savanes 40
Maritime 9 Centrale 28 Plateaux 9 Plateaux 45
Kara 10 Maritime 31 Maritime 10 Lomé 56
Savanes 14 Lomé 46 Lomé 19 Maritime 56
“ou e: Mi ist e de la Pla ifi atio , du D eloppe e t et de l A age e t du Te itoi e, Mi ist e de la “a t a d ICF International (2015) Notes: GIC regions are highlighted in red. See Annex A for definitions of the indicators.
A o g i di ato s of hild e s ut itio status that a e a aila le at the egio al le el, anemia is the most important in terms of prevalence rates (Table 4). Under the assumption that half of all anemia is due to iron deficiency, iron deficiency anemia among children is of moderate public health significance in all regions.5 Stunting has mild public health significance in the Centrale and Maritime regions, and moderate significance in the Plateaux, Kara, and Savanes regions. Wasting is a mild concern in the Lomé, Plateaux, and Kara regions, and moderately high in the Savanes region. Overweight in children is below the threshold for mild public health significance in all regions.
Considering the i di ato s of o e s ut itio status that a e a aila le at the egio al le el, a e ia has the highest prevalence in all regions, followed by underweight in the Savanes region, and by overweight and obesity combined in the remaining regions (Table 5). In the Lomé region, 46% of the women are overweight or obese, and about one fifth is obese.
In summary, Togo is affected by both over- and undernutrition, and widespread micronutrient deficiencies pose a challenge. Dietary energy supply needs to be raised in disadvantaged regions and for deprived population groups, while overweight and obesity should be monitored in better-off regions. Dietary diversity can be increased and diet quality improved by developing value chains for vegetables, fruits, animal-source foods, pulses and nuts, and possibly also red palm oil (rich in vitamin A). The decline in the supply of animal-source foods and fruits and vegetables since 1990 is disconcerting and needs to be reversed. Increasing the supply of animal-source foods and pulses and nuts would raise protein and micronutrient supply and help to diminish the heavy reliance of the Togolese diet on starchy staples. The fortification of staple foods and the production of fortified baby foods could be addressed at the processing stage of the value chain. Promoting biofortified staple foods, such as beans rich in iron and vitamin A-rich yellow cassava and orange maize developed by HarvestPlus, also has the potential to improve micronutrient intakes.6
Additionally, reducing the aflatoxin contamination of foods is critical in order to improve food safety in Togo. Aflatoxins are highly toxic substances that are produced by certain types of fungi and can cause acute poisoning, liver cancer, and stunted growth in children (Bhat and Vasanthi, 2003; Gong et al.,
5 About half of the global burden of anemia is attributable to iron deficiency (WHO 2015b). Since the prevalence of anemia among children in all regions is in the range of 64-76%, the prevalence of iron deficiency anemia can be estimated to be 32-38%, falling within the range of 20-39% that has been defined to classify a moderate public health problem (see Annex A). However, it is possible that less than half of all anemia in Togo is caused by iron deficiency because malaria is widespread in the country. 6 See http://www.harvestplus.org/what-we-do/crops .

Country Dossier Togo
17
2004). In Togo, aflatoxin contamination of maize and groundnuts is a common problem, and dried vegetables from Togo and other West African countries were also found to be contaminated (Egal et al., 2005; Hell et al., 2009). Children in Togo and Benin experienced a marked increase in aflatoxin exposure when they were weaned onto solid foods, particularly maize. Blood samples from 479 children aged 9-59 months from four agro-ecological zones in the two countries revealed that 99% of the children had been exposed to aflatoxins in the last 2-3 months (Gong et al., 2003). The same cross-sectional study in Togo and Benin found a strong association between aflatoxin exposure and both stunting and underweight in children (Gong et al., 2002). A later, longitudinal study in Benin confirmed that aflatoxin exposure leads to impaired child growth (Gong et al., 2004).
A look at the regions reveals that undernutrition rates among children and women are highest in the Kara and Savanes regions, the two northernmost regions of the country. This suggests prioritizing these two regions, which are at present no GIC regions, for interventions and agricultural innovations. In the Lomé region, which includes the metropolitan area of the capital city, the prevalence of undernutrition is low, but overweight and obesity among women give reason for concern. Togo is a member of the SUN 7 network, a global movement led by 57 countries that aims to end malnutrition in all its forms.
1.4 Data on most relevant crops and value chains
The most relevant crops in Togo include tubers (cassava and yams), maize, millet and sorghum. Cash crops include cocoa, cotton and palm oil. Production and consumption data are provided below.
1.4.1 Production
Table 6: Top 10 crops produced by area, volume and value
Area harvested (ha) Production volume (tons) Production value*
Top 10 Share of
Total (%)
Top 10 Share of
Total (%)
Top 10 Share of
Total (%)
Maize 32.2 Cassava 25.4 Maize 15.5 Beans, dry 14.7 Maize 19.8 Yams 13.9
Sorghum 13.8 Yams 19.5 Meat, chicken 9.7 Cassava 11.7 Sorghum 7.1 Meat indig., chicken 9.7
Seed cotton 5.5 Rice, paddy 4.8 Cassava 9.0 Yams 4.1 Oil, palm fruit 3.7 Cocoa, beans 7.2
Rice, paddy 4.1 Vegetables, fresh nes 3.6 Sorghum 6.5 Groundnuts 2.9 Beans, dry 3.4 Eggs, hen, in shell 4.5
Millet 2.0 Seed cotton 2.2 Beans, dry 3.8 Coffee, green 1.7 Cottonseed 1.3 Rice, paddy 3.4
Rank 19: Cashew nuts
0.2 Rank 11: Groundnuts 1.0 Rank 16: Groundnuts 1.6
Rank 25: Soybeans
0.1 Rank 26: Cashew nuts 0.2 Cashew nuts no data
Rank 33: Soybeans 0.0 Soybeans no data
Data: average 2012-2014, FAOSTAT, accessed 18 January, 2017 * Gross Production Value (constant 2004-2006 million US$), data: average 2011-2013, FAOSTAT, accessed 18 January, 2017 Note: GIC value chains marked in red; nes refers to Not elsewhere specified
7 See http://scalingupnutrition.org/ for more information.

Program of Accompanying Research for Agricultural Innovation (PARI)
18
Table 7: Overall agricultural growth indicators
Years Total factor productivity
Agricultural productivity
Budgetary allocation (%)
Contribution of Agricultural to GDP
(%)
Agricultural GDP (million US$)
1995 0.091 -0.004 3.7 37.76 413.1 1996 -0.082 0.131 4.1 40.83 589.6 1997 0.007 0.030 4.2 42.19 666.2
“ou e: Autho s o pilatio ased o FAO Data, FAOSTAT, accessed 18 January, 2017
1.4.2 Trade
The import of rice accounts for more than 24% of the import volume, but for only 8.7% of the import value. Other important import commodities include wheat, sugar and prepared food. Cocoa and cotton are the most important and most valuable export goods and together account for about 43% of the export volume and for almost 69% of the export value. The GIC value chains, groundnut, cashew and soy, account for only small shares of import and export trade in Togo.
Table 8: Togo’s i ports
Import volume (tons) Import value (US$)
Top 10 Share of
Total (%)
Top 10 Share of
Total (%)
Rice – total (Rice milled equivalent) 24.7 Wheat 15.0 Wheat 16.2 Food prep nes 10.2 Sugar refined 9.9 Rice – total (Rice milled equivalent) 8.7 Oil, palm 5.8 Oil, palm 7.1 Sugar Raw Centrifugal 5.6 Cigarettes 6.8 Food prep nes 5.3 Sugar refined 4.3 Oil, linseed 3.0 Milk, skimmed dried 4.2 Tomatoes, paste 2.8 Meat, chicken 4.1 Meat, chicken 2.3 Malt 3.8 Oil, vegetable origin nes 2.1 Tomatoes, paste 3.1 Rank 65: Oil, soybean 0.0 Rank 36: Oil, groundnut 0.3 Rank 83: Cake, soybeans 0.0 Rank 66: Oil, soybean 0.0 Rank 84: Cashew nuts, with shell 0.0 Rank 116: Cashew nuts, with shell 0.0
Data: average 2011-2013, FAOSTAT, accessed 18 January, 2017 Note: GIC value chains marked in red; nes refers to Not elsewhere specified

Country Dossier Togo
19
Table 9: Togo’s e ports
Export volume (tons) Export value (US$)
Top 10 Share of Total
(%)
Top 10 Share of Total
(%)
Cotton lint 23.2 Cotton lint 35.7 Cocoa, beans 20.1 Cocoa, beans 32.9 Oil, palm 8.4 Beverages, non alcoholic 5.7 Beverages, non alcoholic 8.0 Oil, palm 5.7 Cottonseed 3.3 Sugar confectionery 2.0 Sesame seed 2.8 Coffee, green 2.0 Bran, wheat 2.6 Milk, whole condensed 1.4 Maize 2.5 Milk, skimmed dried 1.4 Cake, cottonseed 2.4 Milk, whole dried 1.3 Coffee, green 2.3 Ice cream and edible ice 1.2 Rank 15: Cashew nuts, with shell
1.7 Rank 19: Soybeans 0.4
Rank 21: Soybeans 1.0 Rank 20: Cashew nuts, with shell
0.4
Rank 26: Cake, groundnuts 0.5 Rank 23: Cashew nuts, shelled
0.3
Rank 39: Cake, soybeans 0.1 Rank 33: Cake, groundnuts 0.1 Rank 46: Cashew nuts, shelled
0.1
Data: average 2011-2013, FAOSTAT, accessed 18 January, 2017 Note: GIC value chains marked in red; nes refers to Not elsewhere specified
1.5 National (and regional) innovation system
1.5.1 Research system and organizations
1.5.1.1 International
Some of the international organizatio s a ti e i Togo s ag i ultu al esea h a e listed elo : Africa Rice Center: focus on rice;
International Institute of Tropical Agriculture: focus on crops;
International Center for Tropical Agriculture: focus on crops and soils;
Centre de Coopération Internationale en Recherche Agronomique pour le Développement: focus on crops, livestock, food and energy security, public policy.
1.5.1.2 National
The Togolese Agricultural Research Institute (ITRA) was established by Decree No. 97-105 / PR on 23rd July 1997 and its main mission is to coordinate the national agricultural research system and conduct research to promote agricultural development across the country. IT‘A s i stitutio al isio is to e a research institute that meets the needs of Togolese farmers and addresses international issues of agriculture and sustainable development. It has a scientific strategy based on the division of the country into four agro-ecological zones for research, each zone hosting an agricultural research center (CRA). CRAs are centers of excellence for research on specific products:
CRA - Coast based in Davie;
CRA - Forest area based in Kpalime;
CRA - Wet Savannah based in Kolokopé;
CRA - Dry Savannah based in Kara.

Program of Accompanying Research for Agricultural Innovation (PARI)
20
ITRA has five priority research areas:
Natural resources management;
Food and industrial crops;
Animal and fish production;
Food technology, nutrition and quality;
Socio-economic studies, technology transfer and training of partners.
Activities are organized in research programs and hosted in the CRAs, based on their agricultural vocations. A concerted schedule of research activities is developed in partnership with producers through a participative mechanism and is used to diagnose the challenges and to approve the research budget of the year. A transfer mechanism of technologies, in conjunction with the Support Mechanism for research system, contributes to assessing transferred technologies, as well as their adoption and impact. There is also a supervisory board (at the ministerial level), a board of directors and science board to endorse program budgets for research and monitoring and the evaluation of activities.
The list below presents some of the national research organizations that carry out research activities in the agricultural and food sectors of Togo:
Government: - Direction de la Protection des Végétaux, Ministère de l'Agriculture, de l'Élevage et de la
Pêche (MAEP): focus on crops; - Direction des Statistiques Agricoles de l I fo ation et de la Documentation, MAEP:
focus on socio-eonomics; - ITRA, MAEP: focus on crops, livestock, natural resources, off-farm post-harvest, river and
lake, socio-economics.
Higher Education: - École Supérieure d'Agronomie, Université de Lomé: focus on crops, livestock, pastures &
forages, off-farm post-harvest, forestry, agricultural engineering, socioeconomics; - Faculté des Sciences, Université de Lomé: focus on crops - École Supérieure des Technologies et Biologies Alimentaires, Université de Lomé: focus
on off-farm post-harvest.
1.5.2 Innovation platforms
1.5.2.1 FARA Platforms
The Promotion of Science and Technology for Agricultural Development (PSTAD) project led by the Forum for Agricultural Research in Africa (FARA) used multi-stakeholder innovation platforms (IPs) in its the Dissemination of New Agricultural Technologies in Africa (DONATA) initiative. The IPs were used to facilitate the rapid dissemination and adoption of innovations along the value chains of cassava and maize in Togo, Benin, Burkina Faso and Sierra Leone. The DONATA constituent of the PSTAD was implemented in Togo from 2011 to 2014. Activities were implemented in the northern region of Togo, notably in the Kara and Savannah regions. Promoted technologies included quality protein maize and notably, Obatanpa.
In the implementation of the project, six IPs were developed including four in the Kara region and two in the Savannah region. All platforms were developed around the production of maize grains and seeds, marketing of the product, and its usage in cooking local dishes and baby cereals. Today, six IPs are operational at different levels, ased o a to s otivation. They are run by management committees and some of them have signed a Memorandum of Understanding among actors.
The platforms have helped in addressing the constraints of poor access to product markets and low prices following good harvests. The platforms have also created a strong collaborative environment that has increased trust among stakeholders along the value chain. Some constraints that affected the

Country Dossier Togo
21
success of the initiative include the inadequate understanding and application of the concept of an IP, and the lack of effective technical backstopping support to facilitate the IPs (Arinloye et al., 2013).
1.5.2.2 West and Central African Council for Agricultural Research and Development
(CORAF/WECARD) Platforms
The West and Central African Council for Agricultural Research and Development (CORAF/WECARD) established six IPs in Togo, Niger and Mali to test improved white pepper varieties. The women platform actors, who organized themselves in a cooperative, earned US$ 9,000 in 2012, which increased to US$ 16,000 in 2013 (Njoya et al., 2015).
Platforms within the framework of the P og a e de P oductivité Ag icole e Af i ue de L’Ouest
Today, five IPs are in the process of development led by actors in the five economic region of Togo. These include:
Savannah Region: guinea fowl
Kara Region: rice
Central Region: soya
Plateau Region: small ruminants
Coastal Region: tomato
IP for the livestock-market gardening project:
A platform for Wangash cheese was developed within the context of the Milk and Market Gardening Project in 2011 in the eastern zone of the Coastal Region. It is still operational and needs to be evaluated and supported.
GIFS CORAF Platforms
To manage soil fertility in the west of the Savannah Region and in the east of Kara and Coastal Regions, IPs were developed as part of the implementation of CORAF s o petiti e p oje t Development and Promotion of Integrated Management of soil fertility through a production improved system conducive to increase the productivity of key food products i Be i , Togo a d Bu ki a Faso
Promoting crop integrated management technologies to increase plantain productivity among small
producers in Western and Central Africa
The CORAF/WECARD competitive fu ds p oje t P o oti g op i teg ated a age e t te h ologies to i ease pla tai p odu ti it a o g s all p odu e s i Weste a d Ce t al Af i a as implemented in Togo from 2011 to 2013, based on a Memorandum of Understanding for a sub-grant signed between the African Centre for Research on Banana and Plantain and the ITRA. The project was also implemented in Benin, Cameroon, Congo, Ghana, and the Democratic Republic of Congo. The following activities were undertaken to achieve the targeted objectives: (i) conduct a survey to define the baseline situation for the plantain baseline, (ii) creation of a pilot center to host the infrastructure needed to implement the activities, (iii) creation of IPs, (iv) capacity building for actors, (v) development and monitoring of experimentation plots and a seed manufacturer, (vi) support to regional and national monitoring and evaluation missions, (vii) coordination of activities.
There are achievements, but there were also challenges in the implementation of these activities, including: erratic weather, notably scarce rainfalls, which disturb the development of experimentation plots and plants, and other challenges related to platform operations.
1.5.3 Extension system and organizations
The public institutions providing extension services in Togo include the Ministry of Agriculture, Livestock and Fisheries, ITRA and Ecole “up ieu e d Ag o o ie, U i e sit de Lo . IT‘A is Togo s main agricultural research and development (R&D) agency, and hosting more than 70% of the agricultural researchers in the country in 2011. A farmer-based organization, Federation des Unions de

Program of Accompanying Research for Agricultural Innovation (PARI)
22
groupements des Producteurs de Café et de Cacao du Togo, also provides extension services. The Farmer Field School extension model has been used in a few agricultural projects. Extension services in Togo are presently limited by a decline in the number of extension officers, weak organization of producers, particularly of small-holder farmers, lack of harmonization of agricultural extension strategies, and lack of an extension policy.
1.5.4 Private Research and Development activities
Agricultural research in Togo is largely financed and undertaken by the national government through ITRA. Some private organizations such as the Groupe d A tio s et de ‘e he he pou un Développement Humain Durable, Union Chrétienne de Jeunes Gens, and Association pour la Promotio de l Ag oFo este ie have financed some projects in the past with funds from German and Belgian organizations as well as with internally generated resources (Stads and Adomefa, 2004). There is no known NGO or private-sector company conducting in-house ‘&D a ti ities i Togo. “o e NGO s or private companies, however, outsource their research to ITRA or the University de Lomé (Stads et al., 2014).
1.6 Key challenges, emerging needs and potentials in the agricultural sector
Challenges of Togo s agricultural sector include:
Climate change: For instance, the floods of 2010 caused 21 deaths, inundated 3,947 houses and destroyed 7744.24 ha of farms and several bridges. There is also erratic rainfall;
High rate of deforestation;
Limited access to improved seeds and fertilizers;
Limited access to credit and agricultural financing;
Very low agricultural productivity;
Land insecurity;
Weak extension and advisory services;
High rate of post-harvest losses (between 25% and 60% of production).
Additional issues that affect the agricultural sector directly or indirectly include human health and nutrition. Malnutrition rates in Togo are alarming: infant mortality rate is 78/1000, prevalence of weight insufficiency is 16.6%, growth delay is 29.7%, and 11.1% of babies are underweight. Excessive malnutrition and lack of micro-nutriments coexist. According to the 2010 STEPwise approach to Surveillance Survey report, 22% of Togolese people suffer from excessive malnutrition. In light of this problem and based on the recommendations and multiple significant commitments made by the state authorities, many strategies are envisioned and set as government priorities in the fight against malnutrition in all its forms.
1.7 Potential areas for investment in Togo
Based on the general approach presented in chapter 4 of Husmann et al (2015) and in pursuit of efficiency and effectiveness, investment by Germany into the agricultural and food sector are suggested in African countries that:
Show actual progress in sustainable agricultural productivity driven by related innovations, as indicated by comprehensive productivity measurement and innovation actions on the ground;
Have a track record of political commitment to foster sustainable agricultural growth, as indicated by performance under CAADP; and

Country Dossier Togo
23
Prioritize actions for hunger and malnutrition reduction and show progress where agricultural and rural development and nutrition interventions are likely to make a significant difference, as indicated by public policy and civil society actions.
Results of the assessment for Togo8:
Expected agricultural growth performance:
Togo has increased its agricultural growth by more than the annual 6% agricultural growth target defined by CAADP for four years only, between 2005 and 2014 (www.resakss.org).
In addition, total factor productivity in Togo has declined by 6% between 2001 and 2008 (Fuglie and Rada, 2011). This indicates that Togo´s innovation performance over this period was poor.
Government commitment:
Togo has a track record of political commitment to foster sustainable agricultural growth by being active in the CAADP process and having completed six of the eight steps in the CAADP process (www.resakss.org).
However, the Togolese government has not shown willingness to invest in agricultural sector. In no single year has the government invested more than 10% of total government expenditures (CAADP target) into agriculture between 2005 and 2014 (www.resakss.org).
In addition, Togo spends only 0.4 % of its agricultural GDP on agricultural R&D, which is much lower than the Sub-Saharan Africa average (www.asti.cgiar.org) and the African Union target value of 1% spent on R&D. This suggests that the ou t s o it e t to R&D into the agricultural and food sector is not yet sufficient.
Food and nutrition security progress and need:
Togo is prioritizing actions for hunger and malnutrition reduction and shows a slightly lower than 10% improvement in undernourishment between the years of 2001 and 2011 (FAO 2014).
In addition, Togo has a Global Hunger Index (GHI) score value of 13.9, reflecting a serious level of hunger (von Grebmer et al., 2014)9. This makes investment into the agricultural and food sector in Togo very urgent in order to fight the high rate of food insecurity.
Table 10: Togo performance indicators
Indicators Indicator
score
Overall
score
1. Number of years with more than 6% agricultural growth (2005 to 2014) 4 40
2. Percentage point change in TFP index between 2001 and 2008 -6 0
3. Number of years with more than 10% government expenditure (2005 to 2014)
0 0
4. Average share of agricultural GDP spent on R&D (2005 to 2011) in % 0.4 43 5. Steps in CAADP completed 6 75
6. Percentage point improvement in undernourishment between 2001 and 2011
9.8 60
7. Global hunger index (2014) 13.9 30
Total score (weighted)
35
Data source: Husmann et al (2015) Note: TFP refers to Total Factor Productivity
8 Details on the data sources and methodology used in the assessment can be found in Husmann et al. (2015) 9 GHI s o e Values less tha . efle t lo hu ge , alues f o . to . efle t ode ate hu ge , alues f o . to . i di ate a se ious le el of hu ge , alues f o . to . a e ala i g, a d alues of
. o g eate a e e t e el ala i g o G e e et al., 2014).

Program of Accompanying Research for Agricultural Innovation (PARI)
24
Based on this approach, investments into the agricultural and food sector of Togo are unlikely to have a significant effect on food and nutrition security improvements in the country. Overall, the economic, political, and social/nutrition framework in Togo does not seem to suggest increasing investments into the agricultural and food sector of the country.
Nevertheless, there are areas of potential in the agricultural sector, which include the large land area still not cultivated. Currently, only 45% of the 3.4 million cultivable hectares are under cultivation. There is high potential for rice production: an estimated 86,000 ha of land is suitable for irrigation and a total of 185,000 ha of lowlands is usable for rice production, but only 29,000 ha of that total has actually been developed.
The selection of which value chain to focus on is also determined by market access, i.e., transport intensive products should be promoted in areas that are well connected to markets, whereas remote areas should focus on low volume and livestock value chain segments. Figure 5 presents the average time (number of hours) it takes to reach the nearest market place of at least 20,000 people in Togo.
Figure 5: Distance to markets
Data sources: Hours to next market - HarvestChoice, 2015; Administrative areas: http://www.gadm.org, accessed 20.9.2015 Inland water bodies: http://www.diva-gis.org/gData (water bodies), accessed 20.9.2015
Country Dossier Togo
25
2 Most relevant value chains in the country
2.1 GIC value chains
2.1.1 Groundnut
Groundnut is one of the main leguminous crops in Togo. Groundnut farming is practiced in all regions of the country, but production is more developed in the northern regions of Savanes and Kara, which provide three quarters of the national output. The region of Plateaux is also another important production area for the crop. Groundnut production increased from 25,976 tons in 2000 to 40,663 tons in 2014 (FAOSTAT, 2017) and most of production is consumed locally and processed through informal channels.
2.1.2 Cashew
Large-scale cashew production in Togo started in 1960, with the introduction of collective fields managed by the Sociétés Régio ales d’A é age e t et de Développe e t to supply the parastatal company Togofruit. Following the closure of these companies, the industry went through a latent stage until the creation of a private nut processing plant in Tchamba, Cajou Espoir in 2004. According to the first census of farmers and cashew plantations in Togo (2015), the cashew value chain comprises 18,262 producers (9.6% are women), spread unequally over the four cashew producing regions. The Central Region and the eastern part of the Plateaux region, where more than 81% of producers are located, account for 7523 and 7391 producers, respectively. In terms of area dedicated to the cultivation of cashew, the same two regions have more than 86% of farms, with 9,643 ha for the Plateaux against 6,448 ha for the Central Region. The plantations consist mainly of small orchards, 46% have an area of about 0.5 ha. In the recent 2013/2014 crop year, the total production of cashew nuts in Togo was estimated at 6,268 tons of which over 89% came from the Central and the Plateaux Regions.
There is increasing interest in reviving the cashew industry in Togo since the sector has huge potential for job creation at either the production, processing or marketing level. The establishment of the processing plant Cajou Espoir is one such example. The company employed about 40 women who processed 12 tons of cashews in 2005. In 2014, it employed about 700 people, 75% of which were women, and processed about 2,400 tons of cashews. But in terms of exports, most of the raw nuts are exported to India while most processed white nuts are sold to partners in the United States and the European Union (Mi ist e de l Ag i ultu e, de l Ele age et de l H d auli ue (MAEH), 2015).
2.1.3 Soybean
Soybean cultivation has long remained marginal despite various development projects in the West African region at large. In the years between 1990 and 2000, soybean had been promoted through NGOs and Christian missions for the purpose of improving diets, especially for children. With the decreasing availability of cottonseed for processing into oil and sharp price spikes due to cottonseed meals shortages, soy is becoming a crop of high interest for farmers and millers. Soy is easy to produce and does not require much input investment (Dugué, 2010).
Soybean farming in Togo has led to some women boosting their income by cooking and selling soy-based products (e.g. doughnuts or tofu) in their communities. Togo has a service provider and producer organization (SPPO) known as Soja Nyo, an innovative mechanism that includes small producers in the soy supply chain. A French company, Jules Brochenin SA, i pa t e ship ith La el d O , is implementing a project aimed at producing and supplying quality organic soybeans in Togo. In 2014, they had about 2,783 smallholder producers working on 3,072 ha, and obtained a yield of 6,620 tons of organic soybean. With support from the programme Cadre Intégré Renforcé, the government of

Program of Accompanying Research for Agricultural Innovation (PARI)
26
Togo recently launched an ambitious project to improve the production of soybean for the period of 2015 to 2017. The project aims to contribute to increased export earnings and revenues from soy.
2.2 Other relevant value chains
The other relevant value chains besides those selected for the GICs are discussed in this subsection. In this case, relevance is based on, among other things, the extensive review of available literature on the crop, the importance of the crop in relation to share of area cultivated (harvested), production volume, and trade importance (import and export).
2.2.1 Cassava
In terms of cultivation area, cassava is the fourth most produced food crop in Togo after maize, sorghum and paddy rice, but ranks first in terms of quantity produced (see Table 6). Cassava production provides a good alternative strategy in cropping systems: cassava cultivation is possible on depleted soils, it does not require phytosanitary treatment or extensive care, and it is adopted in the framework of cultivated fallow system (Commission Nationale de la Coopération Décentralisée, 2013). Cassava and its derivatives are a main staple food in Togo and for many African countries. The Maritime, Central and Plateaux regions are the major growing areas. Cassava is cultivated on an area of 150,000 ha, and production has been steadily increasing from 700,697 tons in 2000 to 1,153,109 tons in 2014 (FAOSTAT, 2017). The significant growth in recent years can be attributed to the Togolese go e e t s effo t to oost the p odu tio of the op th ough the i ple e tatio of the Project for the development of Root and Tuber Plants by the Ministry of Development in 2009. The project, co-financed by the government and partners such as the Banque Populaire pou l Epa g e et le C dit, cost nearly one and a half billion FCFA10 (roughly 2,286,700 euros) and aimed at boosting cassava, yam and potato value chains, while working to reduce youth unemployment by integrating youth into the chains, organizing them into farmer groups and giving them access to credit (Akinocho, 2014).
2.2.2 Yam
Yam is the second most produced tuber in Togo. It is highly valued and an integral part of eating habits of Togolese households. Yam is celebrated in some communities (prefecture of Bassar and Ogou) as a traditional meal. The central region alone provides nearly 50% of national production. Yam production has been on the rise. Output rose from 563,286 tons in 2000 to 786,394 tons in 2014 (FAOSTAT, 2017). Ya is o su ed oiled, f ied, o ushed i to Fufu . Due to its la ge olu e a d lo a ket alue, yam is one of the least traded goods internationally. Some yams are exported to small ethnic markets in Europe and America.
2.2.3 Maize
Traditionally grown only in the southern regions of Togo, maize is now grown in the northern regions as well. Maize is one of the most important crops in Togo because it contributes to food security while providing economic revenues for farmers. Maize production stood at over 833,000 tons in 2014 with an annual growth rate of almost 4% since 1993. Annual area harvested and yield growth rates were 3% and 0.71% respectively for the same 20-year period (FAOSTAT, 2016), which means that cultivated areas are constantly increasing. In regions with two rainy seasons, corn facilitates the establishment and development of cotton (the main source of cash income) in a dual agricultural system well suited to this rainfall regime. For regions with one rainy season, corn appears to be a suitable crop because of the shortening of the rainfall cycle and because of low production of sorghum and millet, due to reduced soil fertility, particularly in the savannah region (Djagni, 1995).
10 FCFA = F a des Co u aut s F a opho es d Af i ue

Country Dossier Togo
27
2.2.4 Sorghum/Millet
Sorghum is widespread in the region of the Kara and Savannah and is grown primarily for the manufacture of a local drink called "tchoukoutchou". It is the second most produced cereal in quantity after maize (Danklou, 2006). Average production for the past 20 years amounts to almost 190,000 tons, and the crop is often associated with millet in the farming regions. Millet is only grown marginally, with a total output of about 39,700 tons in 2014.
2.2.5 Coffee/Cocoa
Coffee and Cocoa were introduced in Togo in 19th century colonial times by the Germans. Due to rich soils and a favourable climate, coffee and cocoa plantations were created in Kpalimé, Atakpamé and Badou in the Plateaux regions. Coffee is grown on an area of over 40,000 ha, while Cocoa farms extend over 30,000 ha (Ibid). Both crops constitute cash crops for farmers in the country despite the relatively small quantities produced at the national level. Production of coffee and cocoa in 2013 was 10,950 tons and 15,000 tons, respectively.
2.2.6 Cotton
Cotton is the main cash crop generating substantial revenues for producers. In recent years however, limited access to fertilizers and steady decline in cotton prices are either forcing farmers to grow alternative crops such as maize or groundnut or to expand their activities to livestock rearing in order to maintain their livelihood (Danklou, 2006). Cotton production has been on the decline for the past decade, with a decrease of output from 71,000 tons in 2003 to 24,300 tons in 2013. The main production areas are the Plateaux and Savanes regions.
2.3 Promising agricultural products and value chains
In addition to assessing the returns on investments into institutional innovations in Togo, analyses are also undertaken in order to choose the most promising value chains in the country. This analysis is important because it provides an objective indicator for priority value chains that would have the highest returns on investments into technological and institutional innovations. The trio objectives of PARI (to promote and support the scaling of proven innovations in the agri-food sector; to support and enhance investments in the GICs through research; and to contribute to the development of the agri-food sector in Africa and India through the identification, assessment and up-scaling of innovations) guide the selection of indicators. The indicators should thus focus on improving the food and nutrition security, reducing poverty and improving the market participation of the small holder farmers. Taking into account the availability of data and the purpose of the study, four indicators that focus on poverty and market potential are used to select the five most promising agricultural products from the long list of agricultural products that the country produces and sells. These indicators are:
1. Trade potential (Revealed Comparative Advantage (RCA) index): computed to identify value chains over which the country has revealed, albeit may not necessarily potential, comparative advantage in the export market. The revealed comparative advantage is an index used in international economics for calculating the relative advantage or disadvantage of a certain country in the production and export of a certain class of goods or services as evidenced by trade flows. It is based on the Ricardian comparative advantage concept. We use Balassa's measure of RCA to determine the competitiveness of selected agricultural products in overseas export markets. In the present ase, the ‘CA i de o pa es the sha e of a gi e ag i ultu al p odu t i the ou t s e po t
basket with that of the same product in total world exports.
2. Yield gap: used to assess the expected return of the envisaged investment on the given country value chains. The yield gap of a crop grown in a certain location and cropping system is defined as the difference between the yield under optimum management and the average yield achieved by

Program of Accompanying Research for Agricultural Innovation (PARI)
28
farmers. A standard protocol for assessing yield potential and yield gaps is applied for some crops based on best available data, robust crop simulation models. It is a powerful method to reveal and understand the biophysical opportunities to meet the projected increase in demand for agricultural products.
3. Average yield growth: used to examine the potential of the product for poverty reduction. The most widely used indicator of crop productivity is production per unit of land (also referred to as crop yield). Average yield growth may reduce poverty in the following ways: (1) higher yield implies higher surplus product that could be sold in the market and thereby increase farmers income, (2) higher surplus product mean large quantity of food supplied to urban and rural market at a relatively lower price which in turn reduces urban and rural food poverty, (3) higher agricultural productivity will stimulate growth in the non-agricultural sector through its strong backward and forward linkage. For example, it boosts growth in the industry sector by freeing agricultural labor a d edu i g u a age p essu e Le is, , a d ag i ultu e s fu da e tal ole i sti ulati g a d sustai i g e o o i t a sitio , as ou t ies a d poo people s li elihoods) shift away from being primarily agricultural towards a broader base of manufacturing and services (DFID, 2004).
4. Total production of the crop as a share of total supply (production +imports) is also used to assess the relevance of investing on that crop. Because it signals whether the agro-ecological system is suitable for the production of that crop in meeting the global demand for that particular crop. The ratio of production to total supply also illuminates the degree of integration of the producers that particular crop, small holder farmers in most African countries cases, into markets. The extent to which small holder farmers are able to participate in both input and output markets, and the functionality of those markets, are key determinants of their willingness and ability to increase marketable surpluses (Arias, 2013). Across the developing world, smallholders farm in diverse agro-climatic systems which together with their assets and skills, shape their economic lives. Markets and the extent to which they are functioning well, also play a determining role.
Note: The share of production of that particular crop over the total crop production is another key indicator considered in this study while assessing the relevance of investing on a particular crop in a country. This indicator is used as an eliminating criterion. If the share of a given crop out of total crop production is less than 0.5 %, we consider it as less relevant and exclude from the list of most promising value chains. The summary of the five most promising value chains based on the RCA index, average yield growth and relevance of crop is reported in Table 11 below. The production share, RCA index, actual yield growth and relative yield gap for the GIC value chain(s) is also reported at the bottom of the table, when they are not included in the list of the first five most promising value chains.

Country Dossier Togo
29
Table 11: Selection of promising agricultural products /value chains
Rank by RCA Rank by yield progress** Rank by relevance of crop
Rank Name of
agricultural
product
RCA
index
(2011)*
Name of the
crop
Average
annual
yield
growth
(2005 to
2012)
Name of
agricultural
product
Production
share of
supply
(2011)*
1 Cocoa, beans 32 Sweet potatoes 26 Cottonseed 146 2 Cake,
cottonseed 15 Seed cotton 7 Nuts and
products 117
3 groundnuts 14 Sorghum 3 Cassava, products
115
4 Flour, roots and tubers
5 Rice, paddy 3 Cocoa Beans
111
5 Sesame seed
2 Groundnuts, with shell
1 Yams 103
Cashew nuts, with shell
1.04 Soybeans 0.28 Soybeans 100
Cake, soybeans 0.00 Cashew nuts, with shell
-0.13 Groundnuts (Shelled)
100
Source: *Own computation based on FAO 2015 data. Note: **a minimum of 0.5% production (volume) share threshold is used as a screening (crop relevance) criteria.
Results of assessment (Table 11):
The trade potential (RCA index) is above 1 for cocoa beans, cotton seed, groundnuts (GIC selected value chain), roots and tubers, and sesame seed. This indicates that Togo has a comparative advantage in the export of these commodities. The RCA value for one of the GIC selected value chain, cashew, is also above 1, once again unveiling the country´s revealed comparative advantage in the export of cashew. On the other hand, the revealed comparative advantage index for the other GIC-selected value chain, soybean, is less than 1, indicating that Togo has a comparative disadvantage in the export of these crops;
In Togo, the average yield progress of all the relevant crops (those that satisfy the 0.5% production volume share) except sweet potatoes11 was either modest or dismal over the CAADP period (2005 to 2012). In relative terms, the yield performance indicating progress suggests that sweet potatoes and cotton seed are the most promising crops in Togo. The GIC-selected value chains experienced a dismal yield growth performance;
In terms of relevance (production share of supply) the leading products are cottonseed, nuts and products, cassava and products, cocoa Beans and products and yams. The total production of all of these products meets the total demand. The total supply of two of the GIC-selected products (soybeans and groundnut) is domestically produced.
2.4 Summary on the selection of agricultural products and value chains
This chapter (chapter 2) has presented different relevant and important value chains in Togo based on different criteria, which resulted in the selection of different value chains. In summary, the three top value chains – GIC selected value chains, other relevant value chains, and those identified by analysis of promising agricultural products and value chains – are presented in Table 12. The summary table
11 The average yield growth of sweet potatoes would have been only 6%, had the 2005 yield growth, which is 145%, not been truncated.

Program of Accompanying Research for Agricultural Innovation (PARI)
30
shows that only one of the GIC-selected value chains (groundnut) is identified as promising by the analysis of promising agricultural products and value chains. However, a number of overlaps in the value chains is shown between the analysis of promising agricultural products and value and the literature review. These products/value chains are cassava, sorghum, cocoa and cotton.
Table 12: Summary of all value chains
GIC value chains Other value
chains
Promising agricultural products and value chains (top 3)
RCA Yield progress Relevance of
crop
Groundnut Cassava Cocoa, beans Sweet potatoes Cottonseed
Cashew Yam Cake, cottonseed Seed cotton Nuts & products
Soybean Maize Groundnuts Sorghum, Rice paddy
Cassava, products
Sorghum/Millet Coffee/Cocoa Cotton
Source: Authors o pilatio
3 Innovations in value chains in the past 20 years
3.1 Main limiting factors
The limiting factors include:
Decline total agricultural R&D spending in Togo;
Only a very limited amount of the funding ITRA receives from the government is allocated to actual research programmes; ITRA is therefore highly dependent on unstable donor support (Stads et al., 2014);
Weak extension and advisory services;
Low productivity in smallholder farming systems.
The cashew sector, much like many other crops in general, is confronted to the following main problems:
Lack of organization of the value chain and its actors;
Lack of formal business relationships between actors;
Poor control of good agricultural practices;
Lack of improved plant material;
Difficult access to financing;
Aging and neglect of orchards planted by Togofruit.
Other structural and social constraints include limited access to land for some producers, especially women, lack of market regulations and policies to boost the sector and low levels of technical and economic knowledge and research, specifically on cashew (MAEH, 2015).
3.2 Important value-chain related and cross-cutting innovations
In this section, we describe some of the key innovations that have been initiated in selected value chains in Togo in the last 20 years. The described innovations are considered significant or beneficial because of widespread adoption, proven positive impact on increasing productivity, increasing incomes, adapting to the environmental challenges (such as drought), creating employment etc.

Country Dossier Togo
31
3.2.1 GIC value chains
In Togo, SPPOs are a new type of grouping that have been established with support from the Centre International de Développement et de Recherche, to enable small producers to gain sustainable access to high value markets by involving them in strategies and decisions about what happens downstream in the supply chain (Pernot du Breuil and de Romémont, 2008). A well-known example of such SPPO in Togo is Soja Nyo. Benefits from membership in the SPPOs for producers include higher and secure income, and better nutrition. It enables farmers to stock food products and sell them when prices are higher. It has also improved their social capital.
Cashew
So far, the Farmer Business School (FBS) approach is the main support tool for cashew producers in Togo. This approach was originally developed in 2009 in the context of the cocoa economy through a partnership between the Deutsche Gesellschaft für Internationale Zusammenarbeit (GIZ), the German development agency, and the Bill and Melinda Gates Foundation. It was then adapted to the cashew sector by extension services ICAT, the Rural Development Program, ProDRA and other partners. The FBS approach aims to develop the entrepreneurial and basic business skills of farmers, and educate them on market opportunities and ways to improve productivity, family income and nutrition. FBS provides the producers with good practices on different aspects of cashew production and management tools for their associations. The implementation of the approach is done by ICAT and othe o ga izatio s su h as the Togo s fa e s Mo e e t and the Regional Union of Grain Producers Organizations, with the support of the GIZ-ProDRA. Togo currently has a pool of 35 trainers for cashew FBS. More than 1,000 cashew producers, 21% of which are women, have been trained since 2013 (MAEH, 2015).
3.2.2 Other value chains and cross-cutting innovations
2 SCALE project
The 2 SCALE12 project, which was funded by the Netherlands government and implemented jointly by International Fertilizer Development Center, International Centre for development oriented Research in Agriculture and Base of the Pyramid Innovation Center, created a domestic market and value chain for yellow maize to reduce importation of yellow maize for poultry feed in Togo. In the 2 SCALE project, poultry producers buy grain from maize farmers, and sell poultry manure back to the farmers as organic fertilizer. The project has created new income streams for small-scale maize farmers, and helped poultry producers stay in business despite a dramatic increase in feed costs. For instance, in 2009, maize farmers involved in the project sold 114 tons of yellow maize to poultry producers, earning e e ues of € , . I , the sold to s, ea i g o e € , .
Promotion of Science and Technology for Agricultural Development (PSTAD) project
CORAF/WECARD created maize value chains in Togo within the PSTAD project with technical backstopping by the International Institute of Tropical Agriculture. Maize was the selected crop because of its importance to food se u it as the egio s ai staple food op a d its importance as a ajo sou e of p odu e s i o es.
Other innovation projects
Innovation projects have also been undertaken for several other crops to improve their resistance to disease and climatic conditions, to increase yield and nutritional quality, or for integrated soil management purposes. These improved crops are varieties of sorghum, rice, cassava, yam, etc. Additionally, improved production technology of yam setts, rapid multiplication of cassava, improved fallow with legume cover (Mucuna, cajanus pigeon), manufacture and use of mineral and organic fertilizers based on identified deficiencies and various types of culture technologies and practices were
12 www.2scale.org

Program of Accompanying Research for Agricultural Innovation (PARI)
32
developed. Processing efforts such as moringa-fortified food, processed yam, maize and cassava flours, cheese, jam, tomato juice, and sparkling palm wine (DEHACHAMPE) production can be highlighted (Bonfoh et. al., 2016).
Service provider and producer organizations
SPPOs are considered one of the most promising approaches to support innovation. By facilitating the grouping of framers, SPPOs give small producers a better understanding and access to high value markets. SPPOs also enable a greater collaboration between actors along the value chain. In addition to SPPOs, FBS have also had a positive impact o fa e s li elihoods he e e the e e implemented. With increased skills in business and management, producer associations are better equipped to effectively play their role in the sectors they are involved in. Hence, these approaches, along with new agricultural technologies dissemination efforts undertaken by other extension services, p o ide g ou d fo i p o i g s allholde fa e s li i g o ditio s a d e e ues.
Another promising approach to enhance innovation in Togo is IPs. They have indeed contributed to improving access to inputs, efficient production technologies, crop products, and have created added value for the benefit of the different links of the developed value chains, particularly for small farms. The integration of organic matter, including poultry manure, allows producers to triple the productivity of their maize plots (2 tons / ha to 6.2 tons / ha by 2018). We note an improvement in yields, which producers intend to increase further. The platforms have enabled some producers to benefit from investment credit of over 19 million FCFA from the Group of Savings and Credit Banks of Village Associations microfinance, and numerous training courses on management and cooperative agricultural enterprises.
The milk platform has enabled stakeholders to benefit from various training and capacity building initiatives. In terms of production, the demand for raw material (milk) has increased significantly to reach a capacity of 100 liters daily. Revenues from cheese sales have helped meet the social, health, educational needs of women, and to empower them within their households. The market is currently being extended to Benin. Furthermore, platforms enable members to have access to microfinance institutions and companies that sign purchase contracts with them through the platforms. Others saw their numbers grow over time because of the services provided to members.
The challenge for IPs is to remain functional after the funding from partners ends. Hence, efforts to establish long lasting functional IPs need to take into account:
A well identified entry point;
A good organization of stakeholders;
Openness to new technology
The existence of a well-targeted market;
Contractual sales;
Technical and financial support;
Respect of sales contracts;
A strong market demand (Bonfoh et. al., 2016).
4 Suggestions for collaboration
Efforts that will yield good agricultural innovation in Togo should pay attention to the issues of:
Low productivity of the smallholder system, which can be addressed through the generation, the dissemination and the use of new and improved production technologies. This will call for strong support of the research system to generate the needed technologies;

Country Dossier Togo
33
The development of effective agricultural input delivery systems to meet the demand of smallholders;
The development of an efficient policy system that engages all stakeholders in developing supportive policies for trade within and outside the country;
Encouraging sustainable market orientation and the establishment of economic structures, such as producer cooperatives, supply contracts, and business services.
The innovation systems approach should be entrenched as the main mode for implementing agricultural R&D activities.
There is scope for a fruitful partnership and collaboration between the countries of Germany and Togo. The partnership should include building relationships with the Ministry of Agriculture, Livestock, and Waterworks; Research institutions (ITRA, Universities ; De elop e t i stitutio s ICAT ; fa e s organizations; civil societies; non-governmental organizations and the private sector.
Partnership opportunities in specific areas could include:
Value addition and conservation of products: Ge a s te h ical know-how can be used along with local indigenous knowledge in order to encourage the processing of local products.
Productivity, soil fertility management and mitigation of the effect of climate change: In light of the evidence of declining soil fertility, particularly in the North of the country, collaboration in these areas can help reverse the situation, therefore increasing the yields of crops that feed heavily on soil nutrients, such as cassava and maize. The help here will focus on finding ways of increasing soil fertility by use of cost-effective and environment-friendly techniques adapted to local conditions.
Capacity building: capacity can be built through training farmers, students and technicians in the fields of crop production, business, management, food technology and processing.
Policy: Policy development for certain agricultural sectors can be informed by the results of collaborative agricultural projects in Togo.
Some specific projects already initiated in some of the above-mentioned areas are:
GIZ: Pineapple and poultry value chains in the Coastal region, coffee-cocoa in Plateaux Region, cashew in the Central region; training on agricultural entrepreneurship, training field.
FARA: Concept of Integrated Agricultural Research for Development (IAR4D); dissemination of technologies and agricultural good practices, promotion of IPs.
CORAF/WECARD: Promotion of crop integrated management technologies.
Future research efforts must be aligned with national policies for agricultural development and take into consideration the different sectors defined as key sectors by the Togolese government. PNIASA mentions areas such as plant industry, animal and fish production, institution strengthening and sector coordination, and agricultural capacity building. Furthermore, research that aims to create strategies to reduce poverty, food and nutrition insecurity, as well as the effects of climate change would prove important and essential, provided that they are adapted to the particular context of Togolese ag i ultu e a d the eeds of the ou t s s allholde fa e s.

Program of Accompanying Research for Agricultural Innovation (PARI)
34
References
2 SCALE Project. Homepage. Accessed from: www.2scale.org
Aki o ho A. . Le Togo et l a e t su les fili es de p odu tio de tu e ules. Agence Ecofin.
Accessed online on September 23, 2016 from: http://www.agenceecofin.com/gestion-publique/2011-24493-le-togo-met-l-accent-sur-les-filieres-de-production-de-tubercules
Arias, P., Hallam, D., Krivonos, E., & Morrison, J. 2013. Smallholder integration in changing food markets. Food and Agriculture Organization of the United Nations, Rome.
Arinloye D.A, Coulibaly O. Sounkoura A. and Sayang S. 2013. Value Chain Approach-Based Platforms: Innovation Platforms for Technology Adoption in Africa. MEAS Case Study Series on Human Resource Development in Agricultural Extension
ASTI. 2017. Homepage. Accessed from: https://www.asti.cgiar.org/
Bhat, R. V. and Vasanthi, S. 2003. Mycotoxin food safety risk in developing countries. In: Unnevehr, L. J. (ed.). 2020 Focus 10: Food safety in food security and food trade. IFPRI, Washington DC
Bonfoh B., Todje A. and Gbakenou K. I. (2016). Status of Agricultural Innovations, Innovation Platforms, and Innovations Investment. 2015 PARI project country report: Republic of Togo. Accra and Bonn: Forum for Agricultural Research in Africa (FARA) and Center for Development Research (ZEF), University of Bonn.
Cafiero, C. 2014. The excessive (and wasteful) consumption of food. Technical note 3. In: IFPRI. Global Nut itio ‘epo t : A tio s a d A ou ta ilit to A ele ate the Wo ld s P og ess o Nutrition. IFPRI, Washington, DC
Commission Nationale de la Coopération Décentralisée (CNCD). 2013. Atlas français de la coopération décentralisée et des autres actions extérieures: Togo. Accessed online on September 23, 2016 from: https://pastel.diplomatie.gouv.fr/cncdext/dyn/public/atlas/ detailProjet.html?criteres.prjId=9650
Da klou D.K. . L ag i ultu e du Togo: aspe ts g au . I stitut “up ieu d Ag i ultu e de Lille, Lille, France.
DFID. . Ag i ultu e, G o th a d Po e t ‘edu tio , http://www.dfid.gov.uk/Documents/publications/agri-poverty-reduction.pdf
Djagni K. 1995. Expansion de la culture du maïs en zone cotonnière du Togo: craintes et espoirs. Archives de documents de la FAO. FAO, Rome, Italie.
Dugué P. 2010. Développement de systèmes de production durables dans les projets vivriers. Etude d aluatio FA‘M & CI‘AD. pages.
Egal, S., Hounsa, A., Gong, Y. Y., Turner, P. C., Wild, C. P., Hall, A. J., Hell, K., Cardwell, K. F. 2005. Dietary exposure to aflatoxin from maize and groundnut in young children from Benin and Togo, West Africa. International Journal of Food Microbiology, 104(2), 215-24.
FAO. 2014. The State of Food Insecurity in the World 2014. Rome: FAO, WFP, IFAD.
FAO. 2016. Food security indicators. Retrieved June 17, 2016, from http://www.fao.org/economic/ess/ess-fs/ess-fadata/en/
FAOSTAT. 2017. Food and agriculture data. Last accessed on January 18, 2017 from: http://www.fao.org/faostat/en/#home
Fuglie K. a d ‘ada N. , „Poli ies a d p odu ti it g o th i Af i a ag i ultu e , i Ag i ultu al ‘&D: I esti g i Af i a s Futu e. A al zi g T e ds, Challe ges a d Oppo tu ities, Bd. (ASTI/IFPRI-FARA Conference, Accra, Ghana: Citeseer, 2011), http://citeseerx.ist.psu.edu/viewdoc/download?doi=10.1.1.371.9698&rep=rep1&type=pdf.
Gong, Y. Y., Cardwell, K., Hounsa, A., Egal, S., Turner, P. C., Hall, A. J., Wild, C. P. 2002. Dietary aflatoxin exposure and impaired growth in young children from Benin and Togo: cross sectional study. British Medical Journal, 325(7354), 20-21.

Country Dossier Togo
35
Gong, Y. Y., Egal, S., Hounsa, A., Turner, P. C., Hall, A. J., Cardwell, K. F., Wild, C. P. 2003. Determinants of aflatoxin exposure in young children from Benin and Togo, West Africa: the critical role of weaning. International Journal of Epidemiology, 32(4), 556-562
Gong, Y., Hounsa, A., Egal, S., Turner, P. C., Sutcliffe, A. E., Hall, A. J., Cardwell, K., Wild, C. P. 2004. Postweaning exposure to aflatoxin results in impaired child growth: a longitudinal study in Benin, West Africa. Environmental Health Perspectives, 112(13), 1334-1338
HarvestChoice. 2015. Travel time to nearest town over 20K (mean, hours, 2000). International Food Policy Research Institute, Washington, DC., and University of Minnesota, St. Paul, MN. Available online at http://harvestchoice.org/data/tt_20k
HarvestPlus. 2017. What we do: crops. Accessed online at http://www.harvestplus.org/what-we-do/crops
Hell, K., Gnonlonfin, B. G. J., Kodjogbe, G., Lamboni, Y., Abdourhamane, I. K. 2009. Mycoflora and occurrence of aflatoxin in dried vegetables in Benin, Mali and Togo, West Africa. International Journal of Food Microbiology, 135 (2), 99-104
Husmann C., von Braun J., Badiane O., Akinbamijo Y., Fatunbi A.O., Virchow D. 2015. Tapping Potentials of Innovation for Food Security and Sustainable Agricultural Growth – an Africa-wide Perspective. Program of Accompanying Research for Agricultural Innovation (PARI). Bonn: Center for Development Research.
ICF International. 2015. The DHS Program STATcompiler. Last accessed on September 12, 2016 from: http://www.statcompiler.com/en/
IFPRI. 2015. Global Nutrition Report 2015: Actions and Accountability to Advance Nutrition and Sustainable Development: Nutrition Country Profiles. IFPRI, Washington DC.
Imdad, A., Herzer, K., Mayo-Wilson, E., Yakoob, M. Y. and Bhutta, Z. A. 2010. Vitamin A supplementation for preventing morbidity and mortality in children from 6 months to 5 years of age. Cochrane Database of Systematic Reviews, 12, CD008524
Imdad, A., Yakoob, M. Y., Sudfeld, C., Haider, B. A., Black, R. E., Bhutta, Z. A. 2011. Impact of vitamin A supplementation on infant and childhood mortality. BMC Public Health, 11(Suppl 3), S20
Lewis, W. A. (1962). Education and economic development. Caribbean Quarterly, 7(4), 171-184.
Mi ist e de l Ag i ultu e, de l Ele age et de l H d auli ue MAEH . . A al se de la fili e anacarde du Togo. 44 pages.
Mi ist e de la Pla ifi atio , du D eloppe e t et de l A age e t du Te itoire (MPDAT), Ministère de la Santé (MS) and ICF International. 2015. Enquête Démographique et de Santé au Togo 2013-2014. MPDAT, MS and ICF International, Rockville, Maryland.
Must, A. and McKeown, N. M. 2012. The disease burden associated with overweight and obesity. In: De Groot, L. J., Beck-Peccoz, P., Chrousos, G., Dungan, K., Grossman, A., Hershman, J. M., Koch, C., McLachlan, R., New, M., Rebar, R., Singer, F., Vinik, A., and Weickert, M. O. (editors). Endotext. MDText.com, Inc., South Dartmouth (MA). Retrieved October 10, 2016, from https://www.ncbi.nlm.nih.gov/books/NBK279095/
Njoya A., Kuiseu J., Sanyang S., Muluh G.H. and Roy-Macauley H. .2015. A paradigm shift in agricultural research for development: Innovation Platforms as a vehicle for change and impact in Smallholder Agriculture in West and Central Africa
PAHO/WHO. 2003. Guiding principles for complementary feeding of the breastfed child. PAHO, Washington DC.
Pernot du Breuil M. and de Romémont A. 2008. Promoting Service provider and producer organisations (SPPOs): A case study on the Soja Nyo SPPO in Togo, Regoverning Markets Innovative Practice series, IIED, London.
Rapsomanikis, G. 2014. The economic lives of smallholder farmers; An analysis based on household surveys. Rome: Food and Agriculture Organization.

Program of Accompanying Research for Agricultural Innovation (PARI)
36
ReSAKSS. 2017. Homepage. Accessed from: http://resakss.org/
Scaling Up Nutrition. 2017. Homepage. Accessed from: http://scalingupnutrition.org/
Stads G.-J. and Adomefa K. 2004. Togo. ASTI Country Brief No. 16, 8 pages.
Stads G.-J., Adabe K.E., and Domgho L.V.M. 2014. Togo: Agricultural R&D Indicators Factsheet, asti.cgiar.org/togo
Stevens, G. A., Bennett, J. E., Hennocq, Q. et al. 2015. Trends and Mortality Effects of Vitamin A Deficiency in Children in 138 Low- and Middle-Income Countries: Pooled Analysis of Population-Based Surveys. Lancet, 3(9), e528–e536
UNICEF. 2013. Improving child nutrition: The achievable imperative for global progress. UNICEF, New York.
UNICEF/WHO/World Bank. 2016. Levels and Trends in Child Malnutrition: UNICEF-WHO-The World Bank: Joint Malnutrition Estimates, August 2016. New York, Geneva, and Washington, DC. Retrieved September 26, 2016, from http://who.int/nutgrowthdb/estimates2015/en/
University of Oxford (2015). The Malaria Atlas Project. http://www.map.ox.ac.uk. Accessed 22 Nov 2016
USDA (US Department of Agriculture, Agricultural Research Service, Nutrient Data Laboratory). 2016. USDA National Nutrient Database for Standard Reference, Release 28 (Slightly revised). Retrieved October 5, 2016, from http://www.ars.usda.gov/ba/bhnrc/ndl
von Grebmer K., Saltzman A.,. Birol E, Wiesmann D., Prasai N., Yohannes Y., Menon P., Thompson J. and Sonntag A. 2014. Global Hunger Index 2014: The Challenge of Hidden Hunger. Bonn/Washington D.C./Dublin: Welthungerhilfe, International Food Policy Research Institute (IFPRI), Concern Worldwide.
WHO. 1995. Physical Status: The Use and Interpretation of Anthropometry. Report of a WHO Expert Committee. Technical Report Series 845, WHO, Geneva.
WHO. 2000. The Management of Nutrition in Major Emergencies. WHO, Geneva.
WHO. 2003. Nutrition and the prevention of chronic diseases. Report of a Joint WHO/FAO Expert Consultation. Technical Report Series 916, WHO, Geneva.
WHO. 2005. Guiding principles for feeding non-breastfed children 6-24 months of age. WHO, Geneva.
WHO. 2010. Indicators for Assessing Infant and Young Child Feeding Practices, Part 1: Definitions. WHO, Geneva.
WHO. 2015a. Global Health Observatory Data Repository: Adult overweight and adult obesity. Retrieved September 15, 2016, from http://apps.who.int/gho/data/node.main.A897A?lang=en and http://apps.who.int/gho/data/node.main.A900A?lang=en
WHO. 2015b. The Global Prevalence of Anaemia in 2011. WHO, Geneva.
WHO/FAO/UNU. 2007. Protein and amino acid requirements in human nutrition. Report of a joint FAO/WHO/UNU expert consultation. Technical Report Series 935, WHO, Geneva.
World Bank. 2006. Repositioning Nutrition as Central to Development: A Strategy for Large-Scale Action. World Bank, Washington DC.
World Bank.2017. Country data. Retrieved from http://data.worldbank.org/country

Country Dossier Togo
37
Annex A: Background Information on Nutrition
This annex provides background information on diet quantity and quality, child feeding practices and nutrition status (including micronutrient deficiencies) and definitions of the food and nutrition security indicators presented in Chapter 1.4.2.
Background on food and nutrition security
Diet quantity: Dietary energy supply per capita is an indicator of diet quantity that can be gauged against a populatio s a e age dieta e e g e ui e e t. The data a e ased o FAO s food ala e sheets that estimate the quantity of each food item available for human consumption at the national level. It has to be emphasized that supply does not equal intake: Supply includes food that households feed to domestic animals or pets and food that they waste. Also, a sufficient average supply of dietary energy (or a nutrient such as protein) may leave those parts of the population deprived that have greater-than-average requirements or lower-than-average intakes. Indicators of undernourishment and food over-acquisition seek to consider the distribution of dietary energy consumption in the population and the minimum/maximum requirements of the average individual in a country (Cafiero, 2014).
Diet quality: Assessing diet quality requires a look at the composition of the diet. In the absence of atio al food o su ptio su e s fo ost ou t ies, data f o FAO s food ala e sheets a e used.
The percentage of dietary energy supply from starchy staples (cereals, roots and tubers) is a rough indicator of diet quality: generally, the higher this percentage, the lower the micronutrient density of the diet; starchy staples are rich in carbohydrate and good sources of dietary energy, but they are usually not very micronutrient-rich. Non-staple foods are important for micronutrient and protein supply: Foods of animal origin are good sources of high-quality protein and vitamin A as well as highly bioavailable iron and zinc (meat, fish) and calcium (milk, small fish eaten whole with bones). Pulses and nuts are also good sources of protein and micronutrients. Fruits and vegetables provide a range of micronutrients while generally contributing little dietary energy (USDA, 2016).
The shares of dietary energy supply from carbohydrate, protein, and fat roughly indicate whether the diet is balanced in terms of its macronutrient composition. The recommended shares of dietary energy are 55-75% for carbohydrate, 10-15% for protein, and 15-30% for fat (WHO, 2003). It should be noted that these shares do not reveal whether dietary energy supply per capita and average protein supply are insufficient, sufficient, or excessive in absolute terms. A diet that meets the average dietary energy requirement for Africa as a whole (2200 kcal/day according to FAO, 2016) and provides 55-82.5 g protein per day and 36-73 g fat per day contains the recommended shares of 10-15% of dietary energy from protein and 15-30% of dietary energy from fat. For an adult weighing 60 kg, a protein intake of 50 g/day is considered sufficient, and 60 g/day for an adult weighing 75 kg. No safe upper limit of protein intake has been established, but it is unlikely that intakes of twice the recommended level pose any risk (WHO/FAO/UNU, 2007).
Child feeding practices: Feeding practices are determined by local food availability and household access to food, but also by maternal knowledge and care. Breastfed and non-breastfed children aged 6-23 months should eat foods rich in iron (meat, fish, or eggs) and fruits and vegetables rich in vitamin A daily, and consume at least 4 out of 7 food groups every day (PAHO/WHO, 2003; WHO, 2005; WHO, 2010).
Nutrition status: Household food se u it , the health e i o e t, a d othe s a i g apacity i flue e hild e s dieta i takes a d the isk of i fe tio , a d the e thei ut itio a d health status (UNICEF, 2013). Wasting, or acute undernutrition, is the result of recent rapid weight loss or the failure to gain weight that is caused by inadequate diets or infection. Stunting is the failure to grow adequately and results from chronic or recurrent undernutrition or infection (UNICEF/WHO/World Bank, 2016). Stunting in early childhood can have irreversible consequences, such as impaired motor and cognitive development, shorter adult height, lower attained schooling, and reduced adult income, whereas wasting carries a higher mortality risk (Victora et al. 2008; Black et al. 2013; Olofin et al. 2013). Overweight in children and overweight and obesity in adults occur when dietary energy intakes exceed

Program of Accompanying Research for Agricultural Innovation (PARI)
38
dietary energy requirements. Overweight and obesity increase the risk of noncommunicable diseases (UNICEF/WHO/World Bank, 2016).
Micronutrient deficiencies arise from insufficient intakes or absorption of essential vitamins and minerals. Major causes are poor diets, diseases, and increased requirements during life stages such as early childhood, pregnancy, and lactation. Micronutrient deficiencies are not limited to poor populations with inadequate dietary energy intakes, but may coexist with overweight and obesity in individuals and communities. Measuring micronutrient deficiencies poses challenges: There is often a need to resort to proxy indicators and large data gaps persist. Anemia, for example, is used as a proxy indicator for iron deficiency, although only about half of the global burden of anemia can be attributed to iron deficiency. Iron deficiency anemia impairs cognitive and motor development, causes fatigue and low productivity, and may result in low birth weight and increased maternal and perinatal mortality if pregnant women are affected (WHO 2015b). Whenever survey data on anemia prevalence are not available, modeled estimates from WHO (2015b) are used. Vitamin A deficiency increases the risk of vision problems, infectious diseases, and death among children (Imdad et al., 2010). Without exception, the data on vitamin A deficiency that are presented in this dossier are modeled estimates (Stevens et al., 2015, quoted in IFPRI, 2015).13
Table A1: Cutoffs to identify nutrition problems of public health significance in children
Category of public health significance
Stunting Wasting Overweight Iron deficiency anemia
Severe ≥ ≥ ≥ ≥ Moderate 30-39 10-14 5-9 20-39 Mild 20-29 5-9 3-4 5-19
Source: Adapted from World Bank (2006) and based on data from WHO (1995) and WHO (2000) Notes: The cutoffs for public health significance were applied to prevalence rates of stunting, wasting, overweight and iron deficiency anemia (estimated from anemia prevalence) that were rounded to the first decimal. In the tables in Chapter 1.4.2, the data have been rounded to integers, which may lead to seeming contradictions: In a region where 29.8% of children under five were stunted (30% if rounded), stunting would be considered a mild public health problem, and in a region where 30.3% of children under five were stunted (also 30% if rounded), stunting would be considered a moderate public health problem.
Indicator definitions
Dietary energy supply: National average energy supply, expressed in kcal/caput/day (FAO, 2016).
Average dietary energy supply adequacy: Dietary energy supply expressed as a percentage of the a e age dieta e e g e ui e e t. Ea h ou t s a e age suppl of alo ies fo food o su ptio is divided by the average dietary energy requirement estimated for its population to provide an index of adequacy of the food supply in terms of calories (FAO, 2016).
Prevalence of undernourishment: Probability that a randomly selected individual from the population consumes an amount of calories that is insufficient to cover her/his energy requirement for an active and healthy life (FAO, 2016). This indicator seeks to estimate of the percentage of individuals in the population who are chronically undernourished because they fail to meet their minimum dietary energy requirements on a consistent basis.
Prevalence of food over-acquisition: Percentage of individuals in a population who tend, on a regular basis, to acquire food in excess of their maximum dietary energy requirements (FAO, 2016). Dietary energy supply from cereals, roots and tubers: Percentage of dietary energy supply provided by cereals, roots and tubers (FAO, 2016). A higher share of dietary energy supply from cereals, roots and tubers is generally associated with a lower micronutrient density of the diet.
13 Iodine deficiency disorders are an important public health problem in many countries. They are not discussed here because salt iodization, the main prevention and control strategy, is not related to agricultural value chains.

Country Dossier Togo
39
Dietary energy supply from carbohydrate: Percentage of dietary energy supply provided by carbohydrates, calculated by subtracting dietary energy supply from protein and dietary energy supply from fat from 100%.
Dietary energy supply from protein: Percentage of dietary energy supply provided by protein, calculated as average protein supply times 4 kcal/g divided by total dietary energy supply.
Dietary energy supply from fat: Percentage of dietary energy supply provided by fat, calculated as average fat supply times 9 kcal/g divided by total dietary energy supply.
Average protein/fat supply: National average protein/fat supply, expressed in g/caput/day (FAO, 2016).
Minimum dietary diversity: consumption of 4+ food groups: Percentage of children aged 6-23 months fed four or more food groups in the 24 hours preceding the survey. The food groups are 1) infant formula, milk other than breast milk, cheese or yogurt or other milk products; 2) foods made from grains, roots, and tubers, including porridge and fortified baby food from grains; 3) vitamin A-rich fruits and vegetables (and red palm oil); 4) other fruits and vegetables; 5) eggs; 6) meat, poultry, fish, and shellfish (and organ meats); 7) legumes and nuts (ICF International, 2015, The DHS Program STATcompiler).
Consumption of foods rich in vitamin A: Percentage of children aged 6-23 months who consumed foods rich in vitamin A in the 24 hours preceding the survey. Foods rich in vitamin A include meat (and organ meat), fish, poultry, eggs, pumpkin, red or yellow yams or squash, carrots, red sweet potatoes, dark green leafy vegetables (for example, cassava leaves, pumpkin leaves, kale or spinach), mango, papaya, and other locally grown fruits and vegetables that are rich in vitamin A (ICF International, 2015, The DHS Program STATcompiler).
Consumption of foods rich in iron: Percentage of children aged 6-23 months who consumed foods rich in iron in the 24 hours preceding the survey. Foods rich in iron include meat (and organ meat), fish, poultry, and eggs (ICF International, 2015, The DHS Program STATcompiler).
Child wasting: Percentage of children under five who are wasted, that is, have weight-for-height below minus 2 standard deviations of the median of the WHO Child Growth Standards. This means that they are too thin for their height (UNICEF/WHO/World Bank, 2016).
Child stunting: Percentage of children under five who are stunted, that is, have height-for-age below minus 2 standard deviations of the median of the WHO Child Growth Standards. This means that they are too short for their age (UNICEF/WHO/World Bank, 2016).
Child overweight: Percentage of children under five who are overweight, that is, have weight-for-height above 2 standard deviations of the median of the WHO Child Growth Standards. This means that they are too heavy for their height (UNICEF/WHO/World Bank, 2016).
Adult overweight and obesity/overweight and obesity among women of reproductive age: Percentage of adults aged 18 years or older/percentage of women of reproductive aged 15-49 years whose body mass index (BMI) is equal to or greater than 25 kg/m2 (WHO, 2015a; ICF International, 2015, The DHS Program STATcompiler). BMI is calculated by dividing body weight in kg by squared height in m.
Adult obesity/obesity among women of reproductive age: Percentage of adults aged 18 years or older/percentage of women aged 15-49 years whose body mass index (BMI) is equal to or greater than 30 kg/m2 (WHO, 2015a; ICF International, 2015, The DHS Program STATcompiler).
Adult underweight/underweight among women of reproductive age: Percentage of adults aged 18 years or older/percentage of women aged 15-49 years whose body mass index (BMI) is below 18.5 kg/m2 (ICF International, 2015, The DHS Program STATcompiler).
Vitamin A deficiency: Percentage of children aged 6-59 months with a serum retinol concentration elo . μ ol/l.
Anemia in children: Percentage of children aged 6-59 months with anemia, namely, a blood hemoglobin concentration below 11.0 g/dl.
Anemia in women: Percentage of women aged 15-49 years with anemia, namely, a blood hemoglobin concentration below 12.0 g/dl for non-pregnant women and below 11.0 g/dl for pregnant women.


ABOUT PARI
The P og a of A o pa yi g Resea h fo Ag i ultu al I o a� o PARI i gs togethe pa t e s f o Af i a, I dia a d Ge a y to o t i ute to sustai a le ag i ultu al g o th a d food a d
ut i� o se u ity i Af i a a d I dia as pa t of the O e Wo ld, No Hu ge I i� a� e suppo ted y the Ge a go e e t.
PROJECT DIRECTORP of. D . Joa hi o B au
Ce te fo De elop e t Resea h )EFGe s he allee
Bo , Ge a yE-Mail: pa i@u i- o .de
Pho e: + - -
.research4agrinno a� on.org
Follo us o Fa e ook a d T i� e.fa e ook. o /pa i.zef
T i� e : @PARI_)EF


