Integrated Global GHG Information System (IG 3 IS): Evidence Based Policy Support and Evaluation Phil DeCola Sigma Space Oksana Tarasova & Deon Terblanche WMO James Butler & Diane Stanitski NOAA GMD Riley Duren, Kevin Gurney, Alistair Manning & and the IG 3 IS Planning Team
Transcript
Integrated Global GHG Information System (IG3IS):Evidence Based Policy Support and Evaluation
Phil DeColaSigma Space
Oksana Tarasova &Deon TerblancheWMO
James Butler &Diane StanitskiNOAA GMD
Riley Duren, Kevin Gurney,Alistair Manning &
and the IG3IS Planning Team
Chair: Phil DeCola
John Burrows, Jane Burston, James Butler, Tony Janetos, Vincent-Henri Peuch, Pep Canadell, Philippe Ciais, Sander Houweling, Alistair Manning, Peter Rayner, Steve Wofsy, Christoph Gerbig, Beverly Law, Kevin Gurney, David Schimel, Felix Vogel,Jae Edmonds, John Miller, Riley Duren, Prabir Patra, Shuangxi Fang, Luciana Gatti, Tim Arnold, Toshinobu Machida, Ed Dlugokencky, Diane Stanitski,Deon Terblanche, James Whetstone, Jack Kaye, Hratch Semerjian, Steven Hamburg, Daniel Zavala-Araiza, and others
International IG3IS Planning Team Members
WMO Role in GHG Information and IG3IS:Methods and standards for GHG Observations
The Role of the World Meteorological Organization (WMO)• Ensure high quality, consistent,
continuous GHG and other observations of atmospheric composition
• Develop high quality atmospheric transport and data inversion models
• Coordinate global atmospheric measurements; improve models and analysis
• Leverage capabilities across programs and nations
• Build capacity in developing nations
WMO Role in GHG Information: Atmospheric Transport
The patterns in observed surface concentrations are distinctly opposite to the daily variations of emissions fluxes from human activity.
Surface concentrations of CO2 maximize at nighttime when the nocturnal PBL is shallow, but PBL height and rush hour emissions are increasing in the morning.
Must understand atmospheric transport and dynamics to quantify emissions fluxes from atmospheric concentration measurements
Atmospheric GHGs - The Primary Driver of Climate
Change
Atmospheric CO2 continues to increase every year The trend is largely driven by
fossil fuel emissions
The growth rate increases every decade Variability is largely driven by
the Earth System
The Earth System continues to capture 50% of emissions Despite the increase in
emissions Our job is to do our best to
understand the carbon cycle
Atmospheric GHGs - The Primary Driver of Climate
Change
Atmospheric CO2 continues to increase every year The trend is largely driven by
fossil fuel emissions
The growth rate increases every decade Variability is largely driven by
the Earth System
The Earth System continues to capture 50% of emissions Despite the increase in
UNFCCC Process and GHG Monitoring:Both evolving from “Top Down” to “Bottom Up”
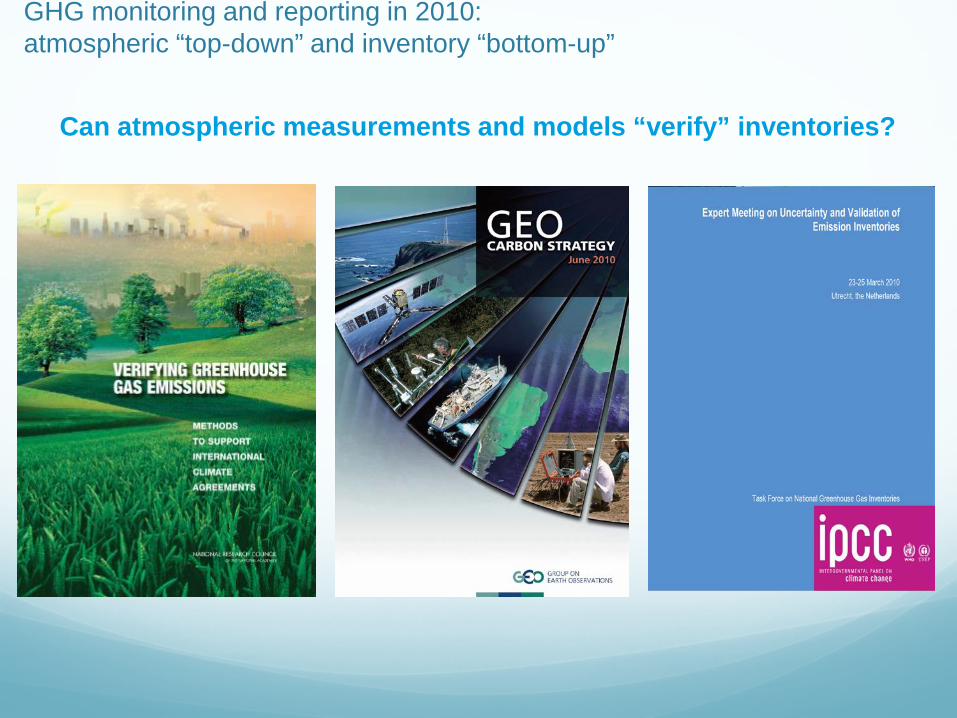
GHG monitoring and reporting in 2010:atmospheric “top-down” and inventory “bottom-up”
Can atmospheric measurements and models “verify” inventories?
Carbon trackers could help bolster climate vows: projects lay groundwork for a
global greenhouse monitoring system
Science 18 Dec 2015: W Cornwall, Vol. 350, Issue 6267, pp. 1450-1451DOI: 10.1126/science.350.6267.1450
The IG3IS Overarching Goals
Goal: Support the success of post-COP21 actions of nations, sub-national governments, and the private sector to reduce climate-disrupting GHG emissions through a sound-scientific, measurement-based approach that:
reduces uncertainty of national emission inventory reporting,
identifies large and additional emission reduction opportunities, and
provides nations with timely and quantified guidance on progress towards their emission reduction strategies and pledges (e.g., NDCs)
Near-term IG3IS Objectives (3-5 year horizon)
Support of Paris Agreement: Timely and quantified trend assessment of NDCs in support of
“Global Stocktaking”
Improved national inventory reporting by making use of atmospheric measurements for all countries
Key sub-national efforts and new mitigation opportunities: GHG monitoring in large urban source areas (megacities)
Detection and quantifying large unknown CH4 emissions
All Kyoto gases
All Kyoto gases(except NF3)
CO2 & CH4
CO2, CH4, N2O, SF6
UK DECC Measurement Network
UK Met Office Modelling and Analysis
Use the NAME transport model driven by 3-D meteorology to understand the recent (3-4 weeks) history of the air arriving at measurement stations
Two stage process: Estimate long-term Northern Hemisphere baseline concentrations
using Mace Head observations. Estimate regional emissions through inversion modelling (InTEM).
Mace Head air history maps are generated for each 2-hour period between 1989 and 2015
-
1
2
3
4
5
6
7
Emis
sion
s (k
t)
Mace Head - error barsrepresent the 5th and95th percentiles
DECC - error barsrepresent the 2.5th and97.5th percentiles
UK GHGI
• Significant mismatch throughout the entire time-series of emissions, approximately inversion is 50% lower than inventory.
• Investigated the refrigeration model used by inventory compilers, key variables to be re-considered by DECC:
• Refill rate• Uptake rate
Example from UK report to UNFCCC: HFC-134a
-
1,000
2,000
3,000
4,000
5,000
6,000
7,000
8,000
Emis
sion
s (k
t)
Mace Head - error barsrepresent the 5th and 95thpercentiles
DECC - error bars representthe 2.5th and 97.5thpercentiles
UK GHGI - error barsrepresent the 2.5th and97.5th percentiles
• Early (1990s) mismatch with the inventory.
• Difficult to understand, most likely cause is landfill emissions but retrospectively challenging to investigate.
• Inspired DECC to expand the network from 1 to 4 stations.
Example from UK report to UNFCCC: Methane
Near-term IG3IS Objectives (3-5 year horizon)
Support of Paris Agreement: Timely and quantified trend assessment of NDCs in support of
“Global Stocktaking”
Improved national inventory reporting by making use of atmospheric measurements for all countries
Key sub-national efforts and new mitigation opportunities: GHG monitoring in large urban source areas (megacities)
Detection and quantifying large unknown CH4 emissions
Paris Agreement “Global Stocktaking”:A combination of top-down and bottom-up methods can deliver
higher-frequency assessments of national emission trends and with rigorously quantified uncertainties
Near-term IG3IS Objectives (3-5 year horizon)
Support of Paris Agreement: Timely and quantified trend assessment of NDCs in support of
“Global Stocktaking”
Improved national inventory reporting by making use of atmospheric measurements for all countries
Key sub-national efforts and new mitigation opportunities: GHG monitoring in large urban source areas (megacities)
Detection and quantifying large unknown CH4 emissions
Carbon emissions from cities and their support systems represent the single largest human contribution to climate change.
The Megacity Project provides a strategy, methodology and roadmap for an international framework to assess directly the carbon emission trends of the world’s megacities.
Megacity Project: Paris and Los Angeles
http://megacities.jpl.nasa.gov
21
Relevance: cities matter
> 70% of global fossil-fuel CO2 (about half of that from megacities)
Source: Cities and Climate Change: an urgent agenda, World Bank, 2010
Urgency: cities are changing rapidly
Both with Stabilization Green LA Plan (2007)
35% (vs 1990) by 2030
Paris Climate Plan (2007) 25% (vs 2004) by 2020
and Growth• Global urbanization will double by 2050• Explosive growth in developing
megacitiespopulation >4%/yearemissions >10%/year
http://www.c40cities.org
Right: Gridded annual fossil fuel CO2 emissions from a medium-size city (Indianapolis) show distinct gradientsat different spatial scales. Right: CDIAC 2006 emissions for the CONUS plotted on a 1° (~100 km) show avgflux 200-600 gC/m2/yr. Middle: Vulcan 2002 emissions for the ~10,000 km2 area centered on Indianapolis on a 10 km grid. Left: Hestia 2002 emissions for the urban core on a 1 km grid. The Vulcan and Hestia plots use log-normal scales (typically >20,000 gC/m2/yr).
Pragmatic: monitoring cities is a tractable problemCO2 at local (human) scales is more intense than at larger scales
The Hestia Project:Quantifies all fossil fuel CO2 emissions at building and street
scale
GOSAT Observations DemonstrateSpace-based Detection of Megacity XCO2
Persistent, robust enhancement= 3.2 ± 1.5 ppm
10-day averages
Selecting observations over LA & ‘Background’ Location
Selected GOSAT footprint locations over LA nightlights
a.u.
Kor
tet a
l., G
RL
(201
2)
Near-term IG3IS Objectives (3-5 year horizon)
Support of Paris Agreement: Timely and quantified trend assessment of NDCs in support of
“Global Stocktaking”
Improved national inventory reporting by making use of atmospheric measurements for all countries
Key sub-national efforts and new mitigation opportunities: GHG monitoring in large urban source areas (megacities)
Detection and quantifying large unknown CH4 emissions
Methane from Oil and Gas Supply Chain USA Texas (Barnett Shale) Example
Atmospheric composition plus enhanced bottom-up activity data
A tiered strategy for monitoring methane leaks in the USTu
rner
et a
l 201
5
Taft dairies
Kern River oil field
Elk Hills oil field
Dairies
Oil fields
Tier 4 (not shown):Surface observations
EnhancedActivity Data
Analogous to the development of numerical weather prediction and its architecture of observations and models,
IG3IS has along-term vision for “GHG weather” analyses and forecasts
The system incorporates multiple coordinated satellites in low Earth orbit (LEO) and geostationary orbit (GEO), aircraft, balloon, and ground observing systems in a true system of systems.
Future with geostationary sounders, low-Earth orbiting mapping systems and data assimilation
ConclusionBuild systems for future services that will meet society’s evolving needs to reduce GHG emissions:
Define the detailed implementation plan
Prepare statement of work and budgets
Actively entrain partners, users, and sponsors through all stages of development
Coordinate with UNFCCC, IPCC, GCOS, GFCS, GEO Carbon Flagship, WCRP and their constituencies