Land development, land use, and urban sprawl in Puerto Ricointegrating remote sensing and population census data
Sebastian Martinuzzi a,b,∗, William A. Gould a, Olga M. Ramos Gonzalez a
a USDA Forest Service International Institute of Tropical Forestry (IITF), Jardın Botanico Sur, 1201 Calle Ceiba, Rıo Piedras, PR 00926-1119, United Statesb Laboratorio de Investigacion de Sistemas Ecologicos y Ambientales (LISEA), Universidad Nacional de La Plata,
Diag. 113 No. 469 CC 31, Fac. Cs. Agrarias y Forestales, 1900 La Plata, Argentina
Received 18 May 2005; received in revised form 2 September 2005; accepted 22 February 2006Available online 30 May 2006
bstract
The island of Puerto Rico has both a high population density and a long history of ineffective land use planning. This study integrates geospatialechnology and population census data to understand how people use and develop the lands. We define three new regions for Puerto Rico: Urban16%), Densely Populated Rural (36%), and Sparsely Populated Rural (48%). Eleven percent of the island is composed of urban/built-up surfaces.
large part of these developments occur in both low-density patterns of construction and sparsely populated neighborhoods. Half of the urbanevelopment occurs outside of urban centers. This analysis helps differentiate zones in the landscape with different uses and conditions, identifyingot only urban and rural settings, but also the interface where development occurs in a territory dominated by forests and pastures, analogous towildland urban interface. The ineffective plan of land development has left a high degree of urban sprawl in 40% of island, where cities and
owns appear typically surrounded by sprawl. The San Juan Metropolitan Area is one of the most expanded urbanized areas with a population of–2.5 million, comparable with the most sprawled cities of the U.S. mainland. This study reinforces the need for an efficient land use planning,nd provides information to support research and planning efforts related to land development and conservation. It represents the first approachntegrating satellite imagery with population census data for studying the human environment in the Caribbean.
Land
swabsJd
2006 Elsevier B.V. All rights reserved.
eywords: Land development; Urban cover; Urban sprawl; Population census;
. Introduction
Urbanization is a significant problem in many parts of theorld, particularly in densely populated territories such asuerto Rico. Island-wide analyses of urban development andopulation distribution provide an opportunity to visualize andnderstand the human use of the landscape. They are useful forrojecting trends in urbanization, assessing “smart growth” andonservation efforts, and for evaluating ecosystem impacts of
uman activities. In this study we combined satellite informa-ion with population census data to study three main aspects ofhe Puerto Rican landscape: development, land use, and urban
∗ Corresponding author at: USDA Forest Service International Institute ofropical Forestry (IITF), Jardın Botanico Sur, 1201 Calle Ceiba, Rıo Piedras,R 00926-1119, United States. Tel.: +1 787 766 5335; fax: +1 787 766 6302.
prawl. We first map the most recent urban/built-up cover. Thene analyze patterns of land development, identify areas of urban
nd rural use, and address land consumption. We ultimately com-ined this information to identify different tendencies in urbanprawl. Finally, we used population density to compare the Sanuan Metropolitan Area (SJMA) with other urbanized areas inifferent countries.
.1. Urbanization and planning in Puerto Rico
Puerto Rico is an attractive region for urban studies: first, its a densely populated island where urbanization has occurrednder an ineffectual plan of land development that has resultedn uncontrolled urban sprawl (Puerto Rico Vision 20251); sec-
1 Puerto Rico Vision 2025 is a governmental long-term vision for the island,ncompassing all aspects of economic, social, environmental, and infrastructureevelopment.
itSm2vpprlutTautomated classification algorithms (supervised, unsupervised,or both) in Landsat TM or ETM+ data (Helmer and Ruefenacht,2005; Helmer et al., 2002; Ramos Gonzales, 2001). In thesestudies, stratification of the imagery by pre- or post-clustering,
S. Martinuzzi et al. / Landscape an
nd, the landscape is in rapid transformation due to urbanxpansion and forest recovery (Lopez et al., 2001; Helmer,004); and finally, the island could be considered as a “windownto the future” of many tropical landscapes that are undergo-ng a transformation from agriculture to industrial economies,hange that happened in Puerto Rico 60 years ago (Dietz,986).
Nearly 3.9 million people live in the 9000 km2 (160 km ×0 km) of Puerto Rico. As a result, it is one of the mostensely populated regions in the U.S. and territories, with38 persons/km2 (similar to the State of New Jersey) (U.S.ensus Bureau, 2000a). Politically, the island is subdivided
n 78 municipalities, the equivalent of counties in the U.S.ach municipality contains one urban center, either a cityr a smaller town. The San Juan Metropolitan Area encom-asses 41 from 78 municipalities (U.S. Office of Managementnd Budget, 2000). Recent past estimates of urban/built-upover using satellite imagery such us Landsat ETM+ or Spotange from 11% (Helmer and Ruefenacht, 2005) to 14% ofhe island (Lopez et al., 2001). As in many mountainousslands, urban centers are concentrated on the coastal plainsr restricted to valleys. Urban developments have grown 7%etween 1991 and 2000. They expand at lower elevations,ver flat topography, and close to roads and urbanized areasThomlinson et al., 1996; Helmer, 2004; Lopez et al., 2001;homlinson and Rivera, 2000), facilitated by an extensive
ural-road network developed during the agricultural era. Res-dential constructions are typically horizontal. The small sizef the Puerto Rico and the extensive road network make itossible to commute from one region of the island to anyther.
Urban sprawl has been part of the Puerto Rican environmentor the last 40 years (Santiago, 2004). It is defined as “peripheralrowth that expands in an unlimited and non-contiguous wayutward from the solid built-up core of a metropolitan area”Transportation Research Board, 2002). It is characterized byow-density development (Edwin, 1997), significant per capitaand consumption of exurban lands, and almost total reliancen the automobile for transportation. Principal consequencesnclude traffic congestion, increase in energy consumption andosts for community services, reduction of open spaces andragmentation of habitats, and pollution of waterways and air.oday, Puerto Ricans are suffering the consequences and pay-
ng the costs of sprawl. In the island, traffic jams are habit-al, enhanced by a high proportion of cars per person equalo 0.54 (U.S. Department of Transportation, 2002), industriallectricity costs are 73% higher than for developed economiesnd are dependent on imported oil, and 40% of water bodiesre impacted and do not meet quality standards (Puerto Ricoision 2025). Productive agricultural lands have been trans-
ormed into urban areas (Helmer, 2004; Lopez et al., 2001), andven forest reserves like the Caribbean National Forest comender human pressure (Lugo et al., 2004). An illustration of the
mportance of sprawl to the government is the US$ 2 billionnvestment in a light-rail “Urban Train” system to provide forn alternative and more effective type of transportation in theJMA.
dL
ban Planning 79 (2007) 288–297 289
Urban planning is not a new issue in Puerto Rico. Severalaws and institutions do exist,2 but the problem is that plan-ing and environmental assessment is done using a lengthy andnpredictable evaluation process, and the current permitting sys-em is seen as widely inefficient, where the exceptions are theule (Puerto Rico Vision 2025). As part of the local efforts toevert this situation, the government recently created the Officeor Land Use Planning (http://www.gobierno.pr/OPUT), wherehe major objective is the development and implementation of alan of land use for the island.
Notably, there is a lack of scientific studies analyzing theuerto Rican landscape integrating both land development andopulation. We have addressed the following questions: What ishe extent of developed lands? How are these lands distributedcross the island? How are people distributed in the lands theyccupy? Which areas of the island suffer from urban sprawl,nd how does urbanization spread out from the core of urbanenters?
.2. Remote sensing of urban areas
Remote sensing technologies provide a powerful tool fortudying urban problems, including those related to urban/built-p land cover mapping (Helmer and Ruefenacht, 2005; Setond Liu, 2003; Yang et al., 2003; Lopez et al., 2001), urbanrowth modeling (Herold et al., 2003; Wilson et al., 2003a),rban sprawl (Clapman, 2003; Sutton, 2003), zoning (Wilsont al., 2003b), population density (Pozzi and Small, 2002),rban density (Faure et al., 2003), and environmental effectsf urban development (Gillies et al., 2003; Milesi et al.,003). Additional information comes from integrating remotelyensed data and ancillary sources such as population mapsHutchinson, 1982; Mesev, 1998; Radelhoff et al., 2000; Sutton,003).
The major problem for mapping urban areas using satellitemagery resides in the diversity and heterogeneity of its spec-ral response (Herold et al., 2002; Green and Boardman, 2000;mall, 2002), which results in a preponderance of spectrallyixed pixels observed in Landsat imagery of urban areas (Small,
003). Mixed pixels are problematic for mapping using con-entional classification methods because most algorithms areredicated on the assumption of spectral homogeneity within aarticular type or land cover; therefore, the urban mosaic canesult in high rates of misclassification between urban and otherand cover classes. Previous studies for Puerto Rico mapped therban cover by two different methods: simple photo interpreta-ion of aerial photography and Spot imagery (Lopez et al., 2001;homlinson et al., 1996; Thomlinson and Rivera, 2000), or using
2 A list of near 40 regulations, zoning and land management plans forifferent areas of Puerto Rico are listed in http://www.gobierno.pr/OPUT/eyesReglamentos.
r both, improves the classification by reducing heterogene-ty within strata. Additionally, aerial photos have been usedo manually discriminate, misclassified pixels corresponding toastures, agricultural lands, and natural barrens.
Studies for Puerto Rico analyzed urban areas in terms ofxtent and growth, considering the developed lands as a singlend uniform category. Differentiation in high and low-densityevelopments has been made for only 1 of the 78 municipalitiesLuquillo) and by visual interpretation (Thomlinson and Rivera,000). Our distinctive contribution for understanding the humanandscape resides in mapping and analyzing different classes ofevelopment and land uses for the entire island using automatedethods.An additional problem for the Caribbean, as well as for other
umid and mountainous regions, is related to persistent cloudover in the satellite imagery. Applications may require cloudnd cloud-shadow-free parts from many scenes for each specificap.
.3. From urban cover to urban use—rationale anderminology
“Urban” pixels that form the basis of many remote sensingnalyses consist typically of developed and non-vegetated sur-aces (pixels) that result from human activity, including builttructures, concrete, asphalt, and buildings. We refer to thems “urban/built-up cover” or “developed lands”. However, fromland-use perspective, these areas may or may not be withinhat we think as, and refer to, “urban use” setting. Urban use
ettings may also include a number of non-developed and vege-ated pixels such as parklands and urban forests, and may excludeevelopments that are components of other land uses.
The U.S. Census Bureau provides a different view for therban component of the landscape. According to the 2000 Urbannd Rural Classification (U.S. Census Bureau, 2000b), all terri-ory, population, and housing units located within census blockhat have a population density of at least 1000 people/mi2 (or90 people/km2), plus surrounding census block that have anverall density of at least 500 people/mi2 (or 195 people/km2),re considered urban areas. All territory, population, and hous-ng units located outside urban areas are rural areas. From theensus perspective, 50% of the island is urban and 50% is rural.lthough the idea (and extent) of what is “urban” varies from
ensus and remote sensing environment, they are not mutuallyxclusive. Linking remotely sensed data with population censusata has shown its value as auxiliary information for image clas-ification (Hutchinson, 1982; Mesev, 1998), in an examinationf housing density (Radelhoff et al., 2000), and in analysis ofrban sprawl (Sutton, 2003).
Finally, “land consumption” is used to refer to the amountf urban/built-up lands that people use (persons per developedm2).
. Data and methods
The resources for this study consisted of Landsat ETM+mages, aerial photos, and information from the U.S. Census
tdtd
ban Planning 79 (2007) 288–297
000, including population for the 900 neighborhoods, and therban and Rural Classification. The set of images included
loud-free parts from 18 individual Landsat ETM+ scenescquired between 1999 and 2003, with 15 m pixel resolution. Wesed NOAA aerial photos from 1999 at the scale of 1:48,000 asuxiliary data for image interpretation. We used ERDAS IMAG-NE 8.7 (ERDAS, 2003) software.
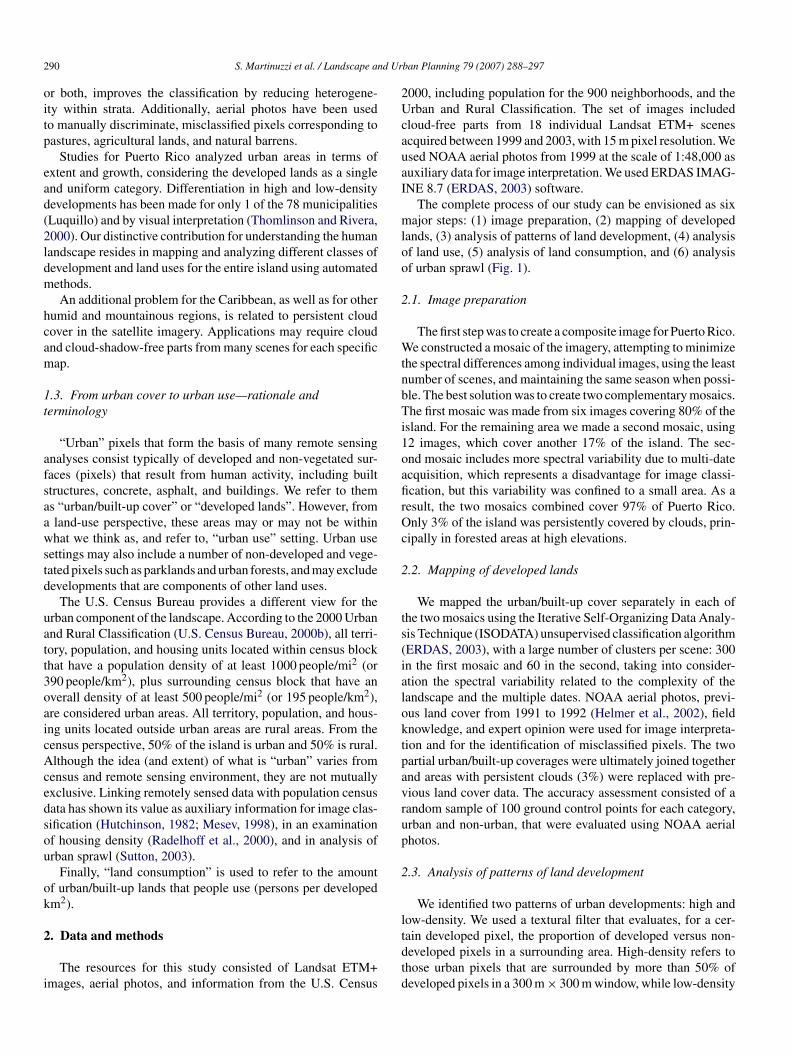
The complete process of our study can be envisioned as sixajor steps: (1) image preparation, (2) mapping of developed
ands, (3) analysis of patterns of land development, (4) analysisf land use, (5) analysis of land consumption, and (6) analysisf urban sprawl (Fig. 1).
.1. Image preparation
The first step was to create a composite image for Puerto Rico.e constructed a mosaic of the imagery, attempting to minimize
he spectral differences among individual images, using the leastumber of scenes, and maintaining the same season when possi-le. The best solution was to create two complementary mosaics.he first mosaic was made from six images covering 80% of the
sland. For the remaining area we made a second mosaic, using2 images, which cover another 17% of the island. The sec-nd mosaic includes more spectral variability due to multi-datecquisition, which represents a disadvantage for image classi-cation, but this variability was confined to a small area. As aesult, the two mosaics combined cover 97% of Puerto Rico.nly 3% of the island was persistently covered by clouds, prin-
ipally in forested areas at high elevations.
.2. Mapping of developed lands
We mapped the urban/built-up cover separately in each ofhe two mosaics using the Iterative Self-Organizing Data Analy-is Technique (ISODATA) unsupervised classification algorithmERDAS, 2003), with a large number of clusters per scene: 300n the first mosaic and 60 in the second, taking into consider-tion the spectral variability related to the complexity of theandscape and the multiple dates. NOAA aerial photos, previ-us land cover from 1991 to 1992 (Helmer et al., 2002), fieldnowledge, and expert opinion were used for image interpreta-ion and for the identification of misclassified pixels. The twoartial urban/built-up coverages were ultimately joined togethernd areas with persistent clouds (3%) were replaced with pre-ious land cover data. The accuracy assessment consisted of aandom sample of 100 ground control points for each category,rban and non-urban, that were evaluated using NOAA aerialhotos.
.3. Analysis of patterns of land development
We identified two patterns of urban developments: high andow-density. We used a textural filter that evaluates, for a cer-
ain developed pixel, the proportion of developed versus non-eveloped pixels in a surrounding area. High-density refers tohose urban pixels that are surrounded by more than 50% ofeveloped pixels in a 300 m × 300 m window, while low-density
S. Martinuzzi et al. / Landscape and Urban Planning 79 (2007) 288–297 291
F g, anaa
rotaslu
2
wUltfvUprt
tpUtPhr5uctp
2
p
ig. 1. Six steps involved in the methodology: image preparation, urban mappinnd analysis of urban sprawl.
efers to those urban pixels that are surrounded by less than 50%f developed pixels. The dimension of the filter and the propor-ion of developed versus non-developed pixels for separate lownd high-density were selected after testing with various dimen-ions and break points. We studied the distribution of high andow-density developments in relation to different topographicnits and changes in slope.
.4. Analysis of land use
We integrated the patterns of development in the landscapeith census data and identified three types of land uses: (I)rban, (II) Densely Populated Rural, and (3) Sparsely Popu-
ated Rural. We applied a similar texture approach for separatinghe urban-use from the rural-use areas. In this case the valueor each pixel in the landscape is the proportion of developedersus non-developed pixels in a surrounding 1 km2 window.
rban-use refers to those areas where the presence of developedixels is greater than 20% within the window, while rural-useefers to those regions where developed pixels represent lesshan 20%. These parameters were set by visual interpretation of
fhpt
lysis of urban density, analysis of land use, analysis of urban-land consumption,
he limits of the urban centers and by comparison with aerialhotos. We subdivided the rural areas, based on the Censusrban and Rural Classification for densely and non-densely set-
led/populated territories, into two additional classes: Denselyopulated Rural (with core census block groups or blocks thatave a population density of at least 1000 people/mi2 plus sur-ounding census blocks that have an overall density of at least00 people/mi2), and Sparsely Populated Rural (with lower pop-lation density). Urban-use clusters smaller than 30 ha wereonsidered as components of the rural class. Additionally, inhe San Juan Metropolitan Area some major interior forests,arklands, and water bodies were incorporated manually.
.5. Analysis of land consumption
We categorized each neighborhood based on the number ofeople per developed km2 compared with the average reported
or the island. We estimated for each one of the 900 neighbor-oods from the U.S. Census, the difference between the realopulation (from the census) and the expected population (fromhe average of the island). This approach was originally applied
292 S. Martinuzzi et al. / Landscape and Urban Planning 79 (2007) 288–297
Fig. 2. Decision rules for identifying five classes of increasing tendency to urban sprawl based on parameters of land use, land development, and land consumption.
F % ofG nd thec e.)
fdTlt
2
tpucriPnRlwttedcct2
edi
3
3
Rcta(iilopaffected by wetlands (Fig. 3). In relationship with the majorphysiographic units of the island, plains, hills, and mountains(Gould et al., 2005),3 we found that 60% of the total develop-
ig. 3. Urban/built-up land cover of Puerto Rico in red, equal to 95,342 ha or 11ray colors correspond to higher elevations, including the central mountains, a
olor in this figure legend, the reader is referred to the web version of the articl
or study per capita land consumption and urban sprawl amongifferent urban areas for the conterminous U.S. (Sutton, 2003).he assumption is that areas with higher than expected popu-
ation will have lower land consumption than areas with lowerhan expected population.
.6. Analysis of urban sprawl
We developed a classification schema to categorize the rela-ive tendency to sprawl of urban developments by integratingrevious steps (Fig. 2). We first identified the boundaries ofrban expansion, territory where sprawl might take place. Thisorresponds to our Urban and Densely Populated Rural uses,egion where urban areas growth maintains a high connectiv-ty with urban centers. Outside this territory, in the Sparselyopulated Rural use, development can occur but less well con-ected with urban centers. Within Urban and Densely Populatedural lands, we analyzed the patterns of construction and popu-
ation distribution. Five classes of increasing tendency to sprawlere identified, ranging from 1 (lowest tendency) to 5 (highest
endency). Low-density developments were considered due toheir natural non-compact spatial arrangement to have the great-st tendency to sprawl, even higher than any solid high-densityevelopment. Thus, low-density developments were included in
ategory 5. High-density developments, on the other hand, werelassified based on the population they are supporting: the higherhe land consumption the higher the tendency to sprawl (Sutton,003). High-density developments with population above the
pTto
the total area. The islands of Vieques and Culebra are not included in the map.Caribbean National Forest in the east. (For interpretation of the references to
xpected were separated in categories 1–3, while high-densityevelopments with population below the expected were includedn category 4.
. Results
.1. Urban/built-up cover
Our study reported 95,342 ha of developed lands in Puertoico for 2000–2003, equivalent to 11% of the island. The Kappaoefficient (Landis and Koch, 1997) measured accuracy equalo 94%. Our estimation is consistent with those from Helmernd Ruefenacht (2005), which was calculated at a coarser scale30 m pixel). Visual interpretation of the urban/built-up coverndicates that developed pixels are distributed throughout thesland, including large urban clusters in coastal plains and val-eys, and linear developments along highways and routes. A fewpen regions appear without this human impact: regions that arerotected, have steep slopes, are dedicated to agriculture, or are
3 Physiographic units were identified using landforms (originally derived fromarameters of slope and land position), and elevation ranges (Gould et al., 2005).he plains correspond to the original “plains” landform, while hills and moun-
ains correspond to arrangements of non-plain formations with elevation belowr above 400 m, respectively.
S. Martinuzzi et al. / Landscape and Urban Planning 79 (2007) 288–297 293
Fa2
marm7
3
(4mttwtcu
Fig. 6. Distribution of urban development in relation to the slope. The dash linebdi
ar(
dhdaimwrm2ih
3
Ft
ig. 4. Distribution of urban developments in plains, hills, and mountains. Plainsccount for 55,822 ha of urban developments, hills 12,284 ha, and mountains7,236 ha.
ents occur in the plains, where the most productive lands forgriculture are also located. As a result, one-quarter of theseich soils have been transformed into built-up areas. In hills andountains the presence of developed areas represents less than
% of their total extension (Fig. 4).
.2. High and low-density urban developments
From a total of 95,342 ha of urban/built-up lands, 54,899 hanearly 60%) corresponds to high-density developments, and0,443 ha (nearly 40%) corresponds to low-density develop-ents. High-density development reflects the compact pat-
ern of construction within urban centers, including cities andowns, along important connections between major cities, and
ithin exurban agglomerations that are non-contiguous with
he urban centers; conversely, low-density reflects the non-ontiguous pattern of development that expands outward fromrban centers in linear features following the road network
tmla
ig. 5. Patterns of urban development of Puerto Rico: high-density developments (in blo color in this figure legend, the reader is referred to the web version of the article.)
etween 5◦ and 6◦ represents the break point for the proportion of low and high-ensity developments. The peak at 2◦ is an artifact from the DEM (similar peaks found in the DEM).
nd isolated constructions. Some of the biggest highways andoutes are also included within the low-density developmentsFig. 5).
Development decreases rapidly as slope increases. This ten-ency is applicable to the total built-up areas as well as theigh-density developments, but for low-density development theecrease with the slope is much slower (Fig. 6). Between 5◦nd 6◦ the relationship between the two types of developmentnverts. From 0◦ to 5–6◦ the amount of high-density develop-ent is greater than the corresponding low-density development,hile the contrary if found at higher slopes. The 6◦ slope rep-
esents also the variable for separating plains from hills andountains in the physiographic map of the island (Gould et al.,
005). Consequently, high-density development predominatesn the plains, while low-density development predominates inills and mountains (Fig. 7).
.3. Urban and rural land uses
Urban use covers 16% of Puerto Rico (142,562 ha). It is home
o 2.7 million people, and includes not only the major develop-
ents (urban centers, exurban agglomerations, industrial areas,arge isolated residential complexes, ports, and airports), butlso non-developed lands that are part of the urban landscape,
ack) and low-density developments (in red). (For interpretation of the references
294 S. Martinuzzi et al. / Landscape and Urban Planning 79 (2007) 288–297
Fm
sTpo“cNa
tptutsttw
Fo
uv
3
kcfetcJkdtt
ig. 7. Distribution of high and low-density urban areas in plains, hills, andountains.
uch as forests, parklands, and other vegetated areas (Fig. 8).he urban-use class enhances the contiguity between the com-act urban areas across the island, and gives an accurate viewf the urban situation: it is easy to distinguish a major coastalurban ring” that surrounds the island and minor rings that encir-le interior mountainous and protected areas like the Caribbeanational Forest. Within this coastal ring the areas of developed
nd non-developed land are about equal (Fig. 9).In the rural lands, Densely Populated Rural use covers 36% of
he island (320,219 ha) and supports a population of 0.8 millioneople. It surrounds the urban-use areas and represents most ofhe territory where human developments expand out from therban centers following secondary routes. The landscape withinhese still high-populated areas is dominated by pastures and
econdary forests, and developments represent a minimum frac-ion (Fig. 9). Finally, Sparsely Populated Rural encompasseshe remaining 48% of the island (425,146 ha). This large area,ith low population (less than 0.3 million people) and minimal
lwdi
Fig. 8. Land uses of Puerto Rico, including Urban, Dense
ig. 9. Proportion of land-use types including the relationship between devel-ped and undeveloped pixels.
rban development, corresponds to agriculture fields, higher ele-ations, protected lands, or rugged topography.
.4. Land consumption
In Puerto Rico there is an average of 3996 persons/developedm2. The reported difference between real population (from theensus) and expected population (from the average of the island)or each one of the 900 neighborhoods demonstrates how het-rogeneously the population is distributed in the landscape, andhus, the different patterns of land consumption. The lowest landonsumption was reported in some neighborhoods of the Sanuan Metropolitan Area, with 7000–8000 persons/developedm2 (in cities such as Paris or New York, the populationensity can reach 22,000 and 44,000 persons/km2, respec-ively). Within the SJMA there are also areas with popula-ion below the expected, which are considered relatively high
and-consumption areas. The highest land consumption ratesere reported in neighborhoods dominated by non-residentialevelopments like airports, ports, commercial centers, andndustries.
ly Populated Rural, and Sparsely Populated Rural.
S. Martinuzzi et al. / Landscape and Urban Planning 79 (2007) 288–297 295
ing d
3
diomlwitaatwo
lcc(diro(ma
Fu
3c
ues9esop(
4
afatuot
Fig. 10. Map of the developed lands show
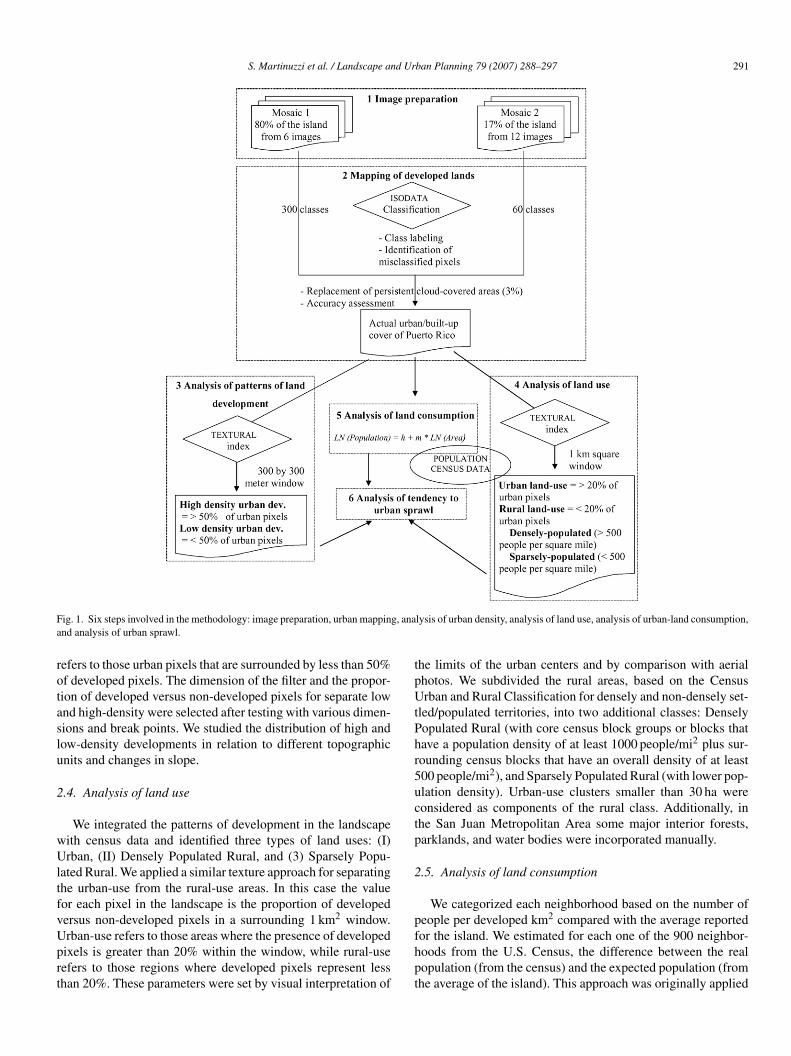
.5. Urban sprawl
Most of the 78 urban centers appear surrounded by sprawlevelopments. The results from the classification show a clearncrease in tendency to urban sprawl when going from the coref urban centers, periphery, exurban agglomerations, develop-ents along rural roads, particularly visible in the major cities
ike the SJMA (Fig. 10). In the periphery of the urban centers asell as in the exurban agglomerations the population supported
s typically below the expected, and so, the land consumption andhe tendency to sprawl are high. Certain neighborhoods whichre high-density developed, like the banking and commercialreas, ports, and airports, have lower values of land consump-ion and thus, they appear with high tendencies of sprawl, butould not be considered as sprawl; these zones are highly devel-ped for non-residential purposes.
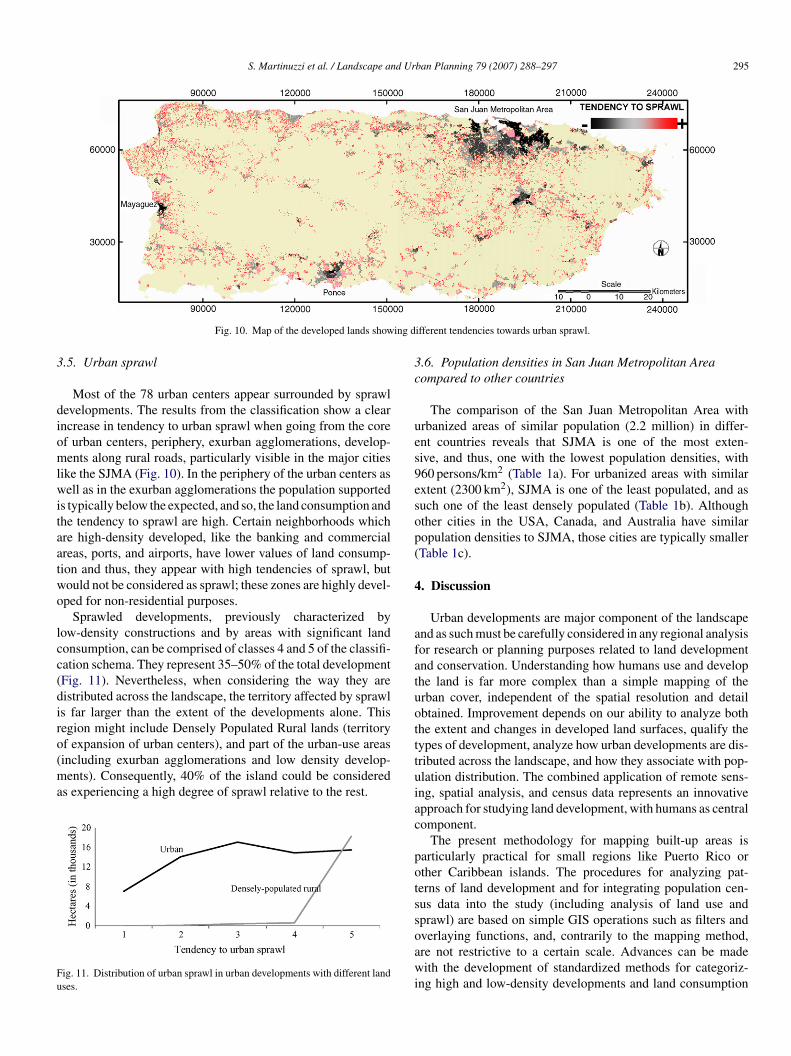
Sprawled developments, previously characterized byow-density constructions and by areas with significant landonsumption, can be comprised of classes 4 and 5 of the classifi-ation schema. They represent 35–50% of the total developmentFig. 11). Nevertheless, when considering the way they areistributed across the landscape, the territory affected by sprawls far larger than the extent of the developments alone. Thisegion might include Densely Populated Rural lands (territory
f expansion of urban centers), and part of the urban-use areasincluding exurban agglomerations and low density develop-ents). Consequently, 40% of the island could be considered
s experiencing a high degree of sprawl relative to the rest.
ig. 11. Distribution of urban sprawl in urban developments with different landses.
ttuiac
potssoawi
ifferent tendencies towards urban sprawl.
.6. Population densities in San Juan Metropolitan Areaompared to other countries
The comparison of the San Juan Metropolitan Area withrbanized areas of similar population (2.2 million) in differ-nt countries reveals that SJMA is one of the most exten-ive, and thus, one with the lowest population densities, with60 persons/km2 (Table 1a). For urbanized areas with similarxtent (2300 km2), SJMA is one of the least populated, and asuch one of the least densely populated (Table 1b). Althoughther cities in the USA, Canada, and Australia have similaropulation densities to SJMA, those cities are typically smallerTable 1c).
. Discussion
Urban developments are major component of the landscapend as such must be carefully considered in any regional analysisor research or planning purposes related to land developmentnd conservation. Understanding how humans use and develophe land is far more complex than a simple mapping of therban cover, independent of the spatial resolution and detailbtained. Improvement depends on our ability to analyze bothhe extent and changes in developed land surfaces, qualify theypes of development, analyze how urban developments are dis-ributed across the landscape, and how they associate with pop-lation distribution. The combined application of remote sens-ng, spatial analysis, and census data represents an innovativepproach for studying land development, with humans as centralomponent.
The present methodology for mapping built-up areas isarticularly practical for small regions like Puerto Rico orther Caribbean islands. The procedures for analyzing pat-erns of land development and for integrating population cen-us data into the study (including analysis of land use andprawl) are based on simple GIS operations such as filters and
verlaying functions, and, contrarily to the mapping method,re not restrictive to a certain scale. Advances can be madeith the development of standardized methods for categoriz-
ng high and low-density developments and land consumption
296 S. Martinuzzi et al. / Landscape and Ur
Table 1Comparison of the San Juan Metropolitan Area with worldwide cities with sim-ilar population (a), extent (b), or population density (c)
ource: http://www.demographia.com/. Data for SJMA in bold.
atterns, enabling the comparison between different countries oregions.
We found that 11% of Puerto Rico is covered by urban/built-p surfaces. Compact construction of urban centers encom-asses 60% of the total development and is restricted to flatreas, while the other 40% occur in low-density forms and isidespread across much of the island facilitated by the exten-
ive rural-road network. Uncontrolled development has led tohigh degree of sprawl in 40% of Puerto Rico, with cities and
owns poorly populated and surrounded by large sprawl areas.early half of the total development is occurring outside of the
olid urban centers, covering one-quarter of the best lands forgriculture, impacting watersheds and reducing open spaces.
Notably, the SJMA is one of the most extended urbanizedreas in the world when compared with cities of similar popula-
ion from different countries. It is comparable to St. Louis and
inneapolis–St. Paul, which have been identified within theost sprawled cities in the U.S. (Sutton, 2003). The importance
f SJMA is enhanced by its particular environmental situation:
PtIf
ban Planning 79 (2007) 288–297
hile urbanized areas comparable to SJMA are in relatively flatontinental landscapes with vast sources of land for agriculture,xpansion, and conservation, SJMA is located on a small andssentially mountainous island with limited sources of land.
We define for Puerto Rico three main regions relatedo population distribution and development: Urban (16%),parsely Populated Rural (36%), and Densely Populated Rural48%). The Densely Populated Rural is equivalent to the
ildland–Urban Interface, which is recognized as a focal areaor a variety of human–environmental conflicts, and is receivingajor attention in the U.S. mainland (USDA and USDI, 2001;adeloff et al., 2005). Evaluating the local significance of thisrban–rural interface, territory that covers 36% of the Puertoico, represents an exciting subject for future research. The
dentification of regions in the landscape with distinct humanmpacts is also useful from biodiversity analysis efforts, such ashe Puerto Rico Gap Analysis Project (USGS, 2004), allowing toncorporate the human component in the modeling and mappingf animal species distribution.
In rapidly transforming landscapes such as Puerto Rico,roper plans of land development and conservation effortshould have the capacity to visualize and model future land-capes resulting from human activities, and to model ecosystemesponses. This includes the development of Land Cover andand Use Change (LCLUC) models that define and monitorrban growth (including the progress of high and low-densityevelopments and changes in the extent of urban and rural-usereas), and forest loss or recovery, coupled with continuouslypdated efforts at monitoring animal species and habitat distri-ution.
This study not only reinforces the necessity of an effectivelan of land use for Puerto Rico, but also provides operationalnformation for planning purposes, including maps and GISayers of the actual extent of the built-up areas, patterns of con-tructions, location of sprawled areas, and land use classification.evitalize urban centers, re-attracting people and development
o urban centers, as well as promote vertical constructions mighteverse and/or improve the situation. The existence of moreensely populated cities can serve as model for more efficientse of the land, reducing development pressure on rural areasnd open spaces. This improvement can be maintained with theelatively stable population of Puerto Rico. The creation of theffice for Land Use Planning as part of the local government rep-
esents a unique opportunity for a radical change and progressn local planning. We expect this effort to generate a propertmosphere where planners, governmental agencies, scientists,ocal communities, and NGO’s can communicate directly withach other to support and develop efficient land use managementtrategies under the political will for its implementation.
cknowledgments
This research is funded by the USGS-BRD National Gap
rogram, administrated by the USDA Forest Service Interna-
ional Institute of Tropical Forestry (IITF), and supported by theITF GIS and Remote Sensing Laboratory. We are most gratefulor comments on the manuscript by T. del Mar Lopez, Dr. A.E.
ugo, and anonymous reviewers. All research at IITF is due inollaboration with the University of Puerto Rico.
eferences
lapman Jr., W.B., 2003. Continuum-based classification of remotely sensedimagery to describe urban sprawl on a watershed scale. Remote Sens. Env-iron. 86 (3), 322–340.
opez, T. del M., Aide, T.M., Thomlinson, J.R., 2001. Urban expansionand the loss of prime agricultural lands in Puerto Rico. Ambio 30,49–54.
ietz, J.L., 1986. Economic History of Puerto Rico. Institutional Change andPolitical Development. Princeton University Press, Princeton, NJ.
dwin, R., 1997. Is Los Angeles style sprawl desirable? J. Am. Plan. Assoc. 63,107–126.
RDAS IMAGINE 8.7, 2003. Leica Geosystem GIS & Mapping LLC.aure, J.F., Tran, A., Gardel, A., Polidori, L., 2003. Sensoriamiento remoto das
formas de urbanizacao em aglomeracoes do Litoral Amazonico: Elaboracaode un indice de densidade populacional. In: Proceedings of the SimposioBrasileiro de Sensoriamiento Remoto 2003, Belo Horizonte, Brazil.
illies, R.R., Brim Box, J., Symanzik, J., Rodemaker, E.J., 2003. Effects ofurbanization on the aquatic fauna of the Line Creek watershed Atlanta—asatellite perspective. Remote Sens. Environ. 86 (3), 411–422.
ould, W.A., Edwards, B., Fevold, B., Martinuzzi, S., 2005. Fisiografıa delArchipielago de Puerto Rico. Map No. 2005-2. USDA Forest Service, Inter-national Institute of Tropical Forestry, Rıo Piedras, Puerto Rico.
reen, R.O., Boardman, J., 2000. Exploration of the relationship between infor-mation content and signal/noise ratio and spatial resolution in AVIRISdata. In: Proceedings of the Ninth JPL Airborne Earth Science Workshop,Pasadena, CA, pp. 195–206.
elmer, E.H., Ramos Gonzalez, O.M., del Mar Lopez, T., Quinonez, M., Dıaz,W., 2002. Mapping the forest type and land cover of Puerto Rico, a com-ponent of the Caribbean biodiversity hotspot. Caribbean J. Sci. 38 (3–4),165–183.
elmer, E.H., 2004. Forest conservation and land development in Puerto Rico.Landscape Ecol. 19, 29–40.
elmer, E.H., Ruefenacht, B., 2005. Cloud-free satellite image mosaics withregression trees and histogram matching. Photogrammetric Eng. RemoteSens. 71 (9), 1079–1089.
erold, M., Gardner, M., Hadley, B., Roberts, D., June 2002. The spectraldimension in urban land cover mapping from high-resolution optical remotesensing data. In: Proceedings of the 3rd Symposium on Remote Sensing ofUrban Areas, Istanbul, Turkey.
erold, M., Goldstein, N.C., Clarke, K.C., 2003. The spatiotemporal form ofurban growth: measurement, analysis and modeling. Remote Sens. Environ.86 (3), 286–302.
utchinson, C.F., 1982. Techniques for combining Landsat and ancillary datafor digital classification improvement. Photogrammetric Eng. Remote Sens.8 (1), 123–130.
andis, J.R., Koch, G.G., 1997. The measurement of observer agreement forcategorical data. Biometrics 33, 159–174.
ugo, A.E., Lopez, T. del M., Ramos Gonzalez, O.M., Velez, L.L., 2004. Urban-izacion de los terrenos en la periferia de El Yunque. USDA Forest ServiceReport WO 66, 29 pp.
ilesi, C., Elvidge, C.C., Nemani, R.R., Running, S.W., 2003. Assess-ing the impact of urban and development on net primary productivityin the southeastern United States. Remote Sens. Environ. 86 (3), 401–410.
ffice of Management and Budget, 2000. Standards for defining Metropoli-
tan and Micropolitan Statistical Areas, Federal Register Notice 65 FR82228–82238.
ozzi, F., Small, C., June 2002. Vegetation and population density in urbanand suburban areas in the USA. In: Proceedings of the Third InternationalSymposium of Remote Sensing of Urban Areas Istanbul, Turkey.
OIpe“
ban Planning 79 (2007) 288–297 297
adelhoff, V.C., Hapen, A.E., Voss, P.R., Field, D.R., Mladenhoff, D.V., 2000.Exploring the spatial relationships between census and land cover data. Soc.Nat. Resour. 13 (6), 599–609.
adeloff, V.C., Hammer, R.B., Stewart, S.I., Fried, J.S., Holcomb, S.S.,McFeefry, J.F., 2005. The Wildland–Urban Interface in the United States.Ecol. Appl. 15 (3), 799–805.
amos Gonzales, O.M., 2001. Assessing vegetation and land cover changesin northeastern Puerto Rico: 1978–1995. Caribbean J. Sci. 37 (1–2), 95–106.
antiago, L.E., 2004. Documentation of Urban Sprawl in Puerto Rico(1950–1990)., http://egp.rrp.upr.edu/investigacion/lessprawl.html.
eto, K., Liu, W., 2003. Comparing ARTMAP neural network with themaximum-likelihood classifier for detecting urban change. Photogrammet-ric Eng. Remote Sens. 69 (9), 981–990.
mall, C., 2003. High spatial resolution spectral mixture analysis of urbanreflectance. Remote Sens. Environ. 88, 170–186.
utton, P., 2003. A scale-adjusted measure of “urban sprawl” using nighttimesatellite imagery. Remote Sens. Environ. 86 (3), 370–384.
homlinson, J.R., Serrano, M.I., Lopez, T. del M., Aide, T.M., Zimmerman,J.K., 1996. Land-use dynamics in a post agricultural Puerto Rican landscape(1936–1988). Biotropica 28, 525–536.
homlinson, J.R., Rivera, L., 2000. Suburban growth in Luquillo, Puerto Rico:some consequences of development on natural and seminatural systems.Landscape Urban Plan. 49, 15–23.
ransportation Research Board, 2002. Costs of Sprawl 2000. Transit CooperativeResearch Program Report 74, National Academy Press, Washington, DC,88 pp.
.S. Census Bureau, 2000a. http://www.census.gov/main/www/cen2000.html.
.S. Census Bureau, 2000b. Urban and Rural Classification,http://www.census.gov/geo/www/ua/ua 2k.html.
.S. Department of Transportation, 2002. Federal Highway Administration,http://www.fhwa.dot.gov/ohim/hs01/mv1.htm.
SDA, USDI, 2001. Urban wildland interface communities within vicinityof Federal lands that are at high risk from wildfire. Federal Register 66,751–777.
SGS, 2004. Gap Analysis Program Bulletin No. 12. In: Brackney, E.S., Jen-nings, M.D. (Eds.), USGS/BRD/Gap Analysis Program. Moscow, Idaho.
ilson, E.H., Hurd, J.D., Civco, D.L., Prisloe, M.P., Arnold, C., 2003a. Devel-opment of a geospatial model to quantify, describe and map urban growth.Remote Sens. Environ. 86 (3), 275–285.
ilson, J.S., Clay, M., Martin, E., Stuckey, D., Vedder-Risch, K., 2003b. Eval-uating environmental influences of zoning in urban ecosystems with remotesensing. Remote Sens. Environ. 86 (3), 303–321.
ang, L., Xian, G., Klaver, J.M., Brian, D., 2003. Urban land-cover changedetection through sub-pixel imperviousness mapping using remotely senseddata. Photogrammetric Eng. Remote Sens. 69 (9), 1003–1010.
ebastian Martinuzzi is an ecologist from the University of La Plata, LISEA,rgentina. He is an invited scientist at the USDA-FS IITF since 2003, involved
n the remote sensing component of the Puerto Rico Gap Analysis Project. Hisnterests focus on the use of remote sensing and GIS for understanding howeople use and develop the land, as well as for characterizing landscape patternsn space and time. His research includes the study, modeling, and mapping ofatural and human ecosystems, habitats, and biodiversity patterns.
illiam A. Gould is a research ecologist with the USDA-FS IITF. His researchnvolves integration of field and remote sensing data in analyses of landscapeattern and process in a wide range of ecosystems including tropical to arcticegions. He is active in studies of biodiversity patterns and controls, vegeta-ion composition and structure, land cover mapping and modeling, and in fieldducation and outreach.
lga M. Ramos Gonzalez is a GIS analyst and coordinator at the USDA-FSITF. Her interests focus on the utilization of new technologies to develop andromote areas of scientific research and technology transfer, to help maintainffective and up-to-date monitoring and inventory of vegetation coverage andgreen infrastructure” in Puerto Rico and the Caribbean.