34
1

1

Contents
Executive summary 01
02
03
05 04
05
Doubts about Spain begin to dissipate
Spain: a success story
Economic outlook, 2013-2014
2
Spain must continue driving through reforms 05
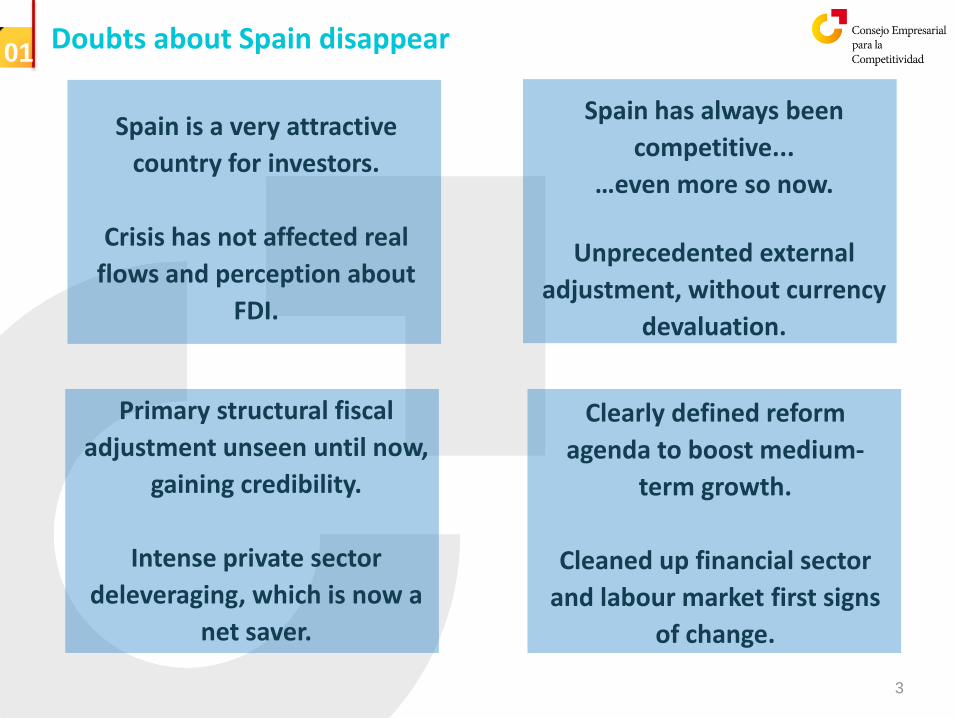
Doubts about Spain disappear
Spain is a very attractive
country for investors.
Crisis has not affected real
flows and perception about
FDI.
01
Spain has always been
competitive...
…even more so now.
Unprecedented external
adjustment, without currency
devaluation.
Primary structural fiscal
adjustment unseen until now,
gaining credibility.
Intense private sector
deleveraging, which is now a
net saver.
Clearly defined reform
agenda to boost medium-
term growth.
Cleaned up financial sector
and labour market first signs
of change.
3
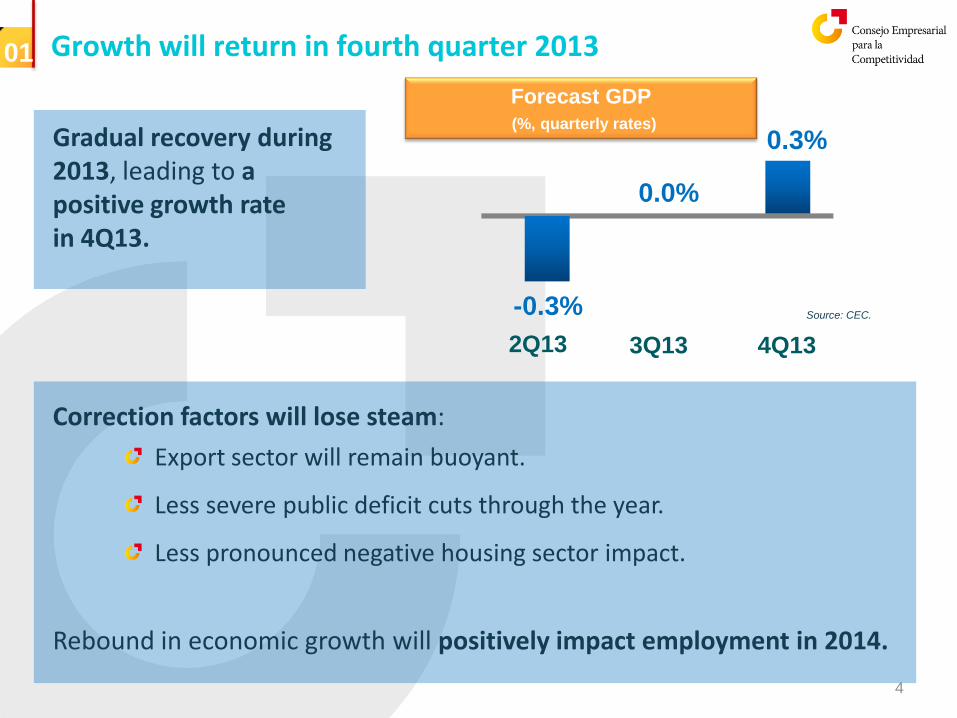
Growth will return in fourth quarter 2013
Gradual recovery during 2013, leading to a positive growth rate in 4Q13.
01
Correction factors will lose steam:
Export sector will remain buoyant.
Less severe public deficit cuts through the year.
Less pronounced negative housing sector impact.
Rebound in economic growth will positively impact employment in 2014.
2Q13 3Q13
Forecast GDP
(%, quarterly rates)
4Q13
-0.3%
0.0%
0.3%
4
Source: CEC.
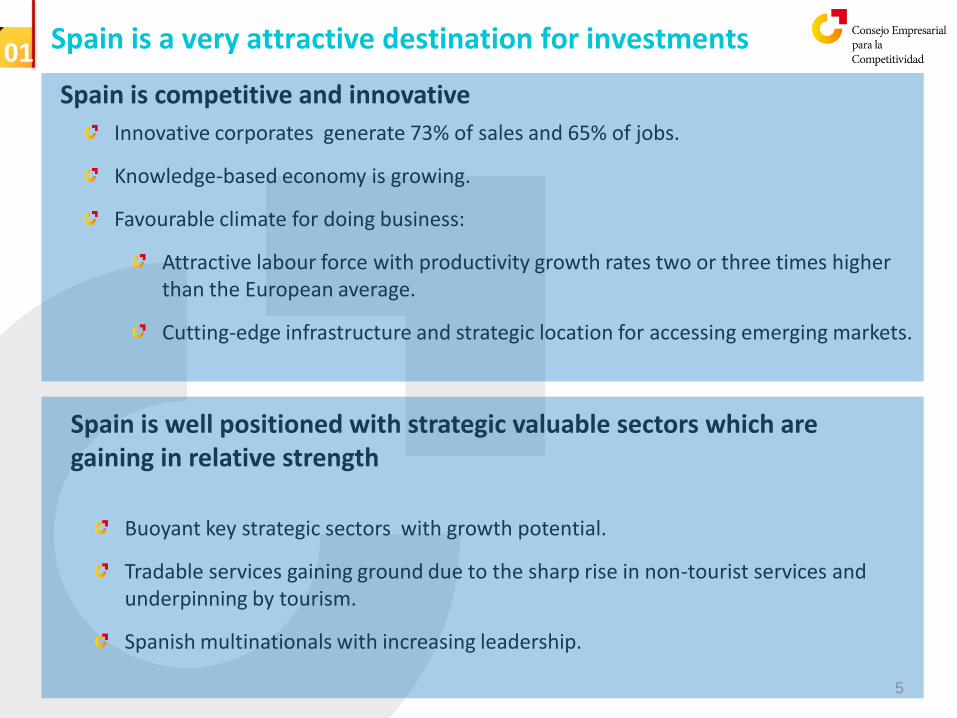
Spain is a very attractive destination for investments
Spain is competitive and innovative
Innovative corporates generate 73% of sales and 65% of jobs.
Knowledge-based economy is growing.
Favourable climate for doing business:
Attractive labour force with productivity growth rates two or three times higher than the European average.
Cutting-edge infrastructure and strategic location for accessing emerging markets.
01
Spain is well positioned with strategic valuable sectors which are gaining in relative strength
Buoyant key strategic sectors with growth potential.
Tradable services gaining ground due to the sharp rise in non-tourist services and underpinning by tourism.
Spanish multinationals with increasing leadership.
5

Contents
Executive summary 01
02
03
05 04
05
Doubts about Spain begin to dissipate
Spain: a success story
Economic outlook, 2013-2014
6
Spain must continue driving through reforms 05

One year ago, markets had serious doubts about the Spanish economy
7
“Spain is not a competitive economy”.
“Spanish debt is high”.
“Spain is not able to adjust its fiscal deficit”.
“Banking sector is not solvent”.
“Spain is not committed with reforms”.
02
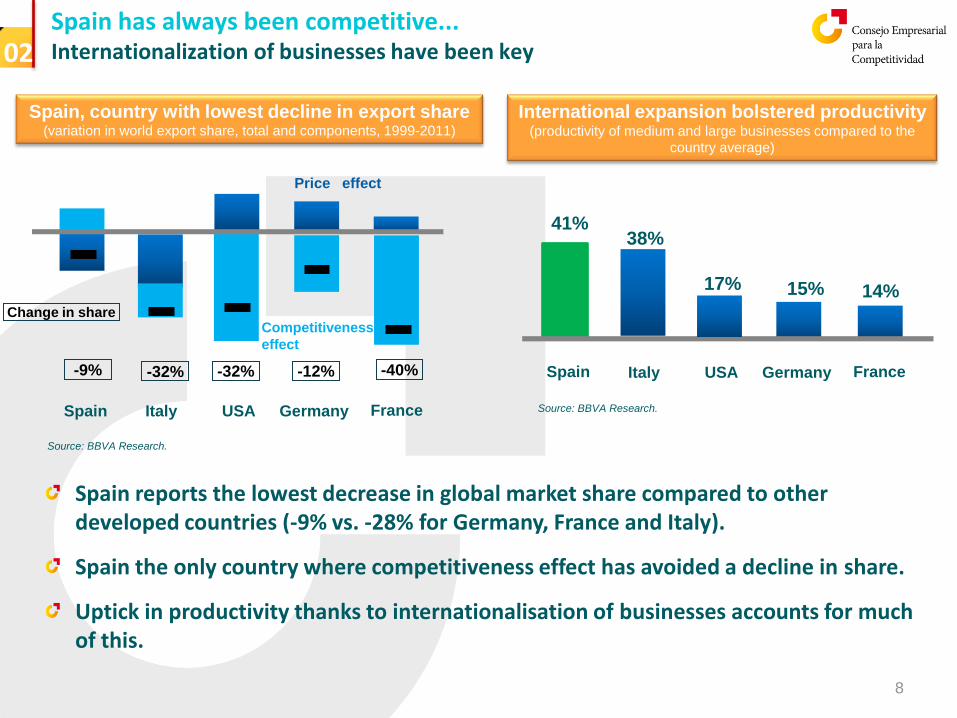
Spain has always been competitive... Internationalization of businesses have been key 02
Spain Italy France Germany
Spain, country with lowest decline in export share (variation in world export share, total and components, 1999-2011)
USA
Price effect
Competitiveness effect
-9% -32% -32% -12% -40%
Change in share
Spain reports the lowest decrease in global market share compared to other developed countries (-9% vs. -28% for Germany, France and Italy).
Spain the only country where competitiveness effect has avoided a decline in share.
Uptick in productivity thanks to internationalisation of businesses accounts for much of this.
Spain Italy France Germany
International expansion bolstered productivity (productivity of medium and large businesses compared to the
country average)
41% 38%
15% 14% 17%
USA
8
Source: BBVA Research.
Source: BBVA Research.
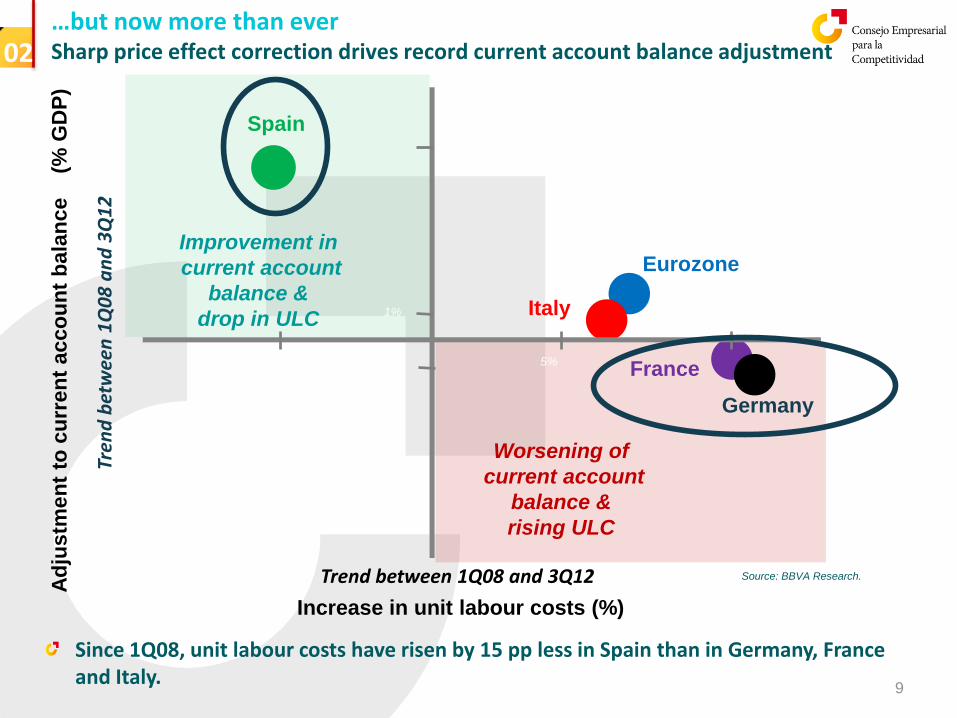
…but now more than ever Sharp price effect correction drives record current account balance adjustment 02
Eurozone
Italy
France
Trend between 1Q08 and 3Q12
Spain
Germany
Increase in unit labour costs (%)
Ad
jus
tme
nt
to c
urr
en
t acco
un
t b
ala
nce
(%
GD
P)
-5% 5%
Improvement in
current account
balance &
drop in ULC
Worsening of
current account
balance &
rising ULC
Tren
d b
etw
een
1Q
08
an
d 3
Q1
2
Since 1Q08, unit labour costs have risen by 15 pp less in Spain than in Germany, France and Italy.
-1%
9%
1%
9
Source: BBVA Research.

Hitherto unheard-of upturn in exports thanks to growth in sales Exports reach €255 billion, 25% up from pre-crisis levels
% of GDP
02
2006-2007 2012
-8
-97
Var. goods
+62
Var.
services +17
Rest +9
Historic current account balance adjustment
over five years (€ billion)
+ €88
billion
Source: Bank of Spain.
Exports as a percentage of imports
at all-time high
Growing diversification in exports towards high-growth countries: in 2012, sales to Africa up 31%, to Latin America (15%) and to Asia (12%). First ever trade surplus with eurozone: €8 billion.
Historic adjustment in export/import coverage ratio without devaluation.
10
Source: Bank of Spain.
0.89
0.84
0.79
0.74
0.69
0.64
0.59
Dec 81
Feb 87
Apr 92
Jun 97
Aug 02
Oct 07
Dec 12

Historic private sector adjustment, which is now a net saver Indebted businesses concentrated in specific sectors but with high levels of assets
Financing requirements of private sector compared to rest of the world
(% of GDP)
-13.4%
2007
Private sector financing needs down 18 pp (as a % of GDP) since 2007.
Leverage ratio of businesses still high compared to GDP, but...
In relation with assets, the ratio is similar to the European average and the same as Germany's (40%).
Situation not the same across sectors since only 20% are over-indebted (40% in 2007).
02
2009-2012
avg.
4.6%
+18 pp
11
Source: BBVA Research.
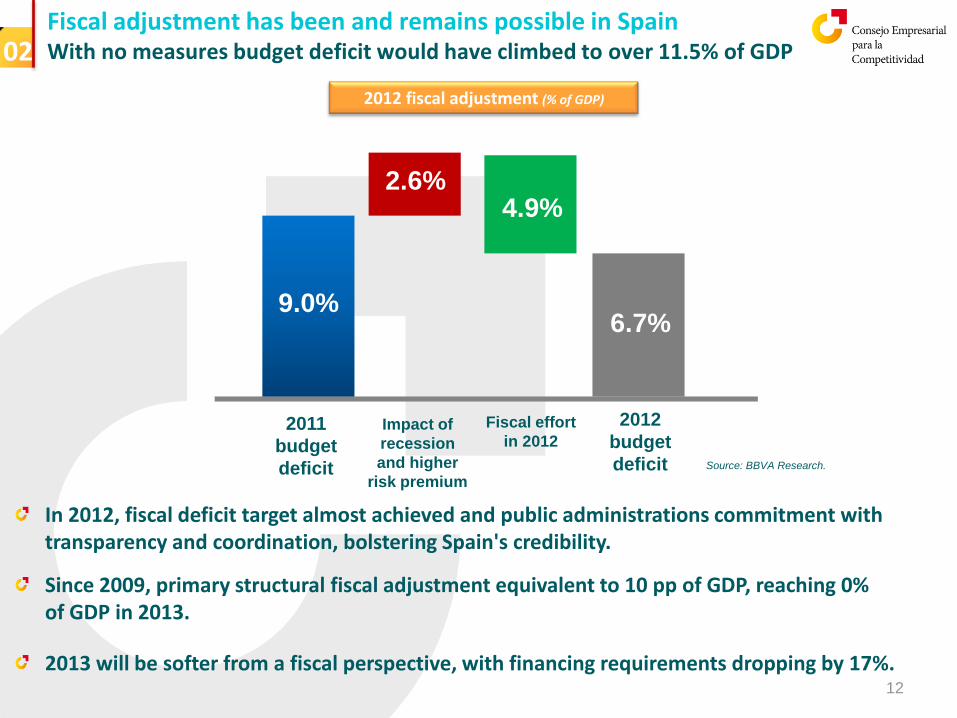
Fiscal adjustment has been and remains possible in Spain With no measures budget deficit would have climbed to over 11.5% of GDP
2012 fiscal adjustment (% of GDP)
2011
budget
deficit
In 2012, fiscal deficit target almost achieved and public administrations commitment with transparency and coordination, bolstering Spain's credibility.
Since 2009, primary structural fiscal adjustment equivalent to 10 pp of GDP, reaching 0% of GDP in 2013.
2013 will be softer from a fiscal perspective, with financing requirements dropping by 17%.
02
9.0%
2.6% 4.9%
6.7%
2012
budget
deficit
Impact of
recession
and higher
risk premium
Fiscal effort
in 2012
12
Source: BBVA Research.

Reforms critical for boosting medium-term growth Spain at the helm of reforms among developed countries
Spain, the nation most committed with reforms within developed world
(OECD ranking)
-13.4%
Spain
Reforms focused in three areas:
1. Providing flexibility to the economy:
Labour market reform. Deregulation of professional services. Opening up of new businesses. Market unity.
2. Assuring medium term sustainability:
Pension reform. Budget stability. Public spending rationalization.
3. Ramping up growth: Digital agenda. Energy sector reform. Boosting lending to SMEs. Encouraging international expansion.
Eurozone Italy USA
Optimum
level
OECD
average
13
Source: OECD “Going for growth”.
02
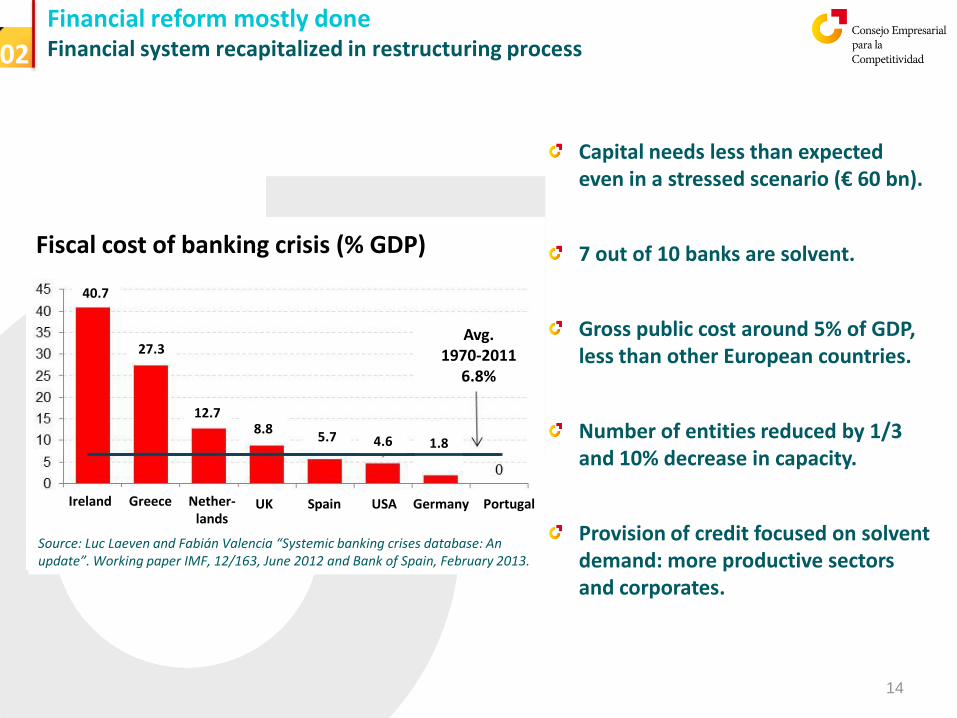
Financial reform mostly done Financial system recapitalized in restructuring process 02
Capital needs less than expected even in a stressed scenario (€ 60 bn).
7 out of 10 banks are solvent.
Gross public cost around 5% of GDP, less than other European countries.
Number of entities reduced by 1/3 and 10% decrease in capacity.
Provision of credit focused on solvent demand: more productive sectors and corporates.
Fiscal cost of banking crisis (% GDP)
Avg. 1970-2011: 6,8%
Ireland Greece UK Spain USA Germany Portugal Nether-lands
40.7
27.3
12.7 8.8
5.7 4.6 1.8
Avg. 1970-2011
6.8%
Source: Luc Laeven and Fabián Valencia “Systemic banking crises database: An update”. Working paper IMF, 12/163, June 2012 and Bank of Spain, February 2013.
14
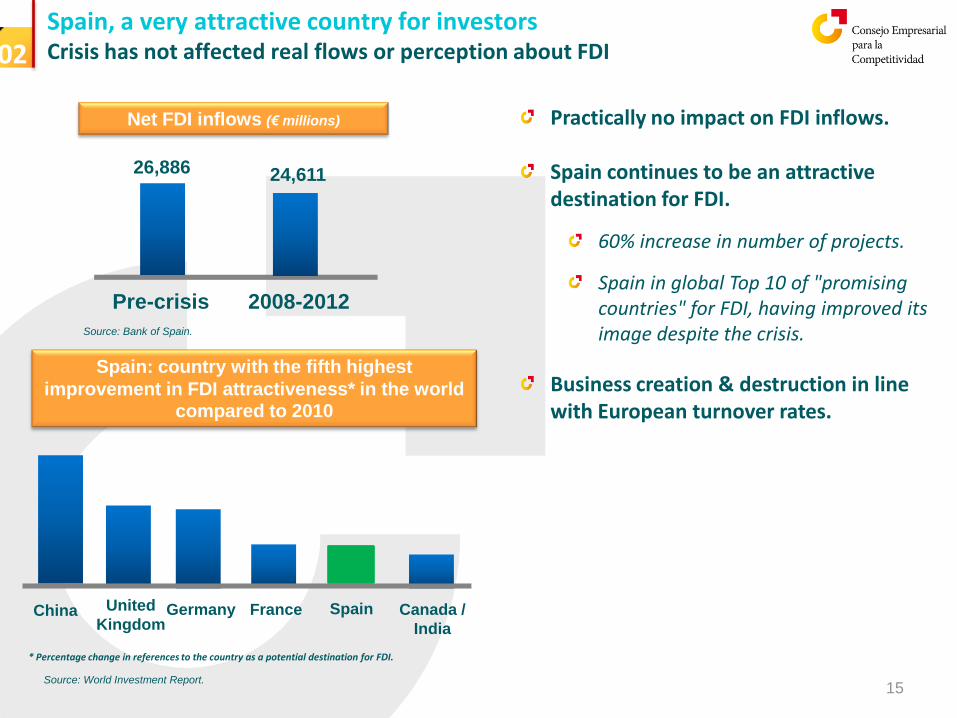
Spain, a very attractive country for investors Crisis has not affected real flows or perception about FDI
Net FDI inflows (€ millions)
26,886
Pre-crisis
Spain: country with the fifth highest
improvement in FDI attractiveness* in the world
compared to 2010
Practically no impact on FDI inflows.
Spain continues to be an attractive destination for FDI.
60% increase in number of projects.
Spain in global Top 10 of "promising countries" for FDI, having improved its image despite the crisis.
Business creation & destruction in line with European turnover rates.
02
2008-2012
24,611
China United
Kingdom Germany France Spain Canada /
India
* Percentage change in references to the country as a potential destination for FDI.
15
Source: Bank of Spain.
Source: World Investment Report.

Contents
Executive summary 01
02
03
05 04
05
Doubts about Spain begin to dissipate
Spain: a success story
Economic outlook, 2013-2014
16
Spain must continue driving through reforms 05
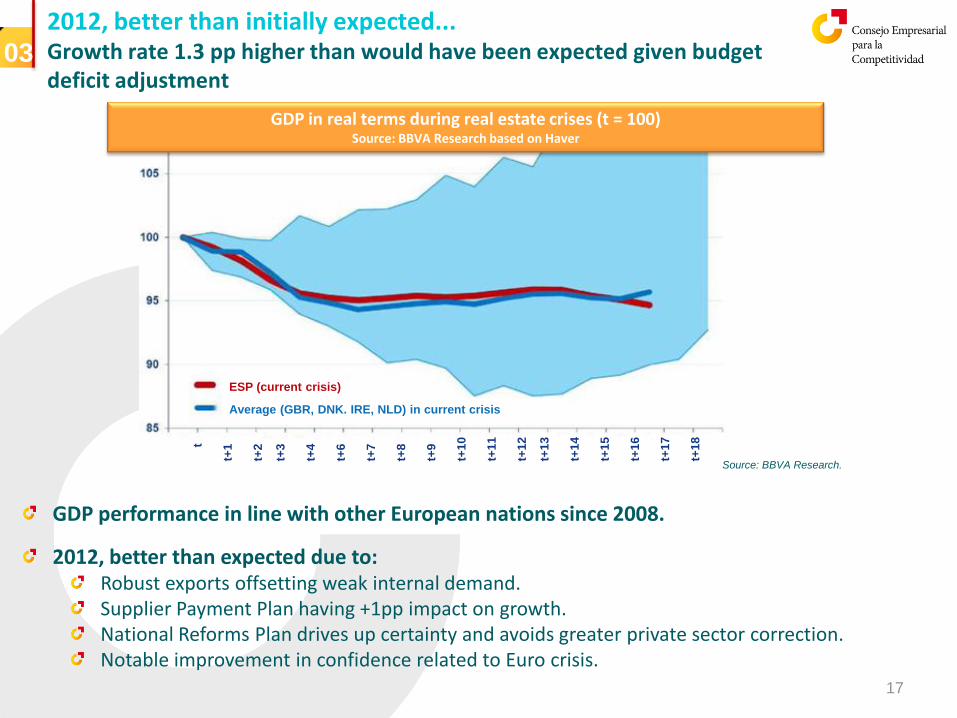
2012, better than initially expected... Growth rate 1.3 pp higher than would have been expected given budget deficit adjustment
GDP in real terms during real estate crises (t = 100) Source: BBVA Research based on Haver
GDP performance in line with other European nations since 2008.
2012, better than expected due to: Robust exports offsetting weak internal demand. Supplier Payment Plan having +1pp impact on growth. National Reforms Plan drives up certainty and avoids greater private sector correction. Notable improvement in confidence related to Euro crisis.
03
17
Source: BBVA Research.
ESP (current crisis)
Average (GBR, DNK. IRE, NLD) in current crisis
t
t+1
t+2
t+3
t+4
t+6
t+7
t+8
t+9
t+1
0
t+1
1
t+1
2
t+1
3
t+1
4
t+1
5
t+1
6
t+1
7
t+1
8
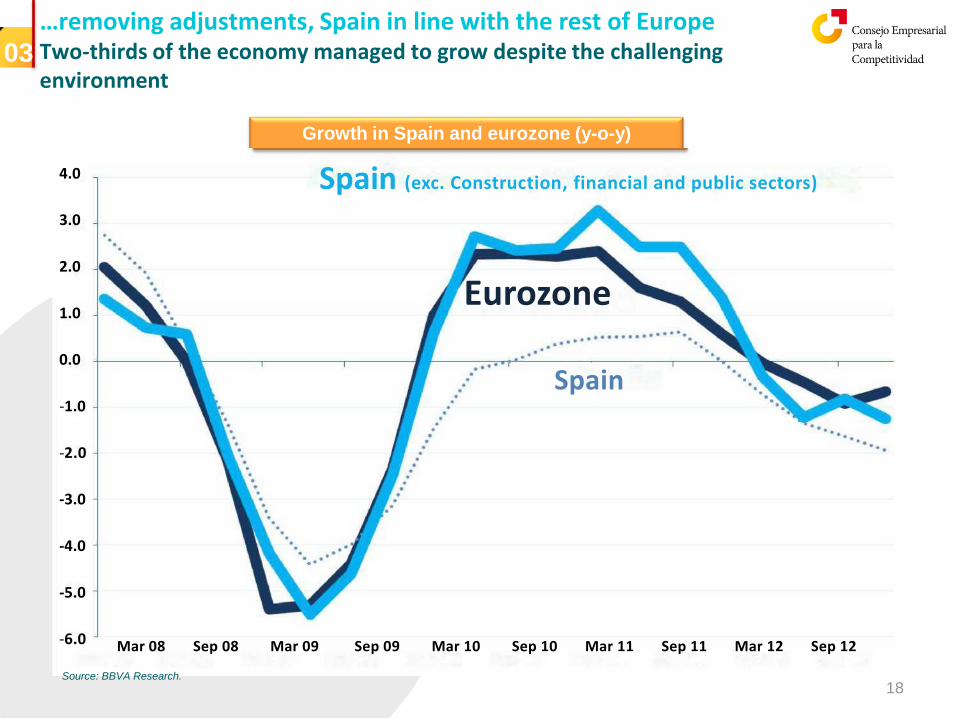
…removing adjustments, Spain in line with the rest of Europe Two-thirds of the economy managed to grow despite the challenging environment
03
18
Growth in Spain and eurozone (y-o-y) Source: BBVA Research
Source: BBVA Research
Spain (exc. Construction, financial and public sectors)
Eurozone
Spain
Mar 08 Sep 08 Mar 09 Sep 09 Mar 10 Sep 10 Mar 11 Sep 11 Mar 12 Sep 12
4.0
3.0
2.0
1.0
0.0
-1.0
-2.0
-3.0
-4.0
-5.0
-6.0
Source: BBVA Research.

Spain will bottom out in 3Q13 Internal demand recovering in 2014 03
19
2Q13 3Q13
Forecast GDP (%, quarterly rates)
4Q13
-0.3%
0.0%
0.3%
Export sector will be able to offset negative contribution of internal demand in 4Q13.
Fiscal and private sector adjustment to moderate negative contribution to growth along 2H13 and 2014.
Source: CEC.
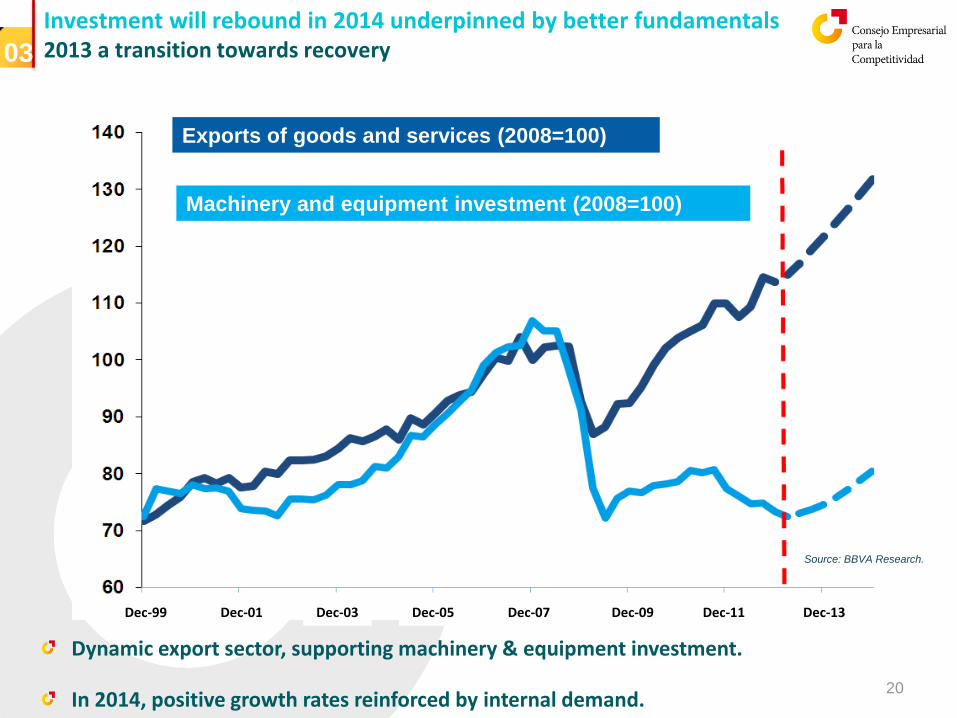
Investment will rebound in 2014 underpinned by better fundamentals 2013 a transition towards recovery
Dynamic export sector, supporting machinery & equipment investment.
In 2014, positive growth rates reinforced by internal demand.
03
20
Exports of goods and services (2008=100)
Machinery and equipment investment (2008=100)
Source: BBVA Research.
Dec-99 Dec-01 Dec-03 Dec-05 Dec-07 Dec-09 Dec-11 Dec-13
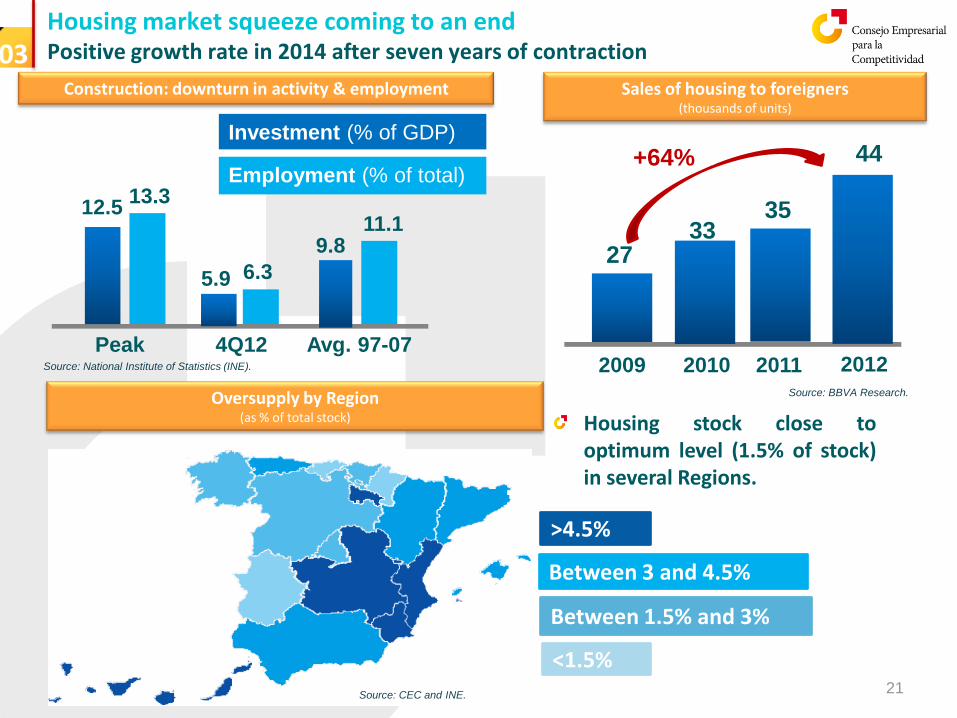
Housing market squeeze coming to an end Positive growth rate in 2014 after seven years of contraction 03
Sales of housing to foreigners (thousands of units)
21
Construction: downturn in activity & employment
Peak 4Q12
5.9
Avg. 97-07
6.3
11.1
Investment (% of GDP)
12.5 13.3
9.8
Employment (% of total)
27 33
35
44 +64%
2009
2010
2011
2012
>4.5%
Between 1.5% and 3%
Between 3 and 4.5%
<1.5%
Oversupply by Region (as % of total stock)
Source: CEC and INE.
Source: BBVA Research.
Source: National Institute of Statistics (INE).
Housing stock close to optimum level (1.5% of stock) in several Regions.
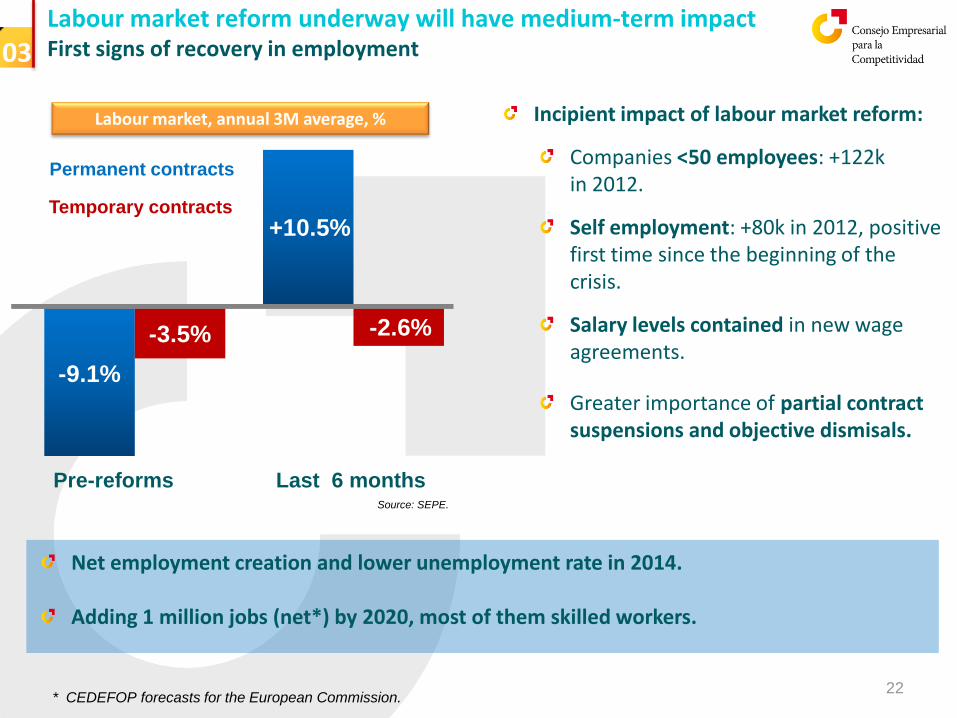
Labour market reform underway will have medium-term impact First signs of recovery in employment
Labour market, annual 3M average, %
-9.1%
Pre-reforms
Incipient impact of labour market reform:
Companies <50 employees: +122k in 2012.
Self employment: +80k in 2012, positive first time since the beginning of the crisis.
Salary levels contained in new wage agreements.
Greater importance of partial contract suspensions and objective dismisals.
03
Last 6 months
-3.5%
+10.5%
-2.6%
Permanent contracts
Temporary contracts
22
Net employment creation and lower unemployment rate in 2014. Adding 1 million jobs (net*) by 2020, most of them skilled workers.
* CEDEFOP forecasts for the European Commission.
Source: SEPE.
Contents
Executive summary 01
02
03
05 04
05
Doubts about Spain begin to dissipate
Spain: a success story
Economic outlook, 2013-2014
23
Spain must continue driving through reforms 05

Spain is competitive and innovative Solid position in the World in terms of knowledge and innovation
Knowledge-based assets (% of GDP)
% of people in work with a university degree
29.5%
15.9%
Anglo-Saxon countries
Spain
25.8%
Nordic countries
23.9%
Central European
38%
Spain Average EU
30%
10th in terms of scientific output
7.1%
Spain Europe
4.5% 3.5%
North America
Average annual growth in scientific output
(1996-2010)
Innovative business sector: 73% of sales and 65% of jobs.
4 of the Top 20 business schools in the World are Spanish.
21 Spanish companies among those investing the most in R&D in Europe.
Growing importance of entrepreneurship in Spanish business.
Source: Ábaco Observatory based on Eurostat. Source: Eurostat 2011.
Source: Spanish Foundation for Science and Technology (FECYT).
04
24

Spain has an attractive business environment More productive and affordable labour force than in Europe
Flagship telecommunications and infrastructure network in Europe.
Energy prices for industrial businesses 3-10% lower than European average.
Key geostrategic location to reach emerging markets.
04
€43,000
Avg. of Germany, France and Italy
Labour force 12-30% cheaper than our neighbouring countries
€34,400
Spain
Compensation per employee
(2014 estimates by European Commission)
€28,000
High business productivity on the rise
€27,900
Spain
GDP per employee - compensation per employee
(2014 estimates, European Commission)
25,200
20,700
2007
2014
Avg. of Germany, France and Italy
25
Source: AMECO. Source: AMECO.

Key added value sectors driving international expansion... Generating 35% of GDP and employing over 2 million people
BIO-
TECHNOLOGY
AUTOMOTIVE COMMUNICATIONS AERO-
SPACE
OTHER
59
39 35 32
16
Innovative companies (% of total companies)
Source: National Institute of Statistics (INE).
BIO-
TECHNOLOGY FOOD AUTOMOTIVE COMMUNICATIONS AERO-
SPACE
OTHER
13
3.1 3.0 2.8
0.7 0.6
Innovation intensity (innovation expenditure as a % of total turnover)
Source: National Institute of Statistics (INE).
Turnover/employee
Annual growth over last 2 years
Exports/output
Sectors with
potential*
182
2.9%
36%
Total
sectors
103
-0.6%
29%
*Automotive, biotechnology, industrial aerospace, ITCs, machinery-tooling and food and agriculture
04
23
FOOD
Spanish companies among Europe's TOP 5 in terms of output and exports.
26
Source: Telefónica based on data from INE, Ministry of Agriculture, Food and Environment, ICEX
(Spanish trade and investment department) and information from industry associations.
16

…with a very positive domestic and export impact Great potential according to international projections
Nº exporters related with automotive sector
11,815
2007 2012
17,741 25% skilled workers vs.
13% in Europe
Source: DATACOMEX.
04
27
Food and agriculture exports (€ billion)
24.9
2007 2012
33.9
Source: DATACOMEX.
+50%
+36%
8th largest exporter
worldwide
Biotechnology (growth over last 2 years)
+85%
Turnover Employment
+39%
Over 250 new businesses since 2008
Source: Spanish Bioindustry Association (ASEBIO),
latest available annual report.

The engine of tradable services… Surplus in non-tourism services for the first time in 20 years
% of GDP
04
2006-2007 2012
-4.9
8.2
31.4 27.6
Surplus in services 65% higher than in 2006-2007 (€ billion)
€+17 billion (75% non tourism
services ) Tourism
Other
Source: Bank of Spain.
+44%
Non-tourism
services
Exports growth, 2006-2012 (%)
+6%
Tourism
€63 billion
in 2012
€43 billion
in 2012
Source: Bank of Spain.
Construction: 21%
Cultural services: 13%
Insurance services: 11%
IT and corporate services: 9%
Average annual growth, 2006-2012
LatAm: +32%
Africa: +21%
Asia: +16%
28
Source: Bank of Spain.

…and robust leadership in tourism sector Strong growth of visitors from emerging countries 04
Source: Bank of Spain.
Tourism export growth 2006-2012 (%)
+6%
Tourism
€43 billion in 2012
2nd in the World in terms of
revenues
4th in the World in visitor numbers
Approximately 6% revenue growth from traditional markets.
21% revenue growth from US and 13% from Nordic countries.
Growth in revenues per tourist, 2012
Average daily spend of tourists from BRIC 44% higher than the average.
29
Improvement in competitiveness, especially compared to other destinations in the Mediterranean and American continent.
80% of visitors from largest markets come back again.
17% revenue growth from non-traditional markets on the American continent and 13% rise in revenue from non-traditional European markets.
Great potential in key niche markets
2nd in the World in cultural heritage. 3rd in the World for business trips. Growing tourist inflows from emerging countries.

Spanish multinationals, World market leaders… Worldwide leadership in 1/3 of key activity sectors
Continue to post impressive productivity levels, 10% higher than Germany's and 20% above the United Kingdom's:
Turnover in excess of €500 billion. Employ more than 2.5 million people.
Continue to expand into new countries:
40% operate in more than 21 countries. 12% of these are already present in over 100 countries worldwide.
World leaders in strategic sectors with major growth potential:
Infrastructure, energy and telecommunications. Engineering, renewable energy and environmental technologies. Financial services, transport and distribution. Food, tourism. Textiles and fashion.
04
30

…and powerful Spanish franchise network Number of establishments doubled in just 4 years
272 Spanish franchises outside Spain in 2012 (+12 % vs. 2011 and +30% vs. 2008).
Present in 108 countries; growing share in emerging markets.
Fashion, travel, food, and beauty the most dynamic: number of franchises >20% in 2012.
8
08
Franchises: Nº of establishments outside Spain (thousand)
09 10 11 12
10 10 11
17 +53%
Source: Spanish Franchise Association (AEF).
39
63
2012 Source: Spanish Franchise Association (AEF).
+60%
2008
Nº of establishments outside Spain
per franchise
2012 Source: Spanish Franchise Association (AEF).
+23%
2007
Nº of franchises in Spain, 2007-2012
683
160 836
204 Foreign +28%
Spanish +22%
04
31

Contents
Executive summary 01
02
03
05 04
05
Doubts about Spain begin to dissipate
Spain: a success story
Economic outlook, 2013-2014
32
Spain must continue driving through reforms 05
Spain should deepen reforms To guarantee strong economic growth in the near future
Public administration reform, giving priority to productive public investment.
Additional amendments to labour laws to simplify contracts, reduce tax burden, and encourage efficient, proactive policies for job creation.
Policies that continue to boost the knowledge economy in all the areas of activity:
Education reform, particularly focused on secondary education and professional training.
Efficient collaboration between business, universities and research community.
Promoting policies that increase the average size of Spanish companies.
33
05

34


