RETSCREEN MODELING FOR COMBINED ENERGY SYSTEMS: FERTILIZERS PLANT CASE Iryna Kalinchyk * and Carlos F. Pfeiffer Telemark University College Kjølnes Ring 56, P.O. Box 203, N-3901 Porsgrunn, Norway Evgenij Inshekov NTUU “Kyiv Polytechnic Institute” Borshchagivska 115, P.O. Box 311 Kyiv, Ukraine ABSTRACT Switching from traditional industrial systems to a modern way of organizing all processes (including energy supply) on the principles of ‘green’ economy is an up-to-date task, especially for countries under development. The article discusses the using of alternative energy sources to supply part of the energy demands of a chemical plant to produce fertilizers from natural gas in Ukraine. Fertil- izers plants consume dozens of MW of power supplied from the grid. A plant pre-analysis showed that there was a high potential for using alternative energy sources. By using RETScreen 4 software it was possible to model systems with one or several alternative energy sources, calculate energy balances, and compare their performance. The results showed that hybrid electricity supply systems can perform beneficially for industry in terms of economy, diversification and environment. Keywords:Combined Energy Supply, Hybrid Energy Systems, RETScreen Modeling, Ukraine En- ergy, Renewable Energy NOMENCLATURE b eq specific cost for auxiliary equipment as a share from main b m specific maintenance cost from the main funds C expenses for new technology implementation [$] CF capacity factor [%] c f cost of fuel unit [$/m 3 ] c m maintenance cost [$/kWh] C u cost of generating unit [$] g acceleration of gravity [9.81 m/s 2 ] h falling height, head [m] P installed capacity [kW] P n nominal capacity [kW] P th power theoretically available [W] q fuel use per kWh of energy production [m 3 /kWh] T eq exploitation term of auxiliary equipment [years] T u exploitation term of the unit [years] v water flow [m 3 /s] v 0 initial water flow [m 3 /s] v n nominal water flow [m 3 /s] W energy produced in average year [kWh/year] ρ density [kg/m 3 ] INTRODUCTION Ukraine is an energy dependent country which im- ports 62% of natural gas, and 70.5% of consumed oil and oil products, and nuclear material[1, 2, 3, 4]. At 5 the end of 2013 over 60% of electricity was gener- ated from natural gas and coal on CHPs (combined Proceedings from The 55th Conference on Simulation and Modelling (SIMS 55), 21-22 October, 2014. Aalborg, Denmark 7
Transcript
RETSCREEN MODELING FOR COMBINED ENERGY SYSTEMS:FERTILIZERS PLANT CASE
Iryna Kalinchyk∗and Carlos F. PfeifferTelemark University College
Kjølnes Ring 56, P.O. Box 203, N-3901Porsgrunn, Norway
Switching from traditional industrial systems to a modern way of organizing all processes (includingenergy supply) on the principles of ‘green’ economy is an up-to-date task, especially for countriesunder development. The article discusses the using of alternative energy sources to supply part ofthe energy demands of a chemical plant to produce fertilizers from natural gas in Ukraine. Fertil-izers plants consume dozens of MW of power supplied from the grid. A plant pre-analysis showedthat there was a high potential for using alternative energy sources. By using RETScreen 4 softwareit was possible to model systems with one or several alternative energy sources, calculate energybalances, and compare their performance. The results showed that hybrid electricity supply systemscan perform beneficially for industry in terms of economy, diversification and environment.Keywords:Combined Energy Supply, Hybrid Energy Systems, RETScreen Modeling, Ukraine En-ergy, Renewable Energy
NOMENCLATURE
beq specific cost for auxiliaryequipment as a share from main
bm specific maintenance costfrom the main funds
C expenses for new technologyimplementation [$]
CF capacity factor [%]c f cost of fuel unit [$/m3]cm maintenance cost [$/kWh]Cu cost of generating unit [$]g acceleration of
gravity [9.81 m/s2]h falling height, head [m]P installed capacity [kW]Pn nominal capacity [kW]Pth power theoretically
available [W]
q fuel use per kWh ofenergy production [m3/kWh]
Teq exploitation term ofauxiliary equipment [years]
Tu exploitation term ofthe unit [years]
v water flow [m3/s]v0 initial water flow [m3/s]vn nominal water flow [m3/s]W energy produced
in average year [kWh/year]ρ density [kg/m3]
INTRODUCTIONUkraine is an energy dependent country which im-ports 62% of natural gas, and 70.5% of consumed oiland oil products, and nuclear material[1, 2, 3, 4]. At5
the end of 2013 over 60% of electricity was gener-ated from natural gas and coal on CHPs (combined
Proceedings from The 55th Conference on Simulation and Modelling (SIMS 55), 21-22 October, 2014. Aalborg, Denmark
7
heat and power plants) and TPPs (thermal power sta-tions), about 25% was generated from nuclear andabout 10% from large-scale hydropower[5]. As en-10
ergy price is steadily growing both individual con-sumers and industry are highly concerned on de-creasing their grid energy dependence.Energy carriers have a significant influence on thegross domestic product (GDP) level and economi-15
cal development of the state[6, 7]. When analyzingthe vulnerability of consumers to energy resources’price change, it appeared that the population’s con-sumption is partially subsidized, while industry ishighly vulnerable to any fluctuations of energy tar-20
iff. The most energy consuming industries are iron& steel, non-ferrous, chemical and petrochemical in-dustries. In 2011 chemical and petrochemical indus-try consumed 6,248.5 millions kWh, which is 4.1%of the total electricity consumption[8].25
According to the goals of the Energy Strategy ofUkraine the country is focusing on diversification ofenergy sources and wide implementation of renew-able energy sources (RES), which should provide10% of total electricity generation[9] by 2030. This30
goal will also meet the agreements Ukraine signedon mitigating climate change and pollution[10],since Ukraine has one of the highest levels of air pol-lution in Europe[11]. Producing green house gases(GHGs) emissions during both technological pro-35
cesses, and consuming energy industry has a signif-icant carbon footprint, which is hardly regulated bygovernmental policies.In this article the case of a fertilizer plant is consid-ered as a typical example for a chemical industry in40
Ukraine. An ammonia plant mainly uses two typesof energy carriers: natural gas and electricity[12].Energy use, especially for ammonia production, hasbeen growing since the 1960s due to expansion ofproduction[13].45
Energy price takes a large share in the prime costformation of produced goods, thus affecting the mar-ket position and the ability to be internationally vi-able for the producers. Nowadays industrial plantsin Ukraine obtain electricity from the Unified Elec-50
tricity Grid of Ukraine (the UEG). Ammonia pro-duction has a high potential for energy saving viamodernization of technological processes[14]; thearticle does not consider them because of high in-vestment costs and region peculiarities. To raise the55
reliability and decrease the dependence on a single
supplier the following actions are suggested:
• improving energy efficiency of local energysystem (equipment modernization, energy sav-ing measures);60
• diversification of suppliers and tariff’s change;
• modeling combined supply system.
Such energy systems are combined from renewableand alternative energy sources with or without con-nection to unified grid. They allow to use energy65
more fully and optimize energy flows via close in-teraction between different parts of energy complex.They are widely implemented for households andresorts in remote areas [15, 16, 17]; however, anexplicit mechanism for modeling combined energy70
supply system for industrial plants is not yet devel-oped.
DIVERSIFICATION OF POWER SUPPLYIn industry traditionally the supply from othersources has not been considered as it has not beenproven to be profitable. Resources for implemen-75
tation, accurate demand forecast, grid requirementsand holistic benefit are hard for intrinsic estimation.However, diversification of energy sources for lo-cal energy systems, especially industrial plants, canlead to significant decrease of energy expenses. In80
its turn, it will decrease the energy intensity of pro-duction and energy expenses share in final goodsprice[18]. This will lead to higher competitive-ness on the market. In fact, including “green en-ergy" in energy supply can raise social acceptance85
and attract the “smart-consuming" customers[19].Developed methodology includes analysis of eco-climatological conditions, possibility for connectionto the secondary service and technological processesanalysis. The considered renewable energy sources90
are wind, solar PV energy (which are intermittentsources) and hydro-power (which is more reliable).The plant is located in industrial region. Due to lackof available biomass such electricity plant was notconsidered in this case study. As an alternative en-95
ergy source improving general efficiency of energyuse a turbogenerator is considered.The localization of energy suppliers can have pos-itive influence on decreasing the number of cur-rent long distance electricity transmission. The con-100
Proceedings from The 55th Conference on Simulation and Modelling (SIMS 55), 21-22 October, 2014. Aalborg, Denmark
8
sumption was growing through years and the trans-mission capacity did not bringing the exhaustion ofequipment. The distribution of energy sources canhelp to lessen the load on the transmission lines anddecrease transmission losses. In this article a model105
for electricity supply is worked out for a fertiliz-ers plant with potential ability for alternative sourcesconnection. The following questions are discussed:
Which configuration of combined system is themost effective?110
Can a combined system lead to economicalbenefits?
What environmental effect will be gained if acombined system is installed?
What is the payback period for such system?115
The software used for modeling and analyzingthe hybrid system is RETScreen 4 software[20].RETScreen is a free tool for modeling, simulationand pre-feasibility study of energy effective andenvironmental-friendly systems. It provides eco-120
climatological and meteorological data for most re-gions of the world (from NASA data) and also usesan extensive database for equipment (solar panelcollector, pumps, pipes etc), making it an excel-lent tool for pre-feasibility and environmental stud-125
ies. The software was adapted to the case of the in-dustrial plant, however, hand calculations can alsobe applied. Alternative software to RETScreen likeHOMER or Hybrid2 can be also used[21].
THEORY AND CALCULATIONWhile modeling a local supply system, the follow-130
ing aspects should be considered: reliability andconditions of energy sources, transmission capac-ity and environmental impact. Considering inter-mittent availability of some sources it is necessaryto provide accurate forecasting on both demand and135
supply sides. Establishing combined energy sys-tem requires simultaneous to power curve fluctua-tions demand-side management (DSM) for decreas-ing network risks[22, 23]. DSM is required forfurther optimization of combined system function-140
ing via attribution an optimization target function.The majority of big enterprises operate with constantelectricity demand with no peak or minimum load asthey have normalized product output per hour. The
energy supply should be constant and reliable, as it145
can lead to money loss.When reviewing the energy system of the fertilizersplant in the Rivne region a possibility for connectingalternative sources was found. The analyzed fertil-izers plant uses mostly two energy carriers: natu-150
ral gas and electricity, which cannot be substituted.Combination of renewable and alternative energysources with the UEG can create a stable and diverseenergy system able to provide the cheapest availableenergy at every moment of time. The fertilizers plant155
does not produce bio-waste, thus potential for devel-oping biogas utility is low. Eco-climatological con-ditions and available territory should be scrutinizedto evaluate if they are potentially good for installinglarge wind or solar PV stations. In technological160
processes natural gas is used not only for energy,but as a raw material. During the ammonia produc-tion(fig. ) natural gas, water and electricity are used;and, heat is produced. Ammonia is obtained fromnatural gas after carbon monoxide conversion and165
gas purification from CO2. Ammonia synthesis inthe fertilizers plant happens in reactors under pres-sure 280–330 bar. To compress syngas four-stagecompressor with a nominal capacity of 32 MW anda productive capacity of 1360 t NH3 per day is used.170
Its turbine consumes 350–370 t of vapor received af-ter reforming with parameters 100 bar and 482 ◦Cper hour. This turbine produces and the compressorconsumes the biggest amount of mechanical ener-gy/work. Energy losses under exhaust steam con-175
densation are about 1.465–1.675 GJ/t NH3. Analyz-ing technological processes [13] of fertilizers plantthe following conversion takes place:
N2 +3H2 = 2NH3 +heat (1)
The compression energy during the process converts180
into heat, which is transferred further with the va-por. This vapor at 105 atm does not perform usefulwork. According to Ukrainian legislative frameworkthe high-temperature vapor cannot be released intoatmosphere. Thus, the enterprise should waste addi-185
tional energy on compressors and pumps for coolingpurposes. During the cooling processes water ob-tained from the nearby river is used. The river has ahigh energy potential according to its head and flow,besides, it is affluent enough to be used during all190
year.The proposed cases for combined energy system for
Proceedings from The 55th Conference on Simulation and Modelling (SIMS 55), 21-22 October, 2014. Aalborg, Denmark
9
Figure 1: Technological scheme
the fertilizers plant operate on the UEG combinedwith 1) a turbogenerator on exhaust vapor; 2) a mini-hydropower plant; 3) a solar PV station and 4) a195
wind power station.The following combinations can become more com-plex if interconnected and operating either in se-quential or in parallel mode. To calculate the ex-penses from non-renewable energy sources eq. 2 can200
be used.
C =Cu
Tu ·W+ cm + c f ·q (2)
where: Cu: cost of the turbogenerator unit, $; Tu:exploitation term of the unit, years; W : energy pro-duced in average year, kWh/year; cm: maintenancecost, $/kWh; c f : cost of fuel unit, $/m3 (in the case205
of the turbo generator the price is already includedas it has been used for ammonia production); q: fueluse per kWh, m3/kWh. The expenses from renew-able energy sources are obtained through eq. 3.
C = (Cu
Tu+
Cu ·beq
Teq)× 1+bm
W(3)
where Cu: cost of generating unit, $; Tu: exploitation210
term of the unit, years; W : energy produced in aver-age year, kWh/year; Teq: exploitation term for aux-
iliary equipment, years; beq: specific cost for auxil-iary equipment as a share from main; bm: specificmaintenance cost from the main funds.215
Energy consumption
The energy model is typical for fertilizers plants inUkraine. They have a constant energy consumptionnot much depending on day, season, year (fig. ) withtraditionally normalized production output. The av-220
erage day load is 1656 MW, and the major con-sumers are compressors for NH3–H2 circulation,turbine, additional heater, filters, reformers etc.
Figure 2: Load curve of the fertilizers plant
Turbogenerator
Cogeneration has proved itself cost-efficient in225
many industrial sectors [24, 25] with its short pay-back period and high energy potential. The inputparameters for turbogenerator in table 1 are used tocalculate energy saving from installation. A turbo-generator for the case perform work during all year230
(except for maintenance period) since waste vaporrequires utilization. The theoretical capacity of thegenerator is 12,926 kW.
Hydropower
The plant uses water for technological processes235
from the nearest river. The characteristics of flow(5.2 m3/s) and head (25 m) allow to calculate theo-retical power capacity via eq. 4.
Pth = ρ × v×g×h (4)Proceedings from The 55th Conference on Simulation and Modelling (SIMS 55), 21-22 October, 2014. Aalborg, Denmark
10
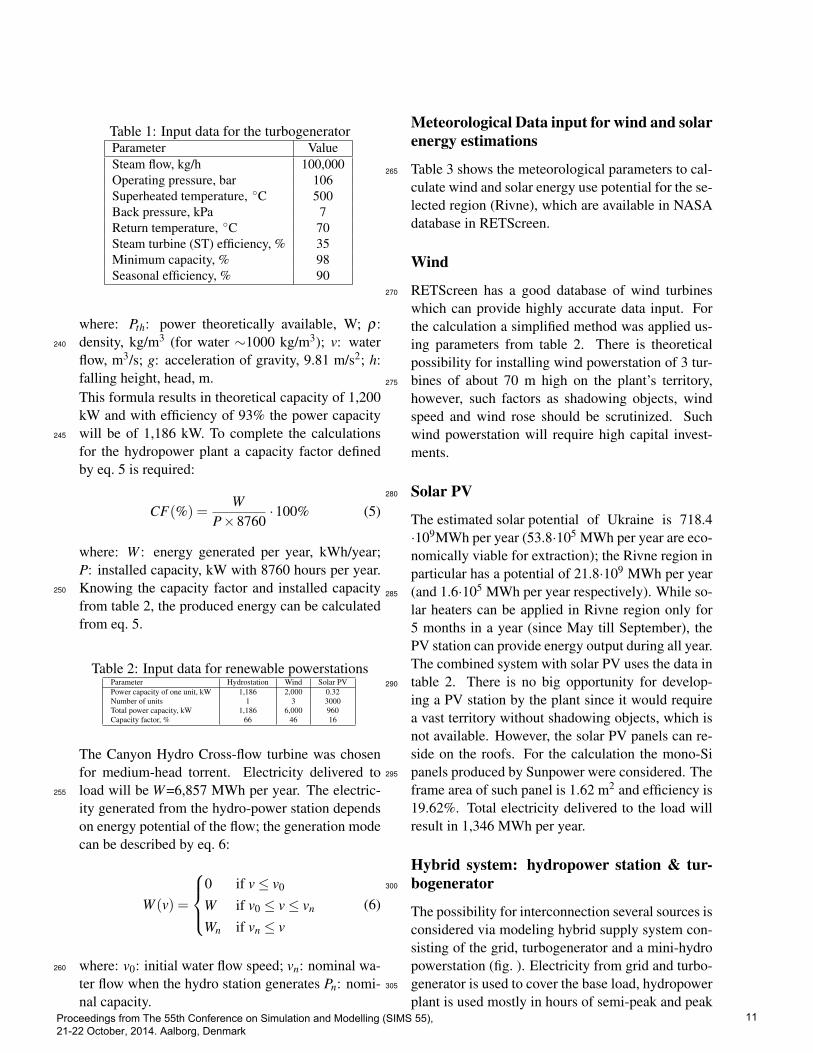
Table 1: Input data for the turbogeneratorParameter ValueSteam flow, kg/h 100,000Operating pressure, bar 106Superheated temperature, ◦C 500Back pressure, kPa 7Return temperature, ◦C 70Steam turbine (ST) efficiency, % 35Minimum capacity, % 98Seasonal efficiency, % 90
where: Pth: power theoretically available, W; ρ:density, kg/m3 (for water ∼1000 kg/m3); v: water240
flow, m3/s; g: acceleration of gravity, 9.81 m/s2; h:falling height, head, m.This formula results in theoretical capacity of 1,200kW and with efficiency of 93% the power capacitywill be of 1,186 kW. To complete the calculations245
for the hydropower plant a capacity factor definedby eq. 5 is required:
CF(%) =W
P×8760·100% (5)
where: W : energy generated per year, kWh/year;P: installed capacity, kW with 8760 hours per year.Knowing the capacity factor and installed capacity250
from table 2, the produced energy can be calculatedfrom eq. 5.
Table 2: Input data for renewable powerstationsParameter Hydrostation Wind Solar PVPower capacity of one unit, kW 1,186 2,000 0.32Number of units 1 3 3000Total power capacity, kW 1,186 6,000 960Capacity factor, % 66 46 16
The Canyon Hydro Cross-flow turbine was chosenfor medium-head torrent. Electricity delivered toload will be W=6,857 MWh per year. The electric-255
ity generated from the hydro-power station dependson energy potential of the flow; the generation modecan be described by eq. 6:
W (v) =
0 if v ≤ v0
W if v0 ≤ v ≤ vn
Wn if vn ≤ v
(6)
where: v0: initial water flow speed; vn: nominal wa-260
ter flow when the hydro station generates Pn: nomi-nal capacity.
Meteorological Data input for wind and solarenergy estimations
Table 3 shows the meteorological parameters to cal-265
culate wind and solar energy use potential for the se-lected region (Rivne), which are available in NASAdatabase in RETScreen.
Wind
RETScreen has a good database of wind turbines270
which can provide highly accurate data input. Forthe calculation a simplified method was applied us-ing parameters from table 2. There is theoreticalpossibility for installing wind powerstation of 3 tur-bines of about 70 m high on the plant’s territory,275
however, such factors as shadowing objects, windspeed and wind rose should be scrutinized. Suchwind powerstation will require high capital invest-ments.
Solar PV280
The estimated solar potential of Ukraine is 718.4·109MWh per year (53.8·105 MWh per year are eco-nomically viable for extraction); the Rivne region inparticular has a potential of 21.8·109 MWh per year(and 1.6·105 MWh per year respectively). While so-285
lar heaters can be applied in Rivne region only for5 months in a year (since May till September), thePV station can provide energy output during all year.The combined system with solar PV uses the data intable 2. There is no big opportunity for develop-290
ing a PV station by the plant since it would requirea vast territory without shadowing objects, which isnot available. However, the solar PV panels can re-side on the roofs. For the calculation the mono-Sipanels produced by Sunpower were considered. The295
frame area of such panel is 1.62 m2 and efficiency is19.62%. Total electricity delivered to the load willresult in 1,346 MWh per year.
Hybrid system: hydropower station & tur-bogenerator300
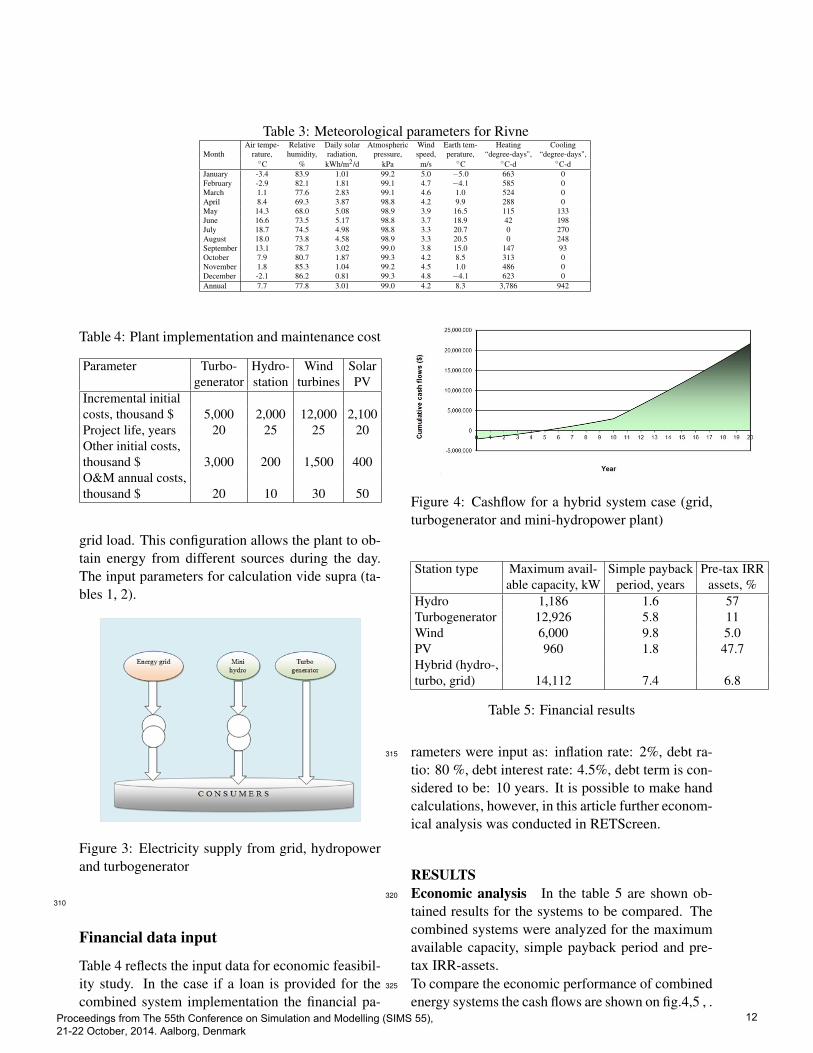
The possibility for interconnection several sources isconsidered via modeling hybrid supply system con-sisting of the grid, turbogenerator and a mini-hydropowerstation (fig. ). Electricity from grid and turbo-generator is used to cover the base load, hydropower305
plant is used mostly in hours of semi-peak and peakProceedings from The 55th Conference on Simulation and Modelling (SIMS 55), 21-22 October, 2014. Aalborg, Denmark
11
Table 3: Meteorological parameters for RivneAir tempe- Relative Daily solar Atmospheric Wind Earth tem- Heating Cooling
grid load. This configuration allows the plant to ob-tain energy from different sources during the day.The input parameters for calculation vide supra (ta-bles 1, 2).
Figure 3: Electricity supply from grid, hydropowerand turbogenerator
310
Financial data input
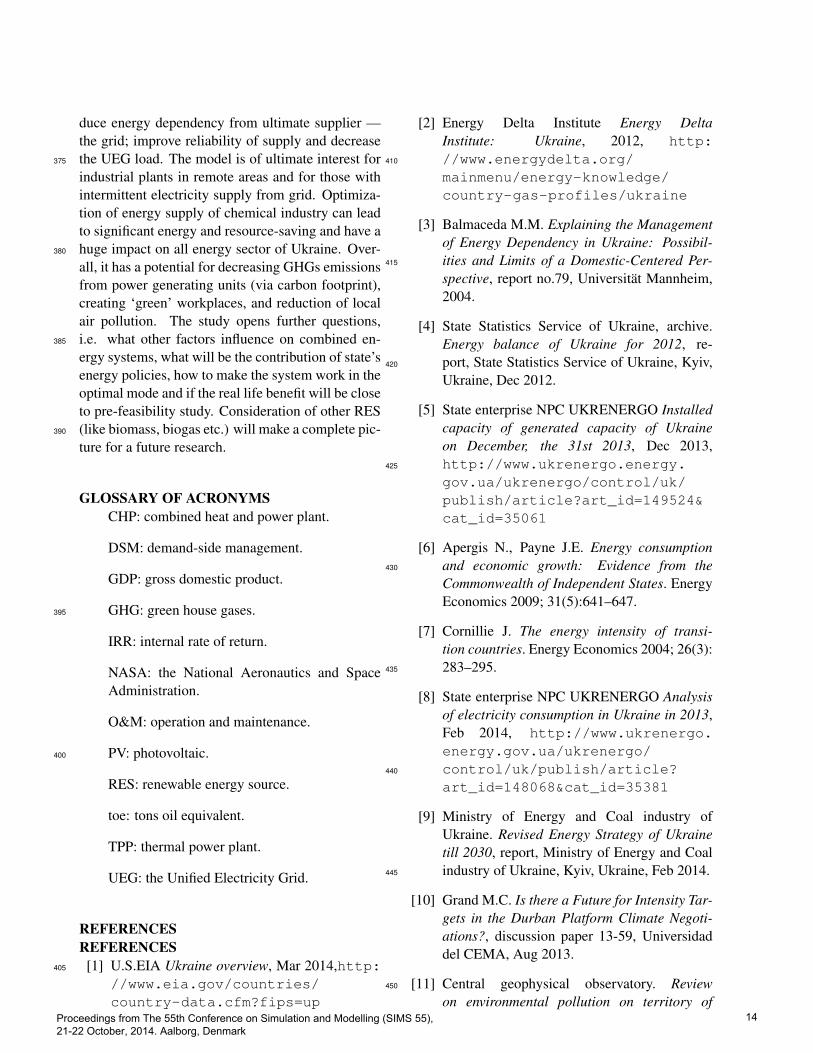
Table 4 reflects the input data for economic feasibil-ity study. In the case if a loan is provided for thecombined system implementation the financial pa-
Figure 4: Cashflow for a hybrid system case (grid,turbogenerator and mini-hydropower plant)
Station type Maximum avail- Simple payback Pre-tax IRRable capacity, kW period, years assets, %
rameters were input as: inflation rate: 2%, debt ra-315
tio: 80 %, debt interest rate: 4.5%, debt term is con-sidered to be: 10 years. It is possible to make handcalculations, however, in this article further econom-ical analysis was conducted in RETScreen.
RESULTSEconomic analysis In the table 5 are shown ob-320
tained results for the systems to be compared. Thecombined systems were analyzed for the maximumavailable capacity, simple payback period and pre-tax IRR-assets.To compare the economic performance of combined325
energy systems the cash flows are shown on fig.4,5 , .Proceedings from The 55th Conference on Simulation and Modelling (SIMS 55), 21-22 October, 2014. Aalborg, Denmark
12
(a) Hydrostation (b) Turbogenerator
(c) Wind station (d) Solar PV station
Figure 5: Comparison of cashflows: Hydrostation, Turbogenerator, Wind station and solar PV station
Energy Net annual GHG emission reductionsource tCO2
Emissions analysis Introduction of combined en-ergy system does not lead to direct GHGs emissionsreduction. Conventional emissions reduction takesplace as less of electricity is taken from the UEG.330
The potential not delivered GHGs can be estimatedby the volume of emissions from the UEG generat-ing units. As the biggest GHGs emitters are coal andgas CHPs, the analysis was provided for both cases(table 6).335
DISCUSSIONFrom the tables 4, 5 it is shown that implementa-tion of the wind powerstation is the most expen-sive project, which requires the longest payback pe-riod (almost 10 years) and a big territory. The hy-dropower plant and the solar PV station have the340
shortest payback period (less than 2 years). Max-imum available capacity is in a close range, how-ever, the hydropower plant can provide with flexi-ble in time energy output and energy accumulationwhile the solar power is intermittent and requires345
precise radiation forecasting system. The turbogen-
erator has the highest potential for energy utilizationvia available capacity (almost 13,000 kW) and lessthan 6 years of payback period, which makes it op-tional for installation. The environmental analysis350
pointed out a significant reduction in GHGs emis-sions while implementing any of before-mentionedcombinations. As the GHGs reduction depends a loton stations’ capacity it is shown (table 6) that windpowerstation has the highest environmental poten-355
tial. In case of the turbogenerator installation thereis no GHGs reduction as it operates on vapor re-ceived during natural gas processing. However, al-most complete utilization of natural gas and wastesallows to say that conditional decrease in emissions360
is taking place.
CONCLUSIONAt the recent level of renewable technologies de-velopment complete refill of industrial energy sup-ply from the grid to the RES is impossible. How-ever, the partial generation is proven to be beneficial.365
RETScreen provided pre-feasibility studies to findthe most viable supply system, which is combinedfrom mini-hydropower plant, turbogenerator and theunified grid. The system can work in sequential or inparallel mode. Solar PV station and wind powersta-370
tion have lower potential performance. Introducingrenewable sources in supply chain will slightly re-
Proceedings from The 55th Conference on Simulation and Modelling (SIMS 55), 21-22 October, 2014. Aalborg, Denmark
13
duce energy dependency from ultimate supplier —the grid; improve reliability of supply and decreasethe UEG load. The model is of ultimate interest for375
industrial plants in remote areas and for those withintermittent electricity supply from grid. Optimiza-tion of energy supply of chemical industry can leadto significant energy and resource-saving and have ahuge impact on all energy sector of Ukraine. Over-380
all, it has a potential for decreasing GHGs emissionsfrom power generating units (via carbon footprint),creating ‘green’ workplaces, and reduction of localair pollution. The study opens further questions,i.e. what other factors influence on combined en-385
ergy systems, what will be the contribution of state’senergy policies, how to make the system work in theoptimal mode and if the real life benefit will be closeto pre-feasibility study. Consideration of other RES(like biomass, biogas etc.) will make a complete pic-390
ture for a future research.
GLOSSARY OF ACRONYMSCHP: combined heat and power plant.
DSM: demand-side management.
GDP: gross domestic product.
GHG: green house gases.395
IRR: internal rate of return.
NASA: the National Aeronautics and SpaceAdministration.
O&M: operation and maintenance.
PV: photovoltaic.400
RES: renewable energy source.
toe: tons oil equivalent.
TPP: thermal power plant.
UEG: the Unified Electricity Grid.
REFERENCESREFERENCES[1] U.S.EIA Ukraine overview, Mar 2014,http:405
//www.eia.gov/countries/country-data.cfm?fips=up
[2] Energy Delta Institute Energy DeltaInstitute: Ukraine, 2012, http://www.energydelta.org/410
[3] Balmaceda M.M. Explaining the Managementof Energy Dependency in Ukraine: Possibil-ities and Limits of a Domestic-Centered Per-415
spective, report no.79, Universität Mannheim,2004.
[4] State Statistics Service of Ukraine, archive.Energy balance of Ukraine for 2012, re-port, State Statistics Service of Ukraine, Kyiv,420
Ukraine, Dec 2012.
[5] State enterprise NPC UKRENERGO Installedcapacity of generated capacity of Ukraineon December, the 31st 2013, Dec 2013,http://www.ukrenergo.energy.425
[6] Apergis N., Payne J.E. Energy consumptionand economic growth: Evidence from the430
Commonwealth of Independent States. EnergyEconomics 2009; 31(5):641–647.
[7] Cornillie J. The energy intensity of transi-tion countries. Energy Economics 2004; 26(3):283–295.435
[8] State enterprise NPC UKRENERGO Analysisof electricity consumption in Ukraine in 2013,Feb 2014, http://www.ukrenergo.energy.gov.ua/ukrenergo/control/uk/publish/article?440
art_id=148068&cat_id=35381
[9] Ministry of Energy and Coal industry ofUkraine. Revised Energy Strategy of Ukrainetill 2030, report, Ministry of Energy and Coalindustry of Ukraine, Kyiv, Ukraine, Feb 2014.445
[10] Grand M.C. Is there a Future for Intensity Tar-gets in the Durban Platform Climate Negoti-ations?, discussion paper 13-59, Universidaddel CEMA, Aug 2013.
[11] Central geophysical observatory. Review450
on environmental pollution on territory ofProceedings from The 55th Conference on Simulation and Modelling (SIMS 55), 21-22 October, 2014. Aalborg, Denmark
Ukraine according to hydrometeorologicalorganizations data in 2013, report, Centralgeophysical observatory, Kyiv, Ukraine, 2009.
[12] Worrell E., Blok K.Energy savings in the nitro-455
gen fertilizer industry in the Netherlands. En-ergy 1994; 19(2): 195–209.
[13] Ramírez C.A., Worrell E. Feeding fossil fu-els to the soil: An analysis of energy embed-ded and technological learning in the fertilizer460
industry. Resources, Conservation and Recy-cling 2006; 46(1): 75-93.
[14] Rafiqul I., Weber C., Lehmann B., Voss A. En-ergy efficiency improvements in ammonia pro-duction – perspectives and uncertainties. En-465
ergy 2005; 30(13):2487–2504.
[15] Ashok S.Optimised model for community-based hybrid energy system. Renewable En-ergy 2007; 32(7): 1155–1164.
[16] Deshmukha M.K., Deshmukh S.S. Modeling470
of hybrid renewable energy systems. Renew-able and Sustainable Energy Reviews 2008;12(1): 235–249.
[17] Bekele G., Tadesse G.Feasibility study of smallHydro/PV/Wind hybrid system for off-grid ru-475
ral electrification in Ethiopia. Applied Energy2012; 97: 5–15.
[18] Jenne C.A., Cattell R.K. Structural changeand energy efficiency in industry. Energy Eco-nomics 1983; 5(2): 114–123.480
[19] Withanachchi S.S. ‘Green Consumption’ be-yond mainstream economy: A discourse analy-sis. Future of Food: Journal on Food, Agricul-ture and Society 2013; 1(1): 69–80.
Canada. RETScreen official web-site, May2014, http://www.retscreen.net/ang/home.php.
[21] Georgilakis P.S. State-of-the-art of decisionsupport systems for the choice of renewable en-490
ergy sources for energy supply in isolated re-gions. Technology & science 2005; 2(2):129–150.
[22] Strbac G. Demand side management: Benefitsand challenges. Energy Policy 2008; 36(12):495
4419–4426.
[23] Paulus M., Borggrefe F. The potential ofdemand-side management in energy-intensiveindustries for electricity markets in Germany.Applied Energy 2009; 88(2): 432–441.500
[24] Costa M.H.A, Balestieri J.A.P. Comparativestudy of cogeneration systems in a chemicalindustry. Applied Thermal Engineering 2001;21(4): 523–533.
[25] Khurana S. Banerjee R., Gaitonde U. En-505
ergy balance and cogeneration for a cementplant. Applied Thermal Engineering 2002; 22(5):485–494.
Proceedings from The 55th Conference on Simulation and Modelling (SIMS 55), 21-22 October, 2014. Aalborg, Denmark