Page 1
JME Journal of Mining & Environment,
Vol.3, No.1, 2012, 1-13.
Selection of the best strategy for Iran's quarries: SWOT-FAHP method
M. M. Tahernejad
1, M. Ataei
1*, R. Khalokakaie
1
1. Faculty of Mining, Petroleum and Geophysics, Shahrood University of Technology; Shahrood, Iran
Received 14 May 2011; received in revised form 29 March 2012; accepted 16 May 2012
*Corresponding author: [email protected] (M. Ataei).
Abstract Iran has high potential and unique stone reserves in terms of variety of color, texture, quality, and economic value; nevertheless, in spite of growing mine production during the past decade, in many instances this potential has been overlooked. Therefore it is necessary to investigate strategic factors of these mines. The purpose of this study is to evaluate and determine the best strategies for Iran’s quarries. To this end, the mines were analyzed using the Strengths, Weaknesses, Opportunities and Threats (SWOT) approach in combination with Fuzzy Analytic Hierarchy Process (FAHP). Firstly, an environmental analysis was performed and then the SWOT factors were identified. In this way, the sub-factors which have very significant effects on the mines were determined. Using the SWOT matrix, alternative strategies were developed. Subsequently, the strategies were prioritized and the best strategies for these mines were determined. The results show that conservative strategies are the best strategy group for Iran’s quarries.
Keywords: SWOT; fuzzy AHP; Decision factors; Strategy; Quarry.
1. Introduction
Dimension stone is any type of natural rock
material that is quarried in order to make blocks
or slabs of rock that is cut to specific sizes and
shapes. Dimensional stone is a collective term for
various natural stones used for structural or
decorative purposes in construction and
monumental applications [1]. Stone production
involves the separation of the block from the
massif in a regular shape and desired dimensions
free of any fracture and flaw as far as possible [2]
important rocks used as dimensional stone are
granite, limestone, marble, sandstone, and slate
[3]. The major application of dimensional stone is
within the construction sector, which accounts for
over 80% of consumption, with the funerary
monumental industry accounting for 15%, and
various special applications for around 3% [4].
Considering the importance of building stones,
strategic analysis of stone mines seems essential.
In this paper, a SWOT (Strengths, Weaknesses,
Opportunities, Threats) analysis was applied using
the fuzzy approaches of a multi-attribute
evaluation method, called the analytic hierarchy
process (AHP) to the dimensional stone mines of
Iran. Strategy selection with SWOT analysis is a
complex problem in which many qualitative
aspects must be considered. These kinds of
aspects make the evaluation process hard and
vague. The judgments from experts are always
vague and linguistic rather than exact values.
Thus, it is suitable and flexible to express the
judgments of experts in fuzzy quantities.
Additionally, the hierarchical structure is a good
approach to describe these kinds of complicated
evaluation problems. Fuzzy AHP has the
capability of taking these situations into account
with a hierarchical structure.
In this study, firstly the factors in the SWOT
groups and alternative strategies were determined.
Then the relative weights of these factors and the
scores of the strategies were computed [4]. The
aim of this study is to determine the priorities of
strategies for Iran’s quarries.
Page 2
Tahernejad et al./ Journal of Mining & Environment, Vol.3, No.1, 2012
2
2. Iran's quarries
Iran's potential is good in the quarry and it is one
of the major producers of dimensional stones. In
terms of variety of color, texture, quality, and
economic value, some of these reserves are unique
and can be extracted and exported, creating jobs
and income for the country [5]. Table 1 shows the
number of active quarries, the numbers of quarries
are preparing, the number of inactive quarries and
the amount of reserve of different dimensional
stones of Iran. As can be seen in Table 1, Iran has
good potential in terms of dimensional stones.
Table 1. Statistics of stone deposits and mines in Iran [6]
Reserve
(1000 tons)
Number of
inactive
quarries
Number of quarries
under development
Number of
active
quarries
Stone
Type
350,307 36 16 155 Travertine
249,148 25 5 156 Porcelain
672,215 26 2 398 Marble
476,691 273 37 232 Granite
1,748,361 360 60 950 Total
3. Using FAHP in SWOT Analysis
In the following discussion, the fundamentals of
SWOT analysis and fuzzy AHP are given. Later,
these techniques are combined to prioritize the
mines strategies.
3.1. SWOT analysis
SWOT analysis is the most common techniques
that can be used to analyze strategic cases [7].
SWOT is a frequently used tool for analyzing
internal and external environments to attain a
systematic approach and support for a decision
situation [8,9]. The internal and external factors
are referred to as strategic factors, and they are
summarized within the SWOT analysis. Strengths
and weaknesses constitute factors within the
system that enable and hinder the organization
from achieving its goal, respectively.
Opportunities and threats were considered as
exogenous factors that facilitate and limit the
organization in attaining its goals, respectively
[10]. SWOT analysis suggests the appropriate
strategies in four categories SO, ST, WO and WT.
The strategies identified as SO, involve making
good use of opportunities by using the existing
strengths. The ST is the strategies associated with
using the strengths to remove or reduce the effects
of threats. Similarly, the WO strategies seek to
gain benefit from the opportunities presented by
the external environmental factors by taking into
account the weaknesses. The fourth and last is
WT, in which the organization tries to reduce the
effects of its threats by taking its weaknesses into
account [9,11]. Figure1 shows how SWOT
analysis fits into an environment scan.
The final goal of a strategic planning process, of
which SWOT is an early stage, is to develop and
adopt a strategy resulting in a good fit between
internal and external factors [12].
Figure1. SWOT analysis framework
3.2. Fuzzy Analytic Hierarchy Process (FAHP)
The concept of fuzzy sets was first presented by
Zadeh [13], which was oriented to the rationality
of uncertainty due to imprecision or vagueness.
Fuzzy sets theory providing a more widely frame
than classic sets theory, has been contributing to
capability of reflecting real world [14]. Fuzzy set
theory is a better means for modeling imprecision
arising from mental phenomena which are neither
random nor stochastic. Human beings are heavily
involved in the process of decision analysis. [15].
AHP is a decision analysis technique aiming at
assessing multi-attribute alternatives [16]. AHP
was proposed by Saaty [17,18]. AHP has been
applied extensively to cope with situations with
multiple criteria where subjective judgment is
inherent. Furthermore, the AHP approach
encourages and assists the user to methodically
and logically appraise the importance of each
criterion in relation to the others in a hierarchical
structure [19]. The traditional AHP still cannot
Page 3
Tahernejad et al./ Journal of Mining & Environment, Vol.3, No.1, 2012
3
really reflect the human thinking style [20]. The
traditional AHP method is problematic in that it
uses an exact value to express the decision
maker’s opinion in a comparison of alternatives
[21]. AHP method is often criticized due to its use
of unbalanced scale of judgments and its inability
to adequately handle the inherent uncertainty and
imprecision in the pair-wise comparison process
[22]. To overcome the shortcomings, FAHP was
developed for solving the hierarchical problems.
In the literature, fuzzy AHP has been widely used
in solving many complicated decision making
problems. Van Laarhoven and Pedrcyz [23]
proposed the first studies that applied fuzzy logic
principle to AHP. Chang [24] introduced a new
approach for handling FAHP, with the use of
triangular fuzzy numbers for pair-wise
comparison scale of FAHP, and the use of the
extent analysis method for the synthetic extent
values of the pair-wise comparisons. Ataei [25]
used multi-criteria decision making for the
selection of the alumina-cement plant location in
the East-Azerbaijan province of Iran. Lee and Lin
[26] combined fuzzy AHP with SWOT to
evaluate the environmental relationships of
international distribution centers in the Pacific-
Asia region. Kahraman et al. [27] used FAHP in
SWOT analysis to evaluate and determine the
alternative strategies for e-government
applications in Turkey. Zare Naghadehi et al. [28]
used FAHP approach to select optimum
underground mining method for Jajarm Bauxite
Mine, Iran. Finally, Nepal et al. [29] proposed a
fuzzy-AHP approach to prioritize customer
satisfaction attributes in target planning for
automotive product development.
In this study the extent FAHP, which was
originally introduced by Chang is utilized [24].
This method uses the triangular fuzzy numbers as
a pair-wise comparison scale for deriving the
priorities of factors and sub-factors. Also
triangular fuzzy numbers are used for pair-wise
comparison matrices. In addition, modeling using
triangular fuzzy numbers has proven to be an
effective way for formulating decision problems
where the information available is subjective and
imprecise [30,31,32]. In practical applications, the
triangular form of the membership function is
used most often for representing fuzzy numbers
[33,34,35]. The definition of the triangular fuzzy
numbers and the steps of Chang’s extent analysis
method are given in Appendix A and B
respectively.
3.4. SWOT- FAHP analysis
Conventional SWOT does not provide the means
to analytically determine the importance of the
factors or to assess decision alternatives according
to the factors [11]. Furthermore, SWOT analysis
cannot appraise the strategic decision-making
situation comprehensively [7]. The results of a
SWOT analysis are often only a listing or an
incomplete qualitative examination of internal and
external factors [36,37,38]. FAHP is utilized in
the SWOT approach to eliminate the weaknesses
in the measurement and evaluation steps of the
SWOT analysis. In this paper SWOT is used in
combination with FAHP to provide a quantitative
measure of the importance of each factor and to
determine the priorities of the strategies. FAHP is
applied in order to determine the overall priorities
of the alternative strategies identified with SWOT
analysis. To this end, these steps should be taken:
Step 1. Identifying SWOT sub-factors and
determining the alternative strategies As a first step, the factors in the SWOT groups
and alternatives strategies should be identified.
SWOT sub-factors should be recognized and the
alternative strategies might be defined according
to SWOT sub-factors. Using SWOT matrix, four
alternative strategy categories including SO, ST,
WO and WT are proposed.
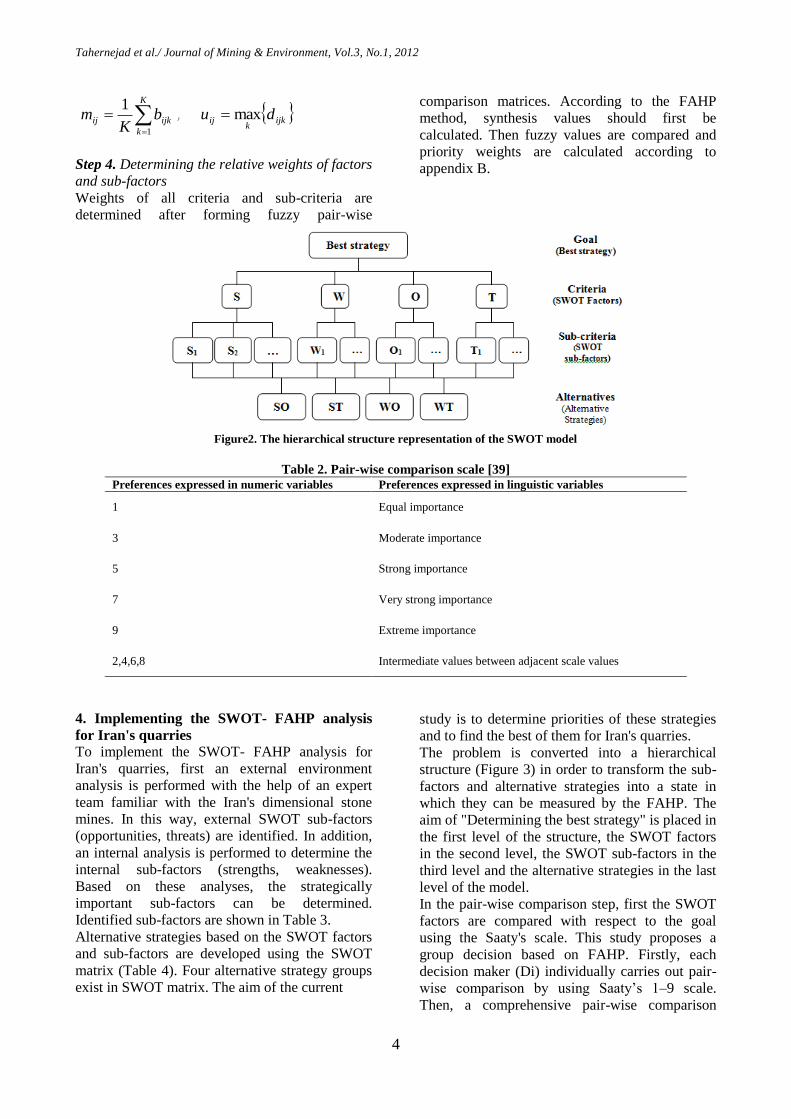
Step 2. Developing hierarchical structure based
on the SWOT factors and sub-factors In this step, the problem to be solved is divided
into a hierarchical structure with decision
elements (Goal, Criteria, Sub-criteria and
alternatives).
Step 3. Pair-wise comparison Decision makers from different backgrounds may
define different weight vectors. They usually
cause not only the imprecise evaluation but also
serious persecution during decision process. For
this reason, group decision was used to improve
pair-wise comparison. Firstly, each decision
maker (Di) individually carries out pair-wise
comparison by using Saaty’s [39] 1–9 scale
(Table 2).
Then, comprehensive pair-wise comparison
matrixes are built by integrating decision makers’
grades through Eq. (1) [40]. In this way, decision
makers’ pair-wise comparison values transform
into triangular fuzzy numbers.
),,()~( ijijijij cbax
ijk
kij al min ,
(1)
Page 4
Tahernejad et al./ Journal of Mining & Environment, Vol.3, No.1, 2012
4
K
k
ijkij bK
m1
1, ijk
kij du max
Step 4. Determining the relative weights of factors
and sub-factors Weights of all criteria and sub-criteria are
determined after forming fuzzy pair-wise
comparison matrices. According to the FAHP
method, synthesis values should first be
calculated. Then fuzzy values are compared and
priority weights are calculated according to
appendix B.
Figure2. The hierarchical structure representation of the SWOT model
Table 2. Pair-wise comparison scale [39]
Preferences expressed in numeric variables Preferences expressed in linguistic variables
1 Equal importance
3 Moderate importance
5 Strong importance
7 Very strong importance
9 Extreme importance
2,4,6,8 Intermediate values between adjacent scale values
4. Implementing the SWOT- FAHP analysis
for Iran's quarries
To implement the SWOT- FAHP analysis for
Iran's quarries, first an external environment
analysis is performed with the help of an expert
team familiar with the Iran's dimensional stone
mines. In this way, external SWOT sub-factors
(opportunities, threats) are identified. In addition,
an internal analysis is performed to determine the
internal sub-factors (strengths, weaknesses).
Based on these analyses, the strategically
important sub-factors can be determined.
Identified sub-factors are shown in Table 3.
Alternative strategies based on the SWOT factors
and sub-factors are developed using the SWOT
matrix (Table 4). Four alternative strategy groups
exist in SWOT matrix. The aim of the current
study is to determine priorities of these strategies
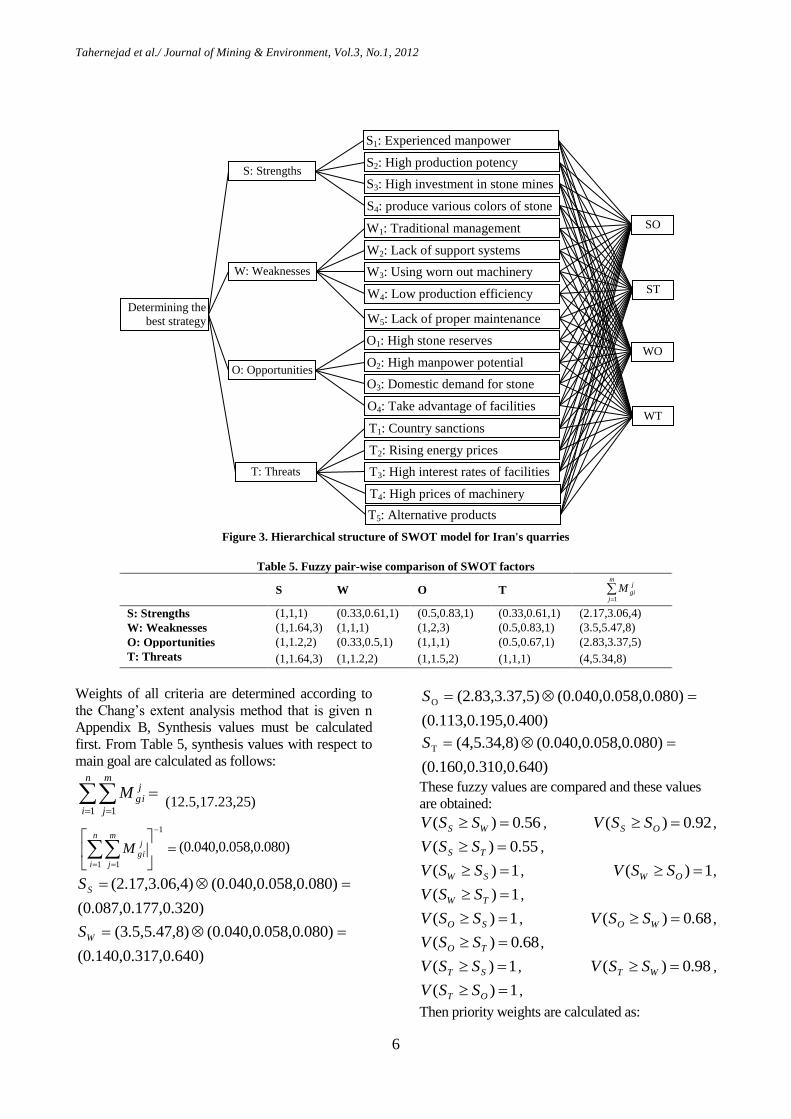
and to find the best of them for Iran's quarries.
The problem is converted into a hierarchical
structure (Figure 3) in order to transform the sub-
factors and alternative strategies into a state in
which they can be measured by the FAHP. The
aim of "Determining the best strategy" is placed in
the first level of the structure, the SWOT factors
in the second level, the SWOT sub-factors in the
third level and the alternative strategies in the last
level of the model.
In the pair-wise comparison step, first the SWOT
factors are compared with respect to the goal
using the Saaty's scale. This study proposes a
group decision based on FAHP. Firstly, each
decision maker (Di) individually carries out pair-
wise comparison by using Saaty’s 1–9 scale.
Then, a comprehensive pair-wise comparison
Page 5
Tahernejad et al./ Journal of Mining & Environment, Vol.3, No.1, 2012
5
matrix is built as in Table 5 by integrating five decision makers’ grades through Eq. (1).
Table 3. SWOT factors and sub-factors for the strategy selection
Factors Sub-factors
Internal
factors
Strengths S1: Existence of experienced manpower in mines
S2: High production according to the above facilities
S3: High investment in stone mines
S4: Feasibility to produce stone with various colors
Weaknesses W1: Traditional management instead of scientific management
W2: Lack of management and support systems, including marketing and sales and etc
W3: Use of old machinery and equipment and not replace them in time
W4: Low production efficiency
W5: Lack of proper maintenance system for machineries and equipments
External
factors
Opportunities O1: Existance of high stone reserves in the country
O2: High manpower potential in the country at various levels
O3: Domestic demand of processing factory for raw stones
O4: Take advantage of the government granted facilities for investment in stone mines
Threats T1: Country sanctions and therefore lack of global effective interactions and tariffs
T2: Rising energy prices and transport costs if subsidies elimination
T3: High interest rates of banking facilities
T4: High prices of machinery and mine operating equipments
T5: Alternative products including ceramic and tile
Table 4. SWOT matrix
Internal factors
Weaknesses (W) Strengths (S)
External factors
W1: Traditional management
W2: Lack of support systems
W3: Using old machinery
W4: Low production efficiency
W5: Lack of proper maintenance
S1: Experienced manpower
S2: High production potency
S3: High investment in stone mines
S4: production of colored stones
Opportunities (O)
WO Strategies 1- Using mechanized systems and
automation to improve production
efficiency
2- Developing the scientific management
in the stone mines
3- Replacing worn out machineries
SO Strategies 1- Developing productions according to
high potential of Iran's stone mines
2- Developing exports considering the
possibility of produce various products
O1: High stone reserves
O2: High manpower potential
O3: Domestic demand for raw stones
O4: Take advantage of facilities
Threats (T)
WT Strategies 1- Government sustaining of domestic
manufactures of equipment and increase
investment in this sector 2- Improving the interaction with various
countries
ST Strategies 1- Increasing competitiveness with the
development of various products 2- Cost reducing with mass production of
good quality products
T1: Country sanctions
T2: Rising energy prices
T3: High interest rates of facilities
T4: High prices of machinery
T5: Alternative products
Page 6
Tahernejad et al./ Journal of Mining & Environment, Vol.3, No.1, 2012
6
Figure 3. Hierarchical structure of SWOT model for Iran's quarries
Table 5. Fuzzy pair-wise comparison of SWOT factors
S W O T
m
j
j
giM1
S: Strengths (1,1,1) (0.33,0.61,1) (0.5,0.83,1) (0.33,0.61,1) (2.17,3.06,4)
W: Weaknesses (1,1.64,3) (1,1,1) (1,2,3) (0.5,0.83,1) (3.5,5.47,8)
O: Opportunities (1,1.2,2) (0.33,0.5,1) (1,1,1) (0.5,0.67,1) (2.83,3.37,5)
T: Threats (1,1.64,3) (1,1.2,2) (1,1.5,2) (1,1,1) (4,5.34,8)
Weights of all criteria are determined according to
the Chang’s extent analysis method that is given n
Appendix B, Synthesis values must be calculated
first. From Table 5, synthesis values with respect to
main goal are calculated as follows:
1 1
n
i
m
j
jgiM
(12.5,17.23,25)
1
1 1
n
i
m
j
j
giM (0.040,0.058,0.080)
77,0.320)(0.087,0.1
58,0.080)(0.040,0.0,4)(2.17,3.06 SS
17,0.640)(0.140,0.3
58,0.080)(0.040,0.08)(3.5,5.47, WS
95,0.400)(0.113,0.1
58,0.080)(0.040,0.0,5)(2.83,3.37O S
10,0.640)(0.160,0.3
58,0.080)(0.040,0.0(4,5.34,8)T S
These fuzzy values are compared and these values
are obtained:
56.0)( WS SSV , 92.0)( OS SSV ,
55.0)( TS SSV ,
1)( SW SSV , 1)( OW SSV ,
1)( TW SSV ,
1)( SO SSV , 68.0)( WO SSV ,
68.0)( TO SSV ,
1)( ST SSV , 98.0)( WT SSV ,
1)( OT SSV ,
Then priority weights are calculated as:
Determining the
best strategy
W: Weaknesses
O: Opportunities
T: Threats
S: Strengths
ST
WO
WT
SO
W5: Lack of proper maintenance
T4: High prices of machinery
T3: High interest rates of facilities
T2: Rising energy prices
T1: Country sanctions
O4: Take advantage of facilities
O3: Domestic demand for stone
O2: High manpower potential
O1: High stone reserves
S1: Experienced manpower S2: High production potency
S3: High investment in stone mines S4: produce various colors of stone W1: Traditional management W2: Lack of support systems W3: Using worn out machinery W4: Low production efficiency
T5: Alternative products
Page 7
Tahernejad et al./ Journal of Mining & Environment, Vol.3, No.1, 2012
7
55.0)55.0,92.0,56.0min()( Sd
1)1,1,1min()( Wd
68.0)68.0,68.0,1min()( Od
98.0)1 0.98, 1,min()( Td
Thus, the weight vector from Table 5 is calculated as W' = (0.55,1,0.68,0.98)
T. The normalized weight
vector is WFactors = (0.171,0.312,0.211,0.306)T.
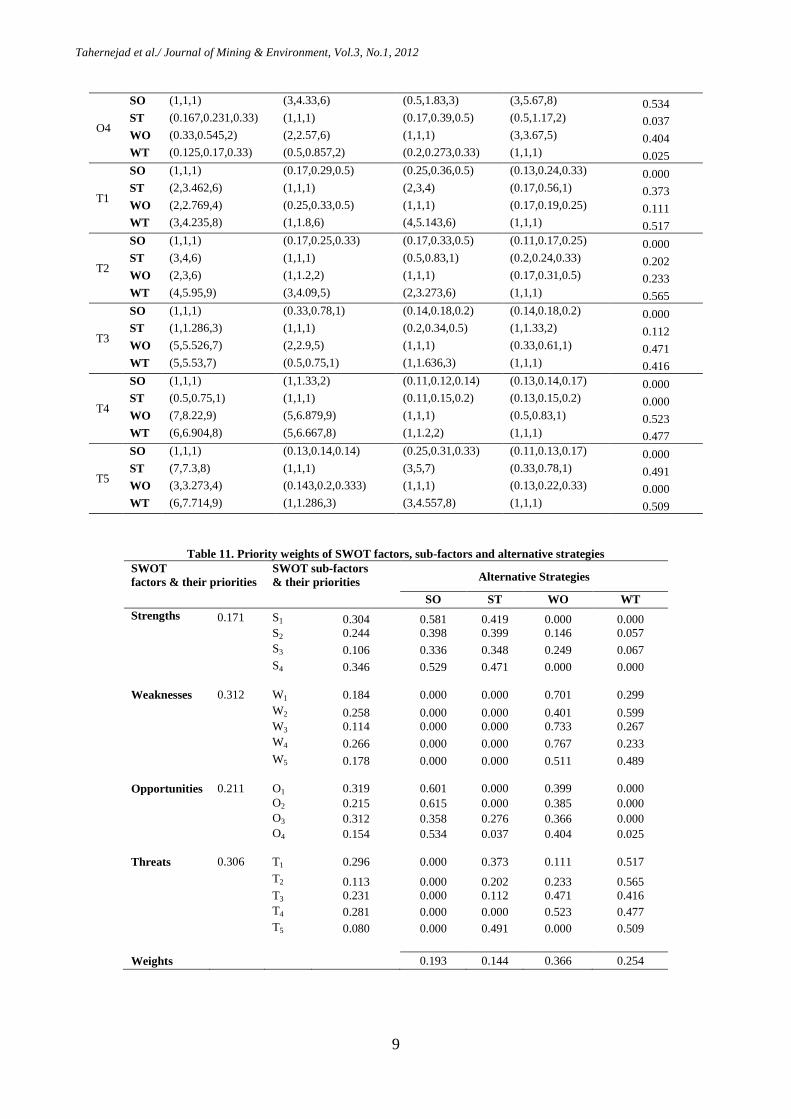
The weights for the SWOT sub-factors and the alternative strategies are calculated in a similar way to the fuzzy evaluation matrices. Pair-wise
comparison matrices for the SWOT sub-factors are given in Tables 6-9 together with the calculated local weights. The local weights of the alternative strategies with respect to each SWOT sub-factors are calculated. The details of the pair-wise comparison matrices and the calculated local weights are provided in Table 10. Figure 4 illustrates the priority weights of the categorized sub-factors. In the last stage of the analysis, overall priority weights of the alternative strategies are calculated as shown in Table 11.
Table 6. Fuzzy pair-wise comparison of strengths
S1 S2 S3 S4 Local weights
S1 (1,1,1) (1,2.33,4) (2,2.67,3) (0.25,0.58,1) 0.304
S2 (0.25,0.429,1) (1,1,1) (1,2.67,5) (0.17,0.31,0.5) 0.244
S3 (0.333,0.375,0.5) (0.2,0.38,1) (1,1,1) (0.2,0.47,1) 0.106
S3 (1,1.714,4) (2,3.27,6) (1,2.14,5) (1,1,1) 0.346
Table 7. Fuzzy pair-wise comparison of weaknesses W1 W2 W3 W4 W5 Local weights
W1 (1,1,1) (0.25,0.417,0.5) (1,2.333,3) (0.167,0.306,0.5) (1,1.67,2) 0.184
W2 (2,2.4,4) (1,1,1) (1,2.67,4) (0.25,0.528,1) (1,2,4) 0.258
W3 (0.333,0.43,1) (0.25,0.375,1) (1,1,1) (0.25,0.528,1) (0.5,0.67,1) 0.114
W4 (2,3.273,6) (1,1.89,4) (1,1.89,4) (1,1,1) (0.333,1.11,2) 0.266
W5 (0. 5,0.6,1) (0.25,0.5,1) (1,1.5,2) (0.5,0.9,3) (1,1,1) 0.178
Table 8. Fuzzy pair-wise comparison of opportunities
O1 O2 O3 O4 Local weights
O1 (1,1,1) (1,1.67,2) (1,1.333,2) (1,3,5) 0.319
O2 (0.5,0.6,1) (1,1,1) (0.33,0.61,1) (0.5,1.5,3) 0.215
O3 (0.5,0.75,1) (1,1.636,3) (1,1,1) (2,3.33,5) 0.312
O4 (0.2,0.333,1) (0.33,0.67,2) (0.2,0.3,0.5) (1,1,1) 0.154
Table 9. Fuzzy pair-wise comparison of threats
T1 T2 T3 T4 T5 Local weights
T1 (1,1,1) (3,0.333,4) (1,2,3) (1,2,3) (1,1.67,3) 0.296
T2 (0.25,0.3,0.333) (1,1,1) (0.25,0.583,1) (0.2,0.511,1) (1,1.333,2) 0.113
T3 (0.333,0.5,1) (1,1.714,4) (1,1,1) (0.2,0.567,1) (1,2.67,4) 0.231
T4 (0.333,0.5,1) (1,1.957,5) (1,1.765,5) (1,1,1) (2,3.67,5) 0.281
T5 (0.333,0.6,1) (0.5,0.75,1) (025,0.375,1) (0.2,0.273,0.5) (1,1,1) 0.080
0
0.02
0.04
0.06
0.08
0.1
S1
S2
S3
S4
W1
W2
W3
W4
W5
O1
O2
O3
O4
T1
T2
T3
T4
T5
Fac
tor
wei
ghts
SWOT factors
Figure 4. The priority weights of the SWOT sub-factors
Page 8
Tahernejad et al./ Journal of Mining & Environment, Vol.3, No.1, 2012
8
Table 10. Pair-wise comparisons of the alternative strategies based on the SWOT sub-factors
SO ST WO WT Local weights
S1
SO (1,1,1) (2,3,4) (3,5,7) (6,6.67,7) 0.581
ST (0.25,0.333,0.5) (1,1,1) (3,3.67,5) (7,7.67,8) 0.419
WO (0.143,0.2,0.333) (0.2,0.273,0.333) (1,1,1) (2,3.33,4) 0.000
WT (0.143,0.15,0.167) (0.125,0.130,0.143) (0.25,0.3,0.5) (1,1,1) 0.000
S2
SO (1,1,1) (0.5,0.83,1) (3,4.33,6) (1,3,5) 0.398
ST (1,1.2,22) (1,1,1) (2,3,4) (2,4,6) 0.399
WO (0.167,0.217,0.33) (0.143,0.2,0.333) (1,1,1) (1,2,3) 0.146
WT (0.2,0.333,1) (0.167,0.25,0.5) (0.333,0.5,1) (1,1,1) 0.057
S3
SO (1,1,1) (0.333,0.78,1) (1,2.67,4) (1,3,5) 0.336
ST (1,1.286,3) (1,1,1) (1,2.33,3) (2,3.33,4) 0.348
WO (0.25,0.375,1) (0.333,0.429,1) (1,1,1) (2,3,4) 0.249
WT (0.2,0.333,1) (0.25,0.3,0.5) (0.25,0.333,0.5) (1,1,1) 0.067
S4
SO (1,1,1) (1,2,3) (5,6,7) (4,6,8) 0.529
ST (0.333,0.5,1) (1,1,1) (4,5.67,7) (4,6,8) 0.471
WO (0.143,0.167,0.2) (0.143,0.176,0.25) (1,1,1) (0.5,1.17,2) 0.000
WT (0.125,0.167,0.25) (0.125,0.167,0.25) (0.5,0.857,2) (1,1,1) 0.000
W1
SO (1,1,1) (2,3.33,5) (0.11,0.167,0.2) (0.25,0.31,0.33) 0.000
ST (0.2,0.3,0.5) (1,1,1) (0.11,0.12,0.13) (0.13,0.16,0.2) 0.000
WO (5,6.279,9) (8,8.308,9) (1,1,1) (1,2.33,3) 0.701
WT (3,3.273,4) (5,6.412,8) (0.333,0.429,1) (1,1,1) 0.299
W2
SO (1,1,1) (0.5,0.83,1) (0.2,0.26,0.33) (0.25,0.31,0.33) 0.000
ST (1,1.2,2) (1,1,1) (0.2,0.34,0.5) (0.2,0.29,0.33) 0.000
WO (3,3.83,5) (2,2.903,5) (1,1,1) (0.33,0.33,0.33) 0.401
WT (3,3.273,4) (3,3.462,5) (3,3,3) (1,1,1) 0.599
W3
SO (1,1,1) (0.5,0.83,1) (0.11,0.13,0.14) (0.14,0.17,0.2) 0.000
ST (1,1.2,2) (1,1,1) (0.11,0.13,0.14) (0.14,0.23,0.33) 0.000
WO (7,8.217,9) (7,7.916,9) (1,1,1) (2,3.33,5) 0.733
WT (5,5.89,7) (3,4.437,7) (0.2,0.3,0.5) (1,1,1) 0.267
W4
SO (1,1,1) (1,1,1) (0.11,0.13,0.14) (0.14,0.16,0.17) 0.000
ST (1,1,1) (1,1,1) (0.11,0.12,0.14) (0.14,0.23,0.33) 0.000
WO (7,7.916,9) (7,8.217,9) (1,1,1) (2,3,4) 0.767
WT (6,6.3,7) (3,4.437,7) (0.25,0.333,0.5) (1,1,1) 0.233
W5
SO (1,1,1) (0.5,0.83,1) (0.2,0.24,0.33) (0.17,0.22,0.33) 0.000
ST (1,1.2,2) (1,1,1) (0.14,0.19,0.25) (0.2,0.26,0.33) 0.000
WO (3,4.091,5) (4,5.362,7) (1,1,1) (0.33,0.78,1) 0.511
WT (3,4.5,6) (3,3.83,5) (1,1.286,3) (1,1,1) 0.489
O1
SO (1,1,1) (4,5.67,7) (1,2,3) (5,6.33,8) 0.601
ST (0.143,0.176,0.25) (1,1,1) (0.17,0.25,0.33) (0.5,0.83,1) 0.000
WO (0.333,0.5,1) (3,4,6) (1,1,1) (3,4.33,6) 0.399
WT (0.125,0.158,0.2) (1,1.2,2) (0.167,0.23,0.33) (1,1,1) 0.000
O2
SO (1,1,1) (5,6.67,8) (1,2.33,4) (5,6.33,8) 0.615
ST (0.125,0.15,0.2) (1,1,1) (0.14,0.23,0.33) (0.5,1.17,2) 0.000
WO (0.25,0.429,1) (3,4.437,7) (1,1,1) (3,4.33,5) 0.385
WT (0.125,0.158,0.2) (0.5,0.857,2) (0.2,0.231,0.333) (1,1,1) 0.000
O3
SO (1,1,1) (0.33,1.11,2) (2,2.67,3) (3,3.33,4) 0.358
ST (0.5,0.9,3) (1,1,1) (1,1.67,3) (1,2,3) 0.276
WO (0.33,0.38,0.5) (0.333,0.6,1) (1,1,1) (5,6.33,8) 0.366
WT (0.25,0.3,0.33) (0.33,0.5,1) (0.125,0.158,0.2) (1,1,1) 0.000
Page 9
Tahernejad et al./ Journal of Mining & Environment, Vol.3, No.1, 2012
9
O4
SO (1,1,1) (3,4.33,6) (0.5,1.83,3) (3,5.67,8) 0.534
ST (0.167,0.231,0.33) (1,1,1) (0.17,0.39,0.5) (0.5,1.17,2) 0.037
WO (0.33,0.545,2) (2,2.57,6) (1,1,1) (3,3.67,5) 0.404
WT (0.125,0.17,0.33) (0.5,0.857,2) (0.2,0.273,0.33) (1,1,1) 0.025
T1
SO (1,1,1) (0.17,0.29,0.5) (0.25,0.36,0.5) (0.13,0.24,0.33) 0.000
ST (2,3.462,6) (1,1,1) (2,3,4) (0.17,0.56,1) 0.373
WO (2,2.769,4) (0.25,0.33,0.5) (1,1,1) (0.17,0.19,0.25) 0.111
WT (3,4.235,8) (1,1.8,6) (4,5.143,6) (1,1,1) 0.517
T2
SO (1,1,1) (0.17,0.25,0.33) (0.17,0.33,0.5) (0.11,0.17,0.25) 0.000
ST (3,4,6) (1,1,1) (0.5,0.83,1) (0.2,0.24,0.33) 0.202
WO (2,3,6) (1,1.2,2) (1,1,1) (0.17,0.31,0.5) 0.233
WT (4,5.95,9) (3,4.09,5) (2,3.273,6) (1,1,1) 0.565
T3
SO (1,1,1) (0.33,0.78,1) (0.14,0.18,0.2) (0.14,0.18,0.2) 0.000
ST (1,1.286,3) (1,1,1) (0.2,0.34,0.5) (1,1.33,2) 0.112
WO (5,5.526,7) (2,2.9,5) (1,1,1) (0.33,0.61,1) 0.471
WT (5,5.53,7) (0.5,0.75,1) (1,1.636,3) (1,1,1) 0.416
T4
SO (1,1,1) (1,1.33,2) (0.11,0.12,0.14) (0.13,0.14,0.17) 0.000
ST (0.5,0.75,1) (1,1,1) (0.11,0.15,0.2) (0.13,0.15,0.2) 0.000
WO (7,8.22,9) (5,6.879,9) (1,1,1) (0.5,0.83,1) 0.523
WT (6,6.904,8) (5,6.667,8) (1,1.2,2) (1,1,1) 0.477
T5
SO (1,1,1) (0.13,0.14,0.14) (0.25,0.31,0.33) (0.11,0.13,0.17) 0.000
ST (7,7.3,8) (1,1,1) (3,5,7) (0.33,0.78,1) 0.491
WO (3,3.273,4) (0.143,0.2,0.333) (1,1,1) (0.13,0.22,0.33) 0.000
WT (6,7.714,9) (1,1.286,3) (3,4.557,8) (1,1,1) 0.509
Table 11. Priority weights of SWOT factors, sub-factors and alternative strategies
SWOT
factors & their priorities
SWOT sub-factors
& their priorities Alternative Strategies
SO ST WO WT
Strengths 0.171 S1 0.304 0.581 0.419 0.000 0.000
S2 0.244 0.398 0.399 0.146 0.057
S3 0.106 0.336 0.348 0.249 0.067
S4 0.346 0.529 0.471 0.000 0.000
Weaknesses 0.312 W1 0.184 0.000 0.000 0.701 0.299
W2 0.258 0.000 0.000 0.401 0.599
W3 0.114 0.000 0.000 0.733 0.267
W4 0.266 0.000 0.000 0.767 0.233
W5 0.178 0.000 0.000 0.511 0.489
Opportunities 0.211 O1 0.319 0.601 0.000 0.399 0.000
O2 0.215 0.615 0.000 0.385 0.000
O3 0.312 0.358 0.276 0.366 0.000
O4 0.154 0.534 0.037 0.404 0.025
Threats 0.306 T1 0.296 0.000 0.373 0.111 0.517
T2 0.113 0.000 0.202 0.233 0.565
T3 0.231 0.000 0.112 0.471 0.416
T4 0.281 0.000 0.000 0.523 0.477
T5 0.080 0.000 0.491 0.000 0.509
Weights 0.193 0.144 0.366 0.254
Page 10
Tahernejad et al./ Journal of Mining & Environment, Vol.3, No.1, 2012
10
0.193
0.144
0.366
0.254
0
0.1
0.2
0.3
0.4
SO ST WO WT
Str
ateg
y W
eigh
t
Alternative Strategies
Figure 5. Ranking of the strategies
The results obtained from the SWOT-FAHP
analysis are shown in Figure 5. According to the
analysis, alternative strategies are ordered as WO,
WT, SO and ST. The results indicate that WO is
the best strategy group with an overall priority
value of 0.366.
5. Discussion and conclusions
Considering the valuable stone deposits in Iran,
analyzing strategic factors and developing
appropriate strategies for the dimensional stone
mines require special attention. In this study, the
SWOT-FAHP hybrid method has been used to
prioritize the alternative strategies and select the
best strategy for these mines. In the SWOT
analysis, strategic alternatives are selected in the
view of the strengths, weaknesses, threats and
opportunities as determined through internal and
external environment analysis. FAHP is used in
the SWOT approach to eliminate the weaknesses
in the measurement and evaluation steps of the
SWOT analysis.
An environment analysis was performed and the
SWOT sub-factors, which have significant effect
on the quarries, were identified. The factors from
the SWOT analysis and the alternative strategies
based on these factors were transformed into an
FAHP model. The first four levels of the FAHP
model consist of a goal (determining the best
strategy group), 4 SWOT factors, 18 SWOT sub-
factors and, 4 alternative strategies respectively.
The relative importance of the alternative
strategies and the overall priorities of the
alternative strategies were calculated. According
to the FAHP analysis, alternative strategies are
ordered as WO, WT, SO and ST. The results
indicate that WO is the best strategy for Iran's
quarries. Therefore, according to the SWOT
matrix, using mechanized systems and automation
to improve production efficiency, develop the
scientific management in the stone mines and
replace worn out machineries were determined as
proper strategies.
The research results emphasize the importance of
using new technologies, mechanized systems and
automation. Furthermore, it is essential that
scientific management improve performance and
productivity in the quarries.
Acknowledgements
The authors would like to acknowledge the
participation of the respondents in this research.
Appendix A.
The triangular fuzzy numbers
A tilde ‘~’ will be placed above a symbol if the
symbol represents a fuzzy set. A triangular fuzzy
number (TFN), M~
is shown in Figure 6. A TFN is
denoted simply as ),( umml or ),,( uml . The
parameters l , m and u , respectively, denote the
smallest possible value, the most promising value,
and the largest possible value that describe a fuzzy
event.
Figure 6. A triangular fuzzy number, M~
Page 11
Tahernejad et al./ Journal of Mining & Environment, Vol.3, No.1, 2012
11
Each TFN has linear representations on its left and
right side such that its membership function can be
defined as
ux
uxm
mxl
lx
muxu
lmlxMx
0
)()(
)()(
0
)~
(
(2)
A fuzzy number can always be given by its
corresponding left and right representation of each
degree of membership:
],1,0[y
),)(,)((
),(~ )()(
yumuylml
MMM yryl
(3)
Where )(yl and )(yr denote the left side
representation and the right side representation of a
fuzzy number, respectively. Many ranking methods
for fuzzy numbers have been developed in the
literature. These methods may give different ranking
results and most methods are tedious in graphic
manipulation requiring complex mathematical
calculation.
Appendix B.
Chang’s extent analysis method
Let nxxxxX ,..., , , 321 an object set, and
nggggG ,..., , , 321 be a goal set. According
to the method of Chang’s extent analysis, each
object is taken and extent analysis for each goal
performed respectively. Therefore, m extent
analysis values for each object can be obtained, with
the following signs:
,21 ,, ... , , 21 , ..., n, iMMM m
gigigi
Where )21( , ..., m, jM j
gi all are TFNs. The
steps of Chang’s extent analysis can be given as in
the following:
Step 1. The value of fuzzy synthetic extent with
respect to the i th object is defined as:
1
1 11
n
i
m
j
j
gi
m
j
j
gii MMS
(4)
To obtain
m
j
j
giM1
, the fuzzy addition operation
of m extent analysis values for a particular matrix is
performed such as:
m
j
m
j
m
j
m
j
jjj
j
gi umlM1 1 1 1
,,
(5)
and to obtain 1
1 1
n
j
m
j
j
giM , the fuzzy
addition operation of ) ..., ,2 ,1( mjM j
gi values
is performed such as:
n
i
m
j
n
i
n
i
n
i
iii
j
gi umlM1 1 1 1 1
,,
(6)
and then the inverse of the vector above is
computed, such as:
n
i i
n
i i
n
i i
n
i
m
j
j
gi
lmu
M
111
1
1 1
1,
1,
1
(7)
Step 2. As ) , ,( 1111 umlM and
) , ,( 2222 umlM are two triangular fuzzy
numbers, the degree of possibility of
) , ,() , ,( 11112222 umlMumlM is defined
as:
))(),(min(sup)(2112 yxMMV MM
xy
(8)
and can be expressed as follows:
)()()(22112 dMMhgtMMV M (9)
otherwise
u if
if
)()(
0
1
21
12
1122
21
l
MM
lmum
ul
(10)
Figure 7. illustrates Eq. (9) where d is the ordinate
of the highest intersection point D between 1M and
2M to compare 1M and 2M , we need both the
values of )( 21 MMV and )( 12 MMV .
Step 3. The degree possibility for a convex fuzzy
number to be greater than k convex fuzzy
) ..., ,2 ,1( kiM i numbers can be defined by:
)( and ... and
)( and )(
) ..., , ,(
21
21
k
k
MM
MMMMV
MMMMV
kiMMV i ..., ,3 ,2 ,1 ),( min
(11)
Page 12
Tahernejad et al./ Journal of Mining & Environment, Vol.3, No.1, 2012
12
Figure 7. The intersection between M1 and M2
Assume that )( min)( kii SSVAd for
iknk ; ..., ,2 ,1 . Then the weight vector is
given by: T
21 ))( ..., ),( ),(( nAdAdAdW
(12)
where ) ..., ,2 ,1( niAi are n elements.
Step 4. Via normalization, the normalized weight
vectors are: T
21 ))( ..., ),( ),(( nAdAdAdW (13)
where W is a non-fuzzy number.
References [1]. Merke, G., (2000). Sustainable development in the
natural stone industry. Roc Maquina, 56-58.
[2]. Adebimpe, R.A., Arogundade, B.A. and Adeoti,
O., (2002). Engineering economy studies on the
production of dimension stone from marble in Nigeria.
Technovation, 22, 259–265.
[3]. Karaca, Z., Deliormanli, A.H., Elci, H. and
Pamukcu, C., (2010). Effect of freeze–thaw process on
the abrasion loss value of stones. International Journal
of Rock Mechanics & Mining Sciences, 47, 1207–
1211.
[4]. Ashmole, I. and Motloung, M., (2008).
DIMENSION STONE: THE LATEST TRENDS IN
EXPLORATION AND PRODUCTION
TECHNOLOGY. The Southern African Institute of
Mining and Metallurgy, Surface Mining, 35-70.
[5]. Ataei, M., (2008). Exploitation of dimensional
stones. Shahrood University of technology
publications, Shahrood. (In Persian).
[6]. Ministry of Industries and Mines information
service of Iran, (2009). Available from
http://www.mim.gov.ir.
[7]. Hill, T. and Westbrook, R., (1997). SWOT
analysis: it’s time for a product recall, Long Range
Planning 30, 46–52.
[8]. Wheelen, T.L. and Hunger, J.D., (1995). Strategic
Management and Business Policy, Addison-Wesley,
Reading, MA.
[9]. Kajanus, M., Kangas, J. and Kurttila, M.,
(2004).The use of value focused thinking and the
A’WOT hybrid method in tourism management,
Tourism Management 25, 499–506.
[10]. Wasike, C.B., Magothe, T.M., Kahi, A.K., and
Peters, K.J., (2010). Factors that influence the
efficiency of beef and dairy cattle recording system in
Kenya: A SWOT–AHP analysis, Trop Anim Health
Prod, DOI: 10.1007/s11250-010-9666-3.
[11]. Yuksel, I. and Dagdeviren, M., (2007). Using the
analytic network process (ANP) in a SWOT analysis –
A case study for a textile firm. Information Sciences,
177, 3364–3382.
[12]. Weihrich, H., (1982). The TOWS matrix–a tool
for situation analysis, Long Range Planning,15(2), 54-
66.
[13]. Zadeh, L.A., (1965). Fuzzy sets. Information and
Control, 8, 338–353.
[14]. Ertugrul, I. and Tus, A., (2007). Interactive fuzzy
linear programming and an application sample at a
textile firm. Fuzzy Optimization and Decision Making,
6, 29-49.
[15]. Lai, Y.J. and Hwang, C.L., (1996). Fuzzy
multiple objective decision making. Berlin: Springer.
[16]. Carmone, F.J., Jr., Kara, A., and Zanakis, S.H.,
(1997). A Monte Carlo investigation of incomplete
pairwise comparison matrices in AHP. European
Journal of Operational Research, 102, 538–553.
[17]. Saaty, T.L., (1977). A scaling method for
priorities in hierarchical structures. Journal of
Mathematical Psychology, 15 (3), 234–281.
[18]. Saaty, T.L., (1994). Highlights and critical points
in the theory and application of the analytic hierarchy
process. European Journal of Operational Research, 74,
426–447.
[19]. Levary, R. R., and Wan, K., (1999). An analytic
hierarchy process based simulation model for entry
mode decision regarding foreign direct investment.
Omega: The International Journal of Management
Science, 27, 661–677.
[20]. Kahraman, C., Cebeci, U. and Ulukan, Z., (2003).
Multi-criteria supplier selection using fuzzy AHP.
Logistics Information Management, 16(6), 382–394.
[21]. Wang, T.C. and Chen, Y.H., (2007). Applying
consistent fuzzy preference relations to partnership
selection. Omega, the International Journal of
Management Science, 35, 384–388.
[22]. Deng, H., (1999). Multicriteria analysis with
fuzzy pair-wise comparison. International Journal of
Approximate Reasoning, 21, 215–231.
Page 13
Tahernejad et al./ Journal of Mining & Environment, Vol.3, No.1, 2012
13
[23]. Van Laarhoven, P.J.M. and Pedrcyz, W., (1983).
A fuzzy extension of Saaty’s priority theory. Fuzzy
Sets and Systems, 11, 229–241.
[24]. Chang, D.Y., (1996). Applications of the extent
analysis method on fuzzy AHP. European Journal of
Operational Research, 95, 649–655.
[25]. Ataei, M., (2005). Multi-criteria selection for
alumina-cement plant location in East-Azerbaijan
province of Iran. The Journal of the South African
Institute of Mining and Metallurgy 105(7), 507–514.
[26]. Lee, K.L. and Lin, S.C., (2008). A fuzzy
quantified SWOT procedure for environmental
evaluation of an international distribution center.
Information science, 178, 531-549.
[27]. Kahraman, C., Demirel, N.C., Demirel, T. and
Yasin N., (2008). A SWOT-AHP Application Using
Fuzzy Concept: E-Government in Turkey. Fuzzy
Multi-Criteria Decision Making Optimization and Its
Applications, 16, 85-117.
[28]. Zare Naghadehi, M., Mikaeil, R. and Ataei, M.,
(2009). The Application of Fuzzy Analytic Hierarchy
Process (FAHP) Approach to Selection of Optimum
Underground Mining Method for Jajarm Bauxite Mine,
Iran. Expert Systems with Applications 36, 8218–8226.
[29]. Nepal, B., Yadav, O.P. and Murat, A., (2010). A
fuzzy-AHP approach to prioritization of CS attributes
in target planning for automotive product development.
Expert Systems with Applications, 37, 6775–6786.
[30]. Chang, Y.H and Yeh, C.H. (2002). A survey
analysis of service quality for domestic airlines,
European Journal of Operational Research 139, 166–
177.
[31]. Chang, H.Y., Chung, Y.H. and Wang, S.Y.
(2007). A survey and optimization-based evaluation of
development strategies for the air cargo industry,
International Journal of Production Economics 106,
550–562.
[32]. Kahraman, C., Cebeci, U. and Ruan, D. (2004).
Multi-attribute comparison of catering service
companies using fuzzy AHP: the case of Turkey,
International Journal of Production Economics 87,
171–184.
[33]. Ding, J.F. and Liang, G.S. (2005). Using fuzzy
MCDM to select partners of strategic alliances for liner
shipping, Information Sciences 173, 197–225.
[34]. Karsak, E.E. and Tolga, E. (2001). Fuzzy multi-
criteria decision-making procedure for evaluating
advanced manufacturing system investments,
International Journal of Production Economics 69, 49–
64.
[35]. Xu, Z.S. and Chen, J. (2007). An interactive
method for fuzzy multiple attribute group decision
making, Information Sciences 177, 248–263.
[36]. Kangas, J., Kurtila, M., Kajanus, M. and Kangas,
A., (2003). Evaluating the management strategies of a
forestland estate-the S-O-S approach, Journal of
Environmental Management 69, 349–358.
[37]. Kurttila, M., Pesonen, M., Kangas, J. and
Kajanus, M., (2000). Utilizing the analytic hierarchy
process AHP in SWOT analysis – a hybrid method and
its application to a forest-certification case. Forest
Policy andEconomics 1, 41–52.
[38]. Chang, H.H.and Huang, W.C., (2006).
Application of a quantification SWOT analytical
method, Mathematical and Computer Modeling 43:
158–169.
[39]. Saaty, T.L., (1980). The analytic hierarchy
process. New York: McGraw-Hill.
[40]. Chen, C.T., Lin, C.T., and Huang, S.F., (2006). A
fuzzy approach for supplier evaluation and selection in
supply chain management. International Journal of
Production Economics, 102, 289–301.