Page 1
RESEARCH REPOSITORY
This is the author’s final version of the work, as accepted for publication following peer review but without the publisher’s layout or pagination.
The definitive version is available at:
http://dx.doi.org/10.1016/j.watres.2017.03.045
Khalfbadam, H.M., Ginige, M.P., Sarukkalige, R., Kayaalp, A.S. and Cheng, K.Y. (2017) Sequential solid entrapment and in situ electrolytic
alkaline hydrolysis facilitated reagent-free bioelectrochemical treatment of particulate-rich municipal wastewater. Water Research, 11 . pp. 18-26.
http://researchrepository.murdoch.edu.au/id/eprint/36284/
Copyright © 2017 Elsevier Ltd.
Page 2
Accepted Manuscript
Sequential solid entrapment and in situ electrolytic alkaline hydrolysis facilitatedreagent-free bioelectrochemical treatment of particulate-rich municipal wastewater
Hassan Mohammadi Khalfbadam, Maneesha P. Ginige, Ranjan Sarukkalige, AhmetS. Kayaalp, Ka Y. Cheng
PII: S0043-1354(17)30229-4
DOI: 10.1016/j.watres.2017.03.045
Reference: WR 12782
To appear in: Water Research
Received Date: 23 February 2017
Revised Date: 20 March 2017
Accepted Date: 21 March 2017
Please cite this article as: Khalfbadam, H.M., Ginige, M.P., Sarukkalige, R., Kayaalp, A.S., Cheng,K.Y., Sequential solid entrapment and in situ electrolytic alkaline hydrolysis facilitated reagent-freebioelectrochemical treatment of particulate-rich municipal wastewater, Water Research (2017), doi:10.1016/j.watres.2017.03.045.
This is a PDF file of an unedited manuscript that has been accepted for publication. As a service toour customers we are providing this early version of the manuscript. The manuscript will undergocopyediting, typesetting, and review of the resulting proof before it is published in its final form. Pleasenote that during the production process errors may be discovered which could affect the content, and alllegal disclaimers that apply to the journal pertain.
Page 3
MANUSCRIP
T
ACCEPTED
ACCEPTED MANUSCRIPT
Page 4
MANUSCRIP
T
ACCEPTED
ACCEPTED MANUSCRIPT
1
Submit to Water Research 1
2
Sequential solid entrapment and in situ electrolytic alkaline hydrolysis 3
facilitated reagent-free bioelectrochemical treatment of particulate-rich 4
municipal wastewater 5
6
Hassan Mohammadi Khalfbadama,b, Maneesha P. Ginigea, Ranjan Sarukkaligeb, Ahmet S. 7
Kayaalpc, Ka Y Chenga,d* 8
9
a CSIRO Land and Water, Floreat, Western Australia, 6014, Australia. 10
b Department of Civil Engineering, Curtin University, Bentley, Western Australia, 6102, 11
Australia. 12
c Water Corporation of Western Australia, Western Australia, 6007, Australia. 13
d School of Engineering and Information Technology, Murdoch University, Western Australia 14
6150, Australia. 15
16
17
*Corresponding author. Tel: +61 8 9333 6158; Fax: +61 8 933 6499. 18
E-mail address: [email protected] (Ka Yu Cheng) 19
20
Page 5
MANUSCRIP
T
ACCEPTED
ACCEPTED MANUSCRIPT
2
Abstract 21
This study proposed and examined a novel process for the treatment of particulate-rich 22
wastewater. A two- stage combined treatment process, consisting of an electrolysis filter and 23
a bioelectrochemical system (BES) configuration was designed and evaluated to remove 24
particulate and soluble organic matter from municipal wastewater. The system was designed 25
such that the electrolysis step was used as a filter, enabling physical removal and in situ 26
alkaline hydrolysis of the entrapped particulate matter. The alkaline effluent enriched with 27
the hydrolysed soluble compounds (soluble chemical oxygen demand, SCOD) was 28
subsequently loaded into the BES for removal via bioanodic oxidation. The coupled system 29
was continuously operated with a primary sedimentation tank effluent (suspended solids (SS) 30
~200 mg/L) for over 160 days, during which SCOD and total COD (TCOD), SS removal and 31
current production were evaluated. With no sign of clogging the process was able to capture 32
near 100% of the SS loaded. A high Coulombic efficiency (CE) of 93% (based on overall 33
TCOD removed) was achieved. The results also suggest that the SCOD- laden alkaline 34
liquor from the electrolysis step compensated for the acidification in the bioanode and a final 35
effluent containing low COD with neutral pH was achieved. Overall, since the system can 36
effectively entrap, in situ hydrolyse and oxidise organic matter without external chemical 37
dosing for pH control, it has desirable features for practical application. 38
39
Key Words: municipal wastewater; solid entrapment, electrode-driven alkaline hydrolysis; 40
bioelectrochemical systems; sequential; reagent-free 41
42
Page 6
MANUSCRIP
T
ACCEPTED
ACCEPTED MANUSCRIPT
3
1. Introduction 43
Waste stabilisation ponds (WSPs) are commonly used to treat municipal wastewater 44
particularly that of remote communities (Mara et al., 1998). However, maintenance of stable 45
effluent quality of WSPs is challenging and additional treatment processes are often required 46
to minimise discharge of suspended solids (SS) (mostly in form of algal biomass) and 47
dissolved organic carbon (DOC) into the environment (Ellis & Mara, 1983; Mara et al., 48
1992). Rock filters are one of the widely used downstream polishing technologies designed to 49
entrap and oxidise both particulate matter and DOC discharged from WSPs. They rely on 50
passive diffusion of oxygen from the atmosphere to facilitate aerobic biological oxidation of 51
the entrapped organic matter. However, excessive biomass growth and particulate matter 52
accumulation can hinder passive aeration and could result in anaerobic conditions in the filter 53
compromising organic matter removal and hydraulic throughput of the treatment unit. Hence, 54
alternative technologies are desirable for efficient treatment of particulate-rich liquor such as 55
those emanating from failed WSPs. 56
Recently, there has been an effort to develop new technologies to substitute rock filters 57
(Khalfbadam et al., 2016b). Khalfbadam et al. (2016b) proposed a filter-type 58
bioelectrochemical system (BES) termed as “BES filter” to retain and oxidise high particulate 59
matter and soluble chemical oxygen demand (SCOD) effluent. The tubular, dual chamber 60
BES prototype is composed of an outer anodic chamber that encircles an inner cathodic 61
chamber and the two chambers are separated with a cation exchange membrane. The outer 62
anodic chamber was designed as a filtration unit, whereby a carbon felt was installed as both 63
a physical filter and a bioanode to entrap and bioelectrochemically oxidise the suspended 64
organic matter from the wastewater. The study successfully demonstrated the ability of the 65
BES filter to oxidise SCOD in wastewater with a high Coulombic efficiency (CE) of >80% 66
(based on the SCOD removed). The study also demonstrated effective removal of organic 67
Page 7
MANUSCRIP
T
ACCEPTED
ACCEPTED MANUSCRIPT
4
particulate matter from municipal wastewater (83% of SS removal). However, if the CE 68
calculation was based on the coulombs derived from the entrapped particulates, the CE would 69
be very low (~1%). Such a low CE was most likely due to inefficient microbial hydrolysis of 70
the entrapped particulate matter. Indeed, the system proposed by Khalfbadam et al. (2016b) 71
suffered from the following limitations: (1) inefficient hydrolysis of entrapped particulate 72
matter; (2) the need for active control of pH both in the cathodic and anodic chambers of 73
BES; and (3) a huge overpotential for reduction of oxygen at BES cathode. It is imperative to 74
overcome the above limitations should this innovative design be considered as an effluent 75
polishing technology for WSPs. 76
Generally, hydrolysis is often the rate-limiting step in biological treatment processes for 77
waste streams rich in organic solids. Various pre-treatment methods (physical, chemical, 78
biological, and electrochemical) have been examined to improve hydrolysis of organic 79
particulate matter. For instance, Khalfbadam et al. (2016a) effectively harnessed hydrolytic 80
bacteria in anaerobic sludge to increase in situ oxidation of algal biomass in a BES. Chu et al. 81
(2001) found that ultrasound pre-treatment (sonication at 0.33 Watt/mL, 2 h) significantly 82
increased the SCOD content of a waste activated sludge (WAS) (from 42 to 1084 mg 83
SCOD/L). Alternatively, drastically altering the pH of the feedstock by dosing acids or alkali 84
could also enhance hydrolysis of organic particulate matter (Chen et al., 2007; Huang et al., 85
2016; Yi et al., 2013). However, these methods require either substantial retrofit of 86
infrastructure or usage of chemicals, and hence may not be desirable for practical application. 87
Recently, Charles et al. (2013) investigated the use of a dual chamber electrochemical cell to 88
enhance anaerobic digestibility of a WAS. With an applied voltage of 12 V, the acidic and 89
alkaline conditions created by the electrolytic reactions in the anodic and cathodic chambers 90
remarkably increased the SCOD in the WAS by 31% and 34%, respectively. Since this 91
method could effectively use electrodes to hydrolyse particulate matter without dosing 92
Page 8
MANUSCRIP
T
ACCEPTED
ACCEPTED MANUSCRIPT
5
external chemicals, it may be suitable for addressing the abovementioned limitations in the 93
BES filter process of Khalfbadam et al. (2016a). 94
In this study, we proposed that by operating the BES filter as an electrolytic cell, alkaline 95
hydrolysis of the entrapped particulate matter could be driven in situ at the electrode (filter). 96
This process would create an effluent with elevated SCOD and alkalinity, which could be a 97
suitable feed stock for a subsequent bioelectrochemical (anodic) treatment. Figure 1A depicts 98
the concept of the proposed two-stage process. In the first stage, the particulate-rich 99
wastewater is fed to the module, whereby the filter-electrode physically removes (filtering) 100
the particulate organic matter from the wastewater. The filter-electrode loaded with 101
particulate matter is then cathodically-driven to create a localised alkaline condition (≥12), 102
facilitating in situ alkaline hydrolysis of the entrapped particulate matter. The elevated SCOD 103
and alkalinity are expected to facilitate current production and help neutralise the acidity 104
liberated from the anodic oxidation reaction at the subsequent stage. Overall, the sequential 105
process is expected to yield a better quality final effluent with a much higher total COD 106
removal efficiency. 107
The aim of this study was to validate the proposed combination of electrolysis and anodic 108
oxidation for effective removal of particulate and soluble organic matter from municipal 109
particulate-rich wastewater. Specifically, the following hypothesises were tested: 110
(1) The increased cathodic pH created by the electrolysis step (first stage) can trigger 111
alkaline hydrolysis of the particulate matter entrapped at the filter-electrode; 112
(2) The alkaline effluent with elevated SCOD content can be harnessed as a more suitable 113
feedstock for the subsequent anodic carbon oxidation step, negating the need of dosing 114
external chemicals (e.g. NaOH) for pH control; 115
Page 9
MANUSCRIP
T
ACCEPTED
ACCEPTED MANUSCRIPT
6
(3) The acidity generated at the anodic reaction (captured in the counter electrolyte) of the 116
first stage can be used to facilitate the cathodic reaction of the second stage, alleviating 117
the overall reliance on external chemicals for pH control. 118
The coupled process was operated in a continuous mode with different hydraulic loadings of 119
municipal primary sedimentation tank (PST) effluent for over 160 days, during which the 120
performance of the system was quantified for a range of parameters such as total COD 121
(TCOD), soluble COD (SCOD), particulate COD (PCOD) and SS removals; electrical 122
current, Coulombic efficiencies and energy consumption. 123
124
2. Materials and Methods 125
2.1. Configuration of the two-stage reactor process 126
Figure 1 illustrates the experimental process used in this study. The process consisted of two 127
identical, hydraulically connected dual-compartment electrochemical reactors (Figure 1). The 128
first reactor (R1) was operated as an electrolytic cell facilitating both entrapment and in situ 129
alkaline hydrolysis of the entrapped particulate solids; the second reactor (R2) was operated 130
as a typical BES for bioanodic oxidation of soluble organic matter. Specific configurational 131
details of the reactor and the electrode materials have been described in Khalfbadam et al. 132
(2016b). In brief, each reactor had a height of 1.5 m (internal diameter 0.1 m) and consisted 133
of two concentric cylindrical stainless steel mesh columns, one with a diameter of 6 cm and 134
the other one with a diameter of 4 cm. The two columns were served as both electrical current 135
collector and physical support for the anode and the cathode, respectively. To prevent 136
corrosion of the stainless steel columns, the columns were pre-treated with pickling and 137
passivation treatments as per American Society for Testing and Materials (ASTM) standards 138
(ASTM A380 and A967) (International Corrosion Services Ltd. Co., Perth, Australia). The 139
Page 10
MANUSCRIP
T
ACCEPTED
ACCEPTED MANUSCRIPT
7
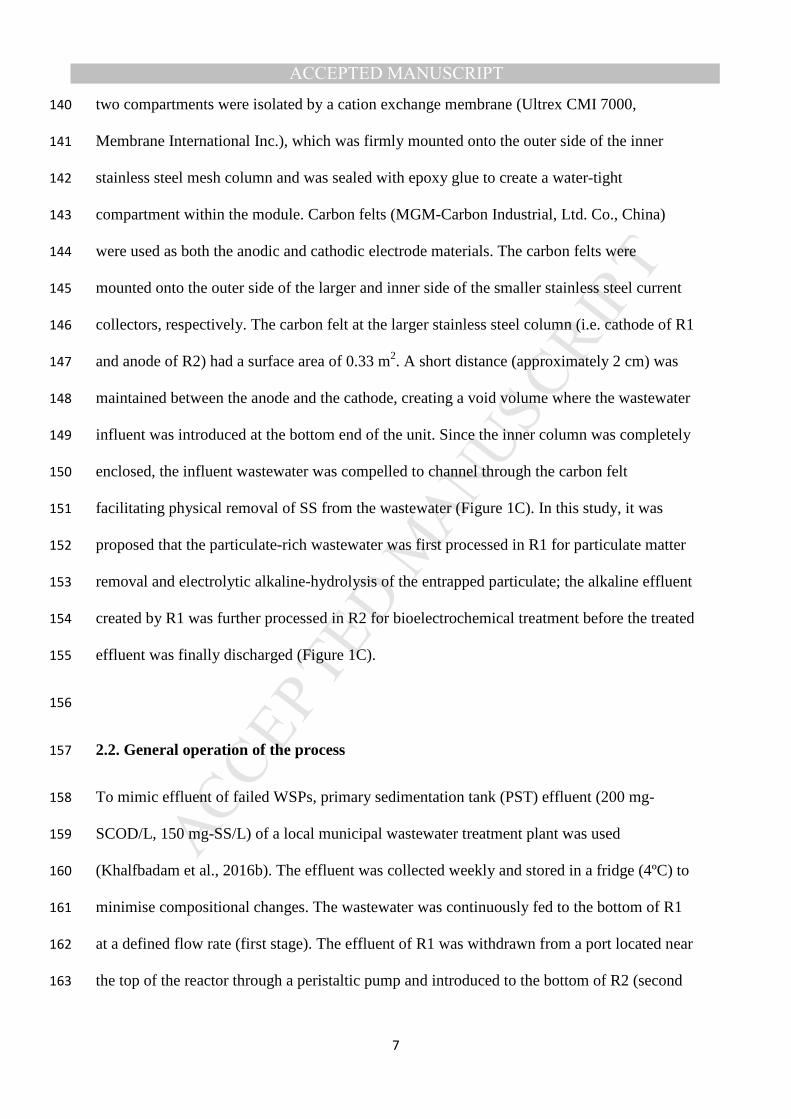
two compartments were isolated by a cation exchange membrane (Ultrex CMI 7000, 140
Membrane International Inc.), which was firmly mounted onto the outer side of the inner 141
stainless steel mesh column and was sealed with epoxy glue to create a water-tight 142
compartment within the module. Carbon felts (MGM-Carbon Industrial, Ltd. Co., China) 143
were used as both the anodic and cathodic electrode materials. The carbon felts were 144
mounted onto the outer side of the larger and inner side of the smaller stainless steel current 145
collectors, respectively. The carbon felt at the larger stainless steel column (i.e. cathode of R1 146
and anode of R2) had a surface area of 0.33 m2. A short distance (approximately 2 cm) was 147
maintained between the anode and the cathode, creating a void volume where the wastewater 148
influent was introduced at the bottom end of the unit. Since the inner column was completely 149
enclosed, the influent wastewater was compelled to channel through the carbon felt 150
facilitating physical removal of SS from the wastewater (Figure 1C). In this study, it was 151
proposed that the particulate-rich wastewater was first processed in R1 for particulate matter 152
removal and electrolytic alkaline-hydrolysis of the entrapped particulate; the alkaline effluent 153
created by R1 was further processed in R2 for bioelectrochemical treatment before the treated 154
effluent was finally discharged (Figure 1C). 155
156
2.2. General operation of the process 157
To mimic effluent of failed WSPs, primary sedimentation tank (PST) effluent (200 mg-158
SCOD/L, 150 mg-SS/L) of a local municipal wastewater treatment plant was used 159
(Khalfbadam et al., 2016b). The effluent was collected weekly and stored in a fridge (4ºC) to 160
minimise compositional changes. The wastewater was continuously fed to the bottom of R1 161
at a defined flow rate (first stage). The effluent of R1 was withdrawn from a port located near 162
the top of the reactor through a peristaltic pump and introduced to the bottom of R2 (second 163
Page 11
MANUSCRIP
T
ACCEPTED
ACCEPTED MANUSCRIPT
8
stage). The final effluent was discharged from the outer (anodic) chamber of R2 by hydraulic 164
pressure via an effluent port located near the top of the reactor. The wastewater in the outer 165
chambers of both reactors was continuously recirculated (633 mL/min). The inner chambers 166
of R1 and R2 were filled with deionised water (2 L). To ensure supply of dissolved oxygen 167
was not limiting the cathodic reaction (presumably oxygen reduction) at the cathode of R2, 168
the catholyte of R2 was continuously aerated (833 mL air/min). Two peristaltic pumps (Cole- 169
Parmer, Victoria, Australia) operated at a same flow rate (17 mL/min) were used to mix the 170
two counter electrolytes (in the inner chambers) between the two reactors, with one pump 171
transferring the electrolyte from R1 to R2, and the other one returning the electrolyte from R2 172
to R1. This step was to facilitate the use of the acidity created by the anodic reaction of R1 173
for neutralising the alkalinity created by the cathodic reaction of R2. 174
Two adjustable digital power supplies (Array 3645 A; Array Electronics, Australia) were 175
used to separately apply electrical voltage to both reactors. The positive and negative poles of 176
the power supplies were connected to the anode and cathode, respectively (Figure 1B). To 177
enable measurement of electrical current in both reactors, an external resistor (1 ohm) was 178
connected between the cathode of both reactors and their respective negative terminals of the 179
power supply. Electrical current was determined from the voltage measured across the 180
resistor according to Ohm’s Law. A silver-silver chloride (Ag/AgCl) reference electrode 181
(MF-2079, RE-5B, BASi Bioanalytical Systems, Inc., USA) was mounted in the anodic 182
chamber of R2 to enable measurement of the anodic potential of the BES. All electrode 183
potentials (mV) reported in this study refer to values against Ag/AgCl reference electrode (ca. 184
+197 mV vs. standard hydrogen electrode). The process was operated at ambient pressure 185
and temperature (22-25ºC). 186
187
Page 12
MANUSCRIP
T
ACCEPTED
ACCEPTED MANUSCRIPT
9
2.3 Determination of the optimal pH for enhancing particulate matter hydrolysis (serum 188
bottle experiment) 189
A separate experiment was first conducted to determine the susceptibility of the particulate 190
matter in the PST effluent for acid/alkaline hydrolysis, and to define the optimal pH for 191
enhancing the SCOD content in the PST effluent. Freshly collected PST effluent was loaded 192
into four 1-L Imhoff cones and was allowed to settle for one hour. Thereafter, two distinct 193
sediment layers were visualised at the bottom of each cone. The lower layers, which 194
contained mostly inert sand-like particles were carefully discarded through the decant port of 195
each Imhoff cone. The upper layers were carefully collected and pooled together for 196
experimentation. The TCOD and SCOD contents of the composite particulate matter sample 197
were 5361 mg/L and 251.3 mg/L, respectively. Hence, the SCOD/TCOD ratio was 4.7%. 198
To evaluate the impact of acidic and alkaline pH on solubilisation of particulate matter, the 199
composite particulate matter sample (630 mL) was equally divided into seven serum bottles 200
(90 mL each). The initial pH value in bottles 1–6 was adjusted to 2, 5, 7, 8, 10 and 12, 201
respectively, by adding sodium hydroxide (1M NaOH) or hydrochloric acid (1M HCl). The 202
bottle 7, in which the pH was not adjusted, was used as the control (pH = 7.05). The bottles 203
were incubated on an orbital shaker (room temperature, 225 rpm) for 24 h. Samples were 204
taken from each bottle at 0, 3, 7 and 24 h over a 24 h period for SCOD analysis. Percent 205
solubilisation of particulate was calculated for each setting according to: (SCOD measured – 206
251.3 mg/L)/ 5361 mg/L × 100%. 207
208
2.4. Impact of applied voltage on solubilisation of entrapped particulate matter in R1 209
The impact of various applied voltages (0, 3, 6 and 10 V) on the hydrolysis of entrapped 210
particulate matter in the filter type electrolysis unit (R1) was evaluated before connecting 211
Page 13
MANUSCRIP
T
ACCEPTED
ACCEPTED MANUSCRIPT
10
both R1 and R2 as a coupled process. This experiment was to determine the most suitable 212
applied voltage for driving the alkaline hydrolysis of the entrapped particulate matter in R1. 213
Fresh PST effluent was continuously loaded into R1 at a hydraulic retention time (HRT) of 214
32 h (flow rate of 5.02 mL/min) over a period of 14 days. After each voltage and prior to the 215
next setting, the applied voltage was set to zero and the HRT was reduced to 6 h for a period 216
of at least 24 h, to ensure the electrode-filter was recharged with sufficient organic particulate 217
matter build up prior to the next applied voltage setting. Current, working electrolyte pH and 218
effluent SCOD for various settings were monitored and compared. 219
220
2.5. Influence of applied voltage on the performance of R2 221
Prior to this study, R2 was started up and had been operated for approximately two years in 222
microbial fuel cell (MFC)-mode as reported in Khalfbadam et al. (2016b). It was identified 223
that the current production and SCOD removal efficiency were largely limited by the poor 224
cathodic reaction (Khalfbadam et al. 2016b). Hence, in this study R2 was coupled with an 225
external power supply to overcome such limitation. This mode of operation (i.e. as a 226
microbial electrolysis cell (MEC) was evaluated before connecting both R1 and R2 as a 227
coupled process. The effects of various applied voltages (0, 150, 250, 400, 600 and 800 mV) 228
on R2 were evaluated over a period of 60 hours. Current production, electrode potentials, 229
electrolyte pH and anodic SCOD removal rates were recorded. In order to ensure the supply 230
of COD was not limiting, the R2 was continuously fed with fresh municipal PST effluent at a 231
HRT of 6 hours, corresponding to a flow rate of 26.8 mL/min. To eliminate the impact of pH 232
changes, both the anolyte and catholyte were maintained at pH 7 by feedback-dosing NaOH 233
(4M) and HCl (1M), respectively. Similar to the previous study, the counter electrolyte of R2 234
was aerated to ensure that the cathodic reaction was not limited by dissolved oxygen. 235
236
Page 14
MANUSCRIP
T
ACCEPTED
ACCEPTED MANUSCRIPT
11
2.6. Evaluation of the effect of hydraulic retention time (HRT) and applied voltage on 237
the performance of the sequential process 238
After separately testing the R1 for alkaline hydrolysis of the entrapped particulate matter and 239
and R2 for bioanodic oxidation of SCOD, the performance of the coupled process was 240
assessed. As described above, the two reactor modules were hydraulically connected (Figure 241
1). Applied voltages (setting 1: 6 and 0.5 V for R1 and R2, respectively (6V/0.5V); setting 2: 242
10 and 0.6 V for R1 and R2, respectively (10V/0.6V)) and HRT (6, 12, 18, 24 and 32 h) were 243
selected as the process variables. The coupled process was evaluated in continuous mode 244
over a period of 150 days. Freshly collected PST effluent was loaded into R1at different flow 245
rates (26.8, 13.4, 8.9, 6.7 and 5 mL/min) to achieve the respective HRTs of 6, 12, 18, 24, 32 h 246
in R1. The final effluent was discharged from R2 at the same flow rate and hence both R1 247
and R2 were operated at identical HRT. Each set of applied voltage and HRT was maintained 248
for 15 days to ensure steady-state operation. Process parameters such as TCOD removal, 249
SCOD removal, working electrolyte pH, current production and CE were quantified for each 250
stage and were compared amongst various settings. 251
252
2.7. Effect of spiking algal biomass to the influent of R1 on current production in R2 253
The effectiveness of using the coupled process to entrap and hydrolyse algal biomass for 254
current production was evaluated in a separated experiment. The concentrated algal biomass 255
was prepared from a synthetic algal medium as described in Khalfbadam et al. (2016a). The 256
algal biomass containing medium was loaded into Imhoff cones, and the biomass was 257
allowed to settle for 3 hours before collection. The collected sediments were centrifuged 258
(4000 × g for 30 minutes) and the supernatants were discarded. The pelleted algal solids were 259
resuspended in deionised water, centrifuged again and the supernatant was discarded. This 260
step was to remove SCOD. The pelleted algae was finally resuspended in a medium (300 261
Page 15
MANUSCRIP
T
ACCEPTED
ACCEPTED MANUSCRIPT
12
mL). The TCOD and SCOD concentrations of this algae-containing medium were 8981 mg/L 262
and 51 mg/L, respectively. Prior to the spiking test, the coupled process was steadily operated 263
with municipal PST effluent for at least one week (HRT 32 h). When the current of R2 was 264
stable, the pre-concentrated algae-containing medium was injected to the influent line of R1. 265
The same procedure was repeated when the current of R2 had returned to the baseline level 266
for >1 HRT. Coulombic efficiencies (CE) were determined using the current induced by the 267
spikes and the TCOD content of the spikes. 268
269
2.8. Analyses and calculations 270
The voltage (i.e. the potential differences between the anode and the cathode) (V) was 271
measured using a digital multimeter placed across the external resistor and the anodic and 272
cathodic potentials were measured against respective reference electrodes (Ag/AgCl). pH was 273
monitored using a portable pH meter (TPS, Australia). 274
The current (I, mA) of R1 was determined from the cell voltage according to Ohm’s Law, 275
=
, where (mV) is the measured cell voltage across an external resister (Ω). Power 276
(P, µW) was calculated according to equation = × . It was used to calculate electrical 277
energy consumption of R1 and R2 over a specified period of time (h). 278
Soluble COD measurements were carried out after filtering the samples through 0.22 µm 279
syringe filters to remove any suspended solids. Total COD measurements were carried out on 280
unfiltered samples. SCOD and TCOD analyses were performed using HACH reagents (cat 281
no. TNT 821; method 8000, LR) and a spectrophotometer (GENESYS 20, Thermo 282
Scientific). CE (i.e., the percentage of electrons recovered as anodic current from the TCOD 283
removed) of the anodic reaction was calculated as detailed in literature (Logan et al., 2006). 284
Particulate matter was quantified by measuring SS. SS was measured as described in standard 285
Page 16
MANUSCRIP
T
ACCEPTED
ACCEPTED MANUSCRIPT
13
methods for examination of water and wastewater (APHA, 1992). All analytical 286
measurements were carried out in duplicate. 287
288
3. Results and discussion 289
290
3.1. Increasing pH to 12 enabled efficient hydrolysis of PST effluent particulate 291
A comparative study was conducted to examine the effect of pH (2 to 12) on the hydrolysis 292
of PST particulate matter. Figure 2 shows how SCOD concentration and percent 293
solubilisation of particulate matter changed as a function of pH. Clearly, both acidification 294
(pHs 2 and 5) and basification (pHs 10 and 12) could increase SCOD concentration and 295
solubilisation of the PST particulate matter. However, compared with other pHs, pH 12 296
enabled the highest solubilisation of the particulate matter (13%) (Figure 2B). Also, at pH 12 297
the SCOD concentration was significantly increased by 4-fold within a short time (from 298
235.2 to 948 mg/L in 3 hours) (Figure 2A). The slight decreases in SCOD recorded near 299
circum-neutral conditions (pH 7, 8 and control) could be a result of microbial degradation of 300
soluble organic matter. Overall, the result confirmed that pH 12 was the most effective 301
condition to facilitate hydrolysis of the PST particulate matter. 302
303
3.2. Cathodic-driven alkaline hydrolysis of entrapped particulate matter in R1 304
With the previous experiment confirming the effect of alkaline pre-treatment for improving 305
hydrolysis of the PST particulate matter, it was decided to couple the R1 with an external 306
power supply to approach the desired alkaline condition. To determine how much applied 307
voltage was needed, the changes in SCOD, pH of working electrode and current production 308
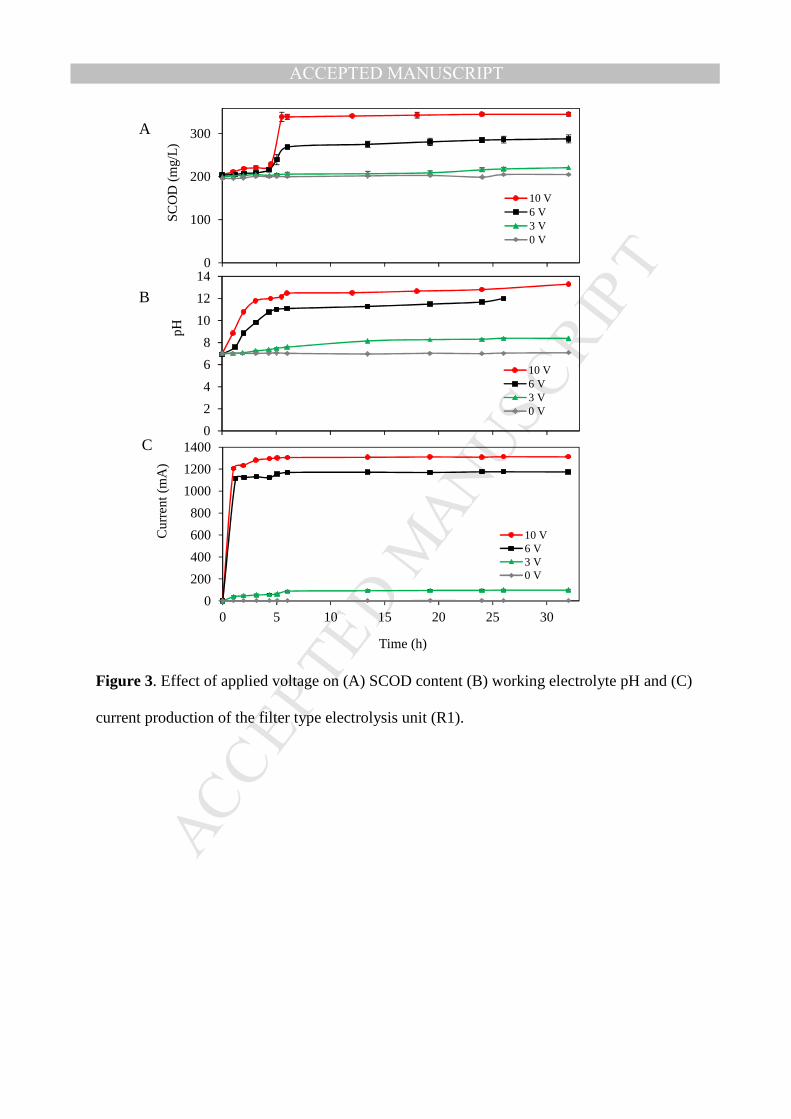
in R1 with different applied voltages (0, 3, 6 and 10 V) were quantified (Figure 3). 309
Page 17
MANUSCRIP
T
ACCEPTED
ACCEPTED MANUSCRIPT
14
Although applying 3 V increased the current of R1 from 0 mA to 98 mA, no remarkable 310
change in both working electrolyte pH and SCOD were recorded compared to the control (no 311
applied voltage) (Figure 3A, C). In contrast, doubling the applied voltage to 6 V remarkably 312
increased the pH from 6.94 to 11.0 within 5.5 h (Figure 3B). This also coincided with an 313
increase in current (from 0 to 1154 mA) and SCOD (from 196 to 271 mg/L). Further 314
increasing the applied voltage to 10 V resulted in a more rapid basification of the catholyte 315
(from 7.0 to 12 within 4.5 h), and more profound increases in both current (from 0 to 1294 316
mA) and SCOD concentration (from 205 to 335 mg/L) (Figure 3). 317
Since applying 6 and 10 V enabled the SCOD concentration in R1 to approach plateau within 318
≤6 h (Figure 3A), it would be sufficient to operate R1 with the applied voltage for a much 319
shorter time frame. Overall, the results confirmed that the alkaline condition (pH>11) could 320
facilitate hydrolysis of the entrapped particulate organics. Such conditions could be created 321
by driving the electrode-filter of R1 as a cathode with an external voltage supply of >6V. 322
323
3.3. Augmenting R2 with an applied voltage to enhance SCOD removal rate 324
It was previously shown that COD removal by R2 was limited by the poor cathodic oxygen 325
reduction (Khalfbadam et al. 2016b). One way to overcome this constrain was to switch the 326
operation into MEC mode, whereby external voltage is applied to enable faster reaction 327
kinetics at the bioanode (Cheng et al., 2012). Hence, before connected with R1, R2 was 328
examined with different applied voltages (0, 150, 250, 400, 600 and 800 mV) and the 329
corresponding effects on anodic potential and COD removal rates were quantified (Figure 330
S1). The results indicated that addition of voltages (up to 400 mV) effectively increased the 331
anodic potential (from -570 mV to -430 mV), which favoured a higher biogenic electrical 332
current (from 100 to 310 mA) (Figure S1A and B). Such improvement also coincided with a 333
Page 18
MANUSCRIP
T
ACCEPTED
ACCEPTED MANUSCRIPT
15
notable rise (>3 fold) in SCOD removal rate. With an applied voltage of 400 mV, the SCOD 334
removal rate increased from 0.08 to 0.25 kg/m3.d (HRT 6 h) (Figure S1D). 335
This experiment confirmed that the activity of the established anodic biofilm in R2 was 336
largely hindered by the cathodic reaction, and that by augmenting with electrical voltages, 337
SCOD removal could be markedly improved. Nonetheless, it must be mentioned that in this 338
experiment the process was operated with active pH corrections (i.e. dosing of NaOH and 339
HCl). For practical application, this requirement should ideally be omitted. 340
341
3.4. Characterisation of the sequential process and influence of hydraulic retention time 342
and applied voltage 343
The above experiments showed that R1 and R2 could effectively facilitate in situ alkaline 344
hydrolysis of the entrapped particulate matter and bioanodic oxidation of SCOD, 345
respectively. Hence, a subsequent experiment was conducted with the two modules 346
connected hydraulically as a sequential process (see Figure 1). The process was operated in 347
continuous mode for a prolonged period (150 days) with various HRTs (6, 12, 18, 24 and 348
32 h) and applied voltages (6V/0.5V; 10V/0.6V). Key process variables were quantified 349
(Figure 4). 350
351
3.4.1 The sequential process could enable an excellent SS removal, and R1 (stage 1) 352
was responsible for the majority (>60%) of removal 353
The results again confirmed that the “electrolytic electrode-filter” of R1 could effectively 354
remove SS (Figure 4D). For both applied voltage settings tested, increasing the HRT of R1 355
(from 6 to 32 h) also improved SS removal (from 62% to 96%) in R1 (data not shown). 356
Page 19
MANUSCRIP
T
ACCEPTED
ACCEPTED MANUSCRIPT
16
Extending the HRTs beyond 6 h may have offered an extra SS retention (e.g. settling) for the 357
improved SS removal recorded (Figure 4D, at days 15 and 90). As expected, further SS 358
removal was attained by R2, giving a near complete overall SS removal (>99%) (Figure 4D). 359
Similar trends for SS removal efficiencies were recorded with the higher applied voltage 360
setting (10V/0.6V, days 75 to 150). These results suggested that the sequential process could 361
enable an excellent SS removal, and R1 (stage 1) was responsible for the majority (>60%) of 362
removal. The continuous loading of wastewater did not result in any sign of clogging in R1 363
during the period of operation for over 150 days , suggesting that the entrapped particulate 364
matter was solubilised in situ via alkaline hydrolysis. This implies the prevalence of a self- 365
cleansing mechanism in R1. 366
367
3.4.2 Current, pH and COD removal 368
In general, increasing the HRT did not notably affect the current and SCOD augmentation in 369
R1, as only slight decreases in current and slight increases in SCOD were recorded (Figure 370
4A and E). The result also corroborates with the previous conclusion (in Section 3.2) that the 371
two voltages tested (6 and 10V) were suitable to allow efficient cathode-driven alkaline 372
hydrolysis, and that a short HRT of 6 h was adequate for R1 to attain good efficacies. Clearly, 373
at all tested settings, R1 could create the desirable alkaline conditions (pH 11.9-13.8) 374
facilitating in situ hydrolysis of the entrapped SS and as such, resulted in a higher SCOD in 375
the R1 effluent (Figure 4C, E). We also noted that both the R1 current and SCOD 376
concentrations in R1 effluent were generally higher (20%) with a higher applied voltage (10 377
vs. 6V) (Figure 4A, E). This further highlights the functional feature of R1 as an electrolytic-378
filter for particulate organics removal and hydrolysis. 379
Page 20
MANUSCRIP
T
ACCEPTED
ACCEPTED MANUSCRIPT
17
In contrast, the current of the subsequent stage (R2) decreased with increasing HRT, 380
indicating that the bioanode activity of R2 was likely limited by the SCOD from R1 (Figure 381
4A). Yet, in terms of overall COD removal (both SCOD and TCOD), operating the process at 382
higher HRT appeared to be essential, as only by extending the HRT to 32 h the overall 383
removal of SCOD and TCOD could then reach >80% (Figure 4E, F). When R1 was applied 384
with 6 V and 10 V, increasing the HRTs (from 6 to 32 h) decreased the current of R2 from 385
390 mA to 235 mA (1.18 to 0.712 A/m2) and from 430 mA to 258 mA (1.30 to 0.781 A/m2), 386
respectively (Figure 4A). A decrease in current trends coincided with an increase in CE from 387
38.8 % to 93.3 % (with applied voltage of 6 V/0.5V) and from 44.6 to 84.8 % (with applied 388
voltage of 10 V/0.6 V) (Figure 4B). For both voltages, the highest CEs were achieved with 389
the longest HRT (32 h), suggesting that operating the process at higher HRTs was also 390
favourable to obtain higher CEs. 391
On the other hand, it is well known that anodic biofilms of BESs are highly sensitive to pH 392
changes and often have a functional pH window near circumneutral range (Cheng et al. 2010; 393
Rozendal et al., 2008). In our study, such a stable pH environment was maintained by a 394
continuous neutralisation between the alkalinity created by the cathodic reaction in R1 and 395
the acidity created by the anodic reaction in R2. As shown in Figure 4C, the pH of the 396
wastewater stream (i.e. working electrolye) was decreased from 11.3 - 13.3 (in R1) to 6.87 - 397
7.33 (in R2). In other words, it was a synergy between the two stages (R1 and R2) that made 398
the final process effluent neutral. The results suggest that without external chemical dosing 399
for pH control, the detrimental problem of acidification of anodic oxidation process was not 400
encountered. 401
After each HRT and prior to change to the next HRT, both counter electrolytes of R1 and R2 402
were discarded and renewed with fresh DI water. Such renewal did not retard the rapid 403
acidification of counter electrolyte of R1, as a sharp decrease in pH (pH ~2) was recorded 404
Page 21
MANUSCRIP
T
ACCEPTED
ACCEPTED MANUSCRIPT
18
within less than 2 hours (Figure 4C). Exchanging both counter electrolytes in a close loop 405
enabled the neutralisation of the counter electrolyte of R2. However, the rate of acidification 406
in counter electrolyte of R1 was much faster than alkalinisation of counter electrolyte of R2. 407
As a result, the concentration of proton in both counter electrolytes was acidic (pH 2-3). In a 408
separate study, Khalfbadam et al. (2016b) demonstrated that the performance of a BES 409
process can be improved when the cathodic pH was maintained in acidic conditions by 410
adding HCl. However, in this study creation of a net acidity from R1 without adding external 411
chemicals enabled the overall more acidic counter electrolyte that favoured the cathodic 412
reaction of R2. This feature is another advantage of the proposed process. 413
414
3.5. The sequential process could effectively hydrolyse algal cells for more efficient 415
bioanodic oxidation 416
To test if the sequential process could readily treat fresh intact algal biomass for current 417
generation, a spiking experiment was carried out (Figure 5). The experiment was started by 418
first operating the process with municipal wastewater in a continuous mode with HRT of 32 419
h. After approximately 7 days, the current of R2 became stable at around 260 mA (0.788 420
A/m2) (Figure 5A). At this point, an algal biomass aliquot was added to the influent stream of 421
R1, and within 3.5 h the current of R2 increased and continued to rise reaching a maximum 422
of 420 mA (1.27 A/m2) after 16 h. Subsequently, the current gradually returned to the initial 423
background level. Similar trends was recorded when the experiment was repeated with the 424
same amount of algal injection (Figure 5A). The two current peaks also coincided with slight 425
decreases in the working electrolyte pH of R2 (from 7.6 to 6.4), which were probably caused 426
by additional protons released from the faster anodic reaction (Figure 5B). The two algae-427
induced current peaks corresponded to an average CE of 41%. 428
Page 22
MANUSCRIP
T
ACCEPTED
ACCEPTED MANUSCRIPT
19
Overall, the results suggested that the sequential process could effectively hydrolyse fresh 429
algal cells for bioanodic oxidation (removal). Future studies are necessary to further develop 430
the process for algae-laden streams treatment. 431
432
3.6. Energetic consideration for the sequential treatment process 433
In this study, electrical energy was consumed to facilitate alkaline hydrolysis (stage 1) and 434
bioanodic oxidation (stage 2). Figure 6 and Table S1 summarise the treatment and energetic 435
performance of the sequential process. In general, the energy consumptions in both stages 436
were dependent on both HRT and applied voltage. Also, as expected R1 consumed 437
significantly (two orders of magnitude) more energy than R2 (Figure 6A, B). For stage 1 438
electrolytic hydrolysis (R1), increasing the HRT from 6 to 32 h increased the energy 439
consumption from 92.1 to 274.7 kWh/kg SCODincreased and 67.5 to 303.7 kWh/kg 440
SCODincreased with applied voltage of 6 and 10 V, respectively (Figure 6). Interestingly, these 441
values are lower than that reported for alternative particulate matter hydrolysis pre-442
treatments. For instance, an approximately two-fold higher energy consumption of 633 443
kWh/kg SCODincreased was reported by Chu et al. (2001), who used ultrasound as a pre-444
treatment step to enhance SCOD in WAS (from 42 mg/L to 1084 mg/L). Hence, operating 445
the electrode-filter to achieve in situ alkaline hydrolysis of particulate is realistic in terms of 446
energy requirement. 447
Unlike in R1, increasing the HRT of R2 (6 to 32 h) only slightly increased the energy 448
consumption, from 1.48 to 1.66 kWh/kg SCODremoved (12%) and 1.58 to 1.74 kWh/kg 449
SCODremoved (10%), respectively with applied voltage of 0.5 and 0.6V (Figure 6A, B). This 450
suggests that changing the HRT did not impact much on the energetic performance of R2 451
bioanode in terms of SCOD removal. The energetic performance of R2 (stage 2) is 452
Page 23
MANUSCRIP
T
ACCEPTED
ACCEPTED MANUSCRIPT
20
comparable with other wastewater treatment MEC processes. For example, an energy input of 453
2.59 kWh/kg SCODremoved was recorded by Ivanov et al. (2013) in a MEC process to enable 454
SCOD removal of 74% from a municipal wastewater. In fact, the energy consumption by R2 455
is within the range of energy demand in conventional activated sludge processes (0.7-2 456
kWh/kg SCODremoved) (Pant et al., 2011; Tchobanoglous & Burton, 1991). This suggests that 457
augmenting R2 with applied voltage could be a viable option to remove SCOD hydrolysed 458
from the entrapped particulate (R1). Nonetheless, further studies are desirable to examine 459
operation of R2 as a MFC to recovery electrical energy or as a MEC to recover hydrogen, as 460
this may improve the overall energetic performance of the sequential process. 461
In terms of TCOD removal, increasing HRT and applied voltage generally increased the 462
overall energy demand of the sequential process (Figure 6C). Of all tested settings, the most 463
suitable setting was HRT 24 hours with applied voltages of 6V (R1):0.5V (R2), which 464
enabled a high TCOD removal (80%) with relatively low energy consumption, 44 kWh/kg 465
TCODremoved (Figure 6C). Since the sequential process developed here is the first of its kind 466
to enable simultaneous removal, hydrolysis and oxidation of particulate organics from 467
wastewater, no comparable processes are available for direct comparison. 468
469
3.8. Implication and perspective 470
This study clearly demonstrated the effectiveness of the proposed sequential process (Figure 471
1). The findings also illustrated several key advantages of this approach: (1) the use of 472
electrode as a physical filter ensured a more reliable SS removal (here close to 100%) and 473
offered a pre-concentration mechanism to localise the SS at one place (i.e. electrode-filter in 474
R1); (2) the use of applied voltage to drive cathodic production of alkaline in the vicinity of 475
the electrode-filter enabled efficient hydrolysis of the organics; (3) the cathode-driven 476
Page 24
MANUSCRIP
T
ACCEPTED
ACCEPTED MANUSCRIPT
21
hydrolysis step created an alkaline SCOD enriched stream, facilitated a more efficient TCOD 477
removal. The alkaline stream could be effectively neutralised in the subsequent BES process 478
without reliance on external chemical dosing for pH control, enabled a discharge of a pH 479
neutralised final effluent. The need of dosing chemicals for sustaining process operation has 480
been a well-known stumbling block for BES technology (Rozendal et al., 2008). A complete 481
negation of this requirement represents an important step towards practical application. 482
This study also demonstrated the feasibility of using the sequential process to polish 483
particulate matter- laden effluent such as algal biomass emanating from WSPs. Although the 484
complexity of the system and the demand of energy supply may not seem comparable to the 485
simplicity of a rock filter, one unique feature of the proposed process is the inclusion of the 486
electrode-driven hydrolysis step to render the filtration unit (R1) as a self-cleansing filtration 487
device. Similar to a rock filter, the hydrolysis step (R1) filtered out most of the particulate 488
matter from the effluent. However, instead of relying on natural decomposition of the 489
entrapped particulate, the use of electrolytic-cathode continuously enable the solubilisation of 490
the particulate matter at an acceptable rate, preventing clogging and not necessitating any 491
back wash of the filter. This feature is desirable for maintaining longevity of the treatment 492
unit. 493
Although this study has considerably contributed to the advancement of BES technology, 494
further studies will be required to optimise the performance of the individual and combined 495
stages of the process. For instance, in this study, for each stage one single reactor with equal 496
HRT was used. However, the results suggested that the optimal operational regime of the 497
coupled process may be achieved by coupling the two stages with varying HRTs. For 498
instance, the optimal HRTs for R1 and R2 were found to be 6 h and 24 h, respectively. Such 499
HRTs may be provided by manipulating the reactors volume or combination of different 500
Page 25
MANUSCRIP
T
ACCEPTED
ACCEPTED MANUSCRIPT
22
numbers of modules for the two stages. To this end, the modular configuration of the 501
electrochemical-filter could be a promising feature for large scale implementation. Further 502
research is certainly required to develop the technology. 503
504
4. Conclusions 505
This study reports for the first time a combination of an electrolysis filter and a BES process 506
to achieve particulate and soluble organic matter removal from municipal wastewater. Based 507
on the results, the following points are concluded: 508
509
• The first step electrolysis filter could remove near 100% of SS from wastewater 510
influent. Electrolysis enhanced in situ hydrolysis of entrapped particulate matter in the 511
filter. 512
• The use of alkaline cathodic effluent after the electrolysis step as anodic influent of 513
BES process eliminated the need of active pH control. 514
• Electrochemically assisted alkaline hydrolysis enhanced the subsequent 515
bioelectrochemical oxidation process, resulted in high overall TCOD removal of 87% 516
and a CE of 93%. 517
• The electrolysis stage generated an acidic solution (pH~2) in the counter electrolyte 518
which was harnessed by the subsequent proton- requiring cathodic reaction. 519
• Operating the electrode-filter to achieve in situ alkaline hydrolysis of particulate is 520
realistic in terms of energy requirement. 521
5. Acknowledgments 522
This project was funded by the Water Corporation of Western Australia and CSIRO Land and 523
Water. The Australian Commonwealth Government is acknowledged for the International 524
Page 26
MANUSCRIP
T
ACCEPTED
ACCEPTED MANUSCRIPT
23
Postgraduate Research and Publication Scholarship provided to Hassan Mohammadi 525
Khalfbadam. Dr Kaveh Sookhak Lari and Dr Bradly Patterson (CSIRO Land and Water) are 526
thanked for their valuable comments. 527
6. References 528
529
APHA. 1992. Standard methods for the examination of water and wastewater. wastewater. 18th 530
Edition. American Public Health Association, American Water Works Association and the Water 531
Environment Federation, Washington, DC. 532
Charles, W., Ng, B., Cord-Ruwisch, R., Cheng, L., Ho, G., Kayaalp, A. 2013. Enhancement of waste 533
activated sludge anaerobic digestion by a novel chemical free acid/alkaline pretreatment using 534
electrolysis. Water Science and Technology, 67(12), 2827-2831. 535
Chen, Y.G., Jiang, S., Yuan, H.Y., Zhou, Q., Gu, G.W. 2007. Hydrolysis and acidification of waste 536
activated sludge at different pHs. Water Research, 41(3), 683-689. 537
Cheng, K.Y., Ho, G., Cord-Ruwisch, R. 2010. Anodophilic biofilm catalyzes cathodic oxygen 538
reduction. Environmental Science & Technology, 44(1), 518-525. 539
Cheng, K.Y., Ho, G., Cord-Ruwisch, R. 2012. Energy-efficient treatment of organic wastewater 540
streams using a rotatable bioelectrochemical contactor (RBEC). Bioresource Technology, 541
126, 431-436. 542
Chu, C.P., Chang, B.V., Liao, G.S., Jean, D.S., Lee, D.J. 2001. Observations on changes in 543
ultrasonically treated waste-activated sludge. Water Research, 35(4), 1038-1046. 544
Ellis, K., Mara, D.D. 1983. Stabilization ponds: design and operation. Critical Reviews in 545
Environmental Science and Technology, 13(2), 69-102. 546
Huang, C., Liu, C.C., Sun, X.Y., Li, J.S., Shen, J.Y., Han, W.Q., Liu, X.D., Wang, L.J. 2016. 547
Hydrolysis and acidification of waste activated sludge enhanced by zero valent iron-acid 548
pretreatment: effect of pH. Desalination and Water Treatment, 57(26), 12099-12107. 549
Ivanov, I., Ren, L.J., Siegert, M., Logan, B.E. 2013. A quantitative method to evaluate microbial 550
electrolysis cell effectiveness for energy recovery and wastewater treatment. International 551
Journal of Hydrogen Energy, 38(30), 13135-13142. 552
Khalfbadam, H.M., Cheng, K.Y., Sarukkalige, R., Kaksonen, A.H., Kayaalp, A.S., Ginige, M.P. 553
2016a. A bio-anodic filter facilitated entrapment, decomposition and in situ oxidation of algal 554
biomass in wastewater effluent. Bioresource Technology, 216, 8. 555
Khalfbadam, H.M., Ginige, M.P., Sarukkalige, R., Kayaalp, A.S., Cheng, K.Y. 2016b. 556
Bioelectrochemical system as an oxidising filter for soluble and particulate organic matter 557
removal from municipal wastewater. Chemical Engineering Journal, 296, 225-233. 558
Page 27
MANUSCRIP
T
ACCEPTED
ACCEPTED MANUSCRIPT
24
Logan, B.E., Hamelers, B., Rozendal, R.A., Schrorder, U., Keller, J., Freguia, S., Aelterman, P., 559
Verstraete, W., Rabaey, K. 2006. Microbial fuel cells: Methodology and technology. 560
Environmental Science & Technology, 40(17), 5181-5192. 561
Mara, D.D., Cogman, C.A., Simkins, P., Schembri, M.C.A. 1998. Performance of the Burwarton 562
Estate waste stabilization ponds. Journal of the Chartered Institution of Water and 563
Environmental Management, 12(4), 260-264. 564
Mara, D.D., Mills, S.W., Pearson, H.W., Alabaster, G.P. 1992. Waste Stabilization Ponds - a Viable 565
Alternative for Small Community Treatment Systems. Journal of the Institution of Water and 566
Environmental Management, 6(1), 72-78. 567
Pant, D., Singh, A., Van Bogaert, G., Gallego, Y.A., Diels, L., Vanbroekhoven, K. 2011. An 568
introduction to the life cycle assessment (LCA) of bioelectrochemical systems (BES) for 569
sustainable energy and product generation: Relevance and key aspects. Renewable & 570
Sustainable Energy Reviews, 15(2), 1305-1313. 571
Rozendal, R.A., Hamelers, H.V.M., Rabaey, K., Keller, J., Buisman, C.J.N. 2008. Towards practical 572
implementation of bioelectrochemical wastewater treatment. Trends in Biotechnology, 26(8), 573
450-459. 574
Tchobanoglous, G., Burton, F.L. 1991. Wastewater engineering. Management, 7, 1-4. 575
Yi, X., Luo, K., Yang, Q., Li, X.M., Deng, W.G., Cheng, H.B., Wang, Z.L., Zeng, G.M. 2013. 576
Enhanced Hydrolysis and Acidification of Waste Activated Sludge by Biosurfactant 577
Rhamnolipid. Applied Biochemistry and Biotechnology, 171(6), 1416-1428. 578
579
Page 28
MANUSCRIP
T
ACCEPTED
ACCEPTED MANUSCRIPT
Figure 1. (A, B) Schematic diagram of the two- stage sequential solid entrapment and in situ electrolytic alkaline hydrolysis particulate-rich wastewater treatment process; (C) cross and top sections of the two stages (red arrows show wastewater flow path).
4 cm (cathode)
6 cm (anode)
4 cm (anode)
6 cm (cathode)
stainless steel mesh (current collector) Ion exchange
membrane
PST effluent
Recirculation
1.5 m
(B)
R1- stage 1
Final effluent
Recirculation
+-
Power supply+ -
Power supply
R2- stage 2
Cathode Anode Anode Cathode
(A)
Abiotic cathode
Abiotic anode Abiotic cathode
Bio- anode
Alkaline SCOD enriched stream
Acidic water Treated effluent
Neutral low COD stream
Less acidic water
Neutral influentwith Primary
effluent
Filter type Electrolysis cell
Filter typeBES cell
(C)
Page 29
MANUSCRIP
T
ACCEPTED
ACCEPTED MANUSCRIPT
Figure 2. Changes in (A) SCOD concentration over time and (B) solubilisation of organic
particulate matter at different pHs.
0
200
400
600
800
1000
1200
0 3 7 24
pH-2 pH-5 pH-7 pH-control pH-8 pH-10 pH-12
SCO
D (
mg/
l)
Time (h)
A
Sol
ubili
satio
n of
pa
rtic
ulat
e m
atte
r (%
)
B
-2
0
2
4
6
8
10
12
14
pH-2 pH-5 pH-7 pH-control pH-8 pH-10 pH-12
Page 30
MANUSCRIP
T
ACCEPTED
ACCEPTED MANUSCRIPT
Figure 3. Effect of applied voltage on (A) SCOD content (B) working electrolyte pH and (C)
current production of the filter type electrolysis unit (R1).
0
100
200
300
10 V6 V3 V0 V
0
2
4
6
8
10
12
14
10 V6 V3 V0 V
0
200
400
600
800
1000
1200
1400
0 5 10 15 20 25 30
10 V6 V3 V0 V
SC
OD
(m
g/L
)pH
Cur
rent
(m
A)
Time (h)
A
B
C
Page 31
MANUSCRIP
T
ACCEPTED
ACCEPTED MANUSCRIPT
Figure 4. Effect of HRT and applied voltage on (A) current production of R1 and R2; (B)
working electrode potential of R1 and R2 and coulombic efficiency of R2; (C) working and
counter electrolytes pH of R1 and R2; (D, E, F) suspended solids (SS), soluble chemical
oxygen demand (SCOD) and total chemical oxygen demand (TCOD) concentrations of R1
and R2, and overall removal efficiency of the whole process. Vertical dotted arrows in C
indicate renewal of the counter electrolyte of R1 and R2 with fresh DI water.
Ele
ctro
lyte
pH
02468
101214 WE- R1 WE- R2 CE- R1 CE- R2
0
10
20
30
40
0
500
1000
1500Current- R1 Current- R2 HRT
Cur
rent
(mA
)
0
20
40
60
80
100
-2000
-1500
-1000
-500
0
WE- R1
WE- R2
Coulombic efficiency
Ele
ctro
de p
oten
tial
(mV
vs.
Ag/
AgC
l)
Time (d)
A
B
C
6V/ 0.5V 10V/ 0.6VApplied voltage
Medium renewal
0
20
40
60
80
100
0
30
60
90
120
150
Influent-R1Effluent-R1Effluent-R2Overall removal
SS
(m
g /L
)
-20020406080100
0
100
200
300
SCO
D (
mg
/L)
0
20
40
60
80
100
0100200300400500600
0 30 60 90 120 150
TC
OD
(m
g /L
)
Cou
lom
bic
effi
cien
cy (%
)H
RT
(h)
SS o
vera
ll
rem
oval
(%
)S
CO
D o
vera
ll
rem
oval
(%
)T
CO
D o
vera
ll
rem
oval
(%
)
D
E
F
Page 32
MANUSCRIP
T
ACCEPTED
ACCEPTED MANUSCRIPT
Figure 5. Current generation in R2 induced by the addition of algal biomass at R1. The
vertical arrows indicate addition of the algal biomass. (HRT= 32 h, applied voltages= 10 V
for R1 and 0.6 V for R2.)
0
100
200
300
400
500Algae to R1
Time (d)
Cur
rent
of
R2
(mA
)
Algae to R1
02468
101214
0 2 4 6 8 10 12 14
WE- R1WE- R2
Wor
king
elec
trol
yte
pH
A
B
Page 33
MANUSCRIP
T
ACCEPTED
ACCEPTED MANUSCRIPT
Figure 6. Energetic consideration of the sequential process operated with different HRT and
applied voltages. A and B: specific energy consumption in each stage; C: overall energy
consumption and TCOD removal. Dotted hexagons in C identify the most suitable HRT of 24
h for achieving TCOD removal (80% removal at 44 kWh/kg TCODremoved).
Page 34
MANUSCRIP
T
ACCEPTED
ACCEPTED MANUSCRIPT
Highlights (Maximum 85 character per bullet point, including spaces) :
• Novel combination of an electrolysis filter and a BES process for sewage treatment.
• In-situ electrolytic alkaline hydrolysis of entrapped particulates in the filter.
• With no signs of clogging, the combined process removed 100% of SS from influent.
• The combined process did not require external chemicals for pH control.