12
The Student Handbook to THE APPRAISAL OF REAL ESTATE 1 Chapter 21 Income and Expense Analysis
| Date post: | 28-Dec-2015 |
| Category: |
Documents |
| Upload: | morgan-barber |
| View: | 213 times |
| Download: | 0 times |
The Student Handbook toTHE APPRAISAL OF REAL ESTATE
1
Chapter 21
Income and Expense Analysis
Student Handbook to THE APPRAISAL OF REAL ESTATEChapter 21 2
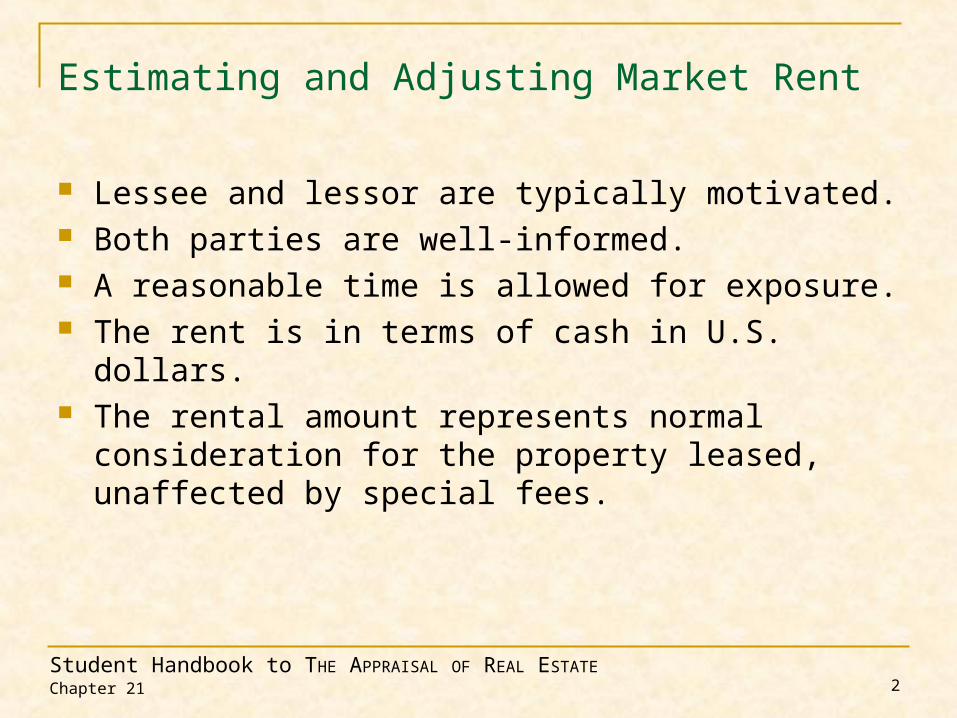
Estimating and Adjusting Market Rent
Lessee and lessor are typically motivated. Both parties are well-informed. A reasonable time is allowed for exposure. The rent is in terms of cash in U.S. dollars. The rental amount represents normal
consideration for the property leased, unaffected by special fees.

Student Handbook to THE APPRAISAL OF REAL ESTATEChapter 21 3
Income and Expense Data
Rent Rent concessions Division of expenses Renewal options Expense cap and expense stop clauses Escalation clauses Expense recovery clauses Purchase options Escape, kick-out, or buyout clauses Continued occupancy clauses Tenant improvements Noncompete, dark store, and exclusive use clauses

Student Handbook to THE APPRAISAL OF REAL ESTATE
Lease Data
Date of lease Description of the leased premises Lease terms, rental rate, and payment Tenant-installed trade fixtures Revaluation clauses Signage
Chapter 21 4
Student Handbook to THE APPRAISAL OF REAL ESTATEChapter 21 5
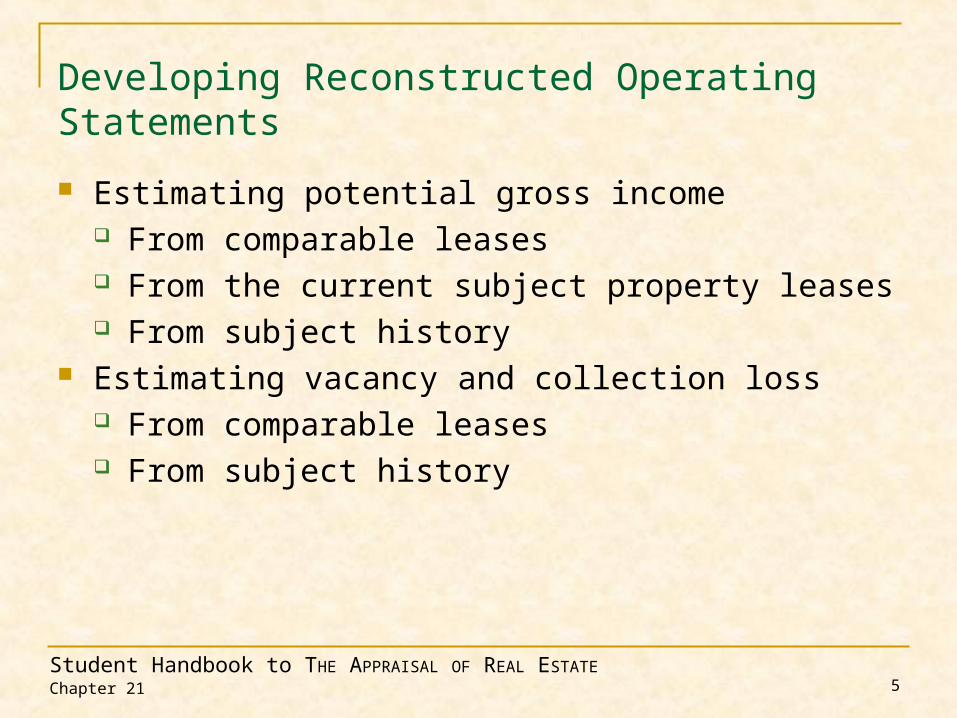
Developing Reconstructed Operating Statements
Estimating potential gross income From comparable leases From the current subject property leases From subject history
Estimating vacancy and collection loss From comparable leases From subject history
Student Handbook to THE APPRAISAL OF REAL ESTATEChapter 21 6
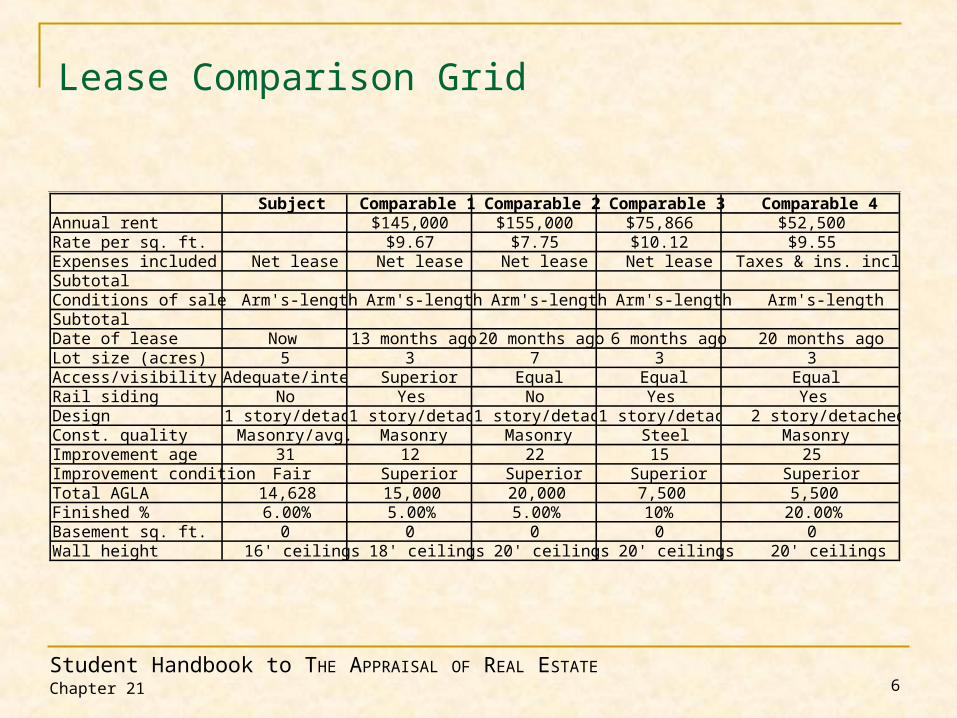
Lease Comparison Grid
Subject Comparable 1Comparable 2Comparable 3 Comparable 4Annual rent $145,000 $155,000 $75,866 $52,500Rate per sq. ft. $9.67 $7.75 $10.12 $9.55Expenses included Net lease Net lease Net lease Net lease Taxes & ins. includedSubtotalConditions of sale Arm's-length Arm's-length Arm's-length Arm's-length Arm's-lengthSubtotalDate of lease Now 13 months ago 20 months ago 6 months ago 20 months agoLot size (acres) 5 3 7 3 3Access/visibility Adequate/interior Superior Equal Equal EqualRail siding No Yes No Yes YesDesign 1 story/detached1 story/detached1 story/detached1 story/detached 2 story/detachedConst. quality Masonry/avg. Masonry Masonry Steel MasonryImprovement age 31 12 22 15 25Improvement condition Fair Superior Superior Superior SuperiorTotal AGLA 14,628 15,000 20,000 7,500 5,500Finished % 6.00% 5.00% 5.00% 10% 20.00%Basement sq. ft. 0 0 0 0 0Wall height 16' ceilings 18' ceilings 20' ceilings 20' ceilings 20' ceilings

Student Handbook to THE APPRAISAL OF REAL ESTATE
Developing Reconstructed Operating Statements, continued
Estimating operating expenses From comparable leases From subject history From contractors’ estimates
Estimating tenant improvement expenses Estimating leasing commissions
Chapter 21 7

Student Handbook to THE APPRAISAL OF REAL ESTATE
Developing Reconstructed Operating Statements, continued
Calculating net operating income Additional calculations
Estimating mortgage debt service Estimating equity dividend Estimating net income ratio
Chapter 21 8

Student Handbook to THE APPRAISAL OF REAL ESTATEChapter 21 9
Income Capitalization Approach Calculations for Eight-Unit Property
Rental income 8 Units @ $650 X $12 = $62,400 $1,200
$63,600 Vacancy & collection loss 5%of PGI -$3,180
$60,420
$4,500 $1,800 $3,400 $3,600 $2,500 $2,166
Reserve for roof shingles & gutters - 15 yrs. $5,600 x 1/15 = $373 Reserve for parking lot resurfacing - 12 yrs. $4,600 x 1/15 = $383 Reserve for HVAC system - 15 years. $6,500 x 1/15 = $433
$19,156 = -$19,156= $41,264
NOI / Cap. rate = ValueValue conclusion $41,264 / 0.09 = $458,489
Reconstructed Operating Statement
Other income (vending)Potential gross income (PGI)
Effective gross income (EGI)Expenses Taxes Insurance Utilities (water, sewer, electricity) Maintenance (scheduled) Maintenance (misc. repairs) Management (5% of EGI)
Total expenses
Net operating income (NOI), or IO
Student Handbook to THE APPRAISAL OF REAL ESTATEChapter 21 10
Problems
Suggested solutions begin on page 429.

Student Handbook to THE APPRAISAL OF REAL ESTATEChapter 21 11
Problem 1—Suggested Solution
Property NOI Fixed Exp.Variable Exp.Total Exp. Exp. Ratio1 $555,666 $111,000 $125,898 $236,898 42.63%2 $535,000 $107,000 $124,589 $231,589 43.29%3 $505,000 $100,000 $120,000 $220,000 43.56%4 $443,598 $95,000 $100,000 $195,000 43.96%5 $425,657 $85,000 $95,000 $180,000 42.29%6 $398,756 $78,900 $90,000 $168,900 42.36%

Student Handbook to THE APPRAISAL OF REAL ESTATEChapter 21 12
Problem 2—Suggested Solution
Item 5 yrs. ago 4 yrs. ago 3 yrs. ago 2 yrs. ago 1 yr. agoIncomeApartment rental income $228,800 $230,880 $227,200 $227,040 $221,760Laundry income $720 $619 $740 $611 $576Carport income $1,800 $1,800 $1,800 $1,800 $1,800Total income $231,320 $233,299 $229,740 $229,451 $224,136ExpensesManagement expense $13,879 $13,998 $13,784 $13,767 $13,448Real estate taxes $21,258 $22,555 $23,001 $23,456 $23,698Insurance (for the real estate) $1,850 $1,900 $1,900 $1,900 $2,900Electricity (common areas) $1,500 $1,538 $1,576 $1,615 $1,656Water and sewer (incl. in rent) $8,064 $8,266 $8,472 $8,684 $8,901Bad check (loss in income & fee) $800 $1,650 $1,650 $1,640 $2,460Bank service charge $197 $368 $98 $491 $29Mowing service $2,880 $2,880 $3,040 $3,040 $3,040Site maintenance: parking lot $ - $3,900 $ - $ - $3,900Site maintenance: lawn care $1,225 $1,350 $1,350 $1,450 $1,600Bldg: apt. cleaning $916 $1,016 $916 $450 $1,112Bldg: apt. painting $2,550 $2,125 $1,700 $2,550 $2,975Bldg: maintenance: HVAC $1,320 $2,565 $1,895 $2,966 $3,654Bldg: plumbing/electric $555 $1,750 $598 $985 $2,588Bldg maintenance: other $7,895 $8,855 $8,658 $4,500 $3,800Misc. expenses $3,900 $1,000 $708 $210 $989Total expenses $68,789 $75,715 $69,347 $67,705 $76,750Net income $162,531 $157,585 $160,394 $161,746 $147,386Expense ratio 29.70% 32.50% 30.20% 29.50% 34.20%
9568 S. Greenway Street Cash flow history24-unit apartments with six carports


