The Trading Floor October 2016 Table of Contents TECHNICAL ANALYSIS Dow Theory in the Modern Market ............................................................................................................... 2 INCOME & PROTECTION STRATEGIES Portfolio Hedging: VIX Calls Are an Option (Pun Intended) ......................................................................... 5 TRADING STRATEGIES YUM – Serving Up a Post-Earnings Trade ................................................................................................... 9 SPECIAL FEATURE The Path of Least Resistance: Linear Regression Analysis ....................................................................... 12 KEY INDICATORS Housing is Back – But Don’t Tell Anybody .................................................................................................. 15 EDUCATION & EVENTS Upcoming Webcast Series and Live Events............................................................................................... 17 BIOS Meet the Contributing Writers ..................................................................................................................... 20
Transcript
The Trading FloorOctober 2016
Table of Contents
TECHNICAL ANALYSIS
Dow Theory in the Modern Market ............................................................................................................... 2
INCOME & PROTECTION STRATEGIES
Portfolio Hedging: VIX Calls Are an Option (Pun Intended) ......................................................................... 5
TRADING STRATEGIES
YUM – Serving Up a Post-Earnings Trade ................................................................................................... 9
SPECIAL FEATURE
The Path of Least Resistance: Linear Regression Analysis ....................................................................... 12
KEY INDICATORS
Housing is Back – But Don’t Tell Anybody .................................................................................................. 15
EDUCATION & EVENTS
Upcoming Webcast Series and Live Events ............................................................................................... 17
BIOS
Meet the Contributing Writers ..................................................................................................................... 20
The Trading Floor | TD Ameritrade Institutional 2
The original interpretation of Dow Theory is as old as technical analysis itself. At the time it was developed it was the first study of how groups of stocks trended together. Today it’s common knowledge that in a secular bull market most stocks will rise, and in a secular bear market most stocks will fall, but at the time this was a revolutionary discovery. Even with that knowledge the tricky part is determining whether you’re in a bull or bear market, and more importantly how to spot the signals of a reversal. That’s where Dow Theory comes in. We will look at the historical interpretation of Dow Theory as well as a modern day equivalent.
There are 3 main hypotheses to Dow Theory analysis:
1. The primary trend is inviolate (Identify the primary trend)
2. The averages discount everything
3. Dow Theory is not infallible
The analysis comes in looking for confirmation between the primary trends of two different averages or indices. The historical comparison used the Dow Jones Industrials Average ($DJI) and the Railroad Average, now called the Dow Transportation Average ($DJT). The modern day equivalent is comparing the large cap S&P 500 Index (SPX) to the small cap Russell 2000 Index (RUT). This is not to say using the $DJI and the $DJT is obsolete, but using both comparisons will increase your likelihood of making the right call. Since we are trying to identify the primary trend, we will use weekly charts in our analysis.
$DJI
TECHNICAL ANALYSIS
Dow Theory in the Modern Market
by Clint Cowles, CMT
For illustrative purposes only.
The Trading Floor | TD Ameritrade Institutional 3
TECHNICAL ANALYSIS: Dow Theory in the Modern Market
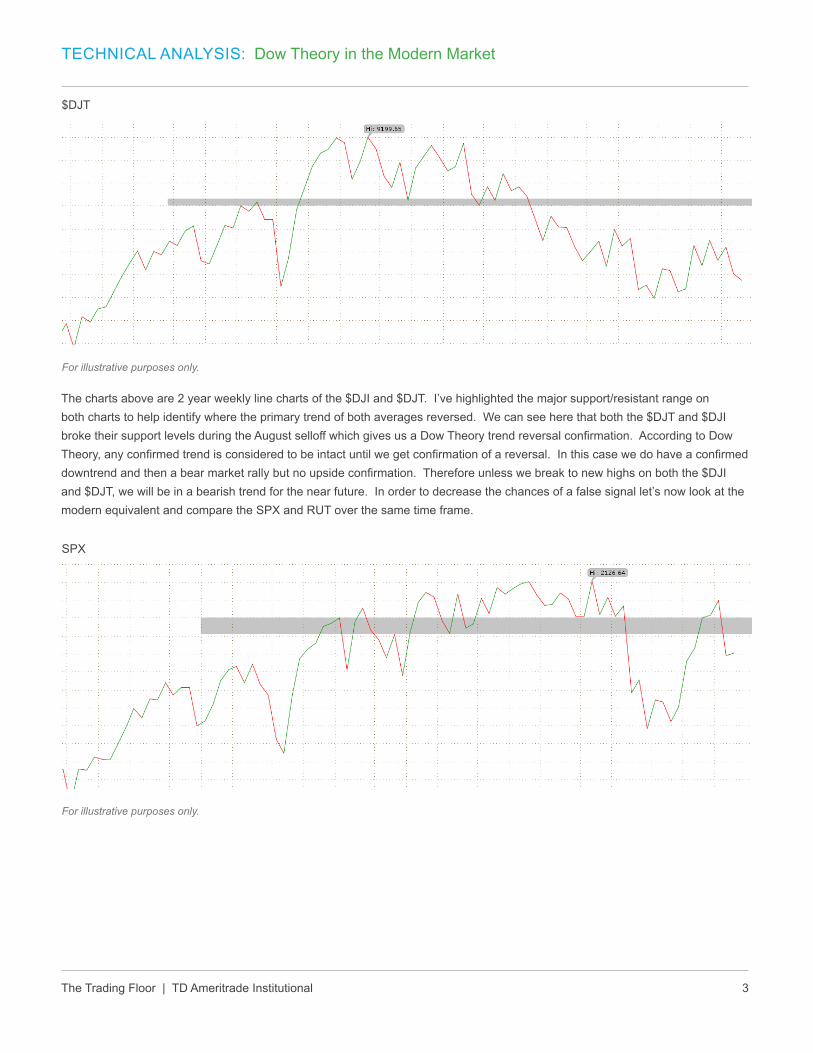
The charts above are 2 year weekly line charts of the $DJI and $DJT. I’ve highlighted the major support/resistant range on both charts to help identify where the primary trend of both averages reversed. We can see here that both the $DJT and $DJI broke their support levels during the August selloff which gives us a Dow Theory trend reversal confirmation. According to Dow Theory, any confirmed trend is considered to be intact until we get confirmation of a reversal. In this case we do have a confirmed downtrend and then a bear market rally but no upside confirmation. Therefore unless we break to new highs on both the $DJI and $DJT, we will be in a bearish trend for the near future. In order to decrease the chances of a false signal let’s now look at the modern equivalent and compare the SPX and RUT over the same time frame.
$DJT
SPX
For illustrative purposes only.
For illustrative purposes only.
The Trading Floor | TD Ameritrade Institutional 4
TECHNICAL ANALYSIS: Dow Theory in the Modern Market
While this article discusses technical analysis, other approaches, including fundamental analysis, may assert very different views.
Here we see a very similar setup. RUT and SPX both broke their support levels in the August selloff, confirming our new downtrend. Since then there has been a bear market rally but similar to the last example RUT has underperformed SPX by a large margin and despite the strength in SPX it hasn’t broken out to new highs either. By the tenants of Dow Theory we are in a confirmed secular bear market on both the original and modern approach to the study. This will be the case until we get a confirmed reversal of the downtrend which right now would require new highs on all four Indices. If the bear market further materializes it will create new resistance levels that will then be used for this analysis, but as it sits now a bullish reversal is only possible with new all-time highs.
SPX
For illustrative purposes only.
The Trading Floor | TD Ameritrade Institutional 5
INCOME & PROTECTION STRATEGIES
Portfolio Hedging: VIX Calls Are an Option (Pun Intended)
by Bob Groves
U.S. investors have it good these days. Stocks are hitting all-time highs and market volatility is exceptionally low. When the VIX (a measure of the SPX implied forward movement known as the fear gauge) is low, the strong negative correlation of the VIX to the S&P 500 index (see table below) makes it viable to use VIX options as a hedge to protect a portfolio against a market correction. Because of this inverse relationship between the SPX and the VIX, the VIX is often viewed as a contrarian indicator, and when it’s low may indicate the market is getting overly complacent.
In financial markets, complacency can store up danger, which can act to increase the velocity of a correction when does it does occur. Given that the VIX, in late August, sat at multi-year lows (see chart below), buying volatility may be prudent, given the old adage “buy protection when you can, not when you have to”. One potential advantage of using volatility-based products is that they are linked, not to some absolute price level, but to an absolute volatility level, and many equity investors are more concerned with hedging against volatility than about protecting against declines below some specific level. This is because gradual, orderly bear markets can often be managed as easily as steady bull markets, but sudden shocks concern people. The other potential advantage of buying VIX calls or call spreads, versus buying SPX puts or put spreads, could likely occur if you are wrong and the market sits still or rallies. Here you know almost certainly that the SPX hedge will lose money, but the VIX index may not fall as significantly since it’s already at an extreme low level. For these reasons, buying volatility using VIX options can be a savvy choice to help decrease your downside exposure.
Median 30-day Correlation
10 Years -0.86
5 Years -0.87
1 Years -0.92
For illustrative purposes only.
The Trading Floor | TD Ameritrade Institutional 6
INCOME & PROTECTION STRATEGIES: Portfolio Hedging: VIX Calls Are an Option (Pun Intended)
Implementation:
• Verify the portfolio is highly correlated to the S&P 500 index with a beta close to 1.0
• Implementing such a hedge often begins with buying near-term at-the-money (ATM), or slightly out-of-the-money (OTM) VIX calls; in the event of a stock market decline, it’s likely that the VIX will spike high enough so that the VIX call options gain sufficient value to offset, partially or fully, the losses in the portfolio
• The biggest source of confusion is that VIX options are being priced off of the corresponding VIX future (symbol /VX), NOT the actual VIX (spot price). For example, on Aug. 12th, the September VIX options (current spot VIX 12.50) were being priced off of the September /VX futures contract trading at $15, making the VIX $15 call strike the ATM option
• A VIX futures contract with no time left is equal to the VIX spot price, so on the last day of a /VX contract’s lifespan, /VX = VIX
• Typically a second consideration is to combine the long calls with selling an equal number of further OTM strike calls (creating a debit spread), the objective being to reduce the cost-basis and break-even of the long call
• The choice between using long calls or long call spreads, would depend on both the cost you are willing to allocate, and the percent pullback you want to protect against. An example of each is shown below
• The tricky part is determining how many VIX calls or call spreads you need to purchase to protect the portfolio
For illustrative purposes only.
The Trading Floor | TD Ameritrade Institutional 7
INCOME & PROTECTION STRATEGIES: Portfolio Hedging: VIX Calls Are an Option (Pun Intended)
Set-Up:
• From early February to late August, the market has been climbing higher (SPX went from 1870 to 2190, a gain of 17%), while at the same time the VIX has been drifting downwards, hitting a multi-year low of 12.50 in mid-August. At that time, you believe that the market is vulnerable to a 10% correction and decide to potentially hedge those gains by implementing a VIX strategy
• Equity holdings= $500,000
• SPX at 2,190
• VIX is at 12.30 (September /VX at 15)
• September VIX calls with a strike price of $15 (ATM) are priced at $1.60
• Sept. VIX calls with a strike price of $21 (OTM), are priced at $0.60 (21 equals expected VIX level if SPX drops 10%, see math below)
Position Sizing:
• According to the CBOE website, on average VIX rises 16.8% on days when the SPX drops 3%. This means if the SPX moved down by 10%, the VIX can potentially shoot up by 56%. However, because the VIX futures are “forward” contracts that are guessing where the VIX will be at a certain date, not where the spot VIX is right now, they will not track the spot VIX on a 1:1 basis. So, to play it safe, assume that the /VX will rise by only 40%. This means in theory the /VX should rise from 15 to 21 (15 x 140%) if the SPX drops 10% from the current level of 2,190 to 1,970
• If the /VX rose to 21, at expiration each Sept. $15 VIX call bought for $1.60 would be worth about $6 ($440 gain), while each Sept $21 sold for $0.60 would be worthless ($60 gain)
• 10% of the portfolio is worth $50,000
• Number of VIX call spreads required to protect a 10% down move: $50,000/$500 = 100
• Number of VIX call options required to protect a 10% down move: $50,000/$440 = 113 (note: for comparison, example below illustrates buying 100 only)
The Trading Floor | TD Ameritrade Institutional 8
INCOME & PROTECTION STRATEGIES: Portfolio Hedging: VIX Calls Are an Option (Pun Intended)
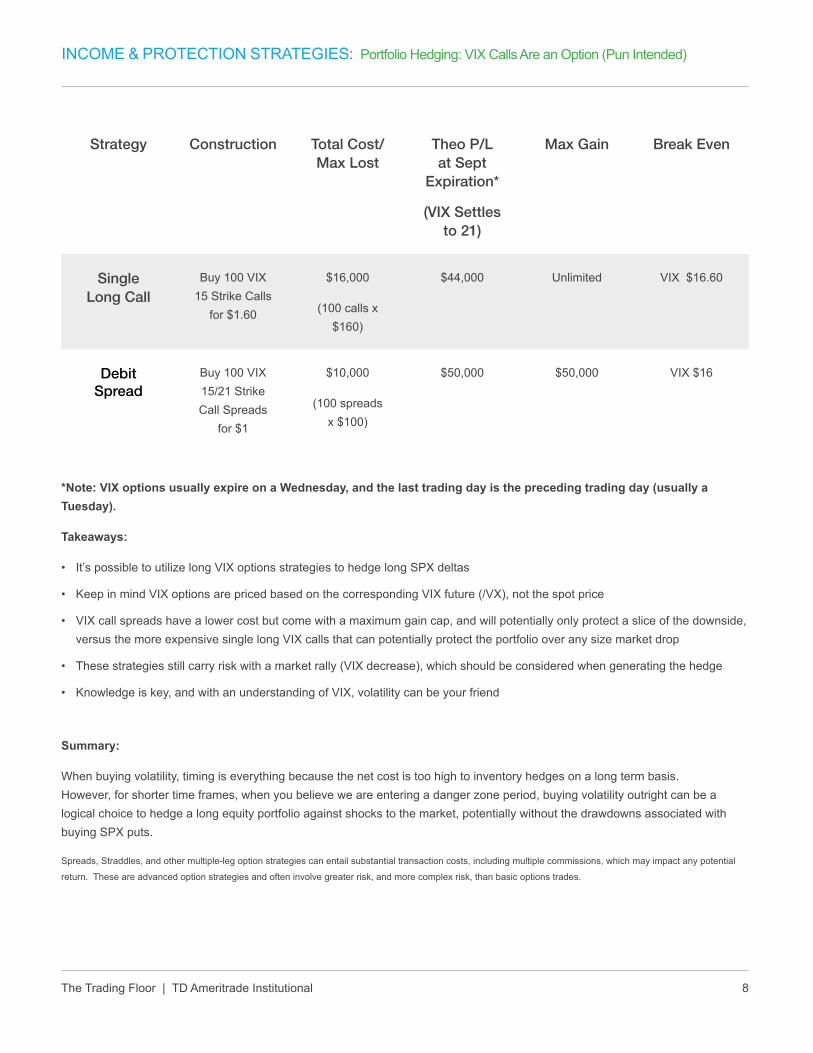
Strategy Construction Total Cost/Max Lost
Theo P/L at Sept
Expiration*
(VIX Settles to 21)
Max Gain Break Even
Single Long Call
Buy 100 VIX 15 Strike Calls
for $1.60
$16,000
(100 calls x $160)
$44,000 Unlimited VIX $16.60
Debit Spread
Buy 100 VIX 15/21 Strike Call Spreads
for $1
$10,000
(100 spreads x $100)
$50,000 $50,000 VIX $16
*Note: VIX options usually expire on a Wednesday, and the last trading day is the preceding trading day (usually a Tuesday).
Takeaways:
• It’s possible to utilize long VIX options strategies to hedge long SPX deltas
• Keep in mind VIX options are priced based on the corresponding VIX future (/VX), not the spot price
• VIX call spreads have a lower cost but come with a maximum gain cap, and will potentially only protect a slice of the downside, versus the more expensive single long VIX calls that can potentially protect the portfolio over any size market drop
• These strategies still carry risk with a market rally (VIX decrease), which should be considered when generating the hedge
• Knowledge is key, and with an understanding of VIX, volatility can be your friend
Summary:
When buying volatility, timing is everything because the net cost is too high to inventory hedges on a long term basis. However, for shorter time frames, when you believe we are entering a danger zone period, buying volatility outright can be a logical choice to hedge a long equity portfolio against shocks to the market, potentially without the drawdowns associated with buying SPX puts.
Spreads, Straddles, and other multiple-leg option strategies can entail substantial transaction costs, including multiple commissions, which may impact any potential
return. These are advanced option strategies and often involve greater risk, and more complex risk, than basic options trades.
The Trading Floor | TD Ameritrade Institutional 9
TRADING STRATEGIES
YUM – Serving Up a Post-Earnings Trade
by Michael Turvey, CFP®, CMT
Strategy Long Call Vertical Spread
Expiration 36 Days
Max Loss $195(If YUM is at or below $87.50 at expiration)
Max Gain $305(If YUM is at $92.50 or above at expiration)
Break-even $89.45 at expiration($87.5 strike price plus $1.95 cost of trade)
For illustrative purposes only. Not a recommendation.
If you were BULLISH, you could have... Bought 1 August $87.5 call and sold 1 August $92.5 call for a debit of $1.95.
Explanation
YUM shares jumped higher after their earnings report was released after the close on July 13. A long call vertical spread is one strategy that could be used for a continued bullish forecast. This strategy is often used when implied volatility is low, as is typically
The Trading Floor | TD Ameritrade Institutional 10
TRADING STRATEGIES: YUM – Serving Up a Post-Earnings Trade
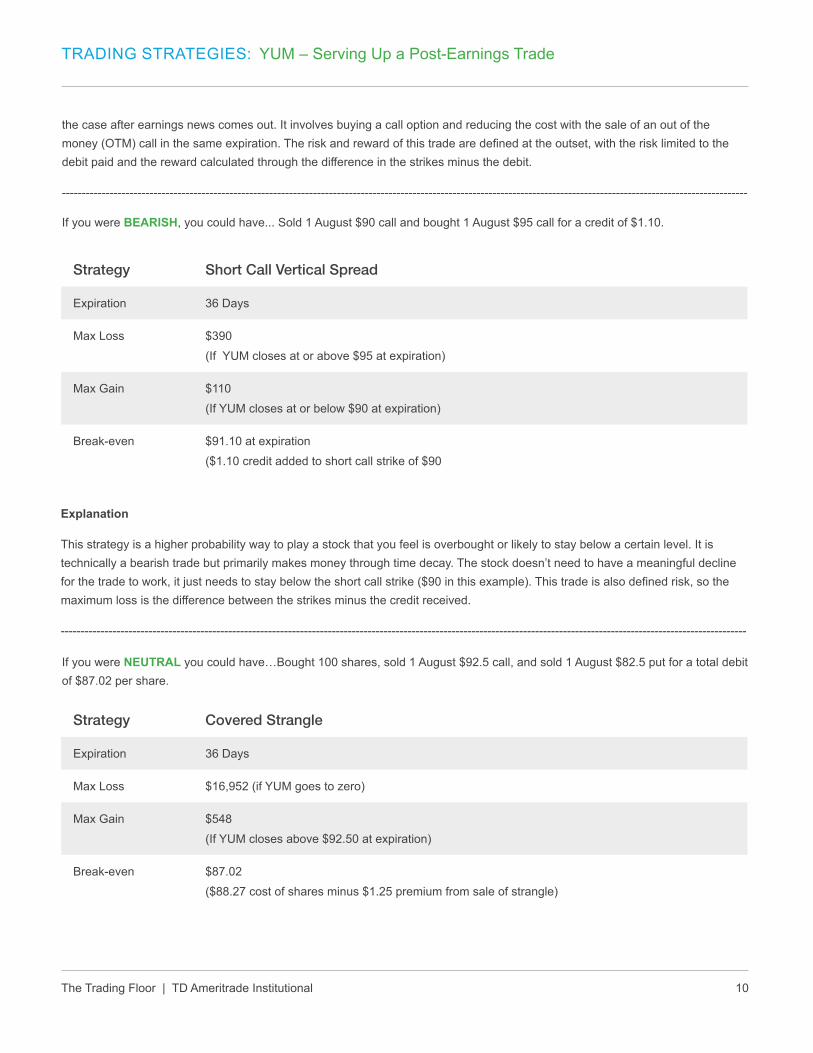
If you were BEARISH, you could have... Sold 1 August $90 call and bought 1 August $95 call for a credit of $1.10.
If you were NEUTRAL you could have…Bought 100 shares, sold 1 August $92.5 call, and sold 1 August $82.5 put for a total debit of $87.02 per share.
the case after earnings news comes out. It involves buying a call option and reducing the cost with the sale of an out of the money (OTM) call in the same expiration. The risk and reward of this trade are defined at the outset, with the risk limited to the debit paid and the reward calculated through the difference in the strikes minus the debit.
Max Loss $390(If YUM closes at or above $95 at expiration)
Max Gain $110(If YUM closes at or below $90 at expiration)
Break-even $91.10 at expiration($1.10 credit added to short call strike of $90
Strategy Covered Strangle
Expiration 36 Days
Max Loss $16,952 (if YUM goes to zero)
Max Gain $548(If YUM closes above $92.50 at expiration)
Break-even $87.02 ($88.27 cost of shares minus $1.25 premium from sale of strangle)
Explanation
This strategy is a higher probability way to play a stock that you feel is overbought or likely to stay below a certain level. It is technically a bearish trade but primarily makes money through time decay. The stock doesn’t need to have a meaningful decline for the trade to work, it just needs to stay below the short call strike ($90 in this example). This trade is also defined risk, so the maximum loss is the difference between the strikes minus the credit received.
The Trading Floor | TD Ameritrade Institutional 11
TRADING STRATEGIES: YUM – Serving Up a Post-Earnings Trade
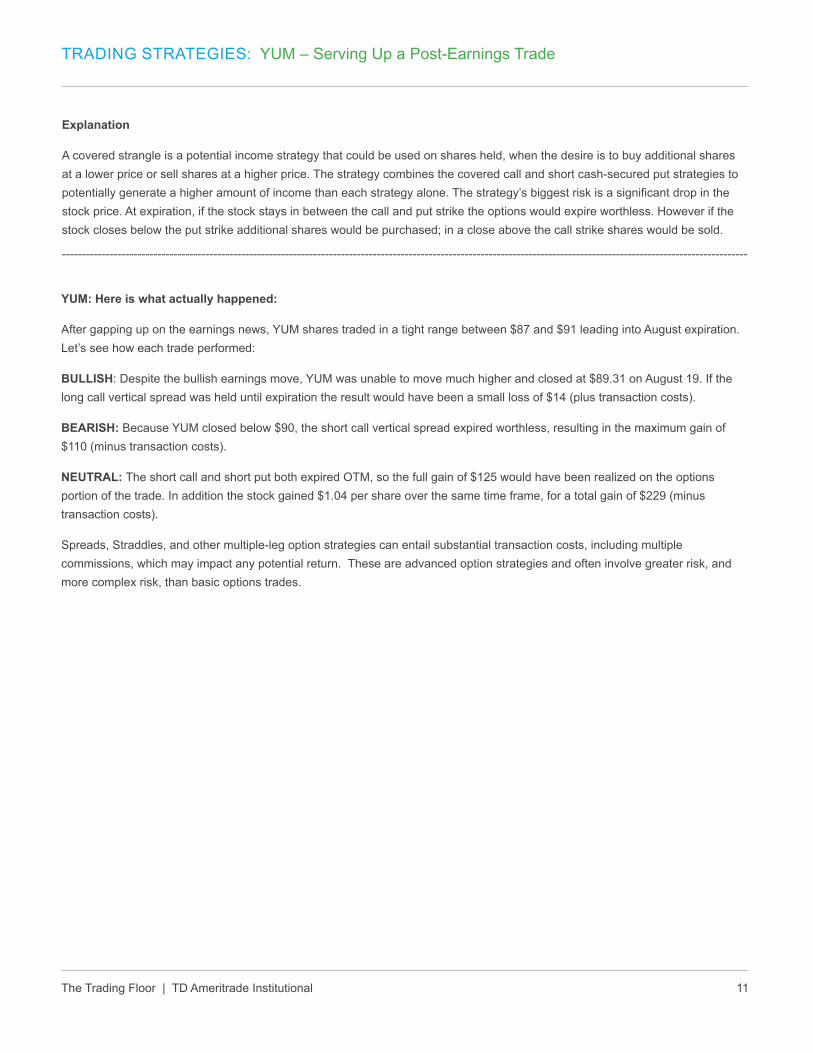
YUM: Here is what actually happened:
After gapping up on the earnings news, YUM shares traded in a tight range between $87 and $91 leading into August expiration. Let’s see how each trade performed:
BULLISH: Despite the bullish earnings move, YUM was unable to move much higher and closed at $89.31 on August 19. If the long call vertical spread was held until expiration the result would have been a small loss of $14 (plus transaction costs).
BEARISH: Because YUM closed below $90, the short call vertical spread expired worthless, resulting in the maximum gain of $110 (minus transaction costs).
NEUTRAL: The short call and short put both expired OTM, so the full gain of $125 would have been realized on the options portion of the trade. In addition the stock gained $1.04 per share over the same time frame, for a total gain of $229 (minus transaction costs).
Spreads, Straddles, and other multiple-leg option strategies can entail substantial transaction costs, including multiple commissions, which may impact any potential return. These are advanced option strategies and often involve greater risk, and more complex risk, than basic options trades.
Explanation
A covered strangle is a potential income strategy that could be used on shares held, when the desire is to buy additional shares at a lower price or sell shares at a higher price. The strategy combines the covered call and short cash-secured put strategies to potentially generate a higher amount of income than each strategy alone. The strategy’s biggest risk is a significant drop in the stock price. At expiration, if the stock stays in between the call and put strike the options would expire worthless. However if the stock closes below the put strike additional shares would be purchased; in a close above the call strike shares would be sold.
The Trading Floor | TD Ameritrade Institutional 12
A linear regression calculation is something many of us haven’t heard about since our college statistics classes, but when analyzing price action in securities markets it can be a big help in determining support and resistance levels. This analysis can be especially helpful in markets that are trading at new all-time highs, since it can be difficult to identify support and resistance levels in the absence of any past trading near the current price. Here we’ll take a closer look at two linear regression studies and a regression channel drawing to establish support and resistance levels as well as analyze the strength of the current trend.
Both of the studies we’ll analyze are based off of the same center line using a “least squares” calculation of closing prices. This method finds a straight line through a set of data points with the least amount of variation from that line. More specifically, it takes the square of the vertical distance from each data point (in our case closing prices) to that line and adds them all together. The straight line that comes up with the smallest number to that calculation is the linear regression line. The formula is:
Now that we’ve got the math down, how can we use this in analyzing price action in securities markets? That’s where our studies from thinkpipes® come into play, specifically the LinearRegCh100 and the LinearRegCh50. The 100 will find the closing price that is furthest away from the linear regression line and draw a parallel line passing through that point. It will then draw another line equidistant from the linear regression line on the other side forming a channel. The 50 will place a channel on the chart halfway between the linear regression line and the 100 channel. I’ve placed both studies together on the chart of RUT below.
TECHNICAL ANALYSIS
The Path of Least Resistance: Linear Regression Analysis
by Clint Cowles, CMT
For illustrative purposes only.
The Trading Floor | TD Ameritrade Institutional 13
TECHNICAL ANALYSIS: The Path of Least Resistance: Linear Regression Analysis
For illustrative purposes only.
These channels are helpful in several ways, the first being that they tend to act as support and resistance levels. In the one year daily chart of RUT above, you can see that the upper bound of the 50 channel is currently acting as resistance and has also done so several times in the past. Secondly, it is telling us that even in an uptrending environment, we are closer to the upper end of the range. Therefore even if the uptrend continues from here, the probabilities are in favor of a short term reversion to the mean near the linear regression (center) line. One of the great attributes of these studies is that they automatically update with new information as time passes so you aren’t required to draw new support and resistance lines. However, we are able to drill down further using the linear regression channel drawing.
The drawing requires some decision making on the part of the analyst but it can be a helpful complement to the study on the chart. Oftentimes during the course of a year the trends change direction, so if you’d just like to take a closer look at the data since the current trend took form, the drawing would be the tool to use. The linear regression channel drawing will also use the “least squares” calculation to draw the center line but it will only use the closing prices for the range you choose. The channel is plotted one standard deviation above and below that center line.
In the image below, I added the linear regression channel drawing over the recent uptrend. You’ll see that I didn’t start this drawing on the day price reversed. After the large selloff at the beginning of the year, there was a 16% rally in 3 weeks’ time which isn’t reflective of a steady trend. Once RUT pulled back slightly, it started to stair-step higher, establishing the uptrend we are still in now. That’s why I initiated the drawing on the day the normal uptrend started, not the initial reversal.
Once the drawing is on your chart, the interpretation is the same, use the center line and the channels as support and resistance. RUT has been riding the linear regression center line extremely close for the past 6 weeks, never rising more that 2% away from it yet continuing to use it as support. In early September the support line of the linear regression drawing and the resistance line from the LinReg50 study were converging. One of these lines had to break and we can see in the chart below that it was the support line that gave way with a strong bearish candle. This did not change the direction of the trend as the price is still making higher highs and higher lows, but it did change the former support to new resistance, adding to the probability that a short term pullback is coming.
The Trading Floor | TD Ameritrade Institutional 14
TECHNICAL ANALYSIS: The Path of Least Resistance: Linear Regression Analysis
For illustrative purposes only.
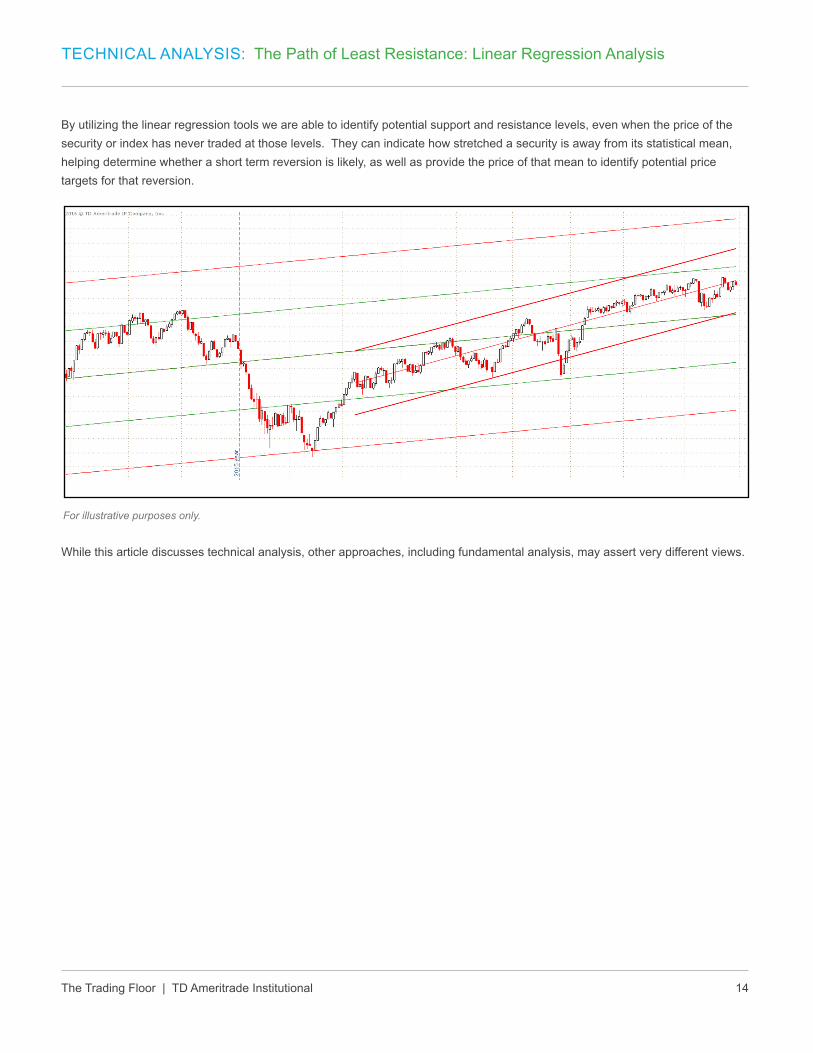
While this article discusses technical analysis, other approaches, including fundamental analysis, may assert very different views.
By utilizing the linear regression tools we are able to identify potential support and resistance levels, even when the price of the security or index has never traded at those levels. They can indicate how stretched a security is away from its statistical mean, helping determine whether a short term reversion is likely, as well as provide the price of that mean to identify potential price targets for that reversion.
The Trading Floor | TD Ameritrade Institutional 15
KEY INDICATORS
Housing is Back – But Don’t Tell Anybody
by Michael Turvey, CFP®, CMT
It’s been such a long time coming, that most people have forgotten. Its strength has been masked by overall economic growth that’s been tepid, at best. It was left for dead, when considering the living habits of millennials. Yes folks, we’re talking about the recovery of the U.S. housing market. And once again, economic reports concerning housing data are worth keeping an eye on (and for good reasons).
When bubbles burst, it takes a long time to get back to the levels established during the mania. For example, on March 10, 2000 the NASDAQ Composite Index closed at a record high of 5048.63. Later that year the internet bubble burst, and it took 15 years to revisit that top. So we probably shouldn’t expect housing numbers to approach pre-crisis levels anytime soon, but slow, steady progress is being made.
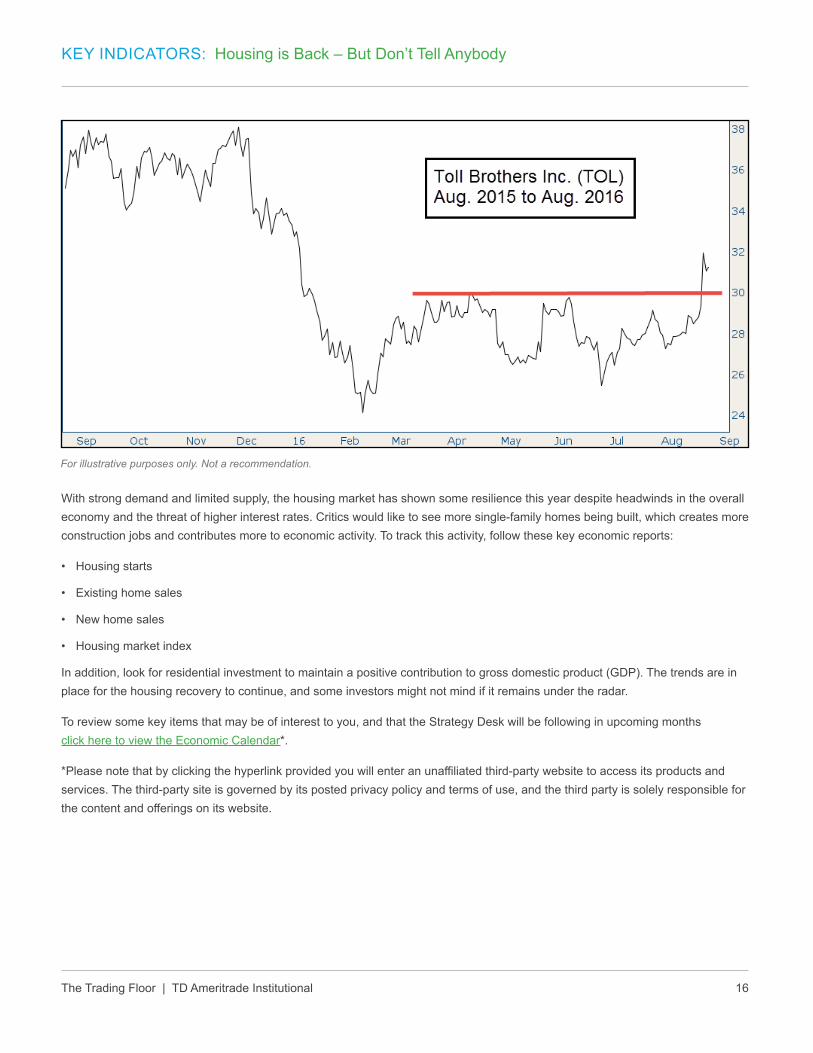
On August 23, 2016 the Commerce Department reported that sales of newly constructed homes in July rose 12.4% to an annual rate of 654,000, the highest rate since October 2007. Although this data is typically volatile with a wide margin of error, that number was 31.3% higher than a year ago—tough to dismiss. The chart below shows that we are a little more than half way back to 2007 levels, and also an accelerating positive trend that began in late 2015.
Investors have reacted to recent reports by bidding up shares of homebuilder stocks. This year, from the February lows through late August, the iShares U.S. Home Construction ETF (ITB) gained 35%. On the same day that July new home sales were released, luxury homebuilder Toll Brothers Inc. (TOL) reported third quarter earnings that included an 18.2% jump in orders (highest growth in two years) and a 23.5% increase in revenue. The market responded with the stock soaring 8.8% and closing above a key $30 resistance level (see chart below). Some analysts still view stocks in this industry as being cheap based on historic valuations.
The Trading Floor | TD Ameritrade Institutional 16
KEY INDICATORS: Housing is Back – But Don’t Tell Anybody
With strong demand and limited supply, the housing market has shown some resilience this year despite headwinds in the overall economy and the threat of higher interest rates. Critics would like to see more single-family homes being built, which creates more construction jobs and contributes more to economic activity. To track this activity, follow these key economic reports:
• Housing starts
• Existing home sales
• New home sales
• Housing market index
In addition, look for residential investment to maintain a positive contribution to gross domestic product (GDP). The trends are in place for the housing recovery to continue, and some investors might not mind if it remains under the radar.
To review some key items that may be of interest to you, and that the Strategy Desk will be following in upcoming months click here to view the Economic Calendar*.
*Please note that by clicking the hyperlink provided you will enter an unaffiliated third-party website to access its products and services. The third-party site is governed by its posted privacy policy and terms of use, and the third party is solely responsible for the content and offerings on its website.
For illustrative purposes only. Not a recommendation.
The Trading Floor | TD Ameritrade Institutional 17
EVENTS AND EDUCATION
Upcoming Webcast Series and Live Events:
October 25
Using Options to Mimic Structured Products
Join us for a discussion about how options might be used as a substitute for some of the common structured products in the marketplace. This informative webcast can help you:
• Identify the benefits and risks of using options to create a synthetic structured product, including principal protection, reduced downside exposure, and limited upside participation
• Discuss logical criteria for creating positions based on your risk and return objectives
• Analyze opportunities in the current market environment
Note: CE credits are not available when accessing the webcast through the replay link. You must attend the live webcast to be eligible for the CE credits.
Register Now
Spreads, Straddles, and other multiple-leg option strategies can entail substantial transaction costs, including multiple commissions, which may impact any potential
return. These are advanced option strategies and often involve greater risk, and more complex risk, than basic options trades.
Structured products are not suitable for all investors. Risks may include, among others, loss of principal or the possibility that at expiration the investor will own the
reference asset at a depressed price.
November 1
Technical Analysis: Use Breadth Indicators to Decipher the Movements of an Index
Join us for a discussion about market breadth and how it can be used to analyze current market trends. This informative webcast can help you:
• Determine the strength behind a trend by utilizing breadth indicators
• Use multiple indicators to read current and past breadth levels
Note: CE credits are not available when accessing the webcast through the replay link. You must attend the live webcast to be eligible for the CE credits.
Register Now
While this webcast discusses technical analysis, other approaches, including fundamental analysis, may assert very different views.
The Trading Floor | TD Ameritrade Institutional 18
EVENTS AND EDUCATION: Upcoming Webcast Series and Live Events
November 8
The Price of Downside Protection
When using options to hedge downside risk, there is always a cost involved. But depending on the strategy, some costs may be more acceptable than others. Join us as we discuss three common portfolio hedging strategies. This informative webcast can help you:
• Compare the costs, benefits and risks of the following portfolio hedging strategies: long puts, long put vertical spreads, and put ratio spreads
• Determine which strategy is most appropriate based on market assumptions, risk tolerance and costs
Note: CE credits are not available when accessing the webcast through the replay link. You must attend the live webcast to be eligible for the CE credits.
Register Now
Spreads, Straddles, and other multiple-leg option strategies can entail substantial transaction costs, including multiple commissions, which may impact any potential
return. These are advanced option strategies and often involve greater risk, and more complex risk, than basic options trades.
November 15
Portfolio Rebalancing Using Options
Join us for a discussion on incorporating options as a rebalancing tool for client portfolios. By implementing some basic option selling techniques, you may potentially enhance portfolio income while shifting your portfolio holdings and risk allocations. This informative webcast can help you:
• Establish guidelines to rebalance portfolios more cost-effectively
• Identify opportunities to generate option premium on current portfolio holdings
• Reduce or reallocate portfolio risk based on desired levels
Note: CE credits are not available when accessing the webcast through the replay link. You must attend the live webcast to be eligible for the CE credits.
Note: CE credits are not available when accessing the webcast through the replay link. You must attend the live webcast to be eligible for the CE credits.
Register Now
While this webcast discusses technical analysis, other approaches, including fundamental analysis, may assert very different views.
The Trading Floor | TD Ameritrade Institutional 20
MEET THE CONTRIBUTING WRITERS: Bios
Clint Cowles, CMT
With his technical analysis expertise, Clint Cowles focuses on helping advisors successfully incorporate sophisticated trading strategies and advanced allocation models into their practices. Whether facilitating webcasts, hosting workshops, or providing individual support, Clint provides the insight and expertise advisors need to improve their trading efficiency using thinkpipes—TD Ameritrade’s advanced trading platform that provides streaming market data, real-time analytics and robust charting features. Clint joined TD Ameritrade in 2011 and holds a Bachelor’s degree in Mathematics, the Chartered Market Technician (CMT) designation, and FINRA Series 3, 7, 63, 34 and 24 licenses.
Bob Groves
Chicago-based Bob Groves focuses on providing clients with the support they need to understand and implement options strategies ranging from the simple to the complex. Using his experiences as a former market maker and options risk manager, Bob helps advisors understand the power of using options through one-on-one support, weekly webcasts, and regional workshops. He joined TD Ameritrade in 2009 and holds a Bachelor’s degree in Accounting as well as FINRA Series 3, 7 and 66 licenses.
Michael Turvey, CFP®, CMT
Leveraging his experiences as a former options broker and market maker, Michael Turvey focuses on helping emerging and established advisors to more efficiently manage their time—and their books. Through one-on-one support, weekly webcasts, and regional workshops, he gives advisors the insight and confidence they need to select, implement, and manage options strategies across multiple accounts. Michael joined TD Ameritrade in 2003. Additionally, he is a contributor to TD Ameritrade Institutional’s quarterly trading e-newsletter, and has written articles published on Forbes.com and in TD Ameritrade’s thinkmoney and Ticker Tape magazines. He has a Bachelor’s degree, is a Certified Financial Planner™ (CFP®) certificant and Chartered Market Technician (CMT) and holds FINRA Series 7 and 63 licenses.
The Trading Floor | TD Ameritrade Institutional 21
Options are not suitable for all investors as the special risks inherent to options trading may expose investors to potentially rapid and substantial losses. Options trading subject to TD Ameritrade review and approval. Please read Characteristics and Risks of Standardized Options before investing in options. Spreads, straddles, and other multiple-leg option strategies can entail substantial transaction costs, including multiple commissions, which may impact any potential return. These are advanced option strategies and often involve greater risk, and more complex risk, than basic options trades. Investors should also consider contacting a tax advisor regarding the tax treatment applicable to multiple-leg transactions.
The short put strategy risks purchasing the corresponding stock at the strike price when the market price of the stock will likely be lower. Naked option strategies involve the highest amount of risk and are only appropriate for traders with the highest risk tolerance.
The preceding information is not a recommendation or endorsement of any particular investment or investment strategy. Returns will vary and all investments involve risk, including loss of principal.
Transaction costs (commissions, contract, exercise/assignment fees and other fees) are important factors and should be considered when evaluating any options trade.
Examples presented are provided for illustrative and educational use only and are not a recommendation or solicitation to purchase or sell any specific security or to use a specific strategy.
Supporting documentation for any claims, comparison, statistics, or other technical data in options communication will be supplied upon request.


![COMPLIANCE EDITION ] - TD Ameritrade Institutional](https://static.documents.pub/doc/80x56/62364df555977e5e256720e5/compliance-edition-td-ameritrade-institutional.jpg)


