115
The Urban Household Energy Transition Energy, Poverty, and the Environment in the Developing World Douglas F. Barnes, Kerry Krutilla, and William Hyde March 2004
The Urban Household Energy Transition Energy, Poverty, and the Environment in the
Developing World
Douglas F. Barnes, Kerry Krutilla, and William Hyde
March 2004

i
PREFACE
This book develops a comprehensive assessment of the evolution of residential fuel choice and consumption in urban areas in the developing world, and the effect of urban growth on periurban forest resources. The research is based on an comprehensive analysis of a series of household energy surveys performed under the auspices of the Energy Sector Management Assistance Programme (ESMAP) of the World Bank From 1984-2000, this program produced more than 25,000 household energy surveys in 45 cities spanning 12 countries and 3 continents. Additionally, GIS mapping software was used to compile a data base of site specific vegetation patterns surrounding a sub-sample of 34 cities. Taken together, the energy surveys and the biomass data contained sufficiently wide variation in urban fuel choice and consumption patterns, local resource conditions, and energy policy regimes to enable an assessment of the factors underlying the evolution of urban fuel utilization and forest resources. By comparing the patterns of energy use of a large number of cities, we were able to distill a comprehensive picture of both the diversity underlying the energy transition and the fundamental principles applying across cases.

ii
ACKNOWLEDGEMENTS This book is the culmination of the work on household energy in
developing studies financed and supported by the Energy Strategy Management Assistance Program of the World Bank during the last twenty-five years. The authors owe much debt and gratitude to the dedicated staff and consultants that carried out household energy surveys and wrote the individual country reports as part of this program. We are especially appreciative of the support of Willem Floor, Robert van der Plas and Karl Jechoutek who made significant contributions to the policy analysis in this study. Although there are numerous authors that contributed to this body of work, we would like to particularly thank Philippe Durand, Kevin Fitzgerald, Josephine Arpelange, Rene Masse, Boris Utria, Robert Taylor, Nouriddine Berrah.
In addition, we would like to acknowledge the contributions of the original
research team that shaped the design and conception of the study. They include Jeffrey Dowd, who worked long and hard on the policy analysis and much of the household data analysis in this study. Also, Liu Qian was invaluable in compiling and standardizing the household energy data base, a task which took more than a year; he also helped conduct the data analysis. The biomass estimation and mapping was ably completed by Marnie Tyler, with technical assistance from Paul Ryan and Keith Openshaw. That effort took more than a year. For the case study of Hyderabad, the authors worked with Mazoor Alam, Jayant Sathaye, Keith Openshaw, Geeta Reddy, and M. Naimuddin; we are grateful for their contributions. Finally, we appreciate the comments and insights of Mark Pitt, who helped with the research design at an early stage in the study. Joy Dunkerley provided a thorough review of an earlier manuscript, and Gerald Foley and Gerald Leach provided their generous insights on the issue assessed in the study. We thank all these individuals for their dedication and support. However, any errors or omissions in the study, as well as the conclusions of the analysis, are the primary authors’ exclusive responsibility.
We also wish to thank (acknowledge final editor) for the editing and
preparation of the manuscript for publication. The research was financed by the World Bank. However, the findings,
interpretation, and conclusions expressed in this book are entirely those of the authors and should not be attributed in any manner to the World Bank, to its affiliated organizations, or to members of its Board of Executive directors or the governments they represent.

iii
ABBREVIATIONS AND ACRONYMS
Kgoe kilogram of oil equivalent kWh kilowatt hour kW kilowatt km kilometer kV kilovolt LPG liquefied petroleum gas MWh megawatt hour MW megawatt TWh terawatt hour
ENERGY CONVERSION FACTORS
Energy content Efficiency for cooking
Fuel Type Megajoules KgOE Kilo-calories
Percent
LPG (kg) 45.0 1.059 10,800 60 Electricity (kWh) 3.6 0.085 860 75 Kerosene (liter) 35.0 0.824 8,400 35 Charcoal (kg), 5% Moist. C. 4% Ash 30.0 0.706 7,200 22 Wood (kg), 15% Moist. C. 1% Ash 16.0 0.376 3,840 15 Coal (kg) can vary significantly 23.0 0.541 5,520 NA Dung (kg) 15% Moist. C. 20% Ash 14.5 0.341 3,480 NA Straw (kg) 5% Moist. C. 4% Ash 13.5 0.318 3,240 NA

iv
TABLE OF CONTENTS
PREFACE................................................................................................... I
ACKNOWLEDGEMENTS ...................................................................... II
ABBREVIATIONS AND ACRONYMS ................................................. III
ENERGY CONVERSION FACTORS.................................................... III
1. URBAN HOUSEHOLD ENERGY, POVERTY, AND THE ENVIRONMENT ............................................................................ 11
Introduction ...............................................................................................11
Overview of Cities and Regions in the Study ...........................................13
Topics of Study .........................................................................................15
Urban Energy Transitions.......................................................................... 15 Equity ........................................................................................................ 16 Environmental and Health Effects............................................................. 17
Definitions and Terminology ....................................................................17
Methodology Caveat .................................................................................19
Conclusion.................................................................................................20
2. THE URBAN ENERGY TRANSITION ............................................. 22
Introduction ...............................................................................................22
Conceptual Framework .............................................................................22
Data Trends ...............................................................................................27
Urban Energy Transition Typology ..........................................................32
Stage 1: High Woodfuel Utilization .......................................................... 33 Stage 2: Utilization of Transition Fuels..................................................... 33 Stage 2A Pattern: High Charcoal Use ....................................................... 33 Stage 2B Pattern: High Coal or Kerosene Use .......................................... 35 Stage 2C Pattern: Diversified Transitional Fuel Use................................. 36 Stage 3: Transition to LPG and Electricity................................................ 37
Conclusion.................................................................................................37
3. HOUSEHOLD FUEL CHOICE AND CONSUMPTION ................. 39
Introduction ...............................................................................................39

v
Impact of Household Characteristics on Fuel Use ....................................40
Household Size.......................................................................................... 40 Income ....................................................................................................... 41
Modern Fuels Access ................................................................................44
Electricity .................................................................................................. 44 LPG ........................................................................................................... 47
Effects of Pricing on Fuel Consumption ...................................................47
Conclusion.................................................................................................52
4. ENERGY AND EQUITY: THE SOCIAL IMPACT OF ENERGY POLICIES...................................................................... 54
Introduction ...............................................................................................54
Energy Consumption, Expenditures, and Income Class ...........................55
The Price of Poor People’s Energy ...........................................................59
The Price of Cooking Energy .................................................................... 59 The Relationship Between the Delivered Price of Cooking Energy and Energy Expenditures. ........................................................................ 62
The Price of Lighting................................................................................. 63 Income Class and the Response to Energy Prices and Fuel Access..........65
Conclusion and Policy Implications..........................................................66
5. URBAN ENERGY TRANSITION AND THE ENVIRONMENT ............................................................................ 70
Introduction ...............................................................................................70
Periurban Forestation Patterns...................................................................71
Overview ................................................................................................... 71 Biomass Distribution around Cities........................................................... 73 City Income and Periurban Population Density ........................................ 74 Transportation Development ..................................................................... 76 Natural Variables....................................................................................... 77
The Potential Role of Urban Energy Consumption...................................80
Implications for Indoor Air Pollution Exposure Risk ...............................84
Conclusions and Policy Implications ........................................................86
6. THE ENERGY TRANSITION IN HYDERABAD, INDIA: A CASE STUDY.................................................................................. 88
vi
Introduction ...............................................................................................88
Energy Policies and Programs Affecting Urban Hyderabad.....................89
Kerosene Subsidies through Ration Card Program ................................... 89 LPG Distribution through Government-Affiliated Retailers ..................... 89 Electricity and the State Electricity Boards ............................................... 90 Fuelwood as Sole Market-Based Household Fuel..................................... 90
The Transition to Modern Fuels in Hyderabad .........................................91
Overall Patterns of Total Energy Use........................................................ 91 Changing Demand for Cooking Fuel......................................................... 93 Near-Universal Electricity Coverage in Hyderabad City .......................... 98
A Shift from Coal to Fuelwood in the Commercial Sector .......................98
Energy Use and Energy Expenditures.......................................................99
Energy Subsidies .......................................................................................103
Knowledge of Energy Subsidies ...............................................................105
Biomass Demand in Hyderabad and Catchment Area ..............................106
Fuelwood Demand in Hyderabad .............................................................. 106 Combined Rural and Urban Demand for Fuelwood.................................. 108 Geographic Distribution of Fuelwood Supply........................................... 109 Changes to Forest and Wooded Areas in the Hyderabad Hinterlands....... 110
Conclusion.................................................................................................112
7. TOWARD MORE EFFECTIVE URBAN ENERGY POLICIES ........................................................................................ ERROR! BOOKMA
Introduction ...............................................................................................Error! Bookmark not
What Factors Drive the Transition? ..........................................................Error! Bookmark not
Income ....................................................................................................... Error! Bookmark not dPricing ....................................................................................................... Error! Bookmark not dAccess........................................................................................................ Error! Bookmark not d
Transition and the Environment ................................................................Error! Bookmark not
Implications for Poverty Policy.................................................................Error! Bookmark not
Do the Poor Pay More for Energy Services?............................................. Error! Bookmark not dWhat Kinds of Policy Interventions Work? .............................................. Error! Bookmark not d
The Government Role ...............................................................................Error! Bookmark not
Interfuel Substitution ................................................................................. Error! Bookmark not dPrice Incentives ......................................................................................... Error! Bookmark not d

vii
Managing Wood Resources....................................................................... Error! Bookmark not dPromoting Energy Efficiency .................................................................... Error! Bookmark not d
Conclusion.................................................................................................Error! Bookmark not
ANNEX: METHODS AND DATA ......................................................... ERROR! BOOKMAINTRODUCTION.....................................................................................Error! Bookmark not
URBAN ENERGY CONSUMPTION......................................................Error! Bookmark not
Sample and Data........................................................................................ Error! Bookmark not dVariables.................................................................................................... Error! Bookmark not d
PERIURBAN BIOMASS..........................................................................Error! Bookmark not
Variable Construction................................................................................ Error! Bookmark not dBIOMASS SOURCES BY COUNTRY.................................................... Error! Bookmark not d
BIBLIOGRAPHY...................................................................................... ERROR! BOOKMA

viii
TABLES
Table 1.1 Countries and Cities in the Study 14 Table 2.1 City Size and Energy Use in 45 Cities, 1988 17 Table 2.2 Relationship between Fuel Policy, Energy Pricing, and Fuel Consumption in 12 Countries 22 Table 2.3 Classification of Cities by Stage in the Energy Transition 25 Table 3.1 Fuel Choice and Total Energy Use by Size of Household 32 Table 3.2 Relationship between Income and Energy Use in Urban Areas of 12 Developing Countries 42 Table 3.3 Electricity Access and Fuel Use in 45 Cities 38 Table 3.4 Electricity Rates and Connection Policies in Main Urban Areas of 12 Countries 39 Table 4.1 Countries in Which the Poor Pay More for Energy than the Wealthy 60 Table 4.2 Countries in Which Poor People Pay the Same Prices as the Wealthy 61 Table 4.3 Price of Lighting by Energy Type and Income Class in 45 Urban Areas 64 Table 5.1 Characteristics of the Sample Countries and Regions 72 Table 5.2 Variable Values in Periurban Zones 74 Table 5.3 Rank Order of Cities by Aggregate Biomass Consumption 82 Table 6.1 Average Monthly Household Input and Useful Cooking Energy Consumption, by Fuel Type, Hyderabad, 1982 & 1994 94 Table 6.2 Stove and Connection/Bottle Costs for Cooking Fuels, Hyderabad, 1994 96 Table 6.3 Fuel Use Reported by Households for Three Years Prort to 1994 Survey, Hyderabad 97 Table 6.4 Changes in Sectoral Demand for Fuelwood, Hyderabad, 1982 & 1994 98 Table 6.5 Monthly Household Expenditures on Energy, by Income Class, Hyderabad, 1994 101 Table 6.6 Comparative Prices Paid for Household Energy, by Income Class, Hyderabad, 1994 103 Table 6.7 Per Household Energy Subsidies, by Income Class, Hyderabad, 1994 104 Table 6.8 Aggregate Household Energy Subsidies, by Income Class, Hyderabad, 1994 105 Table 6.9 Consumers’ Knowledge of Energy Subsidies, Hyderabad, 1994 106 Table 6.10 Estimates of Sectoral Demand for Fuelwood, Hyderabad, 1982 & 1994 106 Table 6.11 Estimated Rural and Urban Demand for Wood, Hyderabad Catchment Area, 1982 & 1994 109 Table 6.12 Estimated Population, Hyderabad and Vicinity, Selected Years, 1894-1994 (millions) 111 Table 6.13 Land Use Changes within a 50-kilometer Radius of Hyderabad, Selected Years, 1928-94 112

ix
Table 7.1 Stages of the Energy Transition and Possible Policy Intervention Strategies Error! Bookmark not defined.

x
FIGURES
Figure 2.1 Conceptual Framework for the Urban Energy Transition 26 Figure 2.2 Impact of Availability of Wood on Use of Wood and Charcoal 29 Figure 2.3 Energy Use and Government Policy 31 Figure 2.4 Fuel Consumption Share, Ordered by Energy Transition Stage 36 Figure 3.1 Income Class and Quantity of Fuels Consumed in 45 Cities 43 Figure 3.2 Electricity Use by Income in 45 Developing-Country Cities 44 Figure 3.3 Electricity Access and Fuel Choice 46 Figure 3.4 Use of Wood Declines and that of Charcoal Increases as Wood Prices Increase 48 Figure 3.5 Energy Prices in Haiti, 1970–90 49 Figure 3.6 Relationship of LPG Prices with Use of Five Fuels 50 Figure 3.7 Energy Price, Income Class, and Electricity Use 52 Figure 4.1 Household Energy Consumption in 45 Cities 56 Figure 4.2 Average Household Expenditures on Six Fuels in 45 Cities 57 Figure 4.3 Household Energy Expenditures by Income Decile in 45 Cities, 1988 58 Figure 4.4 Percentages of Household Income Spent on Five Fuels, by Income Decile, 1988 58 Figure 4.5 Weighted Energy Price and Percentage Expenditures 62 Figure 5.1 Biomass Distribution Around Sarabaya, Indonesia 73 Figure 5.2 Standing Biomass around Cagayan de Oro and Manila, Philippines 76 Figure 5.3 Biomass Supply around Bandung and Surabaya, Indonesia 78 Figure 5.4 Standing Biomass around Mutare, Zimbabwe 79 Figure 5.5 Biomass around La Paz and Oruro, Bolivia 80 Figure 6.1 Fuel Sources for Household Energy Use, Hyderabad, 1994 91 Figure 6.2 Fuel Sources for Household Energy Use by Income Decile, Hyderabad, 1994 93 Figure 6.3 Useful Energy Price of Cooking Fuels, Hyderabad, 1981-94 95 Figure 6.4 Changes in Household Choice of Cooking Fuels, Hyderabad, 1982 & 1994 97 Figure 6.5. Energy Expenses for Average Household, by type of Energy, Hyderabad, 1994 100 Figure 6.6 Household Energy Expenditures by Income Class, Hyderabad, 1994 102 Figure 6.7 Demand for Fuelwood by Sector, Hyderabad, 1982 & 1994 107

1. URBAN HOUSEHOLD ENERGY, POVERTY, AND THE ENVIRONMENT
Introduction
In the early post-war period, the words “developing country” evoked images of rural villages and small-scale agriculture. The dramatic growth of urban populations in the period since have added scenes of crowded city streets filled with motor scooters, trucks carrying goods and fuels, and vendors cooking food. By 1980, about 900 million people lived in urban areas in the developing world; today, there are more than 2 billion urban dwellers. Rural population growth rates have leveled off in many developing countries, while annual urban growth rates now average over 3.3 percent. In some cities, urban growth rates have reached levels of 7 to 8 percent per year (World Bank, 1998). The topic of this book is the relationship between urban growth in developing countries and the decisions of urban households to select and consume different kinds and amounts of residential energy. In the earliest stages of a city’s development, urban dwellers largely consume biomass-based “traditional” fuels. As cities develop and modernize, the pattern of residential fuel consumption shifts, often to a succession of transition fuels, such as kerosene or coal, and ultimately to the so called “modern fuels” -- LPG and electricity. This book assesses the factors that shape this “urban energy transition”, documenting the way in which energy markets in the urban areas evolve throughout the developing world. The study also considers the equity, health, and environmental impacts of urban energy transitions. Critical to our assessment will be the role public policy plays in the welfare of residential energy consumers, and the evolution of urban energy markets. Why undertake a study of urban energy transitions in the developing world? There are several normative justifications. Third world governments often invest heavily in infrastructure in the modern fuels sector, and also frequently implement demand-side policies that affect energy pricing and consumer access. Extensive government involvement in third world energy markets inherently raises policy issues.
There are also equity issues associated with urban energy transitions. Lower
income residents rely to a larger extent on traditional fuels than higher-income consumers, and are disproportionately burdened by the costs, both pecuniary and non-monetary, of residential energy utilization. This segment of the population is most vulnerable to policy changes instituted in energy markets. For these reasons, it is important to assess the distributional burdens associated with urban energy transitions, and to consider the intended effects and possible unintended side effects of policies implemented in residential energy markets (Estache et. al., 2001).

12
Finally there are externalities associated with urban energy markets. The harvest and utilization of biomass-based fuels can accelerate deforestation and its associated environmental side effects (Wallmo and Jacobson 1998), and the asset value of biomass stocks is not always reflected in harvest decisions when property rights are not well defined, leading to excess extraction (Hartwick 1992). The health consequences of particulates and other emissions from the combustion of traditional fuels is also receiving increasing study in the literature (Kammen 2001, Smith et. al. 1993; Smith et. al., 2000; Smith, 2002; Smith and Mehta, 2003). Of particular concern is the exposure risk for women and children, the segment of the population that spends the largest amount of time around cooking fires.
Because of these policy concerns, an extensive body of research has developed on the subject of urban energy transitions. It is fair to say, however, that there is not a consensus in the field on many important issues. For example, different conclusions have been reached about the factors that drive interfuel substitution, and the income switch points at which consumers transition to higher grade fuels. There is also debate in the literature about the impact of energy prices on low income consumers, and the efficacy of different policies for encouraging inter-fuel substitution. Part of the reason behind this lack of consensus is the fact that conclusions in the literature have generally arisen from extrapolating the results from individual studies of single cities, or a few cities (for example, Adegbulugbe and Akinbami (1995); Alam et. al., (1985); Barnes (1990); Bowonder et. al., (1987a.), Chauvin (1981); Dewees (1995); Foley (1987); Hymen (1985); Leach (1987); ,Martino et. al., (1991) Masera et. al. (2000); Reddy and Reddy (1984); Tibesar and White (1990.1 This body of work has established a substantial knowledge base about local conditions in study regions, but has yet to develop a coherent view of urban energy transitions as they occur throughout the developing world. The contribution of this book is to provide a coherent view of urban energy transitions and the associated policy options for intervening in urban energy markets. Our study is based on an integrative analysis of the results of a research program conducted under the auspices of the Energy Sector Management Assistance Programme (ESMAP) of the World Bank over the period 1984-1999. (Reported in World Bank 1988, 1989, 1990a, 1990b, 1990c, 1990d, 1991a, 1991b, 1992, 1993, 1996a, 1999.) This program financed household energy studies based on interviews with more than 25,000 households in 45 cities as a part of surveys in 12 countries spanning 3 continents. The compilation, standardization, and analysis of this information produced a rich data set for comparative analysis. The ESMAP program originally was formed as to deal with the aftereffects of the rise in petroleum prices in the early 1980s. The original program financed national
1 An exception is a classic study that conducted a cross-country comparison of conditions and trends in South Asia (Leach 1986, 1987), offering comparative insight about urban energy transitions in that region. An insightful cross-city approach is also offered by Sathaye and Tyler, (1991).

13
energy assessments in many developing countries. As the assessment work progressed, it was realized that household and biomass energy was the predominant fuel in many developing countries, even though in the majority of the literature on energy it was ignored. This was the case for both rural and urban areas, but due to the varying household energy policies in urban areas, the program began to finance household energy strategies for developing countries, to complement the more general work at the country level. As a consequence, ESMAP began to focus on issues involving the efficient use of biomass fuels, local forest resource management around cities, the rural urban biomass market chain, urban interfuel substitution, and other policy issues as they related to urban energy. This study in a sense is in part a summary of the valuable insights gained during that fertile period of energy research for developing counties.
A significant part of the study was to estimate periurban forest stocks around a subsample of 34 cities. In many countries, adequate inventory of standing biomass has never been completed. Consequently, we developed a general methodology for estimating periurban forest stocks from secondary source information, and used the methodology to generate a standardized data set. Computerized mapping software was used to digitize site-specific vegetation patterns and to generate biomass density mappings. This resource inventory allowed us to connect the conditions in local energy markets to periurban resource regimes, and to derive comparative information across our sample on the impact of urbanization on the periurban environment.
We also generated information on selected variables that can affect the availability
of biomass fuels, stand degradation, and deforestation around urban areas. These variables included road infrastructure, topography, and precipitation. In addition to the comparative analysis that forms the largest part of this book, we included a detailed analysis of a World Bank/ESMAP sponsored household energy survey of a particular city -- Hyderabad India. Results are compared with those of a study of the same city conducted during the period of 1981-82 (Alam, Dunkerley, Gopi, and Ramsay, 1985). This longitudinal perspective allows the documentation of the evolution of urban energy choice, fuel consumption, and periurban forest resources over a 10 year period, providing a complementary perspective to the comparative study in other parts of the book. In summary, the broadly-based, synthetic assessment in this book offers a clearer and more comprehensive picture of urban market evolution than now exists in existing literature. It is our hope that this perspective will be helpful for guiding future research on urban energy transitions, and policy formulation in urban energy markets.
Overview of Cities and Regions in the Study
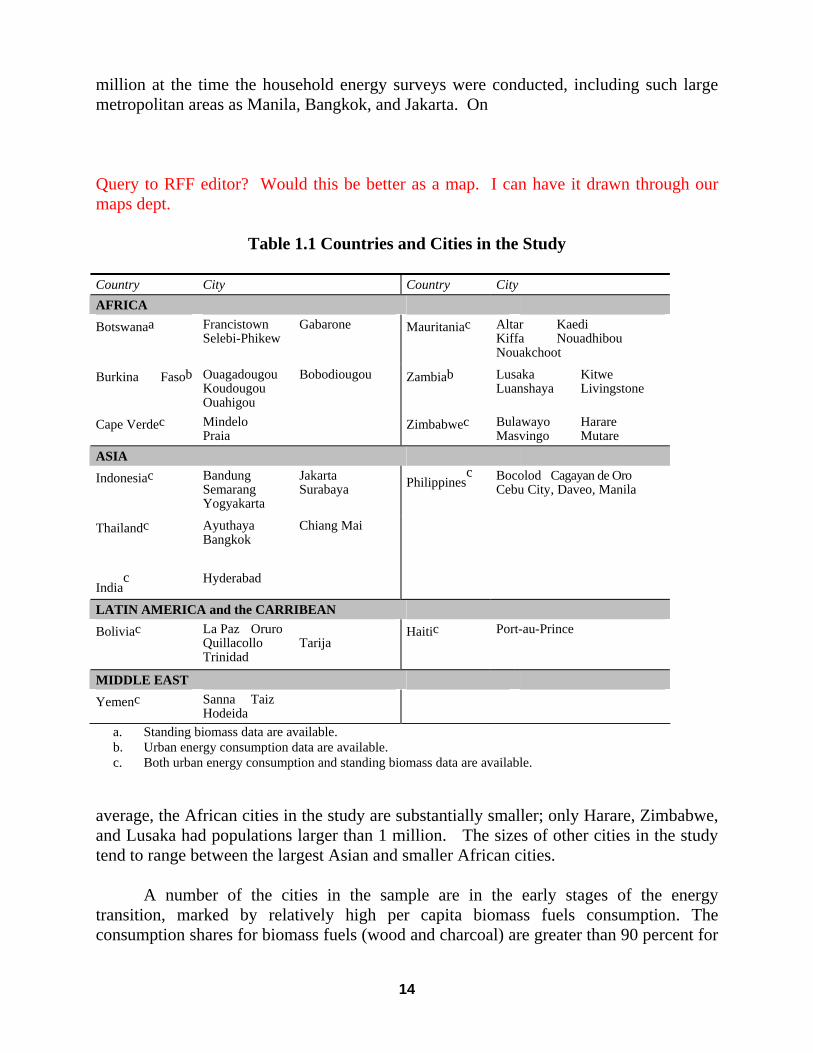
The cities included in our study are widely distributed in Latin America and the Caribbean, Africa, and Asia (Table 1.1). They vary significantly on a number of dimensions. Nearly half the Asian cities in the study had populations greater than one
14
million at the time the household energy surveys were conducted, including such large metropolitan areas as Manila, Bangkok, and Jakarta. On Query to RFF editor? Would this be better as a map. I can have it drawn through our maps dept.
Table 1.1 Countries and Cities in the Study Country City Country City AFRICA Botswanaa
Francistown Gabarone Selebi-Phikew
Mauritaniac
Altar Kaedi Kiffa Nouadhibou Nouakchoot
Burkina Fasob
Ouagadougou Bobodiougou Koudougou Ouahigou
Zambiab
Lusaka Kitwe Luanshaya Livingstone
Cape Verdec Mindelo Praia
Zimbabwec Bulawayo Harare Masvingo Mutare
ASIA Indonesiac
Bandung Jakarta Semarang Surabaya Yogyakarta
Philippinesc
Bocolod Cagayan de Oro Cebu City , Daveo, Manila
Thailandc
Indiac
Ayuthaya Chiang Mai Bangkok Hyderabad
LATIN AMERICA and the CARRIBEAN
Boliviac
La Paz Oruro Quillacollo Tarija Trinidad
Haitic Port-au-Prince
MIDDLE EAST
Yemenc Sanna Taiz Hodeida
a. Standing biomass data are available. b. Urban energy consumption data are available. c. Both urban energy consumption and standing biomass data are available.
average, the African cities in the study are substantially smaller; only Harare, Zimbabwe, and Lusaka had populations larger than 1 million. The sizes of other cities in the study tend to range between the largest Asian and smaller African cities. A number of the cities in the sample are in the early stages of the energy transition, marked by relatively high per capita biomass fuels consumption. The consumption shares for biomass fuels (wood and charcoal) are greater than 90 percent for

15
all the cities in Burkina Faso, for example, while, at the other extreme, modern fuels provide more than 75 percent of the energy needs in several larger Asian and Latin American cities (e.g., Bangkok, Thailand, and La Paz and Oruro, Bolivia). Agroclimate and biogeographical conditions also vary widely across the sample. For the most part, the southeast Asian cities lie in moist, humid tropical regions, with mean annual precipitation levels ranging upward to close to 2,000 mm. The virgin closed-canopy forests of Southeast Asia are among the densest in the world, ranging up to 345 m3/ha. In contrast, cities in two of the African countries in the study, Botswana and Mauritania, are located in semi-arid and arid regions (the Kalahari desert lies in southern and western Botswana); precipitation levels in Mauritania, the driest area in the study, range from only 35 to 500 mm per year. Precipitation levels of cities in Zimbabwe fall between the dryer Asian cities such as Chiang Mai, Thailand, and the African cities in northeastern Botswana. Open montane woodland and dry bush savannah in Zimbabwe have biomass densities ranging in the neighborhood of 62 m3/ha and 33 m3/ha, respectively. Precipitation levels, and natural biomass densities, in Haiti and Latin America fall within the levels encountered in Africa and Asia. Topographical differences are also significant among the study regions. The terrain in Africa is relatively flat; few areas in the study have average slopes greater than 8 percent. In contrast, the regions around the Southeast Asian cities in the study are far more mountainous, with substantial tracts having slopes greater than 8 percent. Topography is also varied in Bolivia: two of the Bolivian cities, La Paz and Oruro, are located in the Andes.
This sample of cities encompasses a sufficiently wide range of variation in populations, energy transition stage, biogeography, and policies to enable generalization about the common factors underlying the evolution of urban fuel markets, as well as to study the distinctive features arising in different contexts.
Topics of Study
The transition from traditional to modern fuels is important for urban people because of the potential to improve the quality of energy service, to lower indoor air pollution, and to stem deforestation pressures in periurban environments. The main topics for investigation in this book are the socioeconomic and policy factors that shape urban energy transitions, and the associated effects on equity, human health, and the environment. Urban Energy Transitions It is important to understand the factors influencing the relationship between urbanization, fuel choice, and energy consumption in developing countries to provide the
16
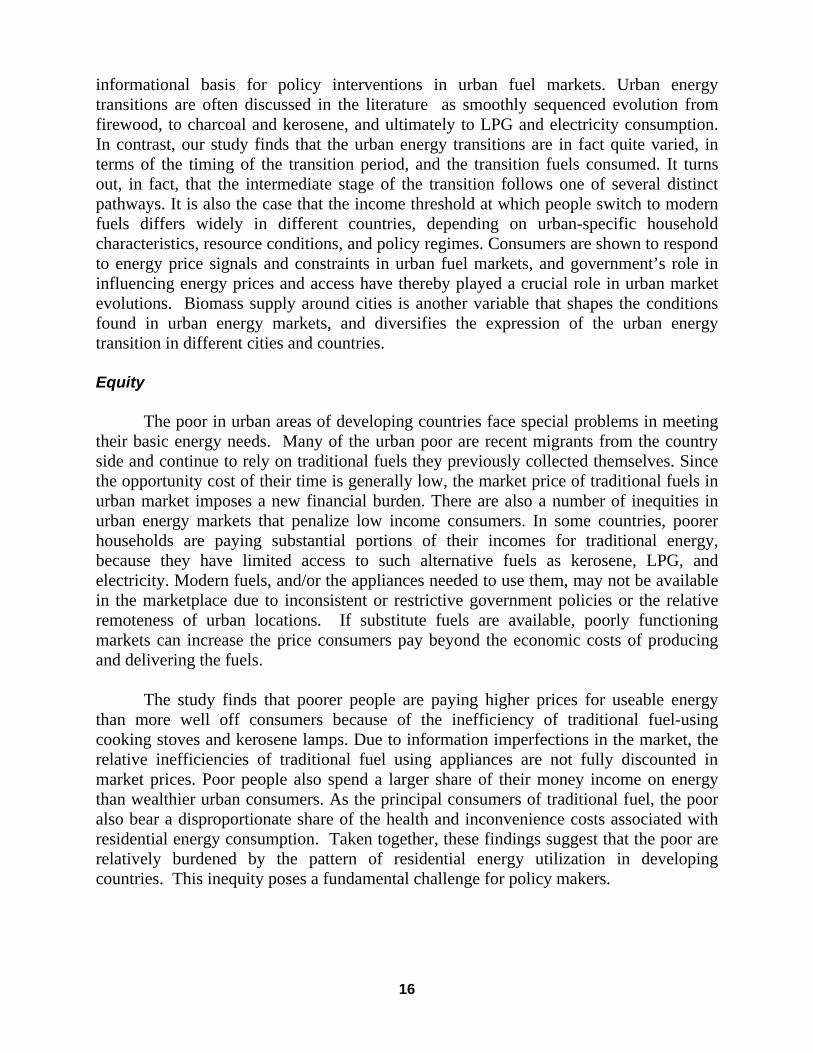
informational basis for policy interventions in urban fuel markets. Urban energy transitions are often discussed in the literature as smoothly sequenced evolution from firewood, to charcoal and kerosene, and ultimately to LPG and electricity consumption. In contrast, our study finds that the urban energy transitions are in fact quite varied, in terms of the timing of the transition period, and the transition fuels consumed. It turns out, in fact, that the intermediate stage of the transition follows one of several distinct pathways. It is also the case that the income threshold at which people switch to modern fuels differs widely in different countries, depending on urban-specific household characteristics, resource conditions, and policy regimes. Consumers are shown to respond to energy price signals and constraints in urban fuel markets, and government’s role in influencing energy prices and access have thereby played a crucial role in urban market evolutions. Biomass supply around cities is another variable that shapes the conditions found in urban energy markets, and diversifies the expression of the urban energy transition in different cities and countries. Equity The poor in urban areas of developing countries face special problems in meeting their basic energy needs. Many of the urban poor are recent migrants from the country side and continue to rely on traditional fuels they previously collected themselves. Since the opportunity cost of their time is generally low, the market price of traditional fuels in urban market imposes a new financial burden. There are also a number of inequities in urban energy markets that penalize low income consumers. In some countries, poorer households are paying substantial portions of their incomes for traditional energy, because they have limited access to such alternative fuels as kerosene, LPG, and electricity. Modern fuels, and/or the appliances needed to use them, may not be available in the marketplace due to inconsistent or restrictive government policies or the relative remoteness of urban locations. If substitute fuels are available, poorly functioning markets can increase the price consumers pay beyond the economic costs of producing and delivering the fuels. The study finds that poorer people are paying higher prices for useable energy than more well off consumers because of the inefficiency of traditional fuel-using cooking stoves and kerosene lamps. Due to information imperfections in the market, the relative inefficiencies of traditional fuel using appliances are not fully discounted in market prices. Poor people also spend a larger share of their money income on energy than wealthier urban consumers. As the principal consumers of traditional fuel, the poor also bear a disproportionate share of the health and inconvenience costs associated with residential energy consumption. Taken together, these findings suggest that the poor are relatively burdened by the pattern of residential energy utilization in developing countries. This inequity poses a fundamental challenge for policy makers.

17
Environmental and Health Effects The impact of urban energy transitions on human health and the environment is an important issue. To borrow from the recent Kuznets curve literature (Panayotou, 2001), “technology” and “scale effects” are among the critical factors that should affect the health and environmental result of urban economic expansion. A transition to modern fuels has the potential to reduce health and environmental effects through the first of these channels; specifically, fuel switching to LPG and electricity should reduce pressure on periurban biomass stocks, while reducing indoor air pollution associated with emissions from traditional fuels burning. On the other hand, the expansion of urban areas has the possibility to increase the scale of aggregate demand for biomass fuel, and total exposure risks to indoor air pollution, even if a significant portion of the population switches to more modern fuels. In that case, urban development would exacerbate environmental and health problems for a longer period of time, until more or less total market penetration of modern fuels. The transition time from biomass to modern fuels is thus an important variable ultimately affecting health and environmental effects. The consumption mix of different fuel types during the transition period will also affect the severity of the health and environmental effects urban residents will experience during the urban market transition. Our study finds that periurban deforestation is associated with urban growth in conjunction with the expansion of transportation infrastructure, and interactions with topographical and climatologic factors. Significantly, the per capita consumption of biomass fuels persist at a relatively high level until the advanced stages of the energy transition, and the aggregate consumption of biomass fuels does not necessarily decline with income growth. With total biomass energy consumption continuing at a high level as cities develop, the demand pressures on surrounding forested land will continue even after cities have reached the later stages of the modern fuels transition. And health effects from indoor air pollution will continue – particularly for low income people. In sum, none of the cities in our study have reached the developmental stage encountered in developed countries in which urban energy consumption is disassociated from impacts on periurban forests and the health effects of traditional fuel burning. The tipping point for this particular environmental Kuznets curve is beyond the highest income level in our sample. However, we do find that policies can influencing the timing and duration of the energy transition, as well as the compositional mix of fuels consumed during the transition period. Thus, policy makers have considerable scope for affecting the health and environmental impact of energy market evolution.
Definitions and Terminology
There are a number of terminological distinctions employed throughout the book that are usefully clarified at the outset. The term “modern fuel” is used to denote either LPG or electricity. The terms “woodfuel” and “fuelwood” are used interchangeably to

18
refer to unprocessed firewood, and can be distinguished from charcoal – a unique fuel on a number of grounds. Although charcoal is often used as a basic cooking fuel at the earlier stages of the energy transition, it can also serve as a transitional fuel in the intermediate consumption stage between woodfuels and modern fuels. In fact, charcoal is sometimes used in the latest stages of the energy transition as a specialty fuel for grilling. In that context, charcoal plays the role of a substitute for modern fuel. In view of the ambiguous definitional status of charcoal, the approach in the book is to semantically differentiate between charcoal and woodfuel when the distinction is relevant, while lumping these fuels together under the rubric “traditional fuels”, “biomass-based fuels”, or “biomass fuels” when referring specifically to traditional patterns of energy utilization at the earliest stage of the energy transition. Coal and kerosene, in contrast, are denoted as “transitional fuels” throughout the book, since their role as intermediaries in the evolution from traditional to modern fuels consumption is fairly evident. A conceptual distinction is often made in the book between the choice to use a particular fuel, on the one hand, and its consumption level, on the other. The distinction is particularly relevant for the modern fuels, LPG and electricity, whose utilization requires an initial capital outlay (in the form of the purchase of bottles, modern stoves, and/or the payment of hookup fees). In this case, the initial choice to use the fuel and the subsequent decision to consume a particular amount constitute distinct decisions in a two-stage consumer choice process. However, for the traditional fuels, which involve lesser degrees of initial capital outlay, the fuel choice and consumption decisions are conceptually more conflated. In the traditional market setting in which households use woodfuel or charcoal, the distinction between choice and consumption probably reaches close to the absolute convergence implied in the standard microeconomics theory of price-rationed commodity demand. Throughout the study the choice to use a fuel is measured as the percentage of households who consume the given fuel type, while the level of fuel consumption is measured in standardized quantity units of kilograms oil equivalent per month (KgOE). We explicitly note when this standardized unit is further adjusted to reflect the efficiency of fuel-using appliances, thereby giving the energetic measure in units of useful delivered energy. This is the actual heat used in the process of heating and cooking food. The choice to use a fuel can be further distinguished from “fuel access”. Modern fuel markets in many urban areas in the developing world are access rationed – for example, only certain customer classes may have access to electrical hookups. Access to a fuel is obviously a necessary, but not sufficient, condition for choosing to consume the fuel. Consequently, “fuel access” is conceptually distinguished from “fuel choice” in this study, and measured by specifically-constructed index variables. The distinction between access, choice, and fuel consumption are sometimes blurred in the book when not particularly relevant – for example, we have referred generically in this chapter to the “urban energy transition” without making this distinction until now. In that case, the reader can assume that we are implicitly referring to all

19
measures, e.g., an energy transition that features greater access to modern fuels; greater market share, in terms of the fraction of consumers choosing to consume modern fuels, and to an increasing level of modern fuels consumption. The distinction is sharpened when it becomes particularly relevant; specifically, in the analysis of household consumption behavior in Chapter 3. The term “fuel-switching” definitionally refers to the choice to use a new fuel, but the degree of fuel switching is gauged in the study both as the fraction of customer base choosing to consume particular fuels, and to the associated consumption levels. Finally, the term “prices” or “market prices” in the book refer to the market prices of the different fuels normalized to reflect different purchasing power parities and energy content. Specifically, the standard price unit is 1988 dollars per kilogram oil equivalent $/KgOE. In some cases, we will find it useful to compute relative prices. The local price of kerosene is used as the numeraire in these cases because it is available in all countries and is a transition fuel between the traditional biomass fuels and the modern fuels. Income and expenditure measures are also in 1988 dollars and reflect the standard methodology for normalization used at the World Bank.
Methodology Caveat
The data in our study are derived from a “bottoms-up” compilation and standardization of primary source household energy survey data collected over a number of years, as well as from secondary source information yielding estimates of periurban biomass inventory. As we have suggested, this data base represents a substantially more comprehensive informational foundation than found in the existing literature. Notwithstanding, our data set has a lower information content than a complete panel data set would have. But panel data on the variables of interest are not available, since governments do not maintain standardized statistical data bases on household energy consumption, indoor air pollution, and periurban resource characteristics. Due to the type of information we have, our study perforce relied on less formal methods than the standard statistical analysis of panel data. We compared means and evaluated partial correlations, and drew qualitative inferences and deductions based on our own professional experience. Since the conclusions of this book are not formally tested, they must be regarded as best available estimates given the state of information and the authors’ judgment. Obviously under these circumstances, our study does not provide the last word on the big subject of urban energy transitions. The contribution of this book should itself be regarded as a transitional stage in the state of research on urban market evolution.
Today attention is just now turning to the inclusion of energy issues in the large multisector surveys now taking place in developing countries. These surveys include the World Bank’s living standard measurement surveys and the USAID funded demographic and health surveys. In the coming years these new sources of information may be able to
20
provide a better foundation for a more formal statistical analysis of the patterns and trends that have emerged from the research conducted in this study.
Conclusion
Our study will show that few societies have traversed a regular and consistent path from traditional fuel consumption to the use of electricity and other modern fuels. A variety of transitional consumption pathways are followed, and markets evolve more or less rapidly and directly towards modern fuels. The complexity and diversity of the transition process, combined with the piecemeal, case approach to its study, has given rise to many viewpoints in the literature with respect to the important determinants and permutations. In our view, the incompleteness of this picture has complicated the task of policy formulation in urban energy markets. The goal of this book is to broaden and deepen the informational foundation of the field, in the hopes of helping policy makers to improve the design of strategies that can assist consumers to use energy more efficiently and equitably, and to reduce the health and environmental side effects of urban energy transitions.
The following chapters of this book examine distinct features of the urban energy
transition. Chapter 2 provides an overview of urban energy transitions. This chapter develops a conceptual model for urban market evolution, and examines empirical evidence for the relationship between the size of cities and energy market development. Evidence is also considered for the relationship between resource characteristics around cities and fuel consumption profiles, as well as the effects of policy on urban energy markets in different cities and countries. A taxonomy of different kinds of energy transitions is developed.
Household energy consumption behavior in urban energy markets is examined in
detail in Chapter 3. Key attributes are shown to be household characteristics, including size and family income, as well as energy price signals and access restrictions. In combination, the study shows that household characteristics and incentives and constraints, in the form of price signals and access restrictions, determine residential fuel choice and consumption in urban markets. This information is important for understanding the way policy can affect consumer behavior and urban energy transitions.
The equity implications of urban energy policies and their implications for market
evolution are detailed in Chapter 4. The analysis is based on a dissagregation of fuel choices, consumption patterns, and energy expenditures by 10 income classes. The price of energy to lower income residents is assessed, as well as the responsiveness of different income classes to market signals and policy. The policy implications of inequitable residential fuel choice and consumption patterns are considered.
The environmental and human health implications of urban energy transitions are
examined in Chapter 5. This includes a unique analysis of the impact of urbanization on

21
land use patterns surrounding urban centers.2 The aggregate level of traditional fuels consumption is computed for each of the cities in the sample. The implications of aggregate consumption patterns on periruban environments and human health are assessed.
There is a detailed analysis of a specific household energy survey conducted in
Hyderabad India, and the results are presented in Chapter 6. This case study assesses the topics studied in Chapters 2-5 within the context of a single urban area and, by comparison to an earlier study of the same city, provides a longitudinal picture of urban energy consumption patterns and resource conditions over a 10 year period.
Finally, the conclusion of the book provides a summary of the results and a
discussion of policy implications. The chapter identifies particular policy issues and solutions tailored to each stage of the urban energy transition. Although there are many issues to consider in formulating policy in urban energy markets, a general suggestion that emerges from the study is to use flexible policy approaches that maximize consumer choice. This strategy appears to be the best means to encourage economic efficiency and equity in urban energy markets, and to minimize the health and environmental side-effects of urban energy transitions.
2 An annex at the end of the book describes the data sources and estimation methodology for determining the spatial distribution of biomass resources in the periurban regions studied.

22
2. THE URBAN ENERGY TRANSITION Introduction Markets for goods and services are relatively underdeveloped in the earliest stages of a city’s evolution, and institutional arrangements are relatively informal. As cities expand and modernized, the scale of economic activity increases and urban institutions become more complex. Paralleling this transition is an evolutionary pattern for consumer fuel choice and home energy consumption. As cities grow beyond their earliest developmental stage and ultimately modernize, households generally shift away from the use of traditional biomass fuels and end up consuming LPG and electricity. The transition from traditional to modern fuels has often been conceptualized in the literature as a relatively straightforward, 3-stage process. In stage 1, woodfuel is the predominant energy source. The second stage is marked by local deforestation, decreasing wood availability, and the emergence of markets for such “transition” fuels as charcoal and kerosene (see Hosier and Kipondya, 1993; Boberg, 1993; Malawi, 1984; Milukas, 1986), Finally, the third stage is characterized by developed markets, rising incomes, and large-scale fuel switching to LPG and electricity (Leach 1993). The purpose of this chapter is to provide a conceptual overview of the urban energy transition process, and to present some data trends in our sample that shed light on the general features, as well as particular variations, in energy choice and consumption behavior that emerge as cities develop and modernize. We then use factor analysis to classifying cities in the study according to their energy market profiles. This classification shows that the cities in the study have not undergone a smoothly sequenced transition from firewood, to charcoal and kerosene, and then to LPG and electricity consumption. Particularly in the middle stages of the transition, more diverse fuel choices and consumption patterns are evident. These can be identified as distinctive sub-stages in the transition process. The possibility of distinctive transitional patterns has policy implications with respect to consumer welfare, equity, and health and environmental effects of urban energy transitions.
Conceptual Framework
Urbanization is not simply an increase in population density but also a process of fundamental transformation in the organization of human behavior. Part of the influence of urbanization—both in the sense of migration to cities and the growth of the cities themselves—is the loss of rural habits and traditional behavior patterns, and the acquisition of new domains of information and infrastructure. The relationship between urbanization, fuel choice, and household energy consumption is a dynamic process involving a complex set of feedbacks. This complexity

23
gives rise to the possibility of a variety of transitional pathways in urbanizing energy markets. Figure 2.1 provides a conceptual model for this process; it distills and synthesizes the pathways discussed in the literature and in the authors previous work (Barnes, 1990; Barnes and Qian 1992; Bowonder, 1987b, DeWees, 1989; Hosier and Kipondya 1993; Millington and coauthors, 1990; Taun and Lefevre, 1996). In the prototypical case, wood is extensively available around cities in their earliest stages. Woodfuel harvest and production is a labor-intensive process, and the opportunity cost of labor time is generally low. Consequently, traditional fuels can be supplied relatively economically. Woodfuel stock is also readily available at this stage as a side-effect of agricultural land conversion (Barnes and Qian 1992). In contrast, modern fuels will usually be hard to obtain and/or costly, because the urban area is not large enough, or wealthy enough, or close enough to the main distribution lines to attract commercial energy suppliers. The price of woodfuel at this stage may range from very low to relatively high – the latter due to seasonal scarcity, or lack of access to modern fuel alternatives, among other factors. Regardless, the relative price of woodfuel is lower than the backstop price of modern fuel.3 Consequently, urban residents typically consume woodfuel to exclusion of other fuels at the beginning stages of a city’s development. Even so, the consumption of biomass fuels will vary across cities at this developmental stage, depending on patterns of land use surrounding the city, levels of rainfall, the rate of stock regrowth, and other environmental factors. Moreover, policy interventions may also influence the relative economies of traditional fuels versus modern alternatives, e.g., the presence or absence of rural electrification programs. The incentive to consume biomass fuels will be moderated by a number of feedback relationships as urban areas expand. Over time, land clearing for agroconversion and the forest cutting for biomass fuels (and other forest-derived products) will decrease natural biomass stocks, reducing the volume and accessibility of natural biomass within the urban perimeter (Barnes, 1990). Transportation infrastructure and rural population densities in the vicinity of growing cities will also be expanding, increasing pressure on the periurban resource base. This evolution may be moderated by reforestation projects, market-driven reforestation activities if tenure regimes are secure, and natural stock regrowth if climates are favorable (Dewees, 1989). In general, however, biomass resources in the vicinity of cities will be diminishing as urbanization proceeds, increasing the harvest and transport costs of woodfuel in particular. The modern fuels sector will also be growing as urban areas expand, due to economies of scale in infrastructure development and fuel distribution which makes bottled LPG distribution and the expansion of electricity grids more economical (Leach 1993). Urban growth also increases tax revenues and the scale and sophistication of financial institutions. Among other consequences, “financial deepening” will augment
3 This conclusion may not hold in some urban areas where modern fuels are available, but quantity rationed. This issue is discussed in more detail in Chapter 4.

24
the financial resources available for large capital projects, such as power generation (Darrat 1999). As urban areas develop, biomass supplies are depleted in a larger radius around the city, and the relative price of wood fuels may increase due to increased scarcity, as well as to rising transit costs. Modern fuels will become more available and affordable through well-established distribution networks. Rising incomes and the relative availability, affordability, and superiority of modern fuels encourages a consumption shift away from traditional fuels. Indeed, competitive price pressures from a modernizing fuel sector may ultimately lower the market price of urban energy, including resource-constrained traditional fuels, if fuel markets are freely functioning, e.g., do not face government-imposed access or quantity constraints. How rising incomes are distributed is one of the several factors injecting variation into the pattern of urban energy evolution. Rising but inequitably distributed income can lead the wealthiest class in society to rapidly transition to modern fuels while the lower classes remain dependent on traditional fuels. Rising but more equitably distributed income is likely to yield a more broadly-based and less abrupt transition. Under these conditions, a substantial middle-class is likely to serve as a demand source for a combination of fuelwood, charcoal, and kerosene for a more prolonged period of time. Depending on fuel availability and household income, some of these households may also be using LPG and electricity. On the other hand, stagnating incomes will slow the transition, inducing urban residents to continue to use wood or charcoal, prolonging demands on periurban resources. The rate of urbanization is another factor that can affect the evolutionary development of urban energy markets (Hosier and Dowd, 1988). Rapid urbanization initially increases the total urban demand for biomass fuels, because rural people who migrate to cities tend to maintain their traditional habits, purchasing biomass cooking fuels from vendors who harvest fuelwood from surrounding woodlands (Allen and Barnes, 1985). However, by causing rapid deforestation around cities in the early stages, this pattern may actually accelerate the transition time between the period of traditional fuels consumption and the use of modern fuels. Rapid urbanization may feed a compensatory demand surge for commercial fuels including kerosene, LPG, and electricity at the later stages. This surge sometimes outruns the supply capacities of the local LPG or power companies when these fuels are quantity rationed, resulting in fuel shortages. For cities with inequitable income distribution and rapidly growing populations, the transition to modern fuels may be prolonged for the lower income classes. On the other hand, even in remote cities at the earliest stages of the transition, the highest income families are likely to have some access to modern fuels, such as trucked-in petroleum products, and the equipment, such as generators and appliances, to use these products. This class may remain largely uninfluenced by the availability or price of local

25
biomass supplies, leaving poorer households dependent on the biomass resources surrounding the city Governmental policy is another factor influencing the evolution of urban energy markets. The implementation of pricing policies, quantity rationing, or import controls can alter the pacing and expression of the urban energy transition. Kerosene subsidies can encourage more rapid fuel-switching from wood and/or induce consumers to continue kerosene consumption for an extended time period, while kerosene taxes can have the dichotomous effect of delaying the energy transition for low income consumers, but accelerating the switch time at which higher-income people choose LPG or electricity. Government policies also influence the market penetration of modern fuels in larger cities through access and/or quantity constraints. (See Chapters 4 and 6).

26
Figure 2.1 Conceptual Framework for the Urban Energy Transition
A g r o - c l i m a t e
P o l i c y B i o m a s s F u e l S u p p i e s
U rb a n I n c o m e
O t h e r C o n v e r s i o n
A c t i v i t i e s
+ +
R u r a l P o p u l a t i o n
?
+
-
?
B i o m a s s S t o c k
+ ?
-
+ ?
- +
? ? + ? -
+
+
+
?
+ +
P o l i c y
? +
+ - - +
- +
T r a n s p o r t a t i o n D e v e l o p m e n t
M o d e r n F u e l D e m a n d
M o d e r n F u e l S u p p l y
C r o s s - P r i c e E ffe c t
C r o s s - P r i c e E ffe c t
M o d e r n F u e l Q u a n t i t y
M o d e r n F u e l P r i c e
B i o m a s s F u e l
M a r k e t
B i o m a s s F u e l P r i c e
B i o m a s s F u e l
D e m a n d

27
Data Trends
We now consider some results that suggest the way in which the cities in our study have reflected the urban energy transition. As expected, the data show that the percentage of consumers who use traditional fuels decline and the percentage choosing modern fuels rises moving from the smallest town to the largest cities in the study (See Table 2.1). Per capita consumption trends parallel the fuel choice trends. However, the data suggest that the trends are not linear. Traditional fuels utilization does not decrease in cities whose populations have not yet reached 1 million. Before this point, many location-specific factors, including environmental conditions and government policy, diversify fuel choices and consumption patterns (discussed below). Beyond this population level, urban residents in cities fuel switch extensively from biomass to modern fuels, and to some extent charcoal. In the million-plus cities in the study—including Manila, La Paz, Bangkok, and four cities in Indonesia—households choose to use charcoal infrequently, and almost no fuelwood for cooking.
Table 2.1 City Size and Energy Use in 45 Cities, 1988
Population Monthly income Fuel
City type ('000) (US$/cap) Firewood Charcoal Kerosene LPG Electric
Energy consumption (KgOE per capita per month) Town 33.89 38.19 3.82 3.33 0.21 1.70 1.41Small city 102.54 41.38 2.19 2.15 0.62 2.12 1.59Middle city 526.98 35.74 3.41 3.08 1.40 0.60 1.27Large city 3,718.13 55.82 0.24 1.24 3.35 1.68 2.82
Energy choice (percentage) Town 33.89 38.19 52.50 40.00 33.60 46.50 64.10Small city 102.54 41.38 25.10 36.10 37.20 60.40 78.40Middle city 526.98 35.74 47.90 53.30 64.50 23.00 69.50Large city 3,718.13 55.82 4.30 28.00 61.30 37.30 95.40
Biomass resources around cities are an important source of variation in the sample. “Biomass resources” are proxied by an index that reflects the volume of woodfuel stock as well as its distribution density and proximity to cities. The index is developed in a straightforward way from the distance variables and the standing biomass stock data analyzed in Chapter 5.4 4 Fuelwood harvest and distribution costs should be inversely related to the level of standing biomass stock and its proximity to urban consumer markets. This supply-side linkage suggests that, holding the demand side of the market and other factors constant, households should have a relatively large incentive to consume biomass fuels if they live in proximity to abundant biomass resources.

28
The data shows that both the percentage of consumers who choose woodfuel for cooking and the level of woodfuel consumption continuously decline with diminishing biomass resources (See Figure 2.2). In periurban areas in which wood stocks are abundant, per capita consumption ranges between 5 and 6 KgOE per month, dropping to less than 2 KGOE per month is areas of relative scarcity. Charcoal is also widely used in urban areas with plentiful wood resources, although the number is slightly lower than for woodfuel users. However, the percentage of people using charcoal diminishes at a relatively low rate as wood resources become scarcer. The per capita consumption of charcoal actually increases in regions with adequate resources and stays close to constant as resources become scarce (See Figure 2.2). As a result, charcoal consumption dominates fuelwood consumption in urban areas with only adequate or scarce biomass resources. The relative difference in these fuel consumption trends can be explained by two factors. First, charcoal, as the lighter weight fuel, can be economically trucked for longer distances than woodfuel. Hence, charcoal imports from more distant regions can economically replace locally-produced sources as local biomass resources are depleted. Secondly, charcoal is a superior fuel. The demand for charcoal for specialty cooking continues even at the latter stages of the energy transition. As mentioned, government policies can play an important role in urban energy transitions. The data show that both subsidies and taxes are correlated with the extent to which fuels are used in the cities in our study. For example, coal subsidies in China are associated with high consumption levels(left panel of Figure 2.3). Highly-subsidized coal in china is in fact the lowest-priced fuel for all of the developing countries in the study. However, coal consumption there is not just due to the subsidy. It also reflects the fact that the government also distributes subsidized coal for heating. Thus, coal is a ubiquitous and familiar fuel source to Chinese consumers.

29
Figure 2.2 Impact of Availability of Wood on Use of Wood and Charcoal
Availability of wood around city
Percentage of wood /charcoal users
0
10
20
30
40
50
60
ScarceAdequatePlentiful0
1
2
3
4
5
6
Energy use in kgoe perperson per month
Wood users
Charcoal users
Wood energy use
Charcoal energy use
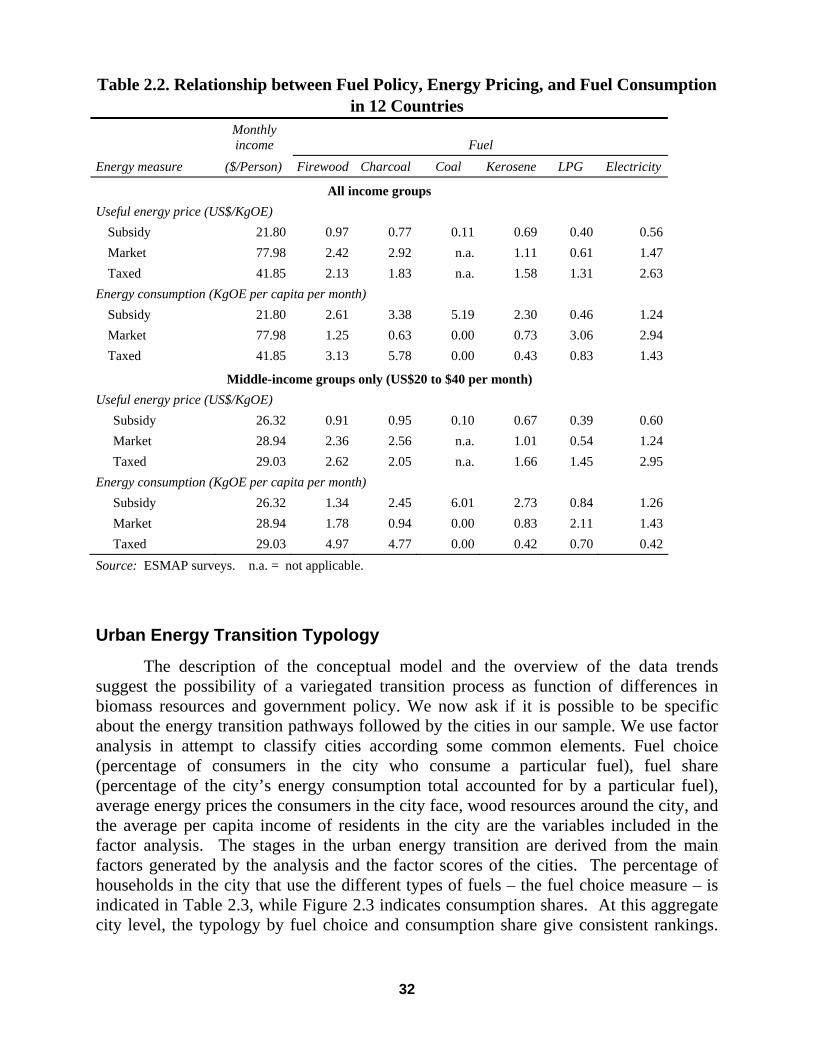
In Indonesia, government policy subsidized kerosene to assist poor households and to prevent deforestation, leading most people to use kerosene for cooking. This consumption pattern is unique among the 12 countries in the study. Fuel subsidies also affect the prices of alternative fuels. As the data in Table 2.2 indicate, the prices of fuel alternatives in countries that subsidize a major fuel are lower than in the other countries in the study Taxation is correlated with a lower usage of the taxed fuels and increased usage of substitutes. Taxes on imported petroleum in Haiti, Mauritania, and Burkina Faso (right panel Figure 2.3) have pushed consumers in these countries to utilize wood or charcoal. In fact, Burkina Faso’s LPG price is the highest in the study, at $1.20/KgOE --about four times the international price. Urban consumers in the country also have the highest per-capita consumption of wood of any in the study. Certainly such tax regimes, as well as
30
foreign exchange constraints on imported petroleum products, contribute to this heavy reliance on traditional fuels in these countries. Cities in countries with more laisser-faire market-based pricing regimes evince a more mixed pattern of fuel consumption than in countries in which energy markets are skewed by government intervention (center panel of Figure 2.3). A notable case is Cape Verde, a small African island nation in which urban households use relatively high proportions of electricity, LPG, and kerosene. The general pattern of mixed fuel use in market-oriented economies holds true across countries, demonstrated by the energy consumption figures for the middle-income groups in countries with free-market oriented policies (Table 2.2). In addition to incentive-based policies such as taxes and subsidies that influence consumer behavior through effects on energy prices, governments also directly influence fuel choice and consumption through access rationing. Access rationing of electricity is quite common in a number of countries in the study. In Mauritania and Burkina Faso, for example, access to electricity is restricted to higher income urban residents. Access rationing has an immediate effect on the excluded customer class, thereby raising equity issues, and also affects the functioning of energy markets. The effects of access rationing on energy choice and equity in the cities in our sample is further discussed in Chapters 3, 4, and 6.

31
Figure 2.3 Energy Use and Government Policy
Energy use (kgoe/person/month)
0.00
5.00
10.00
15.00
20.00
25.00
Zambia
China
Indonesia
Bolivia
Yemen
Philippines
Thailand
Cape Verde
Haiti
Mauritania
Burkina Faso
Wood Charcoal Coal Kerosene LPG Electricity
Major subsidy Market pricing Tax on modern fuel
Coal subsidized
Kerosene subsidized
Taxes on petroleum products
Policy regime
Source: ESMAP Surveys
32
Table 2.2. Relationship between Fuel Policy, Energy Pricing, and Fuel Consumption in 12 Countries
Monthly income
Fuel
Energy measure ($/Person) Firewood Charcoal Coal Kerosene LPG Electricity
All income groups Useful energy price (US$/KgOE)
Subsidy 21.80 0.97 0.77 0.11 0.69 0.40 0.56Market 77.98 2.42 2.92 n.a. 1.11 0.61 1.47Taxed 41.85 2.13 1.83 n.a. 1.58 1.31 2.63
Energy consumption (KgOE per capita per month) Subsidy 21.80 2.61 3.38 5.19 2.30 0.46 1.24Market 77.98 1.25 0.63 0.00 0.73 3.06 2.94Taxed 41.85 3.13 5.78 0.00 0.43 0.83 1.43
Middle-income groups only (US$20 to $40 per month) Useful energy price (US$/KgOE)
Subsidy 26.32 0.91 0.95 0.10 0.67 0.39 0.60Market 28.94 2.36 2.56 n.a. 1.01 0.54 1.24Taxed 29.03 2.62 2.05 n.a. 1.66 1.45 2.95
Energy consumption (KgOE per capita per month) Subsidy 26.32 1.34 2.45 6.01 2.73 0.84 1.26Market 28.94 1.78 0.94 0.00 0.83 2.11 1.43Taxed 29.03 4.97 4.77 0.00 0.42 0.70 0.42
Source: ESMAP surveys. n.a. = not applicable.
Urban Energy Transition Typology
The description of the conceptual model and the overview of the data trends suggest the possibility of a variegated transition process as function of differences in biomass resources and government policy. We now ask if it is possible to be specific about the energy transition pathways followed by the cities in our sample. We use factor analysis in attempt to classify cities according some common elements. Fuel choice (percentage of consumers in the city who consume a particular fuel), fuel share (percentage of the city’s energy consumption total accounted for by a particular fuel), average energy prices the consumers in the city face, wood resources around the city, and the average per capita income of residents in the city are the variables included in the factor analysis. The stages in the urban energy transition are derived from the main factors generated by the analysis and the factor scores of the cities. The percentage of households in the city that use the different types of fuels – the fuel choice measure – is indicated in Table 2.3, while Figure 2.3 indicates consumption shares. At this aggregate city level, the typology by fuel choice and consumption share give consistent rankings.

33
The data illustrate the variations in the transition pattern and, in particular, the distinct groupings into which the second stage of the transition can be subdivided. Stage 1: High Woodfuel Utilization The first group of cities in the study can be characterized by their extensive use of wood as a cooking fuel (Table 2.3). These cities are relatively underdeveloped economically, and woodfuel production and distribution cost are low due to some combination of low wage rates and substantial biomass resources around the cities. The remoteness of locations in many cases also reduces the cost-effectiveness of modern fuel imports. The relative price of traditional fuels varies substantially among these cities, depending on local resource conditions, policies, and availability of fuel imports. For example, the city of Xiushui, China is located in a mountain valley with extensive wood resources from nearby forests, and the price of wood fuel is relatively low (World Bank, 1996a). In contrast, the price of wood is quite high in Burkina Faso relative to other countries in the study, but fuel alternatives are also expensive -- due in part on petroleleum-based fuel. In this case, consumers in Koudougo, Ouahigouya, Bobo Dioulasso, and Ouagadougou still use relatively high-priced traditional fuels because the price of the taxed modern fuels is even more expensive. In Livingstone, Zambia, people use both wood and charcoal for cooking. Although wood is still available around the city perimeter, resource pressures, and a regulated charcoal prices, are inducing residents to switch to charcoal as a cooking fuel. Stage 2: Utilization of Transition Fuels Stage 2A Pattern: High Charcoal Use This substage involves the switch from fuelwood to charcoal. Urban dwellers in the cities in this substage face low relative charcoal prices for some combination of the following reasons: wood stocks are becoming scarce in the immediate vicinity of the urban area, raising the price of locally-provided woodfuel; relatively-low cost charcoal can be imported from outside the area, or taxes on modern fuel substitutes or government-controlled charcoal prices help reduce the relative price of charcoal. People shift to charcoal as their predominant fuel source because alternatives are relatively expensive.

34
Table 2.3 Classification of Cities by Stage in the Energy Transition (Percent of households consuming fuel types for cooking)
Income$/ Person/
City Size
Fire-wood
Char-coal
Coal
Kero-sene
LPG
Elec-tric
City Rank Month ‘000s % % % % % % Stage 1 1. Bobo Dioulasso, B.F. 30.42 247 94.4 18.5 0 1.0 4.5 0 2. Xiushui, China 9.32 40 95.0 5.0 55.0 27.0 21.0 0 3. Livingstone, Zambia 18.93 81 50.6 71.3 0 3.4 0 16.7 4 Koudougou, B.F. 22.40 55 94.2 18.8 0 0 1.4 0 5. Ouagadougou, B.F. 38.71 473 90.6 13.7 0 1.0 11.3 0 6. Ouahigouya, B.F. 29.74 41 100.0 2.2 0 0 0 0 7. Davao, Phil. 20.24 839 59.2 51.0 0 38.8 24.5 12.2 8. Cagayan, Phil. 27.45 312 86.1 25.0 0 44.4 19.4 11.1 Stage 2A 9. Kitwe, Zambia 27.72 360 40.2 79.9 0 8.7 0 41.4 10. Luanshya, Zambia 16.89 149 28.4 92.1 0 2.6 0 34.7 11. Kiffa, Mt. 20.21 20 57.5 89.7 0 0 3.4 0 12. Lusaka. Zambia 28.89 704 15.4 78.0 0 24.2 1.1 32.4 13. Kaedi, Mt. 15.77 12 93.7 68.4 0 0 8.9 0 14. Port au Prince, Haiti 65.08 1000 4.4 93.3 0 4.1 28.0 7.2 15. Atar, Mt. 33.57 35 30.9 52.7 0 0 27.3 0 16. Nouadhibou, Mt. 42.57 60 1.3 61.8 0 0 38.2 0 17. Nouakchott, Mt. 24.44 550 9.0 89.2 0 1.6 39.2 0 Stage 2B 18. Surakarta, Ind. 15.11 688 30.3 11.4 0 62.1 6.8 6.1 19. Yogyakarta, Ind. 27.88 645 24.4 13.6 0 69.9 2.8 4.5 20. Surabaya, Ind. 22.26 2226 2.5 0.3 0 92.7 3.8 8.9 21. Semarange, Ind. 17.12 1068 10.8 0 0 80.0 13.8 6.2 22. Bandung, Ind. 26.40 2308 2.8 0 0 93.5 7.4 4.6 23. Jianyang, China 16.08 50 32.0 1.0 97.0 5.0 1.0 0 24. Jakarta, Ind. 27.15 7976 2.9 0 0 91.5 10.5 5.9 25. Changshu, China 26.30 120 1.0 0 100.0 1 65.0 0 26. Kezuo, China 15.19 32 14.3 0 92.9 0 66.3 0 27. Huantai, China 22.67 55 1.0 0 85.9 0 97.0 0 Stage 2C 28. Bacolod, Phil. 37.12 360 42.4 55.9 0 23.5 20.6 0 29. Cebu City, Phil. 32.02 674 35.2 25.9 0 16.7 33.3 0 30. Hodeidah, Yemen 41.21 182 20.5 10.3 0 43.6 61.5 0 31. Harare, Zim. 37.21 718 9.4 0 NA 46.5 0 43.3 32. Trinidad, Bolivia. 76.93 49 21.5 0 0 4.1 78.8 1.2 33. Bulawayo, Zim 62.62 451 9.7 0 NA 15.3 0 75.0 34. Manila, Phil. 67.86 8150 7.0 22.0 0 32.0 61.3 24.4 Stage 3 35. Mindelo, C.V. 43.09 50 26.7 1.1 0 38.9 91.1 0 36. Tarija, Bol. 70.21 74 9.9 0.2 0 1.0 90.4 1.0 37. Praia. C.V. 65.46 59 25.0 10.5 0 16.9 97.6 4.8 38. Quillacollo, Bol. 59.11 36 21.8 0 0 0.4 92.4 1.1 39. Oruro, Bol. 42.67 190 3.9 0 0 13.8 95.0 3.7 40. La Paz, Bol. 78.37 1017 2.9 0 0 17.2 83.6 11.6 41. Tiaz, Yemen 48.47 161 30.0 6.7 0 10.0 96.7 0 42. Sanaa, Yemen 118.86 472 45.4 6.2 0 2.1 95.9 15.5 43. Ayutthaya, Thai. 84.45 40 9.4 45.5 0 0 82.1 76.4 44. Chiengmai, Thai. 102.09 150 17.5 64.0 0 0 69.2 73.0 45. Bangkok, Thai. 142.21 6000 1.6 24.5 0 0 89.6 81.6 Source: ESMAP Household Energy Studies. NA = not available in survey. Our sample of countries illustrates the range of government policies that can enter at this sub-stage. At the time of the household energy survey in question (World Bank,

35
1990b), the Zambian government controlled the price of charcoal, making charcoal relatively affordable in relation to other fuels. In contrast, modern fuels were taxed in Mauritania and Haiti. These taxes provided a disincentive even for higher income families in these countries, whose fuel demand was thereby displaced to charcoal. Charcoal prices were relatively high in these countries as a result of the policy-induced distortion, but still lower than the price of the modern fuels alternatives. Stage 2B Pattern: High Coal or Kerosene Use The second stage also features cities in which kerosene or coal serve as the dominant transition fuel. In these cities, subsidies on kerosene or coal largely displace charcoal from the transition mix. As previously mentioned, coal is abundant in China, and policy makers subsidize it to improve the quality of life of people living in cities. Thus, the use of wood and charcoal has been virtually eliminated from household use (Table 2.3). The city of Xiushui is the one exception to this rule – due to its unique location and available biomass resources. But as a general rule, people in China are using coal and kerosene for cooking and heating. As mentioned previously, the government in Indonesia subsidizes kerosene. The price of kerosene varies around a very low average of 14 cents per kilogram of oil equivalent (KgOE). The kerosene subsidies are large enough to appear to inhibit higher-middle-class families from switching to the modern fuels. Without this policy, it seems likely that the higher income families would be using LPG or electricity, and the poorer households would be using wood or charcoal.

36
Figure 2.4 Fuel Consumption Share, Ordered by Energy Transition Stage
0
20
40
60
80
100
1 4 7 9 12 15 20 23 26 28 31 34 36 39 42 45
Cities (numbering corresponds to Table 2.1)
% Energy use by city
Wood Charcoal Coal Kerosene LPG Electricity
Wood
Char-coal
Coal-Kerosene
Mix ofFuels
LPG-Electric
Source: ESMAP Household Energy Studies
Stage 2C Pattern: Diversified Transitional Fuel Use The cities in this stage are distinguishable by the use of a variety of fuels including LPG, electricity, charcoal, kerosene, and wood. A major reason is that fuel markets are largely undistorted by government interventions, allowing local economic conditions to diversify fuel consumption patterns. The cities in this stage are found in a variety of countries including Bolivia, Zimbabwe, Yemen, and the Philippines. In the city of Trinidad, Bolivia, for example, people use both wood and LPG for cooking. Trinidad has relatively higher incomes compared with other cities in the study, but is also relatively small and remote from main population centers, with abundant local wood resources. Hence, woodfuel is used as well as LPG. In Bulawayo, Zimbabwe, there is little wood around the city, and people use kerosene, coal or electricity for household use. Wealthier and some middle class people already have made the transition to LPG or electricity.

37
Stage 3: Transition to LPG and Electricity In the final stage of the energy transition, cities tend to be large and a relatively high proportion of urban residents have relatively high incomes. Both electricity and LPG are the dominant cooking fuels in these urban areas. This evolutionary stage is well accepted in the literature. The cities from this group in the study are from Thailand, Bolivia, and Cape Verde. Urban dwellers in Thailand, for example, have the highest per capita incomes in the study. Most people in Thai cities are cooking with LPG, but are also using electricity for many purposes. However, charcoal is still used for the preparation of traditional food. Likewise, in some of the smaller, but high income, cities in Bolivia, people have access to relatively cheap firewood and still use firewood in conjunction with LPG. The two countries of Cape Verde and Yemen are interesting because they have intermediate income levels, but predominantly use LPG and electricity. In Cape Verde, a small island country, limited local wood resources provide about 20 percent of people’s energy needs. The balance is accounted for by relatively affordable LPG imports. Yemeni cities have almost no wood resources. Hence, urban dwellers rely on bottled LPG or electricity.
Conclusion
The home energy needs of consumers are met by woodfuel during the earliest developmental stages of cities, but ultimately shift to LPG and electricity as cities grow and modernize. The evidence does not support the notion that this transition from wood to modern fuels follows a regular pattern. Instead, it appears that energy transitions take varying amounts of time, and feature different twists and turns along the way. The distribution of urban income, government polices, and the availability of wood resources are among the location-specific factors that appear to accelerate or delay urban energy transitions, as well as to determine the particular transition route that a city follows along the path to modern fuels utilization. . Although quite variable and complex, the evidence suggests that transitional fuel utilization pathways can be grouped into three distinct sub-stages. In one substage variation, charcoal is the dominant transition fuel. The relative price of charcoal is lower than other transitional fuels either due to local economic conditions or levied taxes on kerosene and LPG. In another variation, subsidies on coal or kerosene virtually eliminate the consumption of other fuels. Examples are found in Indonesia and China (Wang and Feng, 2001). Finally, there are a group of cities whose transition fuels are quite diversified, with wealthier households consuming LPG and electricity and poorer households consuming wood, charcoal, or kerosene. In these countries, relatively undistorted energy markets allow local economic conditions to differentiate a mix of cost-effective fuel options.

38
Government policy has played an important role in urban fuel utilization, especially in the middle stages of the energy transition. From a normative standpoint, this reality suggests that policy reforms themselves are likely to have a significant effect on residential fuel utilization. Policies instituted in energy markets may also have varying effects depending on the energy transition stage and market conditions in particular cities. These topics are discussed in later chapters.

39
3. HOUSEHOLD FUEL CHOICE AND CONSUMPTION
Introduction
The actions of urban residents operating in a particular market environment determine their pattern of residential fuel choice and energy utilization. As we have seen, the kind of market urban consumers confront is heavily influenced by local resource conditions and the actions and policies of governments. This chapter focuses in detail on the fuel choice and consumption decisions of urban energy consumers. The goal is to better understand why urban residents choose to consume the fuels they do, and how incentives influence their overall level of consumption. This information will help us better understand the way urban energy transitions unfold, and offer insight into the effects of energy policies implemented in urban markets. Several variables importantly influence the fuel choice and consumption decisions of urban residents. Household characteristics, including family size and income, are important determinants of consumer demand. In particular, recent migrants to urban areas tend to come in larger family units, and such families have a history of using traditional fuels. To some degree, this habit is retained in the new urban surroundings. This family size-related consumption characteristic has not been fully assessed in the literature on urban energy transitions. The income level of urban residents is another important household characteristic which influences the demand for urban fuel. Urban income is well recognized in the literature on urban energy transitions, although debate exists about the income point at which urban residents fuel switch to modern fuels. Price signals that consumers face in urban energy markets mediate the effects of the household characteristics that drive fuel demand. Moreover, the availability of modern fuels in urban markets is often access-constrained. Since policy influences both consumer prices and fuel access, these two channels offer crucial entry points into the market through which government policy influences fuel utilization. All together, this group of influences – household attributes, market prices, and constraints -- determine the fuel choice and consumption decisions of urban residents.

40
Impact of Household Characteristics on Fuel Use
Household Size Moving from a predominantly rural area to an urban area involves many changes for households. Large families are an economic asset in the countryside, since child labor can be used for woodfuel collection and labor-intensive agricultural production (Dasgupta, 1998). But large families become economically unsustainable in cities if family members cannot generate income in formal markets. While immigrants to urban areas initially retain rural traditions, including large families, the economic realities of urban life gradually reduce household sizes. Correspondingly, the demand for traditional fuels falls, both because of the rising time opportunity costs for urban residents working in formal markets, and because of the availability and economy of alternative energy sources (Cline-Cole, Main and Nichol, 1990; Chauvin, 1981). The data show that larger urban households tend to select traditional fuels to a great extent whereas smaller households tend to choose the more modern fuels (Table 3.1). Lack of time to start and maintain cooking fires is one reason that small families do not choose to cook much with traditional fuels. The choice is also correlated with income, inasmuch as large households in developing countries generally have relatively low per capita incomes and therefore low opportunity costs associated with the household labor time needed to utilize traditional fuels.
Table 3.1 Fuel Choice and Total Energy Use by Size of Household Fuel choice (percentage of households choosing) Total energy use
Average household size Wood Charcoal Kerosene LPG Electricity in KgOE/cap Two 18 28 40 30 80 23.13 Three 13 16 22 53 93 17.65 Four 20 27 34 53 92 14.49 Five 21 36 47 48 87 10.44 Six 34 55 52 31 77 10.41 Seven 46 54 62 27 53 10.55 Eight 45 65 67 40 50 8.85 Nine + 73 37 66 24 42 8.33
Source: ESMAP surveys.

41
Although larger households generally choose traditional (and often less efficient) fuels in greater proportions, they generally consume less total energy per household member than smaller households (see the rightmost column of Table 3.1). In part, this reflects the fact that smaller, generally higher-income households also tend to use energy for purposes other than cooking, such as for lighting and running appliances. But for most income levels in developing countries, cooking is the main end use for energy consumption and the amount of energy required to cook for a large household is not proportionately greater than for a small household. In either case, the level of energy consumption per household member will be smaller for larger families. This finding is consistent across the cities in the study, reflecting the importance of controlling for family size in any analysis of the urban energy transition. Income Urban income is one of the strongest influences on household energy choice. As incomes increase, there is a decline in the percentage of consumers who chose to consume traditional fuels, as well as the transitional fuel kerosene, and an increase in the percentage of consumers who consume LPG and electricity (See Table 3.2). The trends for coal are not clear, until the higher income class, reflecting the impact of the extensive distortion of that market in China (See Table 3.2). Although income is strongly related to the energy type chosen, it is not as related to the total quantity of energy used, until the higher income classes are reached. Total consumption for the 80% of the population with low or moderate incomes is quite comparable (See Table 3.2 and Figure 3.1). The explanation lies in the fact that households shift from lower-efficiency traditional fuels to higher-energy-value modern fuels as they move up the income latter. People with higher incomes obtain more useful energy from their fuels. Clearly, poverty does not conserve energy.

42
Table 3.2 Relationship Between Income and Energy Use in Urban Areas of 12 Developing Countries
Income class
Monthly income
(per capita) US$/cap. Firewood Charcoal Coal Kerosene LPG Electricity Total Fuel Choice (Percentage of Households)
Low 8.59 55.00 54.30 14.70 67.90 10.20 61.40 NA Mid-low 15.51 38.70 44.00 17.00 62.80 22.40 70.10 NA Middle 25.02 31.50 36.60 15.50 52.20 43.70 76.90 NA Mid-high 41.94 26.10 37.30 4.70 40.70 59.80 79.30 NA High 116.95 15.90 29.30 0.00 19.60 76.70 92.30 NA
Fuel Use (KgOE per capital per month) Low 8.59 3.63 3.28 2.38 1.33 0.15 0.60 11.59 Mid-low 15.51 2.57 2.66 3.21 1.73 0.42 0.82 11.59 Middle 25.02 2.10 2.20 2.83 1.50 1.25 1.15 11.15 Mid-high 41.94 2.62 2.54 0.67 1.14 2.09 1.77 10.82 High 116.95 1.66 1.79 0.00 0.60 3.70 4.15 11.62 Source: ESMAP surveys. Electricity and LPG consumption rise dramatically in the higher-income groups (See Table 3.2 and Figure 3.1). Electricity demand in particular continues to increase with income due to continuing purchases of additional appliances. Indeed, the quantities of electricity used increase proportionally with income (Figure 3.2). In the highest-income households, the amounts of modern fuels purchased and consumed is substantially greater than that consumed in lower-income households. The relative consumption shares for wood, charcoal, and even kerosene do not change dramatically with income for the 80 percent of the population with low to moderate incomes (See Figure 3.1). The amounts of energy consumed remains within a relatively narrow range until the higher income groups, despite the significant variation in the different types of fuels consumed in the first seven or eight income classes (See Table 3.2 and Figure 3.1). The persistence of traditional fuel consumption beyond the lower income levels is surprisingly common for the countries in this study, encompassing households in African countries such as Burkina Faso, Mauritania, and Zambia, and high-income households in Port au Prince, Haiti; Trinidad, Bolivia; Cagayan, Philippines; and even Chingmai, Thailand. The explanation may lie in non-income-related factors such as access to local wood supplies around cities, the use of charcoal as a specialty fuel for grilling (by between 30 and 50 percent of people in all income ranges), and distorted market access to modern fuels

43
It is also evident that poorer households use kerosene, and to a lesser extent, LPG. (Table 3.2 and Figure 3.1). As expected, LPG consumption rises with income, but the number of lower-income households that use LPG is still significant. It is apparent that LPG is highly valued as a cooking fuel by those who can obtain it.
Figure 3.1 Income Class and Quantity of Fuels Consumed in 45 Cities
Income class (decile)
Energy used (KgOE per person per month)
0
5
10
15
20
7 11 14 19 24 31 41 62 111 396
Wood Charcoal
Kerosene
Electricity
CoalLPG
(dollars per person per month)
Source: ESMAP Energy Surveys
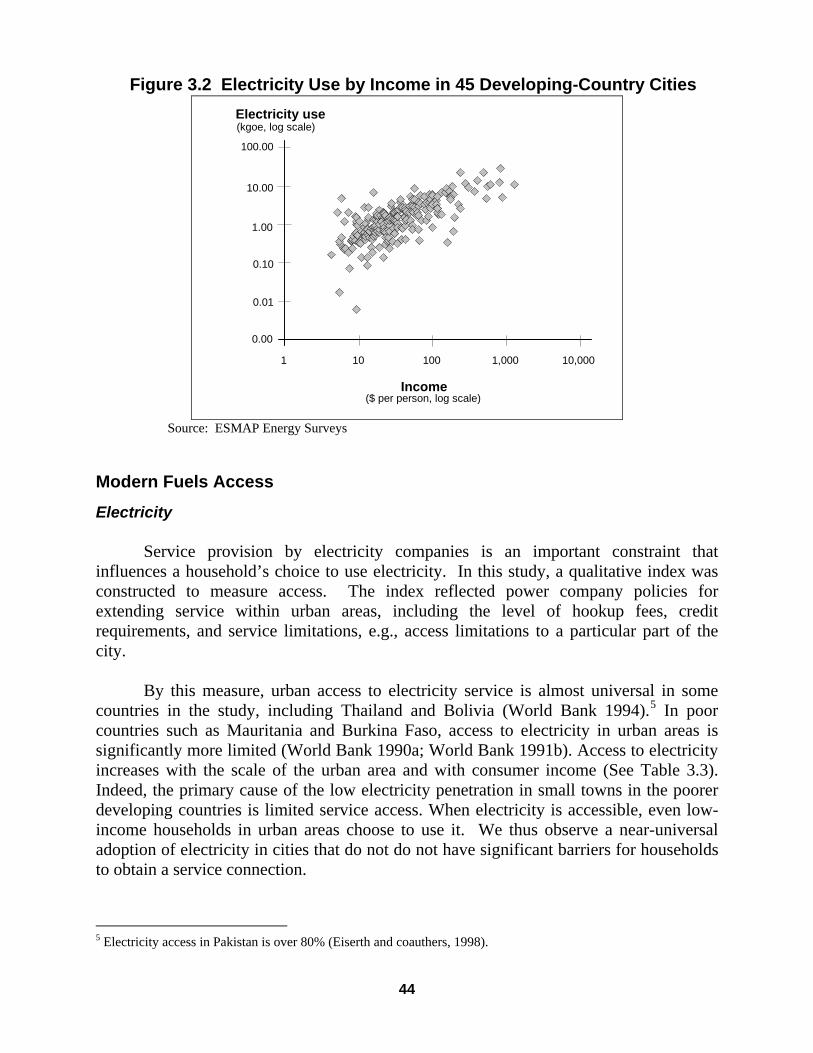
44
Figure 3.2 Electricity Use by Income in 45 Developing-Country Cities
Income
Electricity use
0.00
0.01
0.10
1.00
10.00
100.00
1 10 100 1,000 10,000
(kgoe, log scale)
($ per person, log scale)
Source: ESMAP Energy Surveys
Modern Fuels Access
Electricity Service provision by electricity companies is an important constraint that influences a household’s choice to use electricity. In this study, a qualitative index was constructed to measure access. The index reflected power company policies for extending service within urban areas, including the level of hookup fees, credit requirements, and service limitations, e.g., access limitations to a particular part of the city. By this measure, urban access to electricity service is almost universal in some countries in the study, including Thailand and Bolivia (World Bank 1994).5 In poor countries such as Mauritania and Burkina Faso, access to electricity in urban areas is significantly more limited (World Bank 1990a; World Bank 1991b). Access to electricity increases with the scale of the urban area and with consumer income (See Table 3.3). Indeed, the primary cause of the low electricity penetration in small towns in the poorer developing countries is limited service access. When electricity is accessible, even low-income households in urban areas choose to use it. We thus observe a near-universal adoption of electricity in cities that do not do not have significant barriers for households to obtain a service connection.
5 Electricity access in Pakistan is over 80% (Eiserth and coauthers, 1998).

45
Table 3.3 Electricity Access and Fuel Use in 45 Cities
Electricity access
Income ($/P/M)
City size (‘000)
Wood
Charcoal
Kerosene
LPG
Electric
Fuel choice (percentage) Very difficult 33 23 56.4 73.4 57.6 26.6 21.1Difficult 67 174 72.3 33.5 65.2 21.8 42.8Easy 62 514 24.1 62.7 50.4 21.6 47.7Very easy 77 1,153 22.1 34.5 42.6 47.8 90.5
Fuel use (KgOE per capita per month) Very difficult 33 23 1.31 10.09 0.35 1.49 0.24Difficult 67 174 7.27 2.54 0.46 0.91 1.24Easy 62 514 2.83 7.20 1.10 0.50 2.00Very easy 77 1,153 1.71 1.75 1.75 2.00 2.79Source: ESMAP surveys. Electricity access not only is associated with higher electricity use but also is negatively related to the use of traditional fuels (Figure 3.3). The availability of electricity in urban areas seems to act as a catalyst for people to switch from traditional to modern fuels. One possible explanation is that access proxies for market development. In that case, fewer barriers would constrain other modern fuels in cities where electricity is available. Another explanation would be that the availability of lighting and other appliances spurs people to a greater acceptance of modernity and modern fuels. Zambia and Yemen illustrate the importance of access to electricity adoption (see Table 3.4). In Zambia, electricity charges are among the lowest in Africa, at about 2¢/kWh, and yet only 53 percent of urban households are grid-connected. The main reason for the low adoption rates in Zambia is restricted access. An example at the opposite extreme is the remarkably widespread use of electricity in the urban areas of Yemen, a country with relatively high electricity prices. The average price of electricity in Yemen is about 15 cents per kilowatt-hour. Some 91 percent of urban households in Yemen use electricity. Obviously, price alone is not a significant deterrent to the adoption of electricity. The main factors are initial cost and service access.
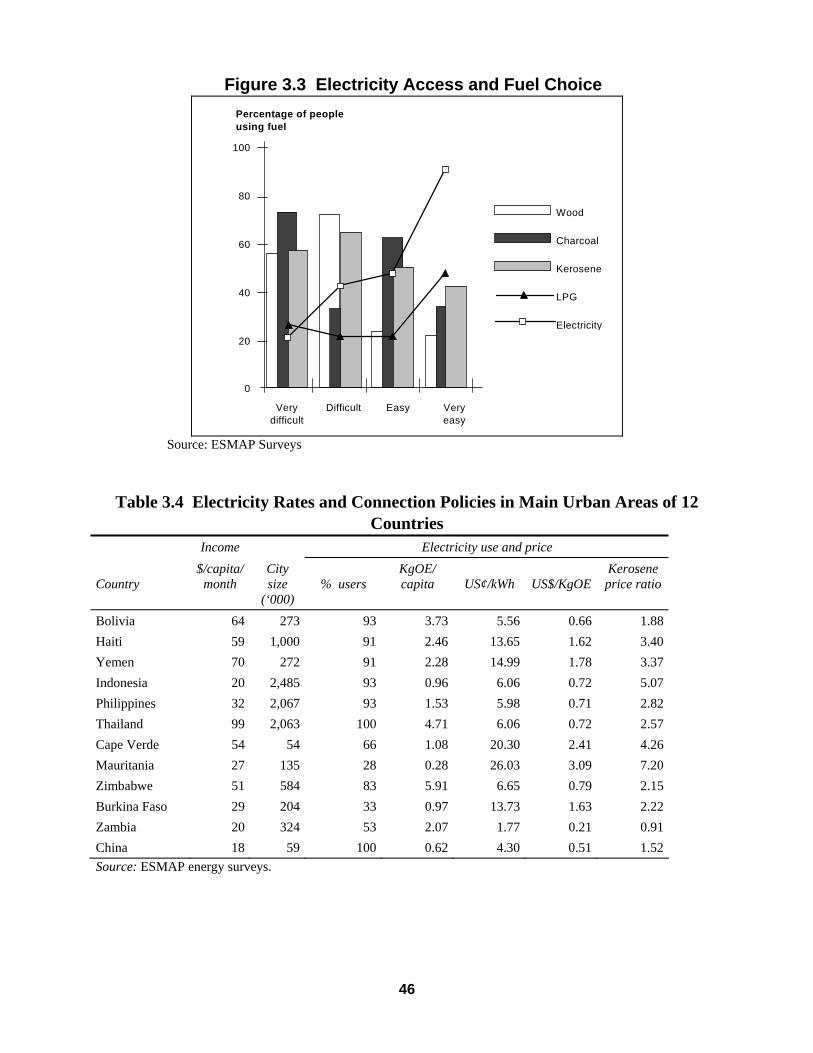
46
Figure 3.3 Electricity Access and Fuel Choice Percentage of peopleusing fuel
0
20
40
60
80
100
Verydifficult
Difficult Easy Veryeasy
Wood
Charcoal
Kerosene
LPG
Electricity
Source: ESMAP Surveys
Table 3.4 Electricity Rates and Connection Policies in Main Urban Areas of 12 Countries
Income Electricity use and price Country
$/capita/month
City size
(‘000)
% users
KgOE/ capita
US¢/kWh
US$/KgOE
Kerosene price ratio
Bolivia 64 273 93 3.73 5.56 0.66 1.88Haiti 59 1,000 91 2.46 13.65 1.62 3.40Yemen 70 272 91 2.28 14.99 1.78 3.37Indonesia 20 2,485 93 0.96 6.06 0.72 5.07Philippines 32 2,067 93 1.53 5.98 0.71 2.82Thailand 99 2,063 100 4.71 6.06 0.72 2.57Cape Verde 54 54 66 1.08 20.30 2.41 4.26Mauritania 27 135 28 0.28 26.03 3.09 7.20Zimbabwe 51 584 83 5.91 6.65 0.79 2.15Burkina Faso 29 204 33 0.97 13.73 1.63 2.22Zambia 20 324 53 2.07 1.77 0.21 0.91China 18 59 100 0.62 4.30 0.51 1.52Source: ESMAP energy surveys.
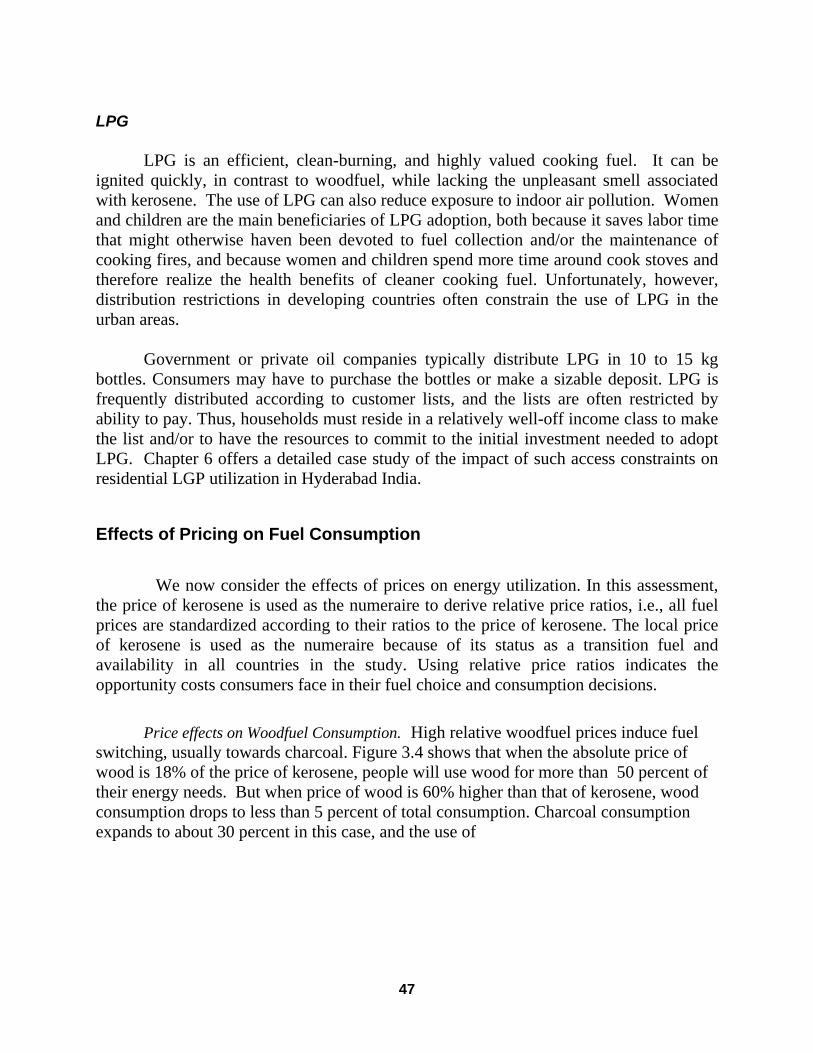
47
LPG LPG is an efficient, clean-burning, and highly valued cooking fuel. It can be ignited quickly, in contrast to woodfuel, while lacking the unpleasant smell associated with kerosene. The use of LPG can also reduce exposure to indoor air pollution. Women and children are the main beneficiaries of LPG adoption, both because it saves labor time that might otherwise haven been devoted to fuel collection and/or the maintenance of cooking fires, and because women and children spend more time around cook stoves and therefore realize the health benefits of cleaner cooking fuel. Unfortunately, however, distribution restrictions in developing countries often constrain the use of LPG in the urban areas. Government or private oil companies typically distribute LPG in 10 to 15 kg bottles. Consumers may have to purchase the bottles or make a sizable deposit. LPG is frequently distributed according to customer lists, and the lists are often restricted by ability to pay. Thus, households must reside in a relatively well-off income class to make the list and/or to have the resources to commit to the initial investment needed to adopt LPG. Chapter 6 offers a detailed case study of the impact of such access constraints on residential LGP utilization in Hyderabad India.
Effects of Pricing on Fuel Consumption
We now consider the effects of prices on energy utilization. In this assessment, the price of kerosene is used as the numeraire to derive relative price ratios, i.e., all fuel prices are standardized according to their ratios to the price of kerosene. The local price of kerosene is used as the numeraire because of its status as a transition fuel and availability in all countries in the study. Using relative price ratios indicates the opportunity costs consumers face in their fuel choice and consumption decisions. Price effects on Woodfuel Consumption. High relative woodfuel prices induce fuel switching, usually towards charcoal. Figure 3.4 shows that when the absolute price of wood is 18% of the price of kerosene, people will use wood for more than 50 percent of their energy needs. But when price of wood is 60% higher than that of kerosene, wood consumption drops to less than 5 percent of total consumption. Charcoal consumption expands to about 30 percent in this case, and the use of

48
Figure 3.4 Use of Wood Declines and that of Charcoal Increases as Wood
Prices Increase
Price ratio of wood to kerosene
0
20
40
60
80
100
.18 .28 .35 .53 .66 .74 .89 1.04 1.24 1.59
Wood Charcoal Kerosene LPG Electricity
Fuel’s percentage oftotal energy use share
Source: ESMAP Energy Surveys
kerosene expands to just under 20 percent.
Thailand provides a historical example of the impact of relative wood prices on energy use. In Bangkok, wood was relatively inexpensive in the early 1980s, mainly due to logging activity in the country. However, the government banned logging in 1989 in response to high deforestation rates, and the prices of wood and charcoal rose rapidly. In response, most people who cooked with wood in Bangkok switched to modern fuels, although they continued to use charcoal for preparing specialty dishes. Wood itself has all but disappeared as a cooking fuel in the major urban areas of Thailand. Price Effects on the Transition Fuels: Charcoal and Kerosene. The relationship between charcoal prices and fuel consumption is more complicated than often assumed. The first complexity is that fuelwood and charcoal prices are interrelated. Both depend on

49
local supplies of wood around urban areas, and these fuels are substitutable in consumption. The second complexity is that charcoal is also competitive with modern fuels in some end uses. Specifically, high-income households continue to use charcoal for specialty grilling after they have otherwise switched to modern fuels. As a consequence, the role of charcoal in the energy transition is twofold. First, it competes with wood as a cooking fuel in urban areas where wood has become distant from urban centers. As such, it acts as a transition fuel. Secondly, it competes with modern fuels in some end uses, i.e., specialized cooking. Rising relative charcoal prices are associated with declining charcoal use. When the price of charcoal is about 75 percent of the price of kerosene, people use it for about 50 percent of their energy needs. However, when it is twice the level of kerosene, people use it for about only 10 to 15 percent of their energy needs and turn to wood, kerosene, LPG, or electricity. This finding is consistent with the theory that wood scarcity near urban areas—accompanied by rising prices—is part of the cause for fuel switching from wood to charcoal. And that consumers will switch to kerosene and LPG once charcoal prices rise to the price level of those fuels. The diversity of energy transitions discussed in the previous chapter may reflect such relative price movements, particularly among transition fuels such as charcoal and kerosene. Haiti is one of the few countries for which a time-series data on charcoal prices are available for a particular period. Forest cover in Haiti dramatically declined during the 1970s as a consequence of demand pressures associated with high population growth rates. By 1978 the total forest cover had shrunk to only 6.7 percent of land area (see Stevenson 1989; Lewis and Coffey 1985). During this period, the real price of charcoal in Port au Prince rose at an average annual compounded rate of just over 6 percent per year. In about 1988 the price of charcoal caught up with the backstop prices of LPG and kerosene. The prices of the three fuels were fairly competitive in the study period following (Figure 3.5). Although few poor people in Haiti use LPG or kerosene, mainly because of poor access to such fuels, the price of charcoal has risen along with other commercial fuels. This is both a consequence of the resource pressures noted, but also because taxes on kerosene and LPG have displaced some demand to charcoal (World Bank, 1991a).
Figure 3.5 Energy Prices in Haiti, 1970–90
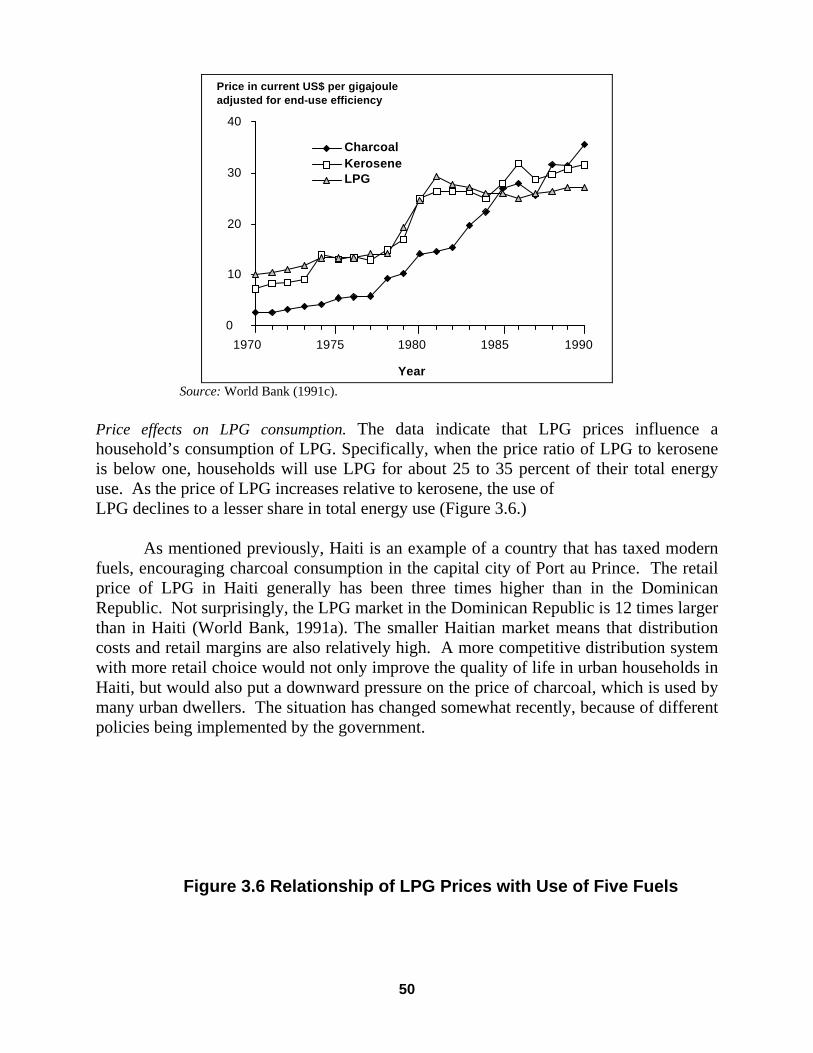
50
0
10
20
30
40
1970 1975 1980 1985 1990
CharcoalKeroseneLPG
Year
Price in current US$ per gigajouleadjusted for end-use efficiency
Source: World Bank (1991c).
Price effects on LPG consumption. The data indicate that LPG prices influence a household’s consumption of LPG. Specifically, when the price ratio of LPG to kerosene is below one, households will use LPG for about 25 to 35 percent of their total energy use. As the price of LPG increases relative to kerosene, the use of LPG declines to a lesser share in total energy use (Figure 3.6.) As mentioned previously, Haiti is an example of a country that has taxed modern fuels, encouraging charcoal consumption in the capital city of Port au Prince. The retail price of LPG in Haiti generally has been three times higher than in the Dominican Republic. Not surprisingly, the LPG market in the Dominican Republic is 12 times larger than in Haiti (World Bank, 1991a). The smaller Haitian market means that distribution costs and retail margins are also relatively high. A more competitive distribution system with more retail choice would not only improve the quality of life in urban households in Haiti, but would also put a downward pressure on the price of charcoal, which is used by many urban dwellers. The situation has changed somewhat recently, because of different policies being implemented by the government.
Figure 3.6 Relationship of LPG Prices with Use of Five Fuels

51
Price ratio of LPG to kerosene
Percentage share of energy use
0
20
40
60
80
100
0.48 0.72 0.95 1.17 1.27 1.39 1.53 1.69 2.05 2.28
LPG Kerosene Charcoal Electricity Wood
Source: ESMAP energy surveys.
Price Effects on Electricity Consumption. The pattern of electricity consumption in developing countries is quite different than for LPG. Electric service is generally available in urban areas and used by most consumers, except for those living in poorer, more remote towns. The provision of electricity is typically viewed as a public service. In addition, urban consumers generally use electricity first for lighting, for which there is no other technology providing the same service quality. The almost universal adoption of electricity in urban areas by residents who that have access can be explained by the high value placed on electric lighting. The reason for this qualitative leap in energy services is the relative efficiency of electric lamps. An electric light bulb hangs from the ceiling and either fills the room with light or is focused downward for reading or close work. Indeed, the kerosene hurricane lantern gives off only about one twentieth of the light from 60 watt light bulb. Moreover, kerosene-generated light comes out of the side of the lantern, inevitably creating some glare that makes it less pleasant to use. While the choice to use electricity is based on service access, income and relative prices determine consumption levels above a minimum threshold (Again see Figure 3.2, and also Figure 3.7). Electricity consumption decreases with price to a greater extent in the highest income groups, while lower income groups maintain the minimal service level. The poor can afford to use electricity for lighting, but are slower to adopt other

52
appliances which somewhat counterintuively, makes there consumption behavior less price sensitive than higher income customers (Westley 1992). Consumption trends in the 1980s for Vientiane, Laos, provide a case example of the way relative prices affect the level of electricity consumption. Households transitioned directly from biomass fuels to electricity in the period from 1983 to 1992 (World Bank, 1993), as a function of an expansion of hydroelectricity capacity, electricity availability, and low relative prices. The use of electricity soared as consumers not only began cooking with electricity but also began purchasing appliances such as small refrigerators and fans. People still use biomass for energy in Vientiane, but the growth of electricity use beyond the basic need for lighting has been dramatic.
Figure 3.7 Energy Price, Income Class, and Electricity Use
.3–1.61.6–2.22.2–3.1
3.1–4.9 4.9+
Ratio ofelectricity
price tokerosene
1 2 3 4 5
Incomeclass
0
2
4
6
8
10
12
14
Electricity usein Kgoe
Source: ESMAP Sureys
Conclusion
The fuel choice and consumption decisions of urban energy consumers are affected by a combination of household attributes, incentives, and constraints. One of the

53
strongest influences is household income, particularly with respect to the choice to use a fuel. The percentage of consumers who choose to consume modern fuels increases directly with income. The trend in per capita consumption is not quite as direct. In this case, we see the lowest income classes consuming relatively large amounts of traditional fuels, while higher income households consume a greater share of electricity and LPG. Between these extremes, fuel utilization patterns are influenced by family size, relative fuel access, and energy prices. The results of this chapter provide additional perspective as to why government policies appear to have played an influential role in urban energy markets. Incentive-based policies, such as taxes and subsidies, alter the energy prices urban consumers face. The evidence suggests that consumers are sensitive to relative energy prices. As a consequence, incentive-based policies are likely to shift the mix of fuels urban residents consume. The scope for government influence is likely to be particularly significant during the second stage of the urban energy transition, when consumers are in the process of changing their consumption behavior, and fuel alternatives are often available and price competitive. The government has a particularly direct role in affecting the availability and price of modern fuels, both on the supply side, through infrastructure construction, and on the demand side, through access rationing, regulated pricing, and the use of taxes and subsidies. Such policies might be expected to affect the duration of individual stages and thus the pacing of the urban energy transition, as well as skew the consumption mix during stage two. For example, in Zambia, price controls on charcoal may have accelerated a consumption shift from woodfuel to charcoal. In Indonesia, kerosene subsidies seem likely to have accelerated the transition away from traditional fuels, and to have acted as a disincentive for higher-middle-class families to switch to more modern fuels. In summary, the evidence suggests that the fuel choice and consumption decisions of urban dwellers are sensitive to fuel access and energy prices, and that governments have used this fact in their policy making. Perhaps it is encouraging that people respond to the incentives and choices they face. Fortunately or unfortunately, this means that policy intervention—whether of the “right” or the “wrong” kind— is likely to have consequences. It further suggests that policies need to be carefully crafted to achieve their intended effect, and to avoid the unintended consequences.
54
4. ENERGY AND EQUITY: THE SOCIAL IMPACT OF ENERGY POLICIES
Introduction
Urban households in developing countries commonly face energy problems that few city dwellers in industrial countries could imagine. Families may not be able to shift from dim kerosene lamps to high-quality electric lighting because the power utility does not serve their neighborhood. Households that would like to cook with clean and efficient LPG may face waiting list of several years to obtain a service connection. Urban households that cook with fuelwood or charcoal may face seasonal price rises that stretch their budgets to the limit. Taxes may raise the price of biomass fuels to lower income consumers. This chapter focuses on the equity implications of the urban household energy transition and the impacts of sectoral policy on urban energy consumers. Household survey data are used to compare the quality of energy services, the level of energy consumption, and fraction of energy expenditures in households of different income levels. The study also considers how energy policies affect poorer households in comparison to more well-to-do ones. Several significant findings emerge from this assessment. Poorer urban consumers pay higher prices for useable energy due to the inefficiency of traditional fuels-using appliances and lighting fixtures. Poorer urban consumers also spend a larger share of their money income on energy than higher income consumers. As the main users of traditional fuels, lower income consumers also disproportionately bear the health and inconvenience costs associated with urban energy consumption. Energy policy significantly affects the price of energy; hence, the percentage of money income that lower-income consumers dedicate to energy purchases. Energy policy options to improve the welfare of lower-income consumers include ending access inequities, and instituting pricing reform in the utility sector. Additionally, some policies, including taxes on transitional and modern fuels, should be avoided. The impact of structural economic reform policies that would affect urban energy markets need to be carefully evaluated, and tailored to avoid adversely affecting the poor (See Estache et. al., 2001). The issues are not straightforward, however, and, as with other aspects of the problem of poverty in developing countries, simple solutions are seldom evident. The chapter begins with a discussion of the relationship between energy consumption, expenditures, and income class. The next topic is the real price that lower income classes pay for useable residential energy. We then examine the relationship between prices and fuel expenditures, before turning to the way income class affects the

55
response of consumers to energy prices. The chapter concludes with a discussion of the policy implications.
Energy Consumption, Expenditures, and Income Class Household consumption shares of the different fuel types averaged across all income classes and countries are shown in Figure 4.1 (Panel A). Firewood and charcoal make up more than 40 percent of the energy consumed by urban households in the study. Kerosene accounts for only 10 percent of total residential energy consumption. Coal, which is specific to China as a residential fuel source, also accounts for about 10 percent of total consumption. Finally, the highest-value fuels, LPG and electricity, together account for about 33 percent of the total consumption. Differentiating consumption shares by income shows that the pattern of energy consumption is quite different for the poorest (lowest income decile in the sample) and higher income households (highest income decile). (Panels B and C respectively). Wood or charcoal accounts for over half of the energy consumption of the poorest households in the population, while these fuels account for only one quarter of the energy consumed by the wealthiest consumers. The pattern of fuel expenditures differ from the pattern of energy consumption. Aggregating across income classes, the modern, high-quality fuels such as LPG and electricity dominate energy expenditures (See Figure 4.2). Expenditures on woodfuel and charcoal are about one-third of total money outlays on energy. The pattern reflects the fact that urban households in smaller and more remote cities may still be able to collect part of their woodfuel supply, thus lowering cash outlays, as well as the fact that customers are willing to pay relatively high prices for the superior modern fuels.
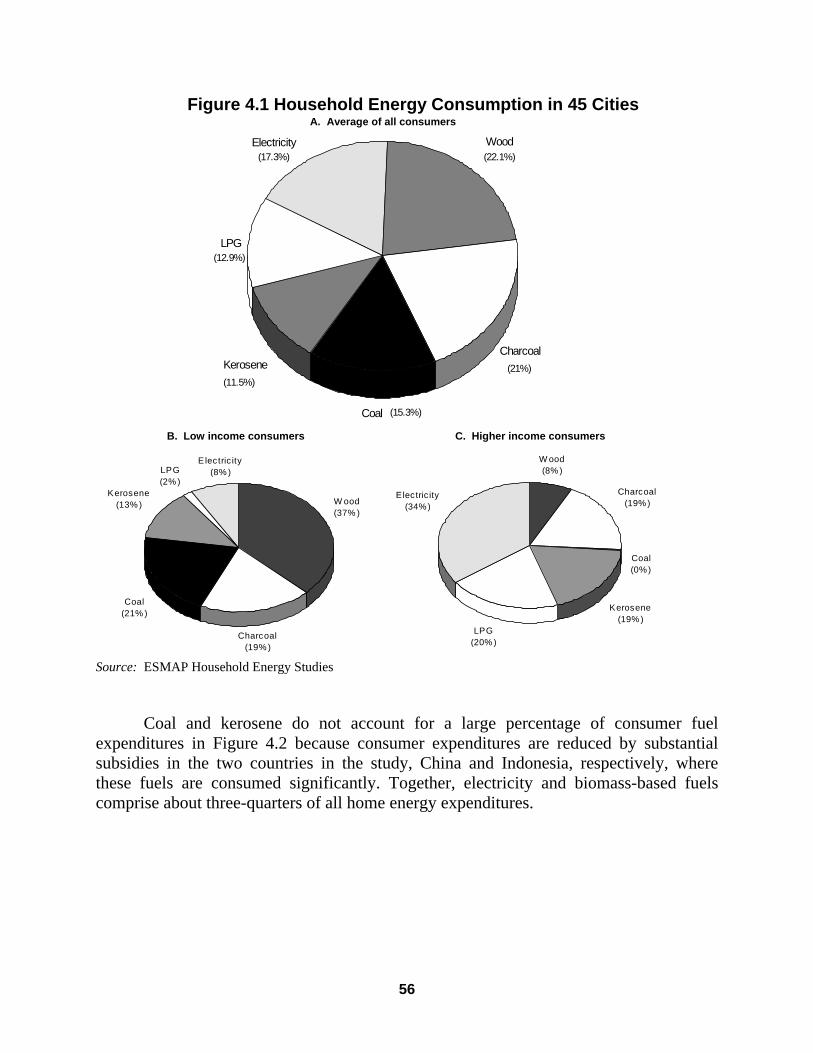
56
Figure 4.1 Household Energy Consumption in 45 Cities
A. Average of all consumers
Coal
Kerosene
WoodElectricity
LPG
Charcoal
(17.3%)
(12.9%)
(22.1%)
(21%)
(15.3%)
(11.5%)
B. Low income consumers
Electric ity(8% )
Coal(21% )
Charcoal(19% )
Kerosene(13% )
LPG(2% )
W ood(37% )
C. Higher income consumers
Electric ity(34%)
LPG(20% )
Kerosene(19% )
Coal(0%)
Charcoal(19% )
W ood(8% )
Source: ESMAP Household Energy Studies Coal and kerosene do not account for a large percentage of consumer fuel expenditures in Figure 4.2 because consumer expenditures are reduced by substantial subsidies in the two countries in the study, China and Indonesia, respectively, where these fuels are consumed significantly. Together, electricity and biomass-based fuels comprise about three-quarters of all home energy expenditures.

57
Figure 4.2 Average Household Expenditures on Six Fuels in 45 Cities
Source: ESMAP Energy Surveys. .
It is sometimes thought that energy expenditures do not constitute a significant faction of poorer people’s monetary income. However, enough of the trade in traditional fuels is channeled through markets that energy prices do affect consumer budgets. In fact, an analysis of expenditure data shows that poorer people spend a significant share of their disposable money income on energy purchases. Families in the lowest income decile spend about $15 per month on energy, while the higher income families spend from $35 to $45 per month on energy (Figure 4.3). Translating these figures into relative shares, the lowest-income group spends more than 20 percent of its total monthly cash income on fuel, the middle group about 12 percent, and the highest-income group just over 5 percent (Figure 4.4). Even so, the 20 percent figure for the poorer households is likely to be biased low in terms of a complete economic accounting, because it does not reflect the presence of barter trade, or the opportunity cost of labor time dedicated to woodfuels collection and/or utilization, or the health costs of indoor air pollution. In summary, it is apparent that lower income households are spending a significant fraction of their money income to obtain cooking energy, and incurring significant non monetary costs as well. Consumption of these traditional fuels does diminish in both relative and absolute importance with rising incomes and increasing economic prosperity (See Chapter 3). But the consumption of biomass-based fuels continue to dominate the
Charcoal19%
Wood14%
LPG 16%Kerosene 9%Coal 1%
Electricity 41%
Traditional Fuels(33%) }
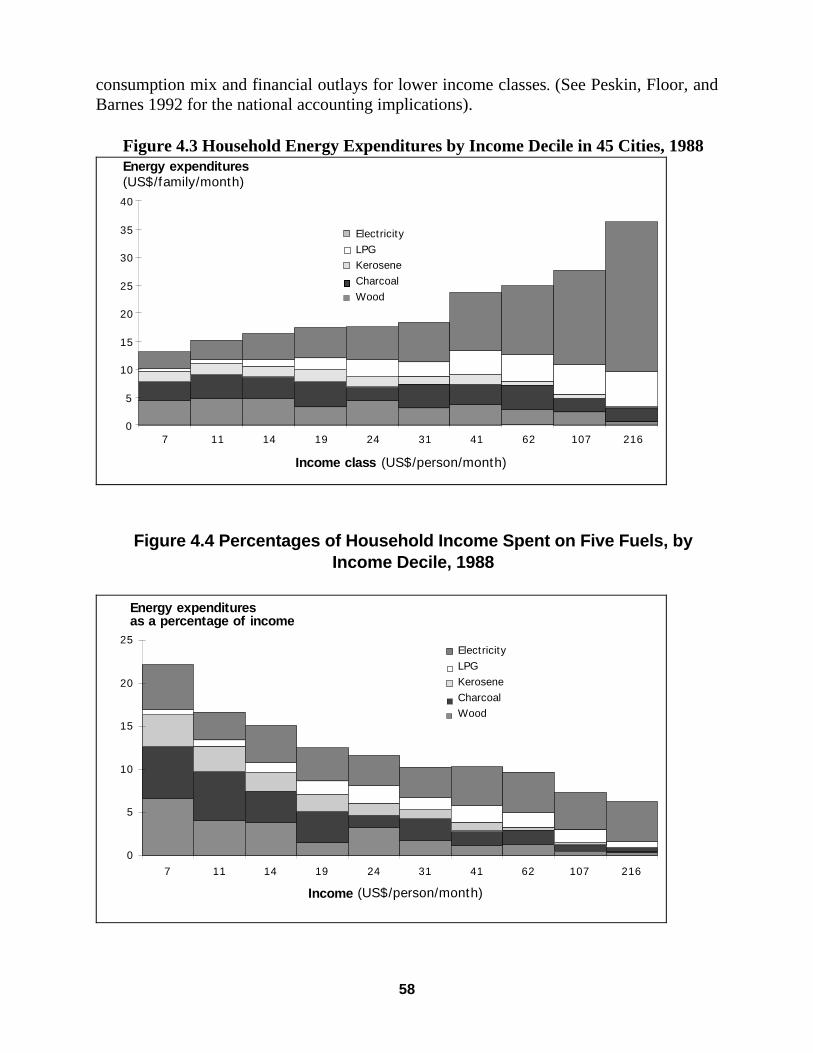
58
consumption mix and financial outlays for lower income classes. (See Peskin, Floor, and Barnes 1992 for the national accounting implications).
Figure 4.3 Household Energy Expenditures by Income Decile in 45 Cities, 1988
Figure 4.4 Percentages of Household Income Spent on Five Fuels, by Income Decile, 1988
0
5
10
15
20
25
7 11 14 19 24 31 41 62 107 216
Income (US$/person/month)
Energy expendituresas a percentage of income
ElectricityLPGKeroseneCharcoalWood
0
5
10
15
20
25
30
35
40
7 11 14 19 24 31 41 62 107 216
Income class (US$/person/month)
Energy expenditures(US$/family/month)
ElectricityLPGKeroseneCharcoalWood

59
The Price of Poor People’s Energy
It is often assumed that traditional fuels are relatively “inexpensive” vis a vis modern energy. As just discussed, it is clear that this assumption is not true if a full economic accounting is made of the cost of traditional fuels. Moreover, the market prices of residential fuels do not fully reflect consumer costs due to the fact that fuel-using appliances differ in their thermal efficiencies, and this technical fact is not fully reflected in market prices in developing countries on account of incomplete information and other market imperfections in residential fuel markets. (Discussed below). Beyond these accounting issues is the fact that the market prices of traditional fuels may themselves be relatively high compared to modern fuels. Supply shortages, sometimes seasonal in nature, frequently increase the market price of biomass-based fuels -- particularly toward the later stages of the energy transition. As mentioned before, supply and distribution restrictions commonly limit access of poorer consumers to modern fuels, shifting excess demand to biomass-based fuels. Quantity rationing in modern fuel markets effectively dichotomizes the residential fuel market into modern and traditional segments. Under these conditions, modern and traditional fuel prices will be decoupled, and the market prices of traditional fuels can be higher than the market prices of modern fuels. When all fuels are price- rather than quantity-rationed, market prices will be interlinked, though not identical due to qualitative differences in fuel properties. In this case, policies targeted at one fuel will influence the price of other fuels through substitution (See Chapter 3). This inter-linkage has equity implications. For example, taxes on modern fuels in this case will shift some demand to the traditional fuels that the poor rely on, raising the price of poor people’s energy, and lengthening the time period that poor consumers will use traditional fuels. Conversely, subsidizing modern fuels will decrease the price of traditional fuels and accelerate the switch time from traditional to modern fuels. These trends will differentially impact poorer consumers who rely most on traditional fuels. The Price of Cooking Energy
The amount of heat that is burned for cooking is called the “input energy” and the amount that is actually absorbed by pots, pans, and or other cooking vessels is called “useful” or “delivered” energy. The difference is waste heat that escapes around the sides of the pan. Lower income households typically combust small quantities of fuels in thermally inefficient stoves or open fires with efficiencies (ratio of useful energy/input energy) ranging from 10 to 15 percent; charcoal stoves can reach efficiencies of up to about 25 percent. In contrast, LPG and electric stoves have thermal efficiencies varying between 55 and 70 percent (Fitzgerald, Barnes and McGranahan, 1990). When adjustments are made for the thermal efficiencies of cooking appliances, it is apparent

60
that the prices that poor people pay for cooking energy often are as high or higher than more well-to-do households.6 To compute an income class-specific price for cooking energy, we first adjusted market prices for the energy content of the fuels and the thermal efficiency of cooking stoves, yielding a price for delivered cooking energy for each of the different fuel types. Next, data on income-class specific fuel shares were used to generate a weighted average price for each income class. From this information, it is apparent that the poor pay more for delivered cooking energy than higher income households in a number of countries in the study (See Table 4.1). These countries either have markets undistorted by policy intervention in which the market price of traditional fuels is relatively high, or markets where the price of traditional fuels has been raised directly, or indirectly, by taxation. The Philippines is a country that illustrates the former case. Poor consumers in the Philippines face relatively high prices for delivered cooking energy, especially in the smaller cities, where reliance on biomass energy is common. The difference between the delivered price of cooking energy for the income class in the top 20 percent and the lowest 20 percent in urban areas was close to $1/KgOE at the time of the survey.
Table 4.1 Countries in Which the Poor Pay More for Energy than the Wealthy
$/KgOE of energy weighted by fuel use and efficiency Income class Average One
(Lowest Income)
Two Three Four Five (Highest Income)
Price
Country Policy KgOE KgOE KgOE KgOE KgOE $/KgOE Haiti Tax 1.60 1.45 1.42 1.37 1.26 1.42 Philippines Market 1.79 1.48 1.24 1.01 0.66 1.36 Bolivia Market … 0.66 0.65 0.59 0.55 0.60 Cape Verde Market 1.55 1.67 1.62 1.58 1.49 1.58 Yemen Market 1.79 1.89 1.37 1.45 1.22 1.45 Thailand Market … … 1.03 0.92 0.86 0.90
As noted before, energy markets in Haiti are distorted by taxes on petroleum products. The extremes in poverty and wealth in Haiti mean that the costly petroleum products are used by only a few of the wealthiest households, displacing much of the demand for the rest of the income spectrum to charcoal, itself relatively expensive and inefficiently combusted.
6 We do not have the information to adjust fuel costs in this study for the other factors raising its costs to low income consumers, e.g., the time opportunity cost to woodfuels collection and/or utilization, and non-monetized health effects from indoor air quality problems.

61
Bolivia follows a relatively free market pricing regime and, as an oil producing country, the price of modern fuels is close to the world market price. Both the rich and the poor consume petroleum products. Relative to the other countries in which the poor pay more for energy, the differences between rich and poor households are noticeable but relatively modest. The difference between the price of delivered energy for the highest and lowest 20 percent of the urban population is only 9 cents per kilogram of oil equivalent, reflecting the fact that petroleum-based fuels are cost competitive with wood fuels in this particular country. There are some countries in which the poor pay about the same price for delivered cooking energy as the upper income classes. This relative equality occurs in countries that either subsidize modern fuels in price-rationed markets or tax modern fuels in dichotomized quantity-rationed markets. Burkina Faso and Mauritania reflect the second case. Modern fuel markets are relatively undeveloped; hence, modern fuels are generally not available to the poor. The policy of taxing LPG and keeping electricity rates high effectively raises the delivered price of rich people’s fuel to the level of the prices of charcoal and wood (Table 4.2). Both the rich and the poor are paying high price for useable cooking in these very poor countries.
Table 4.2 Countries in Which Poor People Pay the Same Prices as the Wealthy $/KgOE of energy weighted by fuel use and efficiency Income class Average One Two Three Four Five price
Country Policy KgOE KgOE KgOE KgOE KgOE $/KgOE
Zambia Subsidy 0.64 0.64 0.60 0.55 . 0.62 China Subsidy 0.23 0.17 0.17 0.12 . 0.19 Mauritania Tax 2.22 2.04 1.81 1.76 1.95 1.97 Burkina Faso Tax 1.93 1.86 2.00 1.78 2.21 1.92 Indonesia Subsidy 0.49 0.47 0.47 0.47 . 0.48
In contrast, a coal subsidy in urban areas in China induces a downward price pressure on all fuels, which are substitutable and generally accessible to all income classes. Except in one case, lower income groups pay about the same price as higher-income groups, and almost everyone uses coal for both heating and cooking. The exceptional case is one poor county where coal availability is limited. This county is located between two mountain ranges, and it is difficult to truck coal to the county seat. As a consequence, the energy market is dichotomized, and poor families with below-average incomes are reliant on wood, which is not subsidized. They pay more for delivered cooking energy than people with higher incomes. As mentioned before, kerosene is subsidized in Indonesia. It is widely available to all income classes in just about all markets (World Bank 1990c). Although the delivered

62
price of wood for cooking is higher than for kerosene, there is little difference between the income class-weighed prices of cooking fuels in Indonesia due to the relatively low share of biomass-based fuels consumed by any income class in the country. The Relationship Between the Delivered Price of Cooking Energy and Energy Expenditures. This section assesses the relationship between the delivered price of cooking energy and money outlays on cooking energy consumption. Figure 4.5. shows that energy prices and expenditures are strongly, though not perfectly, correlated in the countries in the study. Countries on the left side of Figure 4.5. face relatively low prices for delivered cooking energy, while the countries on the right face relatively high prices.
Figure 4.5 Weighted Energy Price and Percentage Expenditures
0.00
0.50
1.00
1.50
2.00
2.50
China Indonesia Bolivia Zambia Thailand ZimbabwePhilippines Haiti Yemen CapeVerde
Burkina Faso
Mauritania
US$-weighted KgOE for cooking
0.00
5.00
10.00
15.00
20.00
25.00
% energy of total expenditures
% energy expenditures
Delivered cooking energy is cheapest for consumers in China and Indonesia where consumers there extensively rely on subsidized transition fuels (coal and kerosene respectively). The percentage of income spent by both rich and poor urban consumers is relatively low in both countries. At the opposite end of the spectrum, the delivered price of cooking fuel and energy expenditures are relatively high in Haiti, Cape Verde, Burkina Faso, Yemen, and Mauritania. These countries have few indigenous energy resources (or in the case of Haiti, have over-exploited the indigenous resources), and/or tax modern fuels such as LPG. Combined with the shortages of indigenous biomass fuels, taxes make delivered cooking energy very expensive across all income classes, and energy expenditures are relatively high. The prices of wood or charcoal-generated energy in these countries are sometimes higher than modern fuel alternatives, the result of inefficient fuel markets.

63
Countries with available biomass resources and/or undistorted energy markets fall between these extremes. Bolivia has the lowest prices for residential energy, mainly because the country produces LPG and makes it widely available. The Philippines and Thailand pursue similar market-oriented strategies, and people in these countries consequently also enjoy low energy prices – thought not as low as the countries that subsidize fuels. Thus, as expected, the policy to tax or subsidize a fuel that is used for cooking does have an impact on the percentage of expenditures that households utilize to pay for their energy bills. The Price of Lighting Lighting is the first use of electricity in urban households. Kerosene is used either when electricity is not available or during power outages. The efficiency of electrical lighting is much higher than kerosene lamps or candles. In fact, it is estimated that one 60 watt light bulb has an equivalent amount of light output as 18 kerosene wick lamps (van der Plas and van de Graaff, 1988; Nieuwenhout, van de Rijt, and Wiggelinkhuizen, 1998) and uses much less energy to produce the light. Florescent lights are even more efficient, reaching levels over 200 times greater than kerosene lamps (Nieuwenhout, van de Rijt, Wiggelinkhuizen, 1998).
Electrification affects not only people’s total energy use but also lifestyles and quality of life. Here a distinction needs to be made between cooking and lighting. People tend to use lighting more extensively once they acquire an electrical hookup, whereas they generally do not change the amount of food they cook. As mentioned, electric lighting is both superior in quality and much less expensive per unit of light than the service from the light source it replaces—usually a kerosene lamp. Thus, households often expand and diversify their activities when they acquire electricity, using lighting for reading, sewing, and recreation.
The present price analysis is based on the concept of lighting service. A kilolumen hour is the quantitative measure of lighting service. Due to the superiority of electricity, it was assumed that households with access to electricity use it as the primary source of household lighting, while those without electric hookups use kerosene. A weighted average price for lighting services was then computed for each income class based on the percentage of households in each class using electricity and kerosene. Based on this assessment, countries in the study with the most inequitable lighting costs are Haiti, Cape Verde, Mauritania, and Burkina Faso, mainly because the lower income classes in these countries do not have access to electricity and because kerosene prices are high (Table 4.3). Poorer residents, who must use kerosene, are paying higher prices for lighting services than higher income customers. In Indonesia and the Philippines, lower income households also pay more for lighting services than higher

64
income households, but the price difference between the two is only a matter of 3 to 8 cents per kilolumen hour. In addition, the poorer households are paying about one-fifth less for lighting services in both Indonesia and the Philippines, compared with the first group of countries. In other countries electricity is universally available so that lighting is widely available at the market price for all income classes. The urban poor pay about the same as other urban residents for lighting in China, Bolivia, and Yemen, because almost everyone in the urban areas of these countries has access to electricity service. The exceptions to this pattern are in Zambia and Zimbabwe, countries in which urban electrification plans are based on a regional coverage approach. In these countries, the regions that gain electricity contain both poor and more wealthy households, and most people in the regions adopt electricity regardless of whether they are rich or poor. The regions without electricity also contain people with many different income levels. The regional coverage approach is more equitable than providing service to only those that can afford higher levels of electricity service, but it does deny access to consumers in non-covered regions. The exception to these trends is in Thailand, where the poor actually pay less for lighting. The reason is that almost everyone in major urban areas use electricity, and the government has a policy to provide lifeline rates to households that use very little electricity. These lifeline rates reduce the price that the poor pay for electricity service to less than the price paid by more wealthy households. Thus, for all countries in the study, the main factor having an impact on the different prices that poor or wealthier households pay for lighting is access to electricity.
Table 4.3 Price of Lighting by Energy Type and Income Class in 45 Urban Areas
Kerosene and electricity lighting prices (US$/kilolumen hour) Prices by type Combined kerosene and electricity prices by income class Electric Kerosene One Two Three Four Five Average
Countries where the poor pay more Haiti 0.52 1.65 0.71 0.60 0.58 0.57 0.56 0.60 Cape Verde 0.77 1.90 1.40 1.30 1.32 1.13 0.85 1.17 Mauritania 0.99 1.49 1.57 1.50 1.31 1.25 1.12 1.41 Burkina Faso 0.52 2.45 2.07 1.98 1.85 1.44 1.17 1.82 Indonesia 0.23 0.47 0.26 0.25 0.23 0.23 . 0.25 Philippines 0.23 0.87 0.34 0.26 0.24 0.23 0.26 0.27
Countries where the poor pay about the same China 0.16 1.17 0.19 0.17 0.15 0.17 . 0.17 Bolivia 0.21 1.15 . 0.34 0.34 0.26 0.24 0.28 Yemen 0.57 1.83 0.74 0.67 0.66 0.64 0.64 0.65 Zimbabwe 0.25 1.27 0.47 0.42 0.41 0.52 0.39 0.44 Zambia 0.07 0.77 0.40 0.40 0.38 0.42 . 0.40 Thailand 0.23 0.94 . . 0.21 0.23 0.24 0.23

65
Average 0.37 1.23 0.68 0.64 0.65 0.57 0.43 0.61 Source: ESMAP studies.
Income Class and the Response to Energy Prices and Fuel Access
The poor and the middle class are responsive to price signals for traditional fuels, as distinct from more wealthy households that typically do not significantly consume traditional fuels. The fact that approximately two-thirds of urban populations are responsive to traditional fuels prices means that higher prices of traditional fuel prices will lead to fuel switching and/or energy conservation. Thus, lower income households will be affected by changing traditional fuels prices, whether these changes are induced by the government through subsidizing or taxing transition fuels or otherwise by market conditions. If fuelwood or charcoal prices increase, consumers will seek to conserve energy or switch to available transition fuels. Because the poor do not use large quantities of modern fuels, one might conclude that changes in the price of kerosene, LPG, or electricity will not much affect the poor, and that governments are therefore relatively free to institute policies in the modern sector with little consideration of the side effects. This conclusion, however, would be erroneous on two counts. First, poor people in many countries do use electricity for basic lighting services and are thereby directly affected by price changes for electricity. Secondly, price changes in modern fuels markets will affect the poor through demand displacement and substitution to traditional fuels if modern and traditional fuel markets are not decoupled by quantity rationing.
The decision to purchase an LPG stove and bottle are weighed carefully by individuals in all income classes before they decide to adopt LPG. People in most income groups are less likely to purchase the equipment necessary to use LPG when LPG prices are high. The case of electricity, however, is somewhat different. Electricity access is the principle factor that affects the choice of electricity. The main barriers to access are the policies of the power companies concerning physical access and barriers involving connection charges and administrative procedures for obtaining connections. These constraints apply to all income groups but are particularly restrictive for lower-income households. For example, only 60 percent of urban populations have adopted electricity in Malawi because the electricity company will not provide service to poor neighborhoods without receiving advance payment to cover distribution costs (World Bank, 1998). Access limitations also constrain the use of electricity by poor consumers in India (Discussed in Chapter 6). Although the poor choose to use electricity, the amount of electricity that the poorest income groups consume does not vary significantly with income. Income does affect the quantity of electricity used by the middle class and the rich, but it does not have much impact on the quantity used by the poor. Once poor households obtain a
66
connection, they almost universally use it exclusively for lighting. The value of electric lighting is relatively high for the poor, due to the relative inferiority of kerosene lighting (World Bank, 2002), but they are not able to realize the other, additional benefits of using electricity for household appliances until their incomes rise. Higher levels of income do translate into increasing use of electricity for households that have some disposable income, but not for lower income households, who stick with a minimal level of electricity service. In general, the demand for traditional energy and kerosene by lower income households should be quite price elastic when all the fuels are available, due to relatively close substitutability among them and the large impact of energy prices on the budgets of low income households. When woodfuel, charcoal, and kerosene are not all available, consumers will be less sensitive to price given that cooking energy demand is difficult to economize. For the same reason, LPG consumption is likely to be relatively price insensitive for the high income consumers who use it as a cooking fuel. The demand for electricity is not very price elastic for low income classes, who use electricity mostly for lighting, and more elastic for upper income classes who have the flexibility to economize on the use of luxury appliances such as air conditioners (See Figure 3.7 in Chapter 3).
Conclusion and Policy Implications
The evidence suggests that low income urban households rely on traditional fuels to a greater extent than higher income households, and are paying higher prices for useable energy due to the inefficiency of traditional fuel-using cooking stoves and kerosene lamps. Poorer people also spend a larger share of their money income on energy than higher income urban consumers. As the principal consumers of traditional fuel, the poor also bear a disproportionate share of the health and inconvenience costs associated with residential energy consumption. Taken together, these findings suggest that the poor are relatively burdened by the pattern of residential energy utilization in developing countries.
One important policy variable is fuel access. Expanding fuel access will increase the flexibility to substitute one fuel for another, and the responsiveness of low income consumers to the price of different fuels. This flexibility could reduce inconvenience and monetary costs, allowing poorer households to lessen the burden of regressive energy taxes on traditional or transitional fuels, and face lower monopoly markups in monopolistically competitive markets. The flexibility to fuel switch also allows consumers to minimize the burden of sudden price increases caused by local shortages. Such cyclical price rises are common in developing countries, which often see increases in wood and charcoal prices during the rainy season. If the poor lack access to fuel alternatives — through limited supplies, economic barriers to fuel access, or institutional restraints -- they have no choice but to pay relatively high prices in a restricted traditional fuels market. Policies to promote market access include investments in modern fuel infrastructure and distribution, and reducing the financial barriers to entry for the poor
67
through loans for stoves or rolling up-front costs into market prices. The substantial initial costs of LPG equipment deter many poor consumers. The price of lighting is generally the consequence of electrification policy. Both the poor and the rich are able to take advantage of electrical lighting in countries that promote universal service. Where barriers to electricity adoption exist, the poor are usually differentially restricted and pay more for lighting services. One potentially sensible energy assistance program for the poor that is carried out by many developing-country power companies is the practice of using increasing block rate tariff structures along with connection charges that are rolled into the overall price that the public pays for electricity. This reduces the barrier to entry for the poor to adopt electricity for the low levels of electricity that they use -- about 50 kilowatt hours per month. In countries with such policies, most of the poor take advantage of electricity service for lighting. The level of service should be geared to this use level, and should be accompanied by wide access to connections, which will forestall the common practice among the poor of buying electricity for lighting from a neighbor, often at higher prices than they would be charged by the power distribution companies. This practice is more prevalent in urban areas of developing countries than many power distribution companies realize. Thus, the adoption of the block-rate tariffs potentially could benefit poor customers as well as the cash flow of utility companies. Broadly-applied subsidies on transitional or modern fuels would also help lower income households. The effects of such subsidies are both direct and indirect. The direct effect is that many poor people use the transition fuel, thereby reducing their energy expenditures. The indirect effect is that biomass fuels must compete with transition fuels that are subsidized and widely available to the poor. Therefore, subsidizing substitute fuels provides a price cap on traditional fuels. Many countries with high biomass fuel prices have large markups between roadside supply of the fuel and final market price in urban areas. This margin often contracts with changing supply costs and greater competition from fuel alternatives. Broad-based subsidies on modern fuels benefit all income classes. In fact, the better-off classes will garner the greatest share of modern fuels subsidies since they consume more modern energy than lower income households. Subsidies also impose budgetary and economic costs, and foreign exchange costs if subsidies encourage additional fuel importation. Despite these negatives, it should be reemphasized that fuel subsidies do help the poor. In addition, the foreign exchange costs would not be notable for the countries in this study because the main subsidies are for indigenously-produced fuels—coal in China and kerosene in Indonesia. Indeed, subsidizing import-competing domestic fuel sources could actually reduce foreign exchange costs, thereby providing an additional benefit. To overcome the drawbacks of general subsidies, some countries have tried limiting fuel subsidies to rationed quantities. This policy avoids some of the problems of
68
more broadly-applied subsidies, but is difficult to apply and administer effectively (See Chapter 6). Moreover, the price differential between subsidized and unsubsidized fuel provides a motive for those who control fuel distribution to divert shipments onto the open market. The market bifurcation between subsidized and unsubsidized fuel also has the drawback in not capping the price of traditional fuel at the lower subsidized level. In short, the direct benefit of this kind of subsidy policy can be attenuated, and the indirect benefit of the general subsidy – lowering the backstop price of traditional fuels – is absent. Either subsidizing modern fuels or taxing traditional fuels could be used as a policy instrument to accelerate the energy transition for environmental, health, or other reasons. However, subsidizing modern fuels would have a positive effect on the poor, while taxing traditional fuels would have a negative effect in a market where poor consumers are already burdened. For this reason, using policy to accelerate or subsidize the modern fuel sector would seem presumptively better of the two options. Again, however, the practical problems of subsidies, as well as their budgetary impact and net economic cost, would have to be weighed in the decision-making. Sometimes Kerosene, LPG, and electricity are taxed in developing countries. The intention is often laudable --taxing “rich peoples” fuel is a progressive way to generate revenue and encourage energy conservation. In the end, however, such taxation hurts the poor by raising the effective cap that modern fuel prices put on biomass fuels. Not only does this policy hurt the poor in the short-term, it delays the energy transition in the long-term by raising the backstop price of traditional fuels. Another point is that structural economic reform proposals that would remove subsidies in the energy sector, or deregulate prices (e.g., for electricity) must be assessed very carefully (Estache et. al., 2001). If subsidies are removed without a compensatory program, the poor will be hurt the most. Unfortunately, many countries cannot continue to provide subsidies for financial reasons because residential energy demand are growing more rapidly than energy demand in other sectors, making household subsidies an increasingly untenable financial burden. As mentioned above, fuel subsidies in conjunction with quantity rationing – one solution to this problem – has some practical problems (See Chapter 6). In the past three chapters, we have been focusing on energy utilization patterns in urban energy markets, and the way they evolve; consumer attributes affecting consumption demand, and the responses of consumers to incentives and constraints; and the particular issues that confront low income consumers in urban energy markets. Throughout we have considered the role of policy. In the next chapter, we shift the focus to consider the environmental and health implications of urbanization and traditional fuel consumption patterns. We will specifically examine the relationships between urbanization, residential energy consumption, and periurban deforestation, and the

69
implications of biomass consumption trends for the exposure risk consumers face to the indoor pollutants generated from using biomass fuels for cooking.

70
5. URBAN ENERGY TRANSITION AND THE ENVIRONMENT
Introduction
More than twenty-five years ago, Eric Eckholm (1975) focused the attention of the international development community on the "other energy crisis." At the time, the world was facing oil shortages, sharply rising petroleum prices, and long queues at gasoline stations. Forecasters were predicting that fuel prices would continue to rise, and the United States began filling the strategic petroleum reserve. But Eckholm contended that policy makers were ignoring just as serious a problem: looming shortfalls of biomass energy in the developing world. His projection was based on Club of Rome–type extrapolations in which population growth would proportionately increase the consumption of woodfuels, and biomass stocks would decline in proportion to consumption (Eckholm 1975; Agarwal, 1986). This market dynamic would result in unsustainable tree harvesting, a “woodfuel gap” between excess demand and supply, and significant deforestation. Paralleling arguments levied at the Club of Rome report, a number of researchers in the energy field criticized the “woodfuels gap” hypothesis for its absence of economic content, i.e., for failing to allow for the possibility of endogenous supply augmentation, household energy conservation, or inter-fuel substitution (Cline-Coal and others 1990; Foley 1987; Dewees 1989; Mercer and Soussan 1990). A more recent literature has emerged on the so-called “environmental Kuznets” curve which is conceptually consistent with the critique of the woodfuels gap hypothesis (See Dagupta et. al., 2002; Panayotou, 2000; Stern and Commons, 2001). In the environmental Kuznets curve scenario, resource utilization increases during an initial period of economic development, and associated health and environmental effects worsen. This stage is consistent with a Club of Rome/Eckohlm-type forecast – health and environmental problems increase roughly in proportion to population growth during the early economic growth period. But this “scale effect” gradually is mitigated over time through a number of possible adjustment responses: consumer demand shifts towards more environmentally-benign commodities, as a consequence of changing preferences or rising incomes; fuel switching in response to rising prices; technical efficiency gains in resource utilization; and more stringent environmental policy. Beyond a certain income threshold, the sum of the mitigating effects begins to dominate the scale effect of economic expansion, and the environmental impacts of economic growth begin to diminish. The conceptual framework of the Kuznets curve literature can readily be extended to the concept of the “urban energy transition”. An environmental Kuznets curve in this context would imply enough substitution to modern fuels after a certain urban growth threshold to begin to reduce the impacts of biomass fuel consumption on human health
71
and the environment. In fact, extending the logic of the Kuznets curve concept to the natural limit, the question could be raised: what is the urban growth threshold beyond which cooking energy consumption becomes entirely disassociated from periurban deforestation, and the health effects of biomass-based fuel burning-- the state reached in advanced economies -- due to comprehensive fuel switching? Clearly, the woodfuels gap scenario and the environmental Kuznets curve extension bracket a range of possible outcomes in terms of the projected resource and environmental futures associated with urban energy transitions. And as a first approximation, it would appear that the actual reality since Eckholm’s original warning falls somewhere in the middle of the range. Just as the world has recovered from the energy crisis (at least temporarily), predictions that the developing world would “run out” of biomass energy appear to have been overstated. At least the time frame of the projections has not fully materialized. But as pointed out in Chapter 4, the price of traditional fuelwood in urban markets are sometimes very high -- higher than that of access-restricted modern fuels, in fact -- reflecting relative resource scarcity. Deforestation also continues to be regarded as a significant problem locally around many cities. But perhaps most significantly, a rapidly growing literature on indoor air pollution is providing evidence that the health effects from biomass-based cooking emissions is one of the most significant health issues in the developing world (See Smith and Mehta, 2003; Smith 2003). While a significant part of the problem lies in rural areas, studies show that the urban poor, who continue to rely on biomass-based cooking fuels, are also at risk. This chapter examines the evidence of the relationship between urban growth and the environment, to see if additional light can be shed on the resource, environmental, and health effects of the urban energy transition. The next section assesses the impact of urban income growth and local deforestation around cities. We then examine how demand pressures on periurban resources through the biomass consumption channel evolve as cities grow and energy markets develop. The subject next turns to the implications of fuel consumption trends on indoor air pollution exposure risks. Lastly, the chapter concludes with a summary of the results and discussion of policy implications.
Periurban Forestation Patterns
Overview What is the relationship between urban income growth and forestation patterns around cities? In this section, we assess the degree to which standing biomass in the vicinity of cities -- average biomass density (m3/Ha) -- corresponds to a number of reduced form supply- and demand-side shift variables. The study is based on a sub-

72
sample of 34 cities (in the countries marked “a” and “c” in Table 1.1).7 Figure 2.1 in Chapter 2 provides the conceptual framework motivating the variable selection. Data limitations ultimately narrowed the focus of the analysis to the following variables: distance from urban areas, urban income, periurban population density, transportation development, and two natural environmental factors: topography and precipitation. The means of these variables, aggregated at the country level, are provided in Table 5.1. Annex 2 describes the methodology and sources for the derivation of the variables in Table 5.1. Because the estimation of the biomass densities was quite involved, we will briefly describe the procedure here before turning to the assessment itself. The first step was to obtain vegetation maps displaying the spatial distribution of different vegetation classes around each of the cities. The distribution outlines of different vegetative classifications were digitized using an ATLAS*DRAW/ATLAS*Graphics software package—a quasi-GIS package—and plotted, producing detailed computerized mappings of the vegetation patterns in concentric zones around each city. Figure 5.1 shows the results for one city in the study, Surbaya Indonesia, as an example. Next, the software was used to compute the areal extent of each vegetation class, and vegetation-class-specific “biomass conversion factors” were applied to convert the areal calculations into standing biomass estimates associated with each vegetation class. The next step was to aggregate biomass estimates for each vegetation class to yield the total standing biomass in each zone. This figure was then divided by the land area in each zone to yield zonal biomass density values. This process allowed us to generate a detailed mapping of standing biomass densities in concentric zones around each city we studied.
Table 5.1 Characteristics of the Sample Countries and Regions
Country/region
Natural biomass range
(m3/ha)
Mean periurban biomass (m3/ha)
Mean city
income (106U.S.)
Mean periurban
roads (km/106ha)
Mean
periurban topographya
Mean periurban rainfall (mm/yr)
Indonesia 88-252 29 1,279 753 0.96 1,689 Philippines 8-345 40 1114 664 1 1,976 Thailand 78-120 30 2331 473 0.34 1,320 Asia average * 33 1575 630 0.77 1,661 Mauritania 0-32 2.6 32 228 0 227 Botswana 0-71 30 62 275 0 466 Zimbabwe 16-103 48 186 431 0.67 769 Africa average * 20.2 77 317 .17 454 Bolivia 15-242 76 344 373 1.48 545
7 Ultimately, we did not include the cities of Cape Verde in the deforestation analysis, due to the fact that the periurban areas in question were too dry to contain natural biomass.
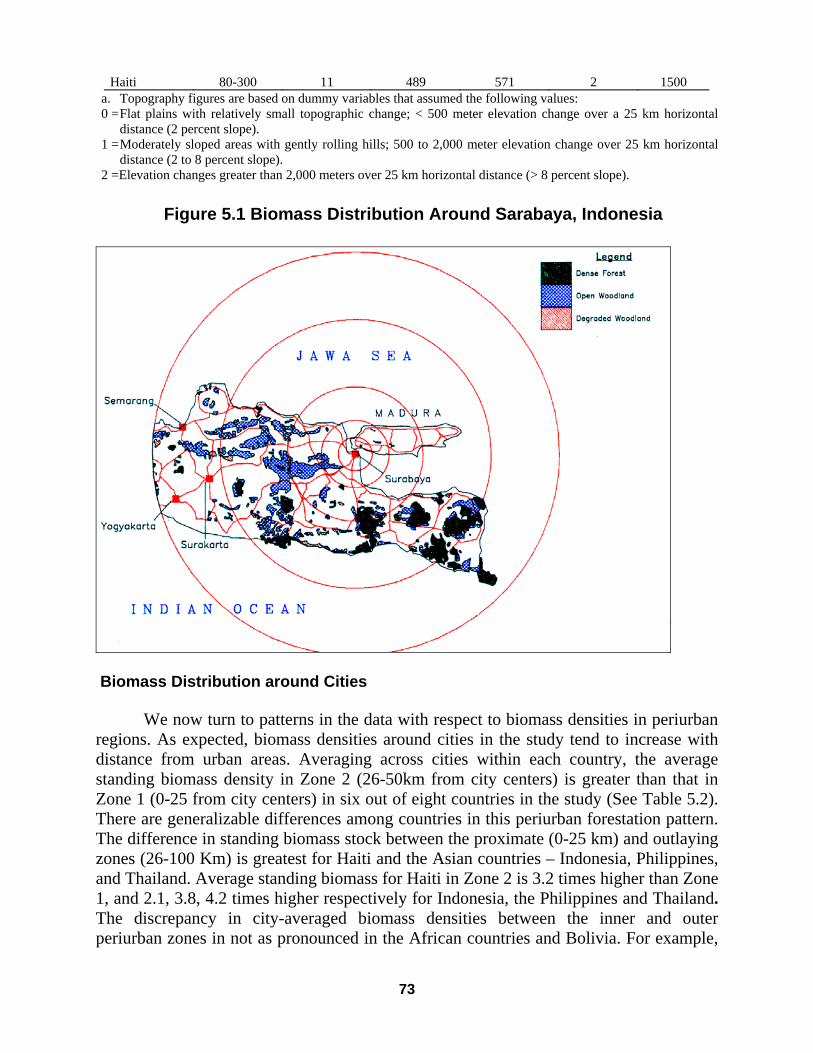
73
Haiti 80-300 11 489 571 2 1500 a. Topography figures are based on dummy variables that assumed the following values: 0 = Flat plains with relatively small topographic change; < 500 meter elevation change over a 25 km horizontal
distance (2 percent slope). 1 = Moderately sloped areas with gently rolling hills; 500 to 2,000 meter elevation change over 25 km horizontal
distance (2 to 8 percent slope). 2 =Elevation changes greater than 2,000 meters over 25 km horizontal distance (> 8 percent slope).
Figure 5.1 Biomass Distribution Around Sarabaya, Indonesia
Biomass Distribution around Cities We now turn to patterns in the data with respect to biomass densities in periurban regions. As expected, biomass densities around cities in the study tend to increase with distance from urban areas. Averaging across cities within each country, the average standing biomass density in Zone 2 (26-50km from city centers) is greater than that in Zone 1 (0-25 from city centers) in six out of eight countries in the study (See Table 5.2). There are generalizable differences among countries in this periurban forestation pattern. The difference in standing biomass stock between the proximate (0-25 km) and outlaying zones (26-100 Km) is greatest for Haiti and the Asian countries – Indonesia, Philippines, and Thailand. Average standing biomass for Haiti in Zone 2 is 3.2 times higher than Zone 1, and 2.1, 3.8, 4.2 times higher respectively for Indonesia, the Philippines and Thailand. The discrepancy in city-averaged biomass densities between the inner and outer periurban zones in not as pronounced in the African countries and Bolivia. For example,

74
the second zone has biomass densities averaging 1.8 and 1.3 higher than the inner-most urban zones for Mauritania and Zimbabwe, respectively. City-averaged biomass density in Zone 2 in Botswana is actually .97 of the biomass in innermost zone; in Bolivia, the figure is .87. These differences can be explained by the interplay of human factors that induce deforestation and natural factors that influence the level of standing biomass. We now turn to an assessment of both groups of factors. City Income and Periurban Population Density City income and periurban population density are two important human factors that induce deforestation around cities. The size and income of cities, and population densities around them, will stimulate land conversion and biomass energy demand in the periurban region. City income and population densities differ widely among the cities in the study, and are likely to be an important determinant of the periurban forestation patterns observed. Average city incomes are significantly higher for the Asian cities than for Haiti, Bolivia, and especially the African cities (see Table 5.1). Averaged population densities in the 0-25 km zones follow the same pattern. For example, average population densities in Zone 1 (measured in persons per ha) range between 7.9 in Thailand to 22.30 in the Philippines; the figure is 3.6 for Port au Prince, Haiti (See Table 5.2). In contrast, average population densities in Zone 1 around Mauritania and Botswana are only .87 and .37 respectively, with the values for Zimbabwe and Bolivia at 1.96 and 1.09 respectively.
Table 5.2 Variable Values in Periurban Zones
Zone Distance (Km)
Haiti Indonesia Philippines Thailand
Biomass Density Z1 0-25 4.96 13.30 15.05 6.20 (m^3/Ha) Z2 26-50 15.96 28.14 57.23 25.98
Z3 51-100 12.97 31.78 56.71 29.61 Ratio Z2/Z1 3.22 2.12 3.80 4.19
Population Density Z1 0-25 3.57 15.35 22.30 7.92 (Persons per Ha) Z2 26-50 0.03 0.64 0.35 0.10
Z3 51-100 0.02 1.16 0.20 0.86 Ratio Z2/Z1 0.01 0.04 0.02 0.01
Road Density Z1 0-25 720.00 715.50 772.60 682.33 (Km/10^6 Ha) Z2 26-50 536.00 361.67 629.60 356.33
Z3 51-100 457.00 414.17 589.40 321.33 Ratio Z2/Z1 0.74 0.51 0.81 0.52
Topographic Relief Z1 0-25 2.00 0.33 0.20 0.00 (Topography Index) Z2 26-50 2.00 0.83 1.40 0.33
Z3 51-100 2.00 1.67 1.40 0.33 Ratio Z2/Z1 1.00 2.50 7.00 -
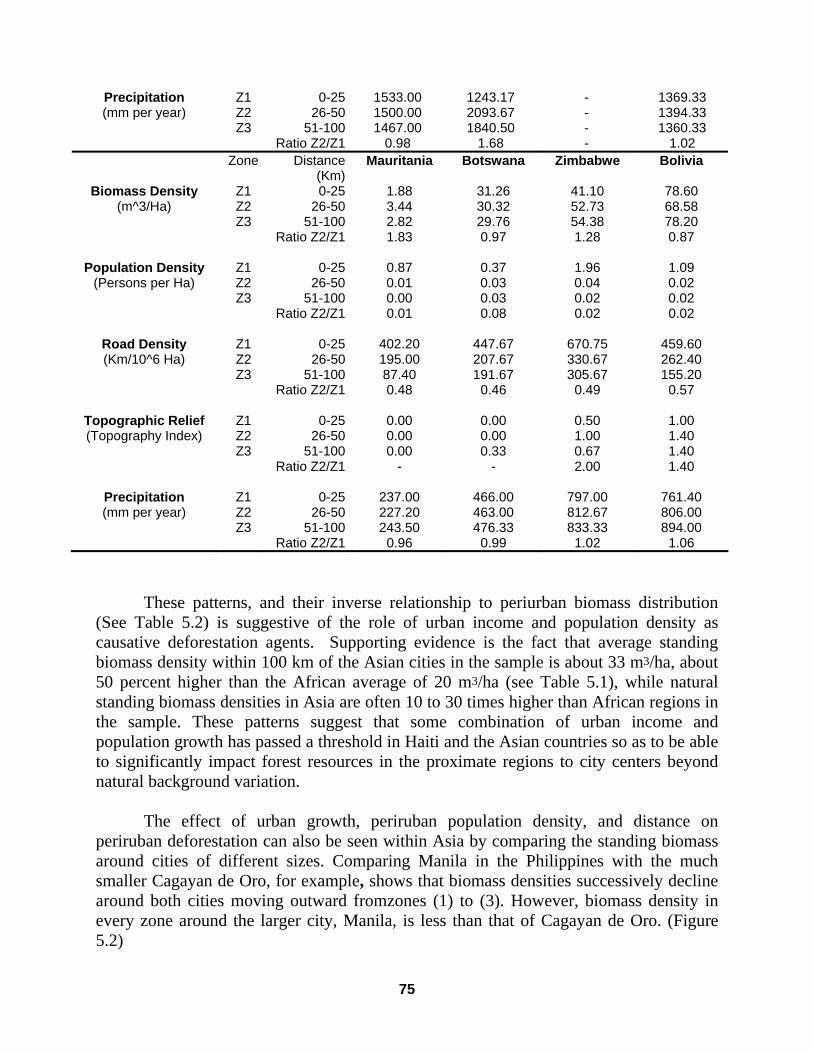
75
Precipitation Z1 0-25 1533.00 1243.17 - 1369.33 (mm per year) Z2 26-50 1500.00 2093.67 - 1394.33
Z3 51-100 1467.00 1840.50 - 1360.33 Ratio Z2/Z1 0.98 1.68 - 1.02 Zone Distance
(Km)Mauritania Botswana Zimbabwe Bolivia
Biomass Density Z1 0-25 1.88 31.26 41.10 78.60 (m^3/Ha) Z2 26-50 3.44 30.32 52.73 68.58
Z3 51-100 2.82 29.76 54.38 78.20 Ratio Z2/Z1 1.83 0.97 1.28 0.87
Population Density Z1 0-25 0.87 0.37 1.96 1.09 (Persons per Ha) Z2 26-50 0.01 0.03 0.04 0.02
Z3 51-100 0.00 0.03 0.02 0.02 Ratio Z2/Z1 0.01 0.08 0.02 0.02
Road Density Z1 0-25 402.20 447.67 670.75 459.60 (Km/10^6 Ha) Z2 26-50 195.00 207.67 330.67 262.40
Z3 51-100 87.40 191.67 305.67 155.20 Ratio Z2/Z1 0.48 0.46 0.49 0.57
Topographic Relief Z1 0-25 0.00 0.00 0.50 1.00 (Topography Index) Z2 26-50 0.00 0.00 1.00 1.40
Z3 51-100 0.00 0.33 0.67 1.40 Ratio Z2/Z1 - - 2.00 1.40
Precipitation Z1 0-25 237.00 466.00 797.00 761.40 (mm per year) Z2 26-50 227.20 463.00 812.67 806.00
Z3 51-100 243.50 476.33 833.33 894.00 Ratio Z2/Z1 0.96 0.99 1.02 1.06
These patterns, and their inverse relationship to periurban biomass distribution (See Table 5.2) is suggestive of the role of urban income and population density as causative deforestation agents. Supporting evidence is the fact that average standing biomass density within 100 km of the Asian cities in the sample is about 33 m3/ha, about 50 percent higher than the African average of 20 m3/ha (see Table 5.1), while natural standing biomass densities in Asia are often 10 to 30 times higher than African regions in the sample. These patterns suggest that some combination of urban income and population growth has passed a threshold in Haiti and the Asian countries so as to be able to significantly impact forest resources in the proximate regions to city centers beyond natural background variation. The effect of urban growth, periruban population density, and distance on periruban deforestation can also be seen within Asia by comparing the standing biomass around cities of different sizes. Comparing Manila in the Philippines with the much smaller Cagayan de Oro, for example, shows that biomass densities successively decline around both cities moving outward fromzones (1) to (3). However, biomass density in every zone around the larger city, Manila, is less than that of Cagayan de Oro. (Figure 5.2)

76
Figure 5.2 Standing Biomass around Cagayan de Oro and Manila, Philippines
Transportation Development Transportation development is also correlated with urban income growth and population density. The expansion of transportation infrastructure will increase the accessibility of biomass stocks to urban expropriators, as well as acts as an inducement for settlements, which are likely to intensify along transportation corridors. These populations may also place pressure on forest stocks. The impact of transportation development is another reason that land around Port au Prince Haiti and the Asian cities in the study has been heavily deforested. The average road density of Asian cities in the sample with 100 km of cities is 630 km/106 ha (see Table 5.1). The figure for Port-au-Prince is also very high, about 571km/106 ha. The African average is only 317 km/106 ha; for Bolivia, the figure is about 373 km/106 ha. In all countries in the study, transportation networks are more developed in the most proximate zone around cities (See Table 5.2). Since transportation development and population density are both inversely correlated with distance from cities, it is not necessarily distance as such – a proxy perhaps, for “pure transportation cost” -- that causes biomass to increase in the hinterlands. More sparsely developed transportation networks and lower population density may also lower deforestation pressures.
0-25 26-50 51-100 Distance of Zone from city (Km)
ManilaCagayan de Oro
0 20 40 60 80
100 120 140
Woody biomass (m 3 /ha)
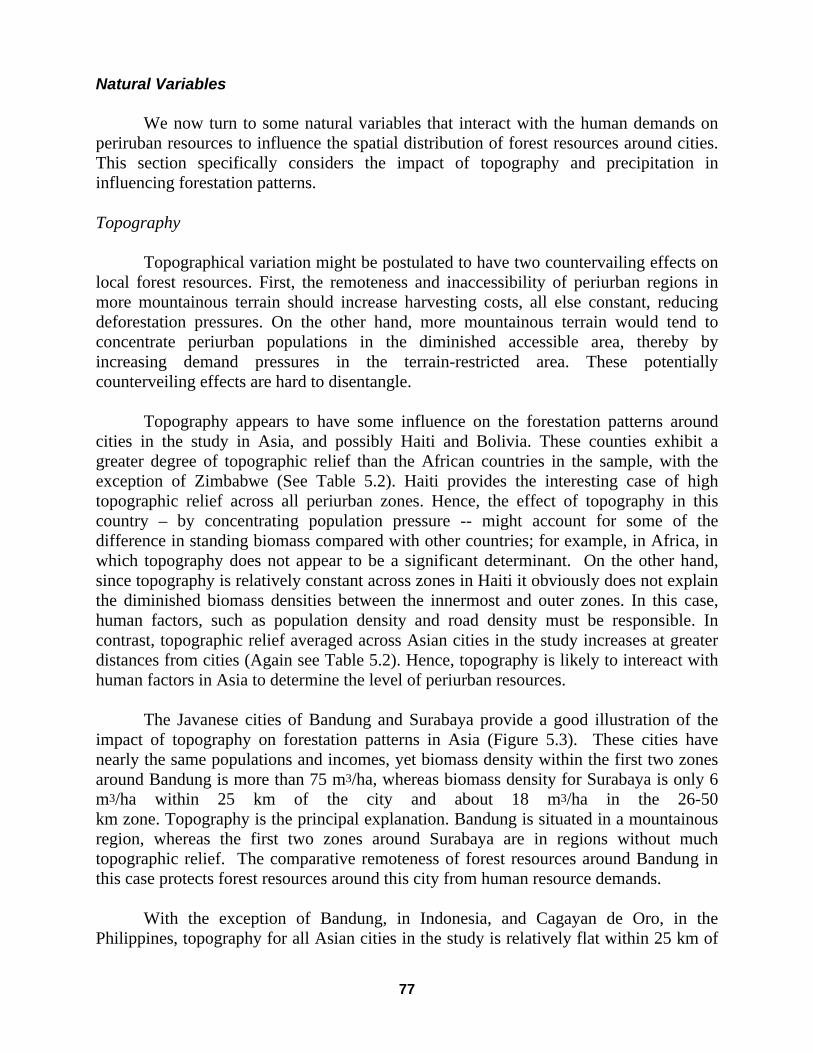
77
Natural Variables We now turn to some natural variables that interact with the human demands on periruban resources to influence the spatial distribution of forest resources around cities. This section specifically considers the impact of topography and precipitation in influencing forestation patterns. Topography Topographical variation might be postulated to have two countervailing effects on local forest resources. First, the remoteness and inaccessibility of periurban regions in more mountainous terrain should increase harvesting costs, all else constant, reducing deforestation pressures. On the other hand, more mountainous terrain would tend to concentrate periurban populations in the diminished accessible area, thereby by increasing demand pressures in the terrain-restricted area. These potentially counterveiling effects are hard to disentangle. Topography appears to have some influence on the forestation patterns around cities in the study in Asia, and possibly Haiti and Bolivia. These counties exhibit a greater degree of topographic relief than the African countries in the sample, with the exception of Zimbabwe (See Table 5.2). Haiti provides the interesting case of high topographic relief across all periurban zones. Hence, the effect of topography in this country – by concentrating population pressure -- might account for some of the difference in standing biomass compared with other countries; for example, in Africa, in which topography does not appear to be a significant determinant. On the other hand, since topography is relatively constant across zones in Haiti it obviously does not explain the diminished biomass densities between the innermost and outer zones. In this case, human factors, such as population density and road density must be responsible. In contrast, topographic relief averaged across Asian cities in the study increases at greater distances from cities (Again see Table 5.2). Hence, topography is likely to intereact with human factors in Asia to determine the level of periurban resources. The Javanese cities of Bandung and Surabaya provide a good illustration of the impact of topography on forestation patterns in Asia (Figure 5.3). These cities have nearly the same populations and incomes, yet biomass density within the first two zones around Bandung is more than 75 m3/ha, whereas biomass density for Surabaya is only 6 m3/ha within 25 km of the city and about 18 m3/ha in the 26-50 km zone. Topography is the principal explanation. Bandung is situated in a mountainous region, whereas the first two zones around Surabaya are in regions without much topographic relief. The comparative remoteness of forest resources around Bandung in this case protects forest resources around this city from human resource demands. With the exception of Bandung, in Indonesia, and Cagayan de Oro, in the Philippines, topography for all Asian cities in the study is relatively flat within 25 km of

78
cities. However, five of the eight Asian sample cities have hills and varied terrain in the 25 to 50 km zone. In the outermost zone, only Bangkok, located in a river delta, still is surrounded by relatively flat land. These topographic patterns interact with human factors to explain why biomass resources increase at greater distances from most of the Asian cities in the study. And the relatively flat terrain around Bangkok is part of the explanation why it has the least standing biomass in the outlying zones of any of the Asian city in the sample Precipitation and Other Variables Precipitation and other natural variables, such as soil conditions, temperature, and geology influence the biomass distribution around cities. At the level of country averages, precipitation is not a confounding variable with periruban distance in our study, since precipitation is relatively constant across zones around cities (See Table 5.2). On the other hand, the differences across countries in the level of precipitation (Table 5.1) may partially explain between-country differences in natural biomass densities. Notice the correlation between the first and last columns of Table 5.1.
Figure 5.3 Biomass Supply around Bandung and Surabaya, Indonesia
12.5 38 75.5
Distance from city (km)
SurabayaBandung
0
10
20
30
40
50
60
70
80
Woody biomass (m3 /ha)
Piercing beneath the veil of the country averages, we can see the influence of precipitation on biomass densities in particular cities in the study. Mutare, Zimbabwe, is a case in point (Figure 5.4). Standing biomass drops from about 62 m3/ha to 54 m3/ha moving from zone 1 to zone 2, about a 14% decline. Precipitation declines by 28% between these zones, and vegetation shifts from open montane forest (62 m3/ha) in zone 1 to mix in zone 2 that includes dry bushy savanna (33 m3/ha) and wood grassland (16

79
m3/ha). The changes in the natural variables in this case are sufficient to obscure the impact of any human-induced deforestation activities in the vicinity. Natural factors are also important determinants of the biomass pattern observed around cities in Bolivia. For example, virtually no standing biomass can be found around Oruro and La Paz, Bolivia, within 25 km of the cities (Figure 5.5). The biomass level for La Paz increases in the 26 to 50 km zone to about 24 m3/ha, whereas
Figure 5.4 Standing Biomass around Mutare, Zimbabwe
12.5 38.0 75.5 150 .5
Distance from city (km)
48
50
52
54
56
58
60
62
64
Woody biomass (m3/ha)
for Oruro it remains close to the zero level. This result might seem counterintuitive since the population of La Paz is five times greater than that of Oruro. The pattern is explained by the fact that while both cities are located at high elevation above timber line, zone 2 for La Paz is partially within a lower elevation region with humid montane forests having biomass densities of 126 m3/ha. Zone 2 for Oruro, on the other hand, remains largely above timberline.
80
Figure 5.5 Biomass around La Paz and Oruro, Bolivia
12.5 38 75.5
Distance from city (km)
OruroLa Paz
05
101520253035404550
Woody biomass (m3/ha)
The Potential Role of Urban Energy Consumption
The previous section showed how a combination of human and natural factors interact to influence the spatial distribution of forests around cities. We now focus more specifically on the potential role urban energy consumption could play in placing demand pressures on periruban forest stocks. Once urban residents move out of extreme poverty, the per capita consumption of traditional fuels as a category (woodfuel plus charcoal) persists at a relatively stable level until the higher income levels (see Table 3.2 and Figure 3.1). Fuel switching to modern fuels does not significantly occur until cities grow in size beyond the one million population level, and a significant upper middle class develops (Table 2.1). It is only for the wealthier and larger cities in our sample that the per capita consumption of traditional fuels is declining.
However, even when traditional fuel consumption declines on a per capita basis, the aggregate consumption level might continue to increase with growing urban populations due to the scale effect of economic expansion. Aggregate consumption is the better measure of the impact of urban energy utilization on biomass stocks around cities, since it is directly related to aggregate resource demand.
Table 5.3 rank orders cities by aggregate biomass consumption, from
highest to lowest (Column 1). The sample is subdivided approximately into thirds; the subtotals and averages refer to these groupings.

81
A number of interesting points are evident. First, each grouping has cities in all transitional stages of the energy transition. In fact, the top four cities in terms of aggregate biomass consumption include one city in Stage 3 (Bangkok) and three cities in Stage 2 (Lusaka, Port Au Prince, and Nouackchott). It is not until the fifth-ranked city is reached – Ouagadougou – that Stage 1 is encountered. Thus, it is certainly not the case that cities which pass out of stage 1 – the stage in which biomass consumption dominates – necessarily evince a decline in aggregate biomass consumption.
However, there is some relationship between energy transition stage and aggregate
biomass consumption. The average transition rank of the top third of the cities is 1.8, the middle third is 2.1, and the bottom third is 2.3 (last column of Table 5.3). These figures indicate an inverse relationship between energy transition stage and aggregate biomass consumption. However, it is not completely clear how strongly this correlation would hold if city size was held constant. For it

82
Table 5.3 Rank Order of Cities by Aggregate Biomass Consumption
__________________________________________________________________ Total
Biomass City Size Energy (KGOE/Mo) Wood % Biomass Charcoal % Biomass Rank* Stage
1 Lusaka 8626 1061.4 0.12 7564.6 0.88 10 2A2 Port Au Prince 8227 0.0 0.00 8227.0 1.00 8 2A3 Bangkok 5548 193.7 0.03 5354.3 0.97 3 34 Nouakchott 4866 127.1 0.03 4738.9 0.97 13 2A5 Ouagadougou 4538 4520.8 1.00 17.2 0.00 14 16 Manila 4513 1925.8 0.43 2587.2 0.57 1 2C7 Kitwe 4355 1504.7 0.35 2850.3 0.65 16 2A8 Davao 2713 2346.2 0.86 366.8 0.14 9 19 Surakarta 2381 1891.6 0.79 489.4 0.21 11 2B
10 Bobo Dioulasso 2364 2197.1 0.93 166.9 0.07 18 111 Yogyakarta 2205 1529.5 0.69 675.5 0.31 12 2B
Subtotals 50336 17298.0 * 33038.0 * * * Averages 4576 1573.0 0.34 3003.0 0.66 10.5 1.8
12 Luanshya 1862 496.9 0.27 1365.1 0.73 23 2A13 Jakarta 1625 1000.8 0.62 624.2 0.38 2 2B14 Sanaa 1485 1205.9 0.81 279.1 0.19 15 315 Livingstone 1389 596.5 0.43 792.5 0.57 24 116 Semarang 1154 989.6 0.86 164.4 0.14 6 2B17 Bandung 1004 608.4 0.61 395.6 0.39 4 2B18 Cagayan de Oro 837 802.3 0.96 34.7 0.04 17 119 Surabaya 609 388.2 0.64 220.8 0.36 5 2B20 Chiang Mai 603 87.0 0.14 516.0 0.86 22 321 Hoeida 562 355.4 0.63 206.6 0.37 20 2C22 Tiaz 548 416.6 0.76 131.4 0.24 21 3
Subtotals 11678 6947.6 * 4730.4 * * * Averages 1062 632.0 0.59 430.0 0.41 14.5 2.1
23 Koudougou 498 478.6 0.96 19.4 0.04 27 124 Ouahidougou 389 358.4 0.92 30.6 0.08 29 125 Nouadhibou 310 0.0 0.00 310.0 1.00 26 2A26 Kiffa 284 43.2 0.15 240.8 0.85 33 2A27 Atar 266 0.0 0.00 266.0 1.00 32 2A28 Tarija 193 193.0 1.00 0.0 0.00 25 329 La Paz 173 173.0 1.00 0.0 0.00 7 330 Trinidad 156 156.0 1.00 0.0 0.00 28 2C31 Kaedi 102 22.5 0.22 79.5 0.78 34 2A32 Quillacollo 95 95.0 1.00 0.0 0.00 31 333 Oruro 72 72.0 1.00 0.0 0.00 19 334 Ayutthaya 67 11.5 0.17 55.5 0.83 30 3
Subtotals 2605 1603.2 * 1001.8 * * * Averages 217 134.0 0.62 83.0 0.38 26.8 2.3
*1= highest population; 2=second highest, etc. __________________________________________________________________
83
is also evident that there is a direct relationship between the size of cities and aggregate biomass consumption. With the exception of La Paz and Oruro, the bottom cohort tends to be the smallest group of cities in the study -- as well as the cities relatively more advanced (as a cohort average) along the energy transition. And the top group of cities tend to be the larger cities, as well as cities less further along the energy transition. The middle third of the cities lies in between the top and bottom third. The corresponding city size rank (second to last column in Table 5.2) averages 10.5, 14.5, and 26.8 (out of 34) for the top, middle, and bottom group of cities respectively.
These trends show that the per capita consumption of biomass fuels can be
relatively low, and yet aggregate consumption relatively high. In such a cities as Bangkok and Manila, populations are large enough to generate substantial aggregate resource demand, even with relatively low per capita biomass consumption. In this case, declines in aggregate biomass energy consumption can lag behind the per capita trends, and the demand pressures on surrounding forested land can continue even after cities have reached the later stages of the modern fuels transition.
Another striking fact is the increase in the number of cities in stage 2 moving from
the bottom to the top cohort; in fact, the majority of cities in the top two cohorts are in Stage 2. The following stylized scenario seems consistent with this and the previous observations. In the “general case”, cities start out small, and biomass is the dominant fuel. As they grow in size and economically develop, consumers begin to fuel switch to the transitional fuels, and the per capita consumption of biomass fuels ultimately declines. But the aggregate level of biomass consumption continues to rise for a significant part of stage two because the correlated city size expansion initially dominates any decline in per capita biomass fuels consumption. This statement would hold less strongly for less rapidly growing cities, and more strongly for more rapidly growing cities. In the latter case, it would be possible to generate substantial aggregate demand for biomass energy even in stage 3 if the scale effect of the population increase continues to dominate the per capita decline in biomass consumption. Bangkok is an illustrative case in the present study.
We would further note that a number of researchers have documented a
relationship between poverty and population growth (e.g., Dasgupta 1999), and that Chapter 4 documents a relationship between poverty and the propensity for consumers to consume biomass-based fuels. Putting these factors together suggests that aggregate biomass consumption is likely to remain higher for a longer period of time in poorer, rapidly growing cities, than in wealthier, slower growing cities. A city such as Ougaadougou would illustrate the first case (Rank number 5 for aggregate biomass consumption); a city such as Quillacollo, Bolivia (Rank number 32) would illustrate the second.

84
Another important point to note is the relative increase in the share of charcoal in aggregate biomass consumption as one moves from the bottom to top group of cities. Charcoal accounts for 66% of aggregate biomass consumption for the top third of the cities; for 41% for the middle third, and for 38% percent for the bottom third (See third-to-the-last column in Table 5.2). The data reflects the importance of charcoal as a stage 2 transition fuel, and the fact that the cities in Stage 2A of the urban energy transition – the stage marked by a switch from woodfuel to charcoal – dominate in the high biomass consumption group. It is clear that cities that follow the charcoal-dominated transition path to modern energy usage will impose relatively large demands on the resource base during the transition period. In this regard, it is instructive to compare Jakarta, the largest city in the study, and Manila the second largest. Although Jakarta’s population was 2% larger than Manila’s at the time of the energy surveys, the aggregate biomass consumption of Manila (ranked 6th) was 2.8 times higher than for Jakarta (ranked 13th), and the aggregate charcoal consumption for Manila was 4.1 times higher. Note that Manila is in transitional stage 2C – the stage in which undistorted market policies allows a relatively diversified fuel consumption mix -- while Jakarta is in transitional stage 2B, a stage in which kerosene is a dominate transition fuel. Although a number of factors could partially explain this difference, it seems likely that the kerosene subsidy in Indonesia has both had the effect of reducing the total aggregate demand for biomass-based fuels and reducing particularly the demand for charcoal as a transitional fuel. Presumably, the difference in the consumption profiles between Jakarta and Manila would have been even more extreme had Manila followed the Stage 2A transition path, i.e., provided incentives for charcoal consumption. In any event, the actual difference in biomass consumption associated with the stage 2B and 2C transition paths actually followed by Jakarta and Manila suggests that the impact on periurban resources from cooking energy during the Stage 2 transition has been substantially more significant in Manila than in Jakarta
Implications for Indoor Air Pollution Exposure Risk
Like the “energy crises” which was first conceived of as problem for developed economies, concerns about indoor air pollution first gained attention in the developed world. Indeed, indoor air pollution concerns were at first linked to the developed world’s energy supply problems. In the post oil embargo period of the late 1970s, the Carter administration launched a set of policy proposals designed to conserve energy in residences and commercial buildings. “Tightening up the building shell” was among the conservation options available for reducing building energy consumption, but it soon became evident that reducing the air exchange in buildings not only conserved energy but also had the potential to increase the concentration of indoor air pollutants. Since the majority of people spend the majority of their time indoors, the quality of indoor air they breath has obvious health implications. Moreover, the quality of indoor air had not been

85
controlled for in previous studies assessing the health impacts of outdoor air, raising questions about the accuracy of the risk assessments in these studies.
These concerns are still pertinent today, but the attention of researchers has also begun to intensively focus on indoor air pollution problems in developing countries. The issue is now seen as a top health priority of international development agencies including the World Health Organization (WHO) of the UN. An important concern relates to the potential health effects of biomass-based cooking. Biomass-based cooking fires produce high emissions rates of combustion products like respirable particulates, C0, TSP, NO2, and PAH due to poorly-controlled combustion – a common condition in developing countries. Inadequate venting to the outside and poor home ventilation, also common occurrences, translate emissions rates into high indoor air concentrations. The concentrations of combustion-generated pollutants in the indoor air of households in developing countries are extremely high—sometimes much higher than WHO standards and national guidelines (Smith 2002).
The high exposure risk particularly of women and children compounds concerns about indoor air pollution. The proximity of the pollution source and recipients is orders of magnitudes greater for cooking-fire generated pollution than for pollutants produced from outside sources. Women and children, who spend considerable time indoors around cooking fires, face high exposure risks (Smith et. al., 2000; Smith 2003; Smith and Mehta, 2003). Of particular concern in the literature is the contribution of indoor air pollution to the incidence of acute respiratory infections (ARI). Young children living in homes in which biomass fuels are used for cooking are two to three times more likely to contract ARI than unexposed children, when other factors are controlled for (Smith 2002). ARI is a significant health problem in developing countries. Other respiratory ailments, such as chronic bronchitis, are also linked to indoor air pollution from cooking. Women cooking around biomass fires for a number of years are two to four times more at risk from chronic obstructive pluminary disease (COPD) than unexposed women (Smith 2002). There are a number of other possible health effects, such as asthma. Health effects research is now very active in the indoor air pollution field. What are the implications of our data with respect to indoor air pollution exposure risks? There would appear to be several. First, moving out of poverty – increasing income beyond the very lowest income class -- would appear to reduce indoor air pollution exposure risk, all else constant, because a decline in the per capita consumption of both wood fuel and charcoals is observed moving above the lowest income point (See Table 3.2 and Figure 3.1). Beyond that point, however, the per capita consumption of biomass-based fuel (wood plus charcoal) is relatively stable until the highest income levels (again see Table 3.2 and Figure 3.1), suggesting that there is a relatively wide range of incomes for which some groups of urban residents will be experiencing indoor health pollution health effects for a relatively long period of time. Public policies and
86
resource conditions are likely to cause some variation of exposure risk within this middle income range, however. Middle income consumers in cities with substantial surrounding biomass resources or government policies that impede the development of the modern fuels sector -- or discourage cleaner-burning transitional fuels, like kerosene -- are likely to have the highest exposure risk from indoor air pollution. Contrariwise, residents of cities without extensive biomass resources, or subject to policies that encourage a more rapid transition to clean transitional fuels, or modern fuels, will face lower exposure risks to indoor air pollution. The possibility of relatively high aggregate biomass consumption particularly in stage 2 cities (see Table 5.3), in conjunction with relative constancy in per capita consumption trends with city size and income until the highest levels (see table 2.1 and 3.2) suggests that the total population exposed to indoor health pollution risk does not decline significantly until the very end of the energy transition. However, this may be mitigated by the use of charcoal which often poses a regional deforestation problem, but gives off lower levels of indoor air pollutants. Again, variations from this generalization likely reflect periurban resource conditions, public policy, and income distribution. Cities with larger low income populations, more abundant periurban biomass resources, and government policies that discourage modern fuel use are most likely to have sizeable populations that experience indoor air pollution risks for a long period of time. Finally, it is worth noting the special case of China, a country in which the lower and middle income classes generally use coal as cooking fuel. Indoor coal combustion poses obvious health risks to occupants that will persist until ventilation systems are satisfactory, or a complete transition to modern fuels is made (Lan, 2002).
Conclusions and Policy Implications
As a general pattern, biomass stocks around urban areas are inversely correlated with population densities and transportation development in and around cities, and directly correlated with distance from the urban center -- up to around 50 Km. However, location-specific factors are likely to cause a unique expression of the deforestation pattern around each urban area. Natural environmental variables, including topographic variation and different precipitation patterns, are the factors most likely to inject irregularities into what would otherwise be a smooth expansion of the deforestation perimeter as cities economically develop. The data suggest that deforestation has been more pronounced around the cities in the study in Asia and Haiti than in Africa and Bolivia, in the sense that variation in standing biomass attributable to human action stands out more clearly above the background variation caused by natural factors in these regions. Even in Asia, though, the interaction of urban expansion and natural variables is evident. A striking example is a comparison of Bandung and Surabaya Indonesia, cities of comparable size and economic developmental status, but with greatly different levels of periurban standing biomass. The
87
relatively abundant resources around Bandung are attributable to mountainous terrain which reduces the accessibility of the resource.
It is also clear that urban energy-driven pressures on the forest base can continue as cities go through the urban energy transition. We surmise that aggregate biomass consumption is likely to be particularly high from the end of stage 1 through the end of stage 2, especially for cities that follow the charcoal-dominated Stage 2A transition route. Given the number of larger cities in stage 2 that account for the most aggregate biomass consumption, it is evident that per capita declines in biomass-based fuels consumption are not sufficient to compensate for the scale effect of expanding urban populations. The scale effect may dominate even after cities have passed through the energy transition to modern fuels. Bangkok is a city in Stage 3 of the energy transition, yet has the third largest aggregate consumption of biomass fuels of the 34 cities in the study.
These facts have obvious implications for indoor air pollution exposure risks.
Indeed, the continuing risk of indoor air pollution exposure through stage 2 and into stage 3 if anything is greater than the probability that biomass fuels consumption will continue to impose pressure on periurban forested land. The reason is that there are many pressures on forested land besides the demand for biomass fuel, so it is not presumptively obvious what the total impact of biomass fuels consumption is relative to the sum total of all deforestation forces. Moreover, biomass fuel demand can be met by supply expansion. In contrast, the link between indoor air pollution exposure risk and biomass-based cooking is direct. Unless residents change habits (for example, keep children away from cooking fires), use more efficient stoves, or improve ventilation systems, continuing use of biomass fuels will lead to continuing exposure risks.
Although longitudinal study would be needed to reach a definitive conclusion, the
described pattern does not strongly suggest the existence of an environmental Kuznets curve in our sample of cities in which aggregate biomass consumption declines after a particular urban growth threshold. Certainly no city in the study has reached the stage of cities in advanced economies where aggregate biomass consumption is negligible, and there are almost no resource demands placed on periurban resources, or indoor air pollution exposure risk, through biomass energy consumption.
Clearly there is wide window of opportunity for policy intervention to address periurban deforestation, and indoor air pollution exposure risks. Policies to reduce biomass fuels consumption can continue throughout the energy transition. Encouraging interfuel substitution away from charcoal users in such large cities as Bangkok or Manila could significantly reduce indoor air pollution exposure risks, and possible deforestation pressures.

88
6. THE ENERGY TRANSITION IN HYDERABAD, INDIA: A CASE STUDY
Introduction
Past chapters have exploited the information contained in comparative analyses of urban energy consumption and periurban resource impacts in a large sample of cities in Africa, Asia, and Latin America. This chapter departs from the cross sectional approach to consider a specific household energy survey conducted in Hyderabad India.8 Trends in urban energy consumption and biomass supplies are documented and assessed in this survey. The Hyderbad case manifests many of the patterns and results previously discussed, for example, the role of governmental policy, resource constraints, and income disparities in influencing fuel choice and consumption levels, and the effects of evolving urban energy patterns on biomass stocks (Alam, Sataye, and Barnes, 1998). The Hyderabad results are also compared with those obtained in a study conducted for Hyderabad City during the period of 1981-82 (Alam, Dunkerley, Gopi and Ramsay, 1985; Bowonder Prasad, and Unni, 1988; Bowonder Prasad and Raghuram, 1987a), and with other urban studies in India as well (Alam, Dunkerley, and Reddy, 1985; Nair and Krishnaya, 1985; Reddy and Reddy, 1983, 1984). This longitudinal comparison provides additional insight into the way in which the factors previously analyzed influence the urban energy transition.
Interfuel substitution for urban households is taking place rapidly in Hyderabad.
Much of the growth in the consumption of modern fuels has come from the liberalization of energy markets and increased availability of such fuels as LPG, along with the increasing purchasing power of middle and higher-income groups. It is likely that this trend will continue and even accelerate during the coming decades.
The structure and composition of domestic energy consumption in metropolitan
Hyderabad is assessed in this chapter, with particular emphasis on the extent of the transition from traditional to modern fuels over the past decade. The impact of this transition on fuelwood demand and its effects on surrounding rural areas is also evaluated in this chapter.
8 This chapter presents the results of a more detailed report entitled India: Household Energy Strategies for Urban India: The Case of Hyderabad. (World Bank, 1999), which was produced as part of the World Bank ESMAP program. The study is unique because energy use comparisons were possible because of study conducted in 1981-82.

89
Energy Policies and Programs Affecting Urban Hyderabad
Because the markets for energy in urban Hyderabad have strongly influenced by policies of the national government, we begin this chapter with an overview of the main policies influencing the urban energy sector. These policies include household fuel subsidy programs for petroleum products, limits on the import of petroleum products, and electricity distribution and pricing policies. Kerosene Subsidies through Ration Card Program
Kerosene has long been viewed as a poor person’s fuel in urban India and the government has utilized a public distribution system for promoting the sale of kerosene products. Consumers are issued ration cards that cover a variety of products, including basic foodstuffs such as rice, as well as kerosene. A ration card permits the holder to purchase the covered products from designated retailers called ration shops. Kerosene is available at the ration shops in limited quantities at subsidized prices. In theory, kerosene in India is sold only through ration shops; other kerosene sales are illegal. Although the ration card system is helping poor people afford kerosene, it is not well targeted since it also benefits more middle class wealthy households. In fact, the poorest households without addresses cannot obtain ration cards and are paying world market prices for kerosene, or are using very expensive fuelwood. In addition, the ration shops often receive kerosene only periodically, so the availability of the fuel is sporadic. LPG Distribution through Government-Affiliated Retailers
LPG has traditionally been distributed through retail dealers associated with the national petroleum companies. The distribution companies had exclusive rights to sell LPG, but they were required to follow pricing policies set by the government. The pricing policies are based on the principle that LPG should be sold at a price that reflects internal production costs in India, regardless of the world market price. However, there was not enough LPG produced within India to satisfy fuel demand. As a consequence, a system was developed to limit the number of families that could purchase LPG from the distribution companies. The LPG retailers developed customers lists, limited the number of LPG bottles customers could have, and serviced only customers on that list. Retailers have tended to concentrate on established⎯ and typically well-off⎯ customers because their supplies are insufficient to meet the total demand. Other customers are put on a waiting list. Because LPG is a highly desirable cooking fuel and fairly inexpensive compared to wood and other fuels, tens of thousands of people put their names on the waiting list to obtain LPG.
90
Recent policies have opened up the LPG market to private retailers, but they are permitted to sell only imported LPG. The price of LPG from these retailers is higher than the price that must be paid to the government-affiliated retailers. The combination of an increased number of private retailers and an expansion of LPG supply to government-affiliated retailers has resulted in a tremendous growth in LPG use in Hyderabad. The increasing LPG supplies have meant that the market for this product has expanded among middle and high-income consumers, and even some poor consumers. It also has meant that the annual subsidy going to LPG users in Hyderabad at the time of the survey was approximately US$ 10 million in Hyderabad alone, and about US$500 million for India as a whole. This figure has risen to well over US$ 1billion today. This study finds that the middle class and wealthy appreciate the convenience of LPG and will continue to use it even with higher prices. Also the switch to LPG has had the benefit of freeing up kerosene for the urban poor. Electricity and the State Electricity Boards
In most of India, State Electricity Boards supply the electricity to urban households. The State Electricity Board is a vertically integrated government monopoly that controls production, transmission, and distribution of electricity to urban households. Although urban households receive some subsidies as a result of electricity pricing policies, the main subsidies in the electricity sector go to rural agricultural consumers. The State Electricity Boards are suffering financial strain because of these agricultural subsidies, and at the same time are under great pressure to provide better service to urban consumers. By trying to maintain near-universal service levels with limited financial resources, the quality of service has declined significantly, including many brownouts, blackouts, and voltage drops. The public opinion in Hyderabad toward State Electricity Board is quite negative. Focus group interviews of middle class and higher-income households reveal support for reforming and liberalizing the distribution of electricity, even if it means higher prices. There was not a similar level of support from poor people, so special consideration should be given to dealing with their problems in the event of market reforms. Fuelwood as Sole Market-Based Household Fuel
Whereas modern fuels are heavily regulated, the fuelwood trade in Hyderabad is based on market principles. The main trend for fuelwood has been a shift from serving household customers to commercial ones. In the space of nearly 15 years, the number of people using fuelwood as a cooking fuel has declined significantly, so the market has contracted and re-oriented itself toward other customers. Many commercial customers are using wood to replace or to enhance the poor-quality coal previously used in their enterprises. Deforestation in the Hyderabad region has slowed considerably as a result of this consumption shift. Existing policies should be strengthened to maintain this important trend.

91
To summarize, government policies have been extremely important in shaping household energy demand in Hyderabad. As will be discussed later, the energy consumption subsidies in urban Hyderabad are quite large (over 80 million rupees per month) and are likely to continue to grow as more people switch to modern fuels. Unfortunately, these subsidies, which are meant to help the poor, are not very well directed. In fact, the majority of the subsidies end up in middle and upper-class households that can afford to pay market rates for fuels. Moreover, policies to limit imports of fuels create periodic local scarcities. In such scarcity situations, it is the poor who are most disadvantaged, as evidenced by the fact that they had no access to kerosene until LPG became more widely available for middle class households.
The Transition to Modern Fuels in Hyderabad
In this section, the structure and composition of energy consumption in metropolitan Hyderabad are evaluated, with particular emphasis on the transition from traditional to modern fuels during the last decade. To obtain a profile of the transition in fuel use over the years, the results of the present study are compared with those obtained in a study conducted for Hyderabad City during the period of 1981-82 (Alam, Dunkerley, Gopi and Ramsay, 1985). This section examines the overall patterns of energy use in Hyderabad, along with the changes in energy use in urban households. Overall Patterns of Total Energy Use
The total demand for energy in the household sector is determined by the demand of the various energy-dependent domestic functions such as cooking, water heating, lighting, air cooling, and entertainment. A mix of commercial and traditional energy sources meets this energy demand. The survey reveals that the predominant commercial fuels are electricity, and petroleum products in the form of kerosene and LPG. Fuelwood is the main traditional energy source used, while agricultural residue, sawdust, dung, and charcoal are a negligible proportion (less than 1 percent) of the total fuel mix. The main fuels studied in this chapter are therefore firewood, kerosene, LPG, and electricity.
The total household energy consumption in Hyderabad at the time of the survey, including fuelwood, is about 2,500 metric tons of oil equivalent per month. The proportionate share of the different fuels used is illustrated in Figure 6.1. As indicated, the use of fuelwood is rapidly disappearing and now constitutes just over 10 percent of total household energy consumption. (This amount is even less when the relative efficiency of fuels is taken into consideration.) As will be illustrated later, this is a dramatic change compared to 1982.
Figure 6.1 Fuel Sources for Household Energy Use, Hyderabad, 1994 (total energy use = 25.6 Million KgOE per month)
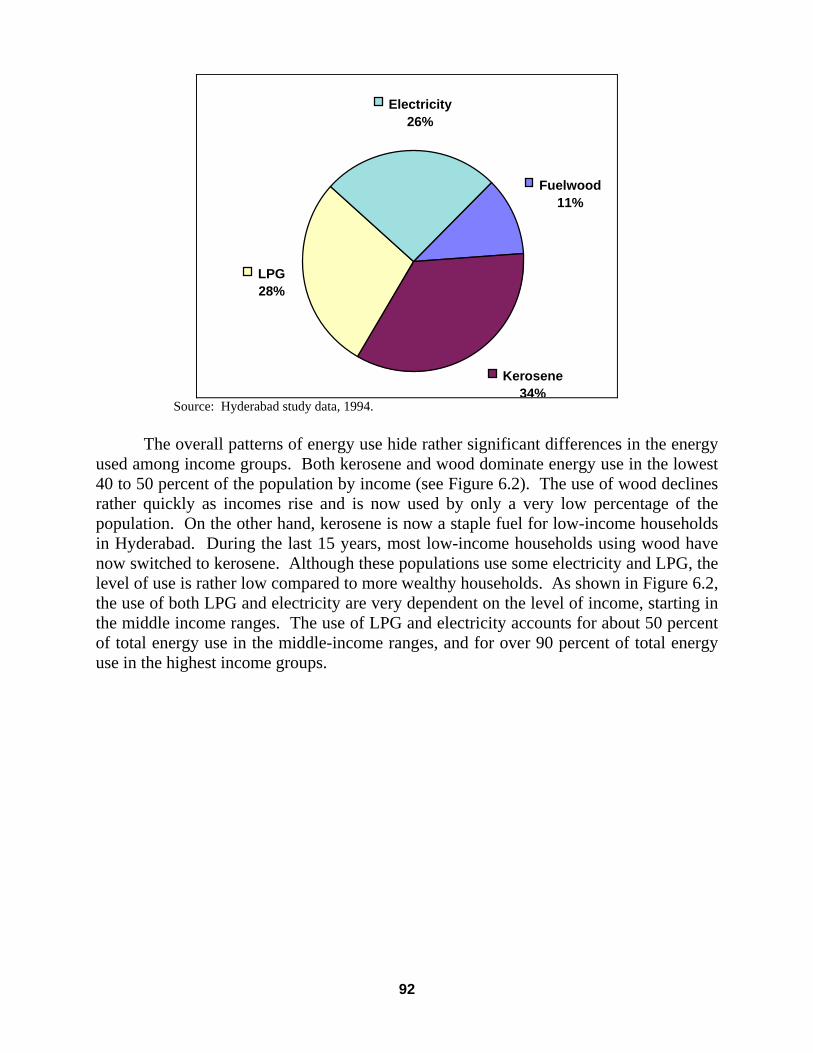
92
Fuelwood11%
Kerosene34%
LPG28%
Electricity26%
Source: Hyderabad study data, 1994.
The overall patterns of energy use hide rather significant differences in the energy used among income groups. Both kerosene and wood dominate energy use in the lowest 40 to 50 percent of the population by income (see Figure 6.2). The use of wood declines rather quickly as incomes rise and is now used by only a very low percentage of the population. On the other hand, kerosene is now a staple fuel for low-income households in Hyderabad. During the last 15 years, most low-income households using wood have now switched to kerosene. Although these populations use some electricity and LPG, the level of use is rather low compared to more wealthy households. As shown in Figure 6.2, the use of both LPG and electricity are very dependent on the level of income, starting in the middle income ranges. The use of LPG and electricity accounts for about 50 percent of total energy use in the middle-income ranges, and for over 90 percent of total energy use in the highest income groups.
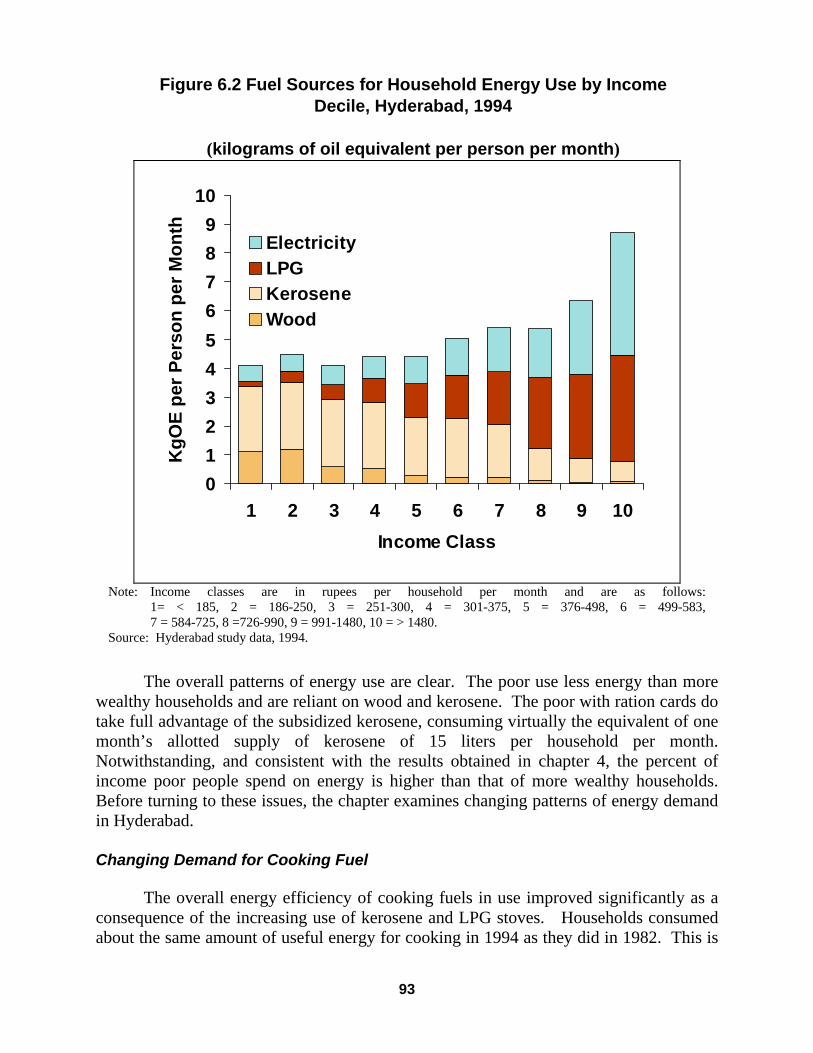
93
Figure 6.2 Fuel Sources for Household Energy Use by Income Decile, Hyderabad, 1994
(kilograms of oil equivalent per person per month)
0123456789
10
1 2 3 4 5 6 7 8 9 10Income Class
KgO
E pe
r Per
son
per M
onth
ElectricityLPGKeroseneWood
Note: Income classes are in rupees per household per month and are as follows:
1= < 185, 2 = 186-250, 3 = 251-300, 4 = 301-375, 5 = 376-498, 6 = 499-583, 7 = 584-725, 8 =726-990, 9 = 991-1480, 10 = > 1480.
Source: Hyderabad study data, 1994.
The overall patterns of energy use are clear. The poor use less energy than more wealthy households and are reliant on wood and kerosene. The poor with ration cards do take full advantage of the subsidized kerosene, consuming virtually the equivalent of one month’s allotted supply of kerosene of 15 liters per household per month. Notwithstanding, and consistent with the results obtained in chapter 4, the percent of income poor people spend on energy is higher than that of more wealthy households. Before turning to these issues, the chapter examines changing patterns of energy demand in Hyderabad. Changing Demand for Cooking Fuel
The overall energy efficiency of cooking fuels in use improved significantly as a consequence of the increasing use of kerosene and LPG stoves. Households consumed about the same amount of useful energy for cooking in 1994 as they did in 1982. This is

94
logical, as it requires only so much useful energy to cook food. However, the amount of energy used to produce the approximately 9.5 kilograms of oil equivalent of useful energy for household cooking is 30 percent less in 1994 compared to 1982 (see Table 6.1). The reason is that the switch from fuelwood to both kerosene and LPG has resulted in lower requirements for input energy. An additional benefit is that harmful fuel-based smoke and cooking fumes also have significantly decreased in urban households in Hyderabad.
Table 6.1 Average Monthly Household Input and Useful Cooking Energy Consumption, by Fuel Type, Hyderabad, 1982 & 1994
Fuel Type
Input energy (KgOE/month/HH)
Useful energy (KgOE/month/HH)
1982 1994 1982 1994 Firewood 13.3 2.1 2.0 0.3 Kerosene 8.4 11.0 2.9 3.9 LPG 7.0 8.9 4.2 5.3 Total cooking energy 28.8 22.0 9.2 9.5 Source: (1) Alam et al, Fuelwood in Urban Markets, 1985. (2) Hyderabad survey data, 1994.
The factors that influence the transition from firewood are the greater availability of fuels like kerosene and LPG and the relative prices of those fuels vis-à-vis firewood. As noted, while the government subsidizes kerosene and LPG prices, market forces determine the cost of firewood, especially in urban areas. The increasing scarcity of biomass supplies has resulted in an increasing price for fuelwood. In Hyderabad, the price of firewood increased from just above 5 rupees to over 15 rupees per kilogram of oil equivalent for useful energy between 1981 and 1994 (see Figure 6.3). By contrast, both kerosene and LPG increased from just over 5 rupees to between 9 and 10 rupees per kilogram of oil equivalent in the same period. These figures show that the price of firewood in Hyderabad has increased more rapidly than the prices of both LPG and kerosene, providing an incentive to fuel switch from fuelwood to kerosene and LPG. On the basis of daily household operating expenses, modern fuels such as kerosene and LPG have become much more affordable than wood for cooking.
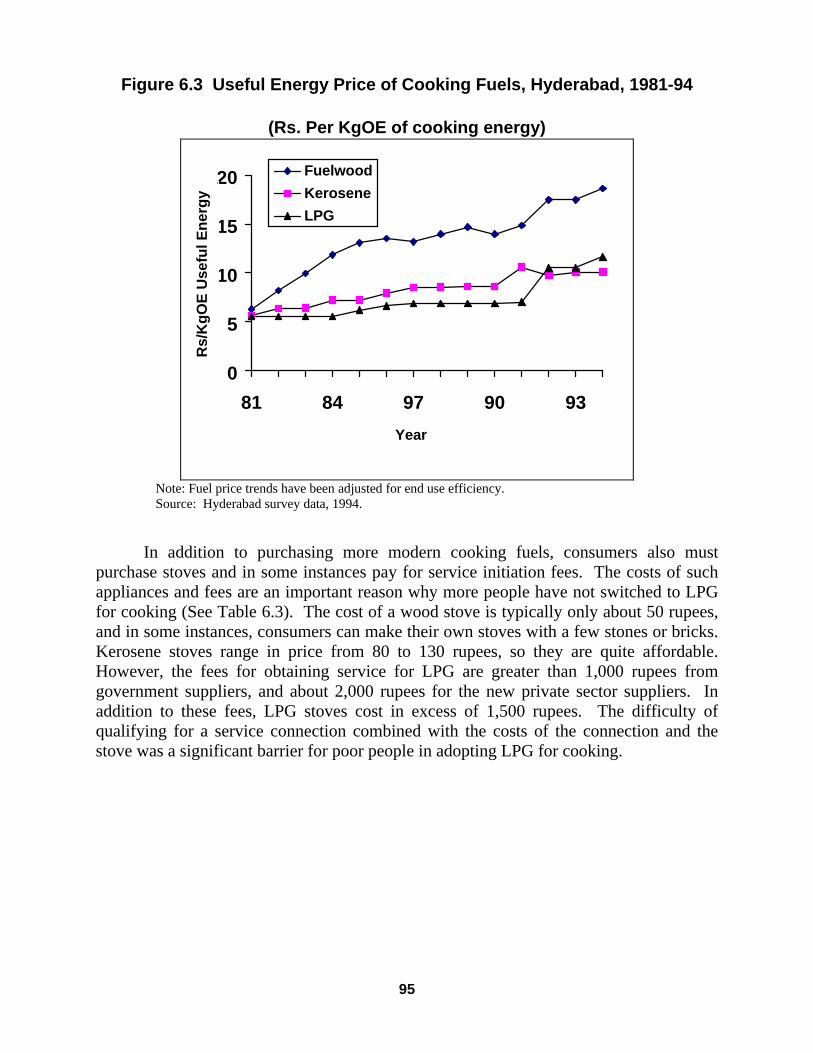
95
Figure 6.3 Useful Energy Price of Cooking Fuels, Hyderabad, 1981-94
(Rs. Per KgOE of cooking energy)
0
5
10
15
20
81 84 97 90 93Year
Rs/
KgO
E U
sefu
l Ene
rgy
FuelwoodKeroseneLPG
Note: Fuel price trends have been adjusted for end use efficiency. Source: Hyderabad survey data, 1994.
In addition to purchasing more modern cooking fuels, consumers also must purchase stoves and in some instances pay for service initiation fees. The costs of such appliances and fees are an important reason why more people have not switched to LPG for cooking (See Table 6.3). The cost of a wood stove is typically only about 50 rupees, and in some instances, consumers can make their own stoves with a few stones or bricks. Kerosene stoves range in price from 80 to 130 rupees, so they are quite affordable. However, the fees for obtaining service for LPG are greater than 1,000 rupees from government suppliers, and about 2,000 rupees for the new private sector suppliers. In addition to these fees, LPG stoves cost in excess of 1,500 rupees. The difficulty of qualifying for a service connection combined with the costs of the connection and the stove was a significant barrier for poor people in adopting LPG for cooking.

96
Table 6.2 Stove and Connection/Bottle Costs for Cooking Fuels, Hyderabad, 1994
Cost Type and Fuel Cost
(rupees) Stove Wood Approx. 50 Kerosene-Ordinary 80-90 Kerosene-Pressure 120-150 Kerosene-Wick 135-150 LPG Stove 1500-3000
LPG National Sector Connection Charges
Deposit 900 Regulator 100 Cylinder 108
LPG Private Sector Connection Charges
Deposit & Regulator 1950 2nd Cylinder 189
Source: Hyderabad survey data, 1994.
As a result of the significant differences in the costs of sources of cooking energy,
the proportion of households depending exclusively on firewood has fallen drastically, from 13 percent in 1982 to only 1 percent in 1994 (see Figure 6.4). Likewise, the percentage of households employing a mix of wood and kerosene has declined from 16 percent to 8 percent. Meanwhile, there has been a significant increase in the number of people using both kerosene and LPG. The percentage of people using only kerosene for cooking has increased from 28 to 37 percent. The equivalent growth for LPG has been from 21 to 33 percent. These figures clearly illustrate the transition from the use of fuelwood to kerosene and LPG for cooking.

97
Figure 6.4 Changes in Household Choice of Cooking Fuels, Hyderabad, 1982 & 1994
0%
20%
40%
60%
80%
100%
1982 1994
% H
ouse
hold
s U
sing
Fue
ls
K
K
Wood Only
Source: Alam, M. et al, Fuelwood in Urban Markets, 1985; Hyderabad survey data, 1994.
The rate at which the transition is taking place may not be discerned in studies that cover relatively short periods of time. This is demonstrated by the survey data on the levels of fuel use over the three years prior to the 1994 survey date, as shown in Table 6.3. Based on recall questions in the survey, between 60 and 70 percent of all households using a particular energy source recorded no change in their consumption of kerosene, fuelwood, or LPG. However, people generally perceived that they are using more energy now compared to three years ago. Such changes in consumption are probably due to some interfuel substitution, changes in family size, or changes in cooking habits due to increasing income. Table 6.3 Fuel Use Reported by Households for Three Years Prort to 1994 Survey,
Hyderabad (Percentage of Consuming Households)
Fuel Type
Use more now than
before
Use less now than
before
Use same now as before
Did not use Kerosene Fuelwood
LPG
23 23 18
12 13 7
64 61 70
1 - 5
Source: Hyderabad survey data, 1994.

98
Near-Universal Electricity Coverage in Hyderabad City
In spite of the rapid growth of metropolitan Hyderabad, the city has achieved near-universal electricity service. The survey indicates that over 98 percent of households are grid connected and served by the State Electricity Board. In 1981, the number of households with electricity was officially listed at about 50 percent of the urban population, although actual figures may have been higher because of unregistered connections. Notwithstanding the significant problems with the quality of electricity service, it is evident from the survey that all people in the city benefit from the availability of electricity.
A Shift from Coal to Fuelwood in the Commercial Sector
As mentioned, the decline in fuelwood use by households in urban Hyderabad documented in this study is not duplicated in the commercial sector. Commercial establishments have been reducing their use of coal and increasing their use of fuelwood as a source of process heat energy (see Table 6.4). In informal interviews with commercial entities, the reasons given for the reduction in the use of coal were that the quality of coal has declined significantly during the last 15 years and fuelwood leaves behind much less ash than coal. This shift was confirmed in interviews with wood wholesalers and retailers, who say that their customer base has shifted from households to commercial establishments such as restaurants, bakeries, and ceremonial halls.
The estimated demand for fuelwood is documented in both the household surveys
and in a survey of wood retailers in metropolitan Hyderabad. Once again, comparable data were available for both 1982 and 1994 to allow for comparisons of fuelwood demand over time. The figures indicate a marked decline of over 60,000 metric tons in overall use of wood for energy in urban households between 1982 and 1994. By contrast, both the commercial and the social and religious sectors each increased their use of wood by about 30,000 metric tons during the same period. These overall results indicated that, even though the city of Hyderabad grew by over 3 million people, the level of wood consumption in the city was stable.
Table 6.4 Changes in Sectoral Demand for Fuelwood, Hyderabad, 1982 & 1994
Demand Sector
Wood consumption (mt per year)
Compound growth
rate, 1982-94
1982
1994 % Total change
% Annual change

99
Household 154,031 92,499 -51 -4
Commercial establishments*
13,700
43,015
114
10
Social & religious
10,000
34,368
123
10
Total
177,731
169,882
-5
-0.3
* Includes hostels. Note: The rates of change are compound growth rates. Source: Alam, M. et al, Fuelwood in Urban Markets, 1985; Hyderabad survey data, 1994.
Energy Use and Energy Expenditures
Energy is a very important component of consumer spending in Hyderabad, especially for the urban poor. The total overall household spending on energy per month in Hyderabad is Rs. 212, or about 8 percent of total income. As indicated in Figure 6.5, electricity takes the largest share of income spent on energy for the average household in Hyderabad, followed by LPG and kerosene. Electricity is used for lighting and for appliances such as fans, televisions, radios, and stereos; it is used rarely for cooking. By contrast, the other main fuels⎯LPG and kerosene⎯are used primarily for cooking. Thus, the picture of energy expenditures in Hyderabad again confirms that wood is no longer an important household fuel. Wood has been virtually squeezed out of household budgets, except for the poorest households. By contrast, the use of electricity has been growing as an energy expense, even though it is not utilized for cooking.
The overall pattern is that lower-income groups use less energy than higher-
income households, but energy is a very significant part of lower-income household budgets. As detailed in Table 6.5 and Figure 6.6, the single largest expenditure for energy spending by the poor is for kerosene, used mainly for cooking. The amount of kerosene available through the ration card program for the poor is 15 liters per month, which would result in a cost for a household of about Rs. 45 per month. Poor households, which are typically spending over Rs. 50 per month on kerosene, are therefore supplementing their subsidized supplies with purchases on the open market at non-subsidized prices. Once again, the figures indicate that wood is no longer a significant component of energy spending and even the poorest households use a significant amount of kerosene for cooking. It is also clear that LPG use is highly dependent on income. The figures for expenditures for LPG demonstrate steady increases, from an average of 12 rupees per month for the poorest households, to over 100 rupees per month in the highest-income households.

100
Figure 6.5. Energy Expenses for Average Household, by type of Energy, Hyderabad, 1994
Wood5%
Kerosene21%
LPG28%
Electricity46%
Note: Energy expenses absorb 8 percent of income for the average household in Hyderabad. Source: Hyderabad survey data, 1994.
Electricity consumption comprises another significant energy expense for the urban poor. The urban poor are spending on average just less than 50 rupees per month on electricity. The pattern for electricity expenditures is interesting, because, as demonstrated in Table 6.5, the amount of money spent on electricity is relatively stable through the four lowest income classes. It then begins to rise with income. This result suggests that the poorest households are using electricity only for very basic needs, such as lighting.
As Table 6.5 demonstrates, the poor spend a high proportion of their income on
energy. In the poorest income groups, people are paying as much as 15 percent of their income on energy, mainly for kerosene for cooking and electricity for lighting (see Figure 6.5). The poorest households pay close to 5 percent of their income on the very little electricity that they use for lighting, compared to most other urban households in Hyderabad. The latter are paying between 2.5 to 3 percent of their income on electricity, but are using much more of this energy source. Focus group interviews of poor households revealed that, due to income constraints, people are already conservative in their use of energy. They tend to turn off lights when they exit rooms and generally
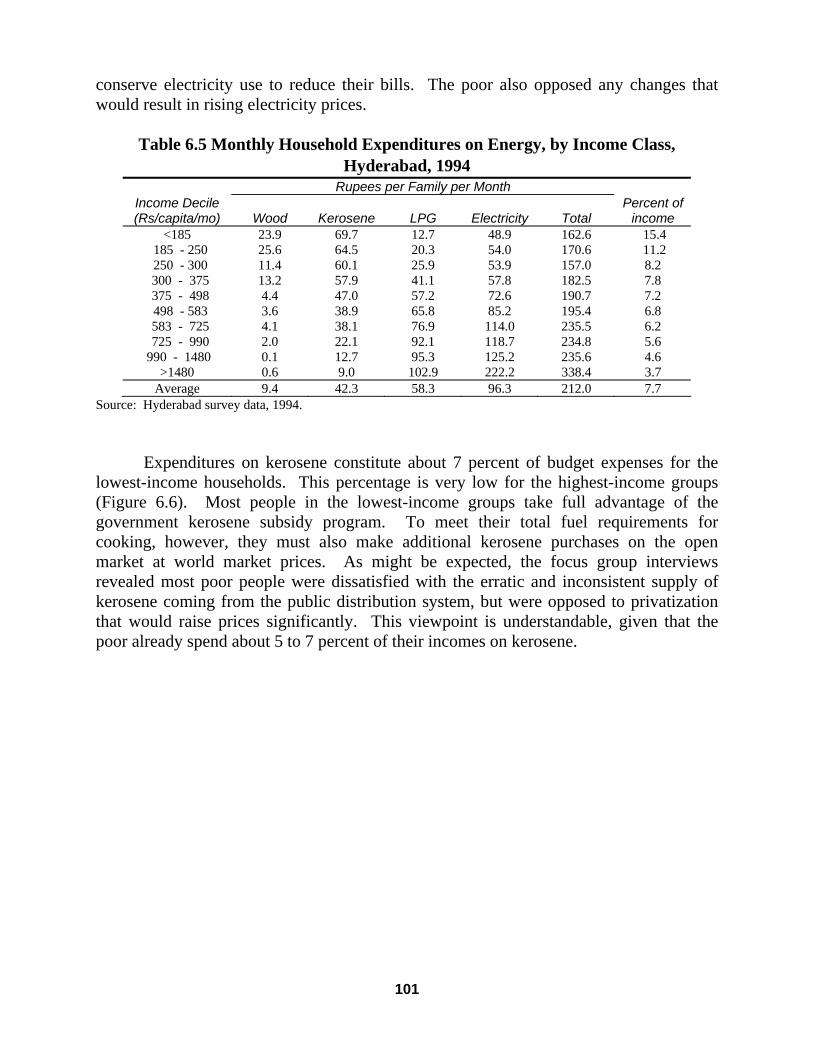
101
conserve electricity use to reduce their bills. The poor also opposed any changes that would result in rising electricity prices.
Table 6.5 Monthly Household Expenditures on Energy, by Income Class, Hyderabad, 1994
Rupees per Family per Month Income Decile (Rs/capita/mo)
Wood
Kerosene
LPG
Electricity
Total
Percent of income
<185 23.9 69.7 12.7 48.9 162.6 15.4 185 - 250 25.6 64.5 20.3 54.0 170.6 11.2 250 - 300 11.4 60.1 25.9 53.9 157.0 8.2 300 - 375 13.2 57.9 41.1 57.8 182.5 7.8 375 - 498 4.4 47.0 57.2 72.6 190.7 7.2 498 - 583 3.6 38.9 65.8 85.2 195.4 6.8 583 - 725 4.1 38.1 76.9 114.0 235.5 6.2 725 - 990 2.0 22.1 92.1 118.7 234.8 5.6 990 - 1480 0.1 12.7 95.3 125.2 235.6 4.6
>1480 0.6 9.0 102.9 222.2 338.4 3.7 Average 9.4 42.3 58.3 96.3 212.0 7.7
Source: Hyderabad survey data, 1994.
Expenditures on kerosene constitute about 7 percent of budget expenses for the lowest-income households. This percentage is very low for the highest-income groups (Figure 6.6). Most people in the lowest-income groups take full advantage of the government kerosene subsidy program. To meet their total fuel requirements for cooking, however, they must also make additional kerosene purchases on the open market at world market prices. As might be expected, the focus group interviews revealed most poor people were dissatisfied with the erratic and inconsistent supply of kerosene coming from the public distribution system, but were opposed to privatization that would raise prices significantly. This viewpoint is understandable, given that the poor already spend about 5 to 7 percent of their incomes on kerosene.

102
Figure 6.6 Household Energy Expenditures by Income Class, Hyderabad, 1994
02468
10121416
1 2 3 4 5 6 7 8 9 10Income Class
Ener
gy E
xpen
ditu
res
as %
of
Fam
ily In
com
e
ElectricityLPGKeroseneWood
Note: Income classes are in rupees per household per month and are as follows: 1= < 185, 2 = 186-250, 3 = 251-300, 4 = 301-375, 5 = 376-498, 6 = 499-583, 7 = 584-725, 8 =726-990, 9 = 991-1480, 10 = > 1480. Source: Hyderabad survey data, 1994.
Middle class households spend between 6 and 8 percent of their income on energy and tend to be concerned with both energy prices and service reliability. One focus group of working women understood that privatization of electricity services would both improve service and mean higher energy prices. But they were mixed in their opinions concerning whether the convenience of better service was worth the higher prices that they would have to pay. Some in the group felt that the price of electricity was already high and further increases in prices would impose too much hardship. Others agreed with energy privatization in principle, but were worried about how private companies would deal with safety issues. However, all understood that privatization would increase the efficiency of the distribution system.
The main energy expenditures of the highest-income groups are for electricity and
LPG cooking fuel. The budget expenditures of these groups on energy are in the range of 3 to 5 percent. In focus group interviews, higher-income households were more worried about problems related to the supply of LPG and electricity rather than the prices or subsidies. Distributors’ delay in replacing empty cylinders was one supply difficulty often cited People in higher- income groups also strongly complained about the many voltage fluctuations and power cuts. In general, they strongly favored privatization of electricity and LPG distribution. They were aware of the better service in cities with private distribution companies, such as Bombay and Calcutta. They felt that private industrial groups should be entrusted with the responsibility of ensuring better service.

103
Energy Subsidies
Government policies have been effective in keeping the price of kerosene low. The average price of kerosene paid by households in Hyderabad is about Rs 3.4 per liter compared to a world market price of Rs. 5.5 (see Table 6.6). However, the policy to make kerosene affordable has actually resulted in poor people paying slightly higher prices for kerosene than more wealthy families. The reason is straightforward. The ration available for kerosene is about 15 liters per month -- not enough for cooking, for which the average family needs about 20 liters. As a consequence, poor families without the ability to afford the initial costs of LPG turn to the informal markets, where fuels are relatively expensive, to purchase kerosene or wood. Kerosene is available in the informal market at about Rs 5 to 7 per liter. The combination of fuel purchases from ration shops and informal markets effectively raises the price for poor people compared to households in the middle-income groups, which can use a combination of subsidized kerosene and subsidized LPG.
Table 6.6 Comparative Prices Paid for Household Energy, by Income Class,
Hyderabad, 1994 Price of Energy Reported by Consumers
Income Decile (Rs/capita/mo)
Wood (Rs/kg)
Kerosene (Rs/ltr)
LPG (Rs/14.2 kg)
Electricity (Rs/kWh)
<185 1.14 3.51 107 1.06 185 - 250 1.15 3.64 108 1.05 250 - 300 1.26 3.53 107 1.07 300 - 375 1.26 3.39 107 1.07 375 - 498 1.80 3.27 108 1.02 498 - 583 1.50 3.29 107 1.06 583 - 725 1.35 3.33 107 1.02 725 - 990 1.72 3.34 107 1.03 990 - 1480 1.44 3.30 107 1.04
>1480 0.82 3.26 107 1.04 Market or Reference Price 1.23 5.50 175 1.50
Source: Hyderabad survey data, 1994.
In contrast to kerosene, the price of both electricity and LPG are nearly the same
across income groups. In 1994, the official price of LPG was Rs. 107 per bottle, and this is the price consumers were paying since, at the time of the survey, few people were buying LPG from private retailers. The results of the survey regarding electricity usage were somewhat unexpected, since the electricity company charges consumers increasing rates for increasing levels of consumption. For example, the initial block at a use level of 50 kWh costs Rs. 0.70, while the highest-use block⎯usage above 500 kWh⎯costs Rs. 1.45. However, as demonstrated in Table 6.7, the price per kWh actually paid varies very little across income groups. This is probably due to a monthly service charge for the

104
meter, which raises the effective price of electricity for poor households. The service charge is regressive for poor urban consumers, since it raises the overall price of electric power for those in the lowest electricity-use categories, who are mostly poor people.
The effect of these relatively constant prices on the subsidy levels received by
different income groups is that the poor receive fewer overall subsidies, because they use less energy than households in higher-income groups. These findings are confirmed when comparing the total subsidies per household in different income classes (see Table 6.7). The poorest households receive on average an aggregate subsidy of Rs. 64 per month, most of which is derived through the kerosene purchased at ration shops. The main subsidies received by the highest-income households are derived from their relatively heavy use of LPG and electricity; they receive total subsidies of Rs 153 per month. This is well over twice the level of subsidies received by poor households in the lowest-income groups. If one assumes Rs. 1.5 per kWh as a reasonable price to pay for electricity based on average costs for the electricity company, then examining the data from Table 6.8, the highest-income groups are receiving close to Rs. 90 of subsidy per month for electricity, which is an amount that they can easily afford to pay.
Table 6.7 Per Household Energy Subsidies, by Income Class, Hyderabad, 1994 Rupees per Family per Month
Income Decile (Rs/capita/mo)
Wood
Kerosene
LPG
Electri-city
Total
Total Energy Expenses
<185 0 36 7 21 64 162.6 185 - 250 0 32 12 22 64 170.6 250 - 300 0 31 15 24 70 157.0 300 - 375 0 34 24 26 83 182.5 375 - 498 0 29 33 31 93 190.7 498 - 583 0 24 38 36 96 195.4 583 - 725 0 22 45 40 107 235.5 725 - 990 0 13 54 46 113 234.8
990 - 1480 0 8 56 53 115 235.6 >1480 0 6 61 87 153 338.4
Source: Hyderabad survey data, 1994.
Although there are some problems with kerosene rationing, Table 6.8 indicates it to be the most effective policy intervention in terms of reaching poor households. The two poorest income groups receive a subsidy of close to Rs. 7 million per month through this program, while the highest 20 percent of households, which do not use kerosene very much, receive only slightly more that 1 million rupees per month as a class. In fact, it is a well-known informal practice for higher-income households to give lower-income service households the use of their ration cards for purchasing kerosene for their families. However, the highest two income groups are well compensated through other subsidies, as they receive over Rs. 22 million per month in subsidies for electricity and LPG combined.

105
Table 6.8 Aggregate Household Energy Subsidies, by Income Class, Hyderabad, 1994
Million Rupees per Month Income Decile (Rs/capita/mo)
Wood
Kerosene
LPG
Electricity
Total
<185 0 3.1 0.6 1.8 5.5 185 - 250 0 3.6 1.4 2.4 7.4 250 - 300 0 2.1 1.0 1.6 4.7 300 - 375 0 2.9 2.0 2.2 7.2 375 - 498 0 2.4 2.7 2.5 7.6 498 - 583 0 2.1 3.2 3.0 8.1 583 - 725 0 2.0 4.0 3.6 9.6 725 - 990 0 0.9 4.0 3.4 8.3 990 - 1480 0 0.8 5.3 5.0 11.1
>1480 0 0.5 5.2 7.3 13.0 Total 0 20.4 29.4 33.1 82.5
Source: Hyderabad survey data, 1994.
The implication of these findings is that energy subsidies are not well targeted. Both the electricity and the LPG subsidies substantially benefit the more well-off households, with poor households deriving little benefit. 9
Knowledge of Energy Subsidies
People’s perceptions of energy pricing and the fairness of energy pricing policies can be very important for the implementation of changes in energy policy. It is evident from Table 6.15 that very few people know the basis of energy pricing for the fuels that they use every day in their homes. This finding should be qualified by the fact that people who do not use a particular fuel will respond, “do not know” to such questions. Even with this qualification, the numbers are fairly dramatic. Over 70 percent of households do not know whether LPG or electricity is subsidized.
However, many people do know that kerosene is subsidized. The reason for this is that kerosene bought through ration shops can be compared to more expensive kerosene bought on the open market. As a consequence, one-third of the sample and one-half of higher-income consumers realize that kerosene is subsidized. As indicated previously, the higher-income households are receiving the greatest amount of energy subsidies per family; remarkably, one-fifth of this same group thinks that they are being taxed for this energy.
9 It should be noted that the price of electricity was raised in 1996. It now ranges from Rs. 0.80 per kWh for consumers consuming less than 50 kilowatt hours per month, to Rs. 2.65 per kilowatt hour for customers consuming over 400 kilowatt hours per month.
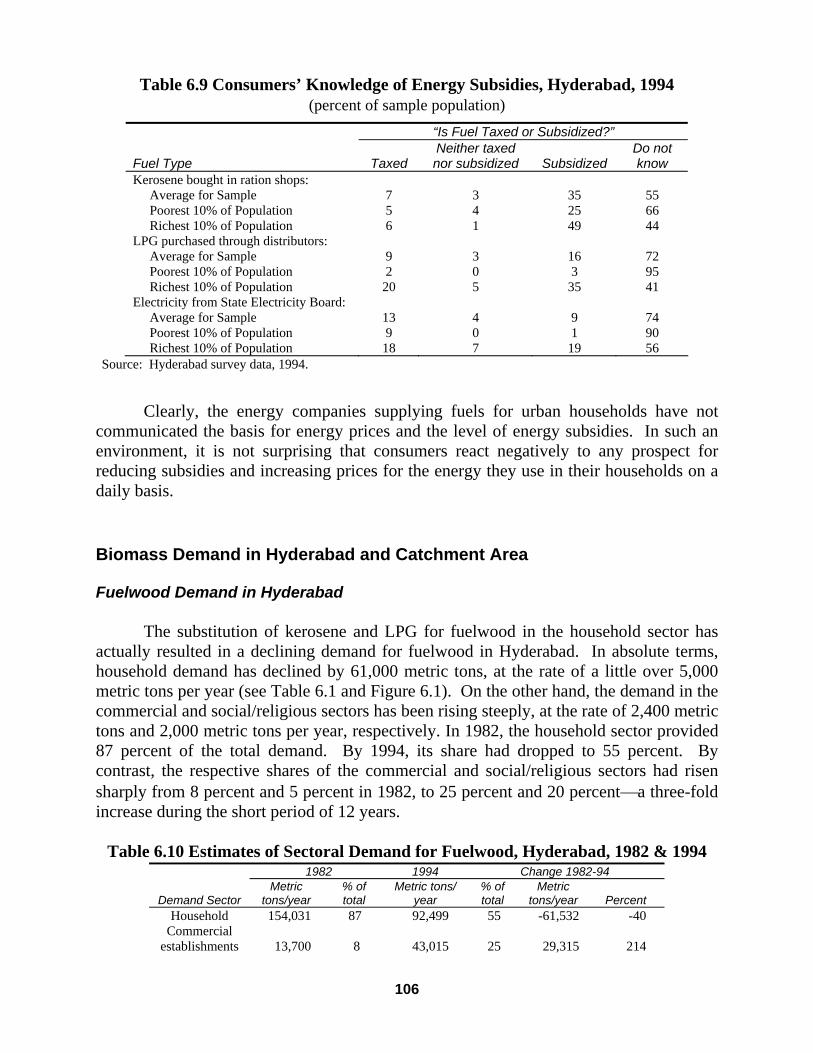
106
Table 6.9 Consumers’ Knowledge of Energy Subsidies, Hyderabad, 1994 (percent of sample population)
“Is Fuel Taxed or Subsidized?” Fuel Type
Taxed
Neither taxed nor subsidized
Subsidized
Do not know
Kerosene bought in ration shops: Average for Sample Poorest 10% of Population Richest 10% of Population
7 5 6
3 4 1
35 25 49
55 66 44
LPG purchased through distributors: Average for Sample Poorest 10% of Population Richest 10% of Population
9 2
20
3 0 5
16 3
35
72 95 41
Electricity from State Electricity Board: Average for Sample Poorest 10% of Population Richest 10% of Population
13 9
18
4 0 7
9 1
19
74 90 56
Source: Hyderabad survey data, 1994.
Clearly, the energy companies supplying fuels for urban households have not
communicated the basis for energy prices and the level of energy subsidies. In such an environment, it is not surprising that consumers react negatively to any prospect for reducing subsidies and increasing prices for the energy they use in their households on a daily basis.
Biomass Demand in Hyderabad and Catchment Area Fuelwood Demand in Hyderabad
The substitution of kerosene and LPG for fuelwood in the household sector has actually resulted in a declining demand for fuelwood in Hyderabad. In absolute terms, household demand has declined by 61,000 metric tons, at the rate of a little over 5,000 metric tons per year (see Table 6.1 and Figure 6.1). On the other hand, the demand in the commercial and social/religious sectors has been rising steeply, at the rate of 2,400 metric tons and 2,000 metric tons per year, respectively. In 1982, the household sector provided 87 percent of the total demand. By 1994, its share had dropped to 55 percent. By contrast, the respective shares of the commercial and social/religious sectors had risen sharply from 8 percent and 5 percent in 1982, to 25 percent and 20 percent⎯a three-fold increase during the short period of 12 years.
Table 6.10 Estimates of Sectoral Demand for Fuelwood, Hyderabad, 1982 & 1994
1982 1994 Change 1982-94
Demand Sector Metric
tons/year % of total
Metric tons/ year
% of total
Metric tons/year
Percent
Household 154,031 87 92,499 55 -61,532 -40 Commercial
establishments
13,700
8
43,015
25
29,315
214
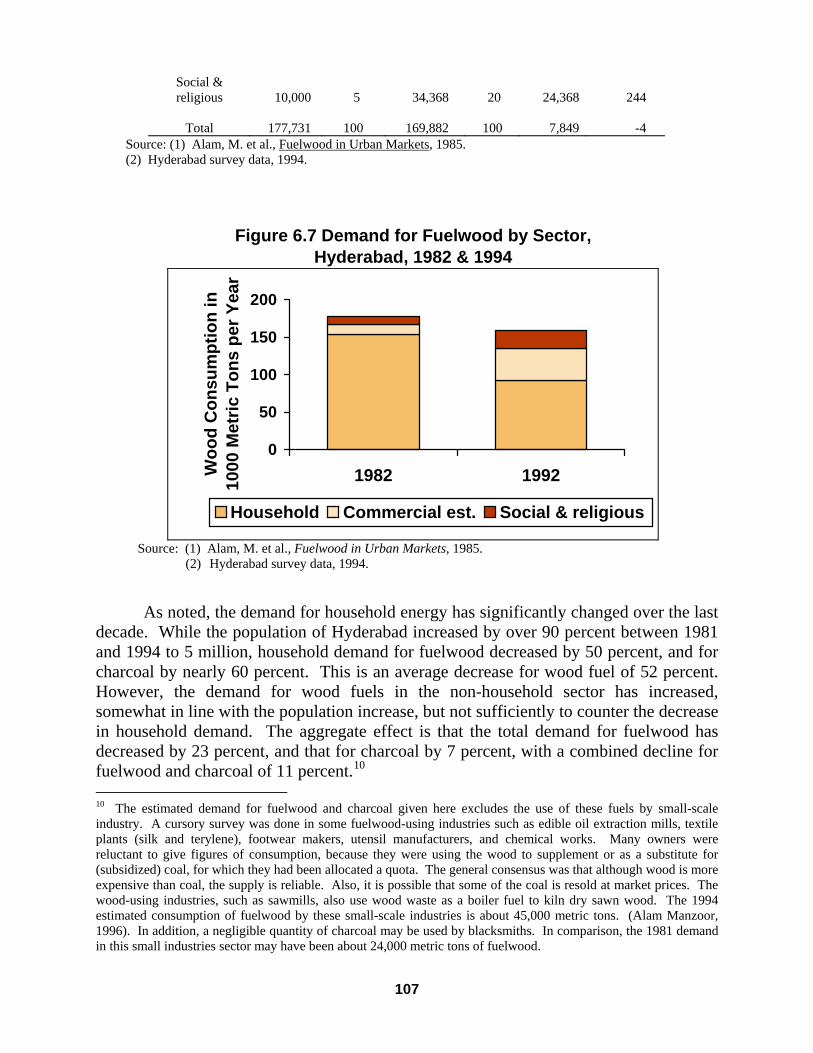
107
Social & religious
10,000
5
34,368
20
24,368
244
Total
177,731
100
169,882
100
7,849
-4
Source: (1) Alam, M. et al., Fuelwood in Urban Markets, 1985. (2) Hyderabad survey data, 1994.
Figure 6.7 Demand for Fuelwood by Sector, Hyderabad, 1982 & 1994
0
50
100
150
200
1982 1992Woo
d C
onsu
mpt
ion
in
1000
Met
ric T
ons
per Y
ear
Household Commercial est. Social & religious
Source: (1) Alam, M. et al., Fuelwood in Urban Markets, 1985. (2) Hyderabad survey data, 1994.
As noted, the demand for household energy has significantly changed over the last decade. While the population of Hyderabad increased by over 90 percent between 1981 and 1994 to 5 million, household demand for fuelwood decreased by 50 percent, and for charcoal by nearly 60 percent. This is an average decrease for wood fuel of 52 percent. However, the demand for wood fuels in the non-household sector has increased, somewhat in line with the population increase, but not sufficiently to counter the decrease in household demand. The aggregate effect is that the total demand for fuelwood has decreased by 23 percent, and that for charcoal by 7 percent, with a combined decline for fuelwood and charcoal of 11 percent.10 10 The estimated demand for fuelwood and charcoal given here excludes the use of these fuels by small-scale industry. A cursory survey was done in some fuelwood-using industries such as edible oil extraction mills, textile plants (silk and terylene), footwear makers, utensil manufacturers, and chemical works. Many owners were reluctant to give figures of consumption, because they were using the wood to supplement or as a substitute for (subsidized) coal, for which they had been allocated a quota. The general consensus was that although wood is more expensive than coal, the supply is reliable. Also, it is possible that some of the coal is resold at market prices. The wood-using industries, such as sawmills, also use wood waste as a boiler fuel to kiln dry sawn wood. The 1994 estimated consumption of fuelwood by these small-scale industries is about 45,000 metric tons. (Alam Manzoor, 1996). In addition, a negligible quantity of charcoal may be used by blacksmiths. In comparison, the 1981 demand in this small industries sector may have been about 24,000 metric tons of fuelwood.
108
While the urban demand for wood fuel decreased between 1981 and 1994, the demand for other wood products, particularly poles, saw logs, and sawn wood has increased. This increase has more than offset the decrease in demand for wood fuel, which means there has been an overall increase in urban demand in Hyderabad for wood and wood products.
Combined Rural and Urban Demand for Fuelwood Of course, demand for wood does not only emanate from urban areas. People in rural areas use wood in large quantities. Rural populations in the areas surrounding Hyderabad that use wood, straw, and dung for cooking have increased by nearly 30 percent between 1981 and 1994, to an estimated 5.9 million people. While much of the rural wood demand, especially fuelwood and poles, is regarded as non-commercial (branches, twigs, and tree tops) compared to urban commercial wood products, all of the former must be taken into consideration when analyzing wood removals from the Hyderabad catchment area. Table 6.11 demonstrates the difference in demand for wood, in terms of roundwood equivalents for the urban and rural populations living within a 100-kilometer radius of Hyderabad. At the current rate of urbanization, metropolitan Hyderabad will double itself in 15 years to a population of about 10 million people. This will lead to a doubling of the housing stock, assuming no change in the average family size. Thus, while it is anticipated that fuelwood will continue to become a marginal household fuel in urban areas, this fall in demand may be more than offset by the increase in fuelwood demand in the non-household sectors. To this should be added the predicted increase in demand for wood in construction, furniture and joinery, and other wood-using industries. There will thus be a moderate but growing demand for all wood products in Hyderabad over the next 15 years.

109
Table 6.11 Estimated Rural and Urban Demand for Wood, Hyderabad Catchment Area, 1982 & 1994
(million metric tons, roundwood equivalent)
1982
1994
Difference (1981-94)
Rural
Hyderabad
All Urban
Total
Rural
Hyderabad
All Urban
Total
Urban
Total
Population (millions)
4.63
2.59
3.09
7.72
5.90
4.97
5.75
11.65
2.66
3.93
Wood Type Fuelwood 1.19 0.24 0.29 1.48 1.51 0.22 0.25 1.76 -0.04 0.28
Charcoal 0.01 0.011 0.01
1 0.02 0.01 0.01
1 0.01
1 0.02 0.00 0.00
Poles 0.14 0.02 0.02 0.16 0.18 0.04 0.05 0.23 0.03 0.07
Saw logs 0.07 0.052 0.06
2 0.13 0.09 0.08
2 0.09
2 0.18 0.03 0.05
Total wood5 1.41
4 0.32
3 0.38
3 1.79 1.79
4 0.35
3 0.40
3 2.19 0.02 0.40
Note: Catchment area encompasses all urban and rural populations living within a 100-kilometer radius of Hyderabad. Also, it is assumed that some charcoal, saw logs and sawn wood, plus all panel and paper products come from outside the 100-kilometer radius, of Hyderabad, estimated as follows: 1. Total charcoal wood, 0.12 million mt, 85 percent from outside Andhra Pradesh, (Alam M. et al, 1985). Of the
charcoal from A.P., only about half will be from within the 100-km. radius. 2. For 1981, total saw logs, 0.11 million mt. This excludes 0.04 million mt. of off-cuts already counted in fuelwood
total. For 1994, total saw logs, 0.20 million mt. This excludes 0.07 million mt. of off-cuts already counted in the fuelwood total.
3. For 1981, total roundwood demand, 0.54 million mt. This excludes 0.03 million mt. of roundwood used for panel and paper production, consumed in Hyderabad and other urban areas. For 1994, total roundwood demand, 0.62 million mt. This excludes 0.06 million mt. of roundwood used for panel and paper production, consumed in Hyderabad and other urban areas.
4. For 1981, this excludes 0.02 million. mt of roundwood used for panel and paper production consumed within the rural 100-km. radius catchment area. For 1994, his excludes 0.02 million mt. of roundwood used for panel and paper production consumed in the rural 100-km. radius catchment area.
5. For 1981, estimated total demand, in roundwood equivalent terms, for all wood products, including panels and paper, in millions of mt: Rural 1.43; Urban 0.57; Total 2.00. For 1994, estimated total demand in roundwood equivalent terms for all wood products, including panels and paper, in millions of mt: Rural 1.81; Urban 0.68; Total 2.49.
Sources: Alam , M. et al., Fuelwood in Urban Markets, 1985; FAO Annual Forest Products Yearbook 1981, (adapted). (Rome: FAO, 1983); Unni N.V.M. et al., Fuelwood Sustainability in Rural Areas. (Hyderabad: National Remote Sensing Agency, 1992); 1981 Census of India (Government of India; 1982).
Geographic Distribution of Fuelwood Supply
The government of Andhra Pradesh has prohibited the supply of wood from government forests. Supplies are now being received mainly from private forests, waste lands, and isolated trees on farmlands. The total annual supply of wood (including both logs and fuelwood) to Hyderabad is 288,000 metric tons, including 172,800 metric tons of fuelwood. In 1982, Hyderabad consumed 177,731 metric tons of fuelwood. There has thus been a small drop in the demand for fuelwood, primarily due to a dramatic decline in the demand from the household sector, from 154,031 metric tons in 1982 to 92,498
110
metric tons in 1994. The demand in the commercial and social/religious sectors has been rising rapidly, however. The decline in the demand for fuelwood by households has been more than offset by the rise in the demand for logs. Thus, the overall supply of wood to the city has increased. The total value of trade at Hyderabad wood auction centers increased from Rs. 3.57 crores (US$1.2 million) in 1982 to Rs. 25 crores (US$7.0 million) in 1994, an increase of 300 percent in value in about a decade. The sources of wood supply are widely distributed. The distances from which fuelwood is brought to the city vary between 63 and 136 kilometers. There is hardly any change from 1982 in the average distance and sources of supply of wood to Hyderabad City, though the total supplies have increased significantly. The bulk of the wood to the auction centers is brought mainly from the adjoining districts. Two opposite forces appear to be exerting pressure on the areas of wood supplies. The reduction in the forest area and tree cover on the outskirts of the city are pushing the area of supply further away from the city, while rising transport costs are forcing suppliers to bring logs and fuelwood from the nearest available sources. It is notable that bullock carts, which were used prominently to transport chipped wood to the city in 1982, have now ceased to operate. As already mentioned, the wood market of Hyderabad is based on supply and demand. This makes the functioning of the market flexible and ensures its smooth functioning. The wood market comes close to the classical competitive market model. There are a large number of sellers and purchasers in the market. It is also interesting to note that business worth millions of rupees is transacted everyday in these markets, and most transactions are on a cash basis.
Changes to Forest and Wooded Areas in the Hyderabad Hinterlands
Over the last 100 years, the population of India has increased four-fold, from just over 225 million to more than 930 million. In another 50 years, it may be the most populous nation on earth. This tremendous increase in population has and will continue to have a significant impact on land use and natural resources, both renewable and non-renewable. One hundred years ago, 90 percent of the population lived in rural areas; today it is about 60 percent. These statistics are mirrored in the population living in and around Hyderabad. Table 6.12 provides estimates of the rural and urban population within radii of 50 and 100 kilometers of Hyderabad between 1894 and 1994.
While the urban population of India, including that of Hyderabad, has increased
nearly 20 times in 100 years, the rural population has increased less than three times. Thus, within a 100-kilometer radius of Hyderabad, the combined rural/urban increase has been nearly five-fold over the 100-year period, whereas within a 50-kilometer radius, it has been more than eight-fold.

111
Table 6.12 Estimated Population, Hyderabad and Vicinity, Selected Years, 1894-1994
(millions) Year
Rural/Urban 1894 1928 1963 1971 1981 1991 1994 50-km. radius of Hyderabad Rural 0.51 0.56 0.82 0.95 1.15 1.34 1.40 Urban 0.28 0.57 1.40 1.92 2.71 4.43 5.17 Total 0.79 1.13 2.22 2.87 3.86 5.77 6.57 100-km. radius of Hyderabad Rural 2.05 2.25 3.29 3.84 4.63 5.59 5.90 Urban 0.33 0.68 1.64 2.20 3.09 4.98 5.75 Total 2.38 2.93 4.93 6.04 7.72 10.57 11.65
Notes: The population was estimated based on the populations of the following districts in proportion to their area within the specified radii: Hyderabad, Rangareddi, Medak, Nalgonda and Mahbub Nagar. The small areas of Warangal and Nizamabad within the 100-kilometer radius were included in Nalgonda and Medak, respectively. Sources: Alam, M. et al, Perspectives on Patterns and Trends of Energy Consumption in an Indian Metropolis (draft report) (Hyderabad: The Institute of Energy and Environmental Studies, 1996); FAO Annual Agricultural Production Yearbook 1976, 1984, 1994, (projected and adapted) (Rome: FAO, 1978, 1986, 1996); Census of India 1961, 1971, 1981 & 1991 (adapted) (Government of India, 1962, 1972, 1982, 1992); D.N. Elhance, Economic Statistics of India Since Independence (Allahabad, India: Kitab Mahal Private Ltd., 1962).
The need for more food and wood products to satisfy the requirements of this increase in population has affected the quantity and quality of forest and woodland areas within a 50-mile radius of Hyderabad (see Table 6.13). In the 35-year period from 1928 to 1963, the forest area shrank by nearly half and the scrub land decreased by 60 percent, for a combined total loss of over 112,000 hectares of wooded area⎯more than 3,200 hectares per year. Most, if not all of this land was converted into agricultural use to meet the growing food demands of the increased population of more than 1 million people. In the 31-year period from 1963 to 1994, the loss of wooded areas declined significantly, to less than 640 hectares per year, despite a population increase of more than 4 million people. In the period 1963 to 1981, the average loss was 780 hectares per year, whereas from 1981 to 1994, this annual loss declined to 420 hectares per year. In addition, from 1963 to 1994, the land under agriculture decreased by an average of 480 hectares per year, with arable land decreasing by over 1,600 hectares per year. This latter decrease was offset by an increase in fallow land, but pastoral land decreased by about 500 hectares per year.
Despite this decrease in the arable area, food grain production in India increased
substantially, due to a doubling of the areas under irrigation, improved seed varieties, and better management. These initiatives doubled the unit grain production per hectare. From 1965 to 1980, the irrigated area increased by 50 percent, and from 1980 to 1994, it increased by another 25 percent. On the other hand, the increase in unit rice production was the reverse; 25 percent from 1965 to 1980 and 50 percent from 1980 to 1994. The main cause of the increase can be attributed to improved seed varieties. This “green

112
revolution” and intensification of agriculture is one of the reasons for the decline in the deforestation rate.
Table 6.13 Land Use Changes within a 50-kilometer Radius of Hyderabad, Selected Years, 1928-94
(all figures in square kilometers) Land Use Type 1928 1963 1981 1994
Wooded land 2073 949 807 752 Forest 1055 530 445 365 Scrub land 1018 419 362 387 Agricultural land 4486 5620 5518 5470 Arable 2855 3600 3466 3098 Fallow 900 1133 1290 1641 Pastoral 731 887 762 731 Barren/rocky land 675 498 474 470 Built up areas 28 70 135 257 Water bodies 160 135 130 124 Miscellaneous: non-agric. 435 585 793 784 Total 7857 7857 7857 7857
Note: As with the estimate for population, the land uses in Hyderabad, Rangareddi, Medak, Nalgonda and Mahbub Nagar were tabulated and divided in proportion to the areas within the 50-kilometer radius of Hyderabad. The built-up areas were estimated using the 1994 figure based on the urban population at the specific date. Similarly, the estimates of water bodies were made from 1985-86 and 1994 data. Miscellaneous non-agricultural land is a residual figure and could include all categories of non-agricultural land. Sources: Alam, M. et al., Perspectives on Patterns and Trends of Energy Consumption in an Indian Metropolis, (draft report) (Hyderabad: The Institute of Energy and Environmental Studies, 1996);. FAO Annual Agricultural Yearbook 1963, 1981, & 1993, (projected and adapted).(Rome: FAO, 1965, 1983, & 1995); N.V.M. Unni et al., Fuelwood Sustainability in Rural Areas. (Hyderabad: National Remote Sensing Agency, 1992); Indian Agricultural Statistics 1956-57; 1961-62 & 1962-63; 1977-78 to 1981-82; and 1985-86 to 1987-88, (Directorate of Economics & Statistics, Ministry of Agriculture, Government of India); Survey of India maps, 1928 & 1988.
While the rate of deforestation has been declining, it appears that the composition
of the forests and scrub lands is deteriorating, principally through overuse. There is a gradual but perceptible decline of tree cover in wooded formations from dense forest types to open scrub, via open forests and dense scrub. Thus, there is a tendency for the stocking density to degrade gradually.
Conclusion
The quality of energy service for urban residents in Hyderabad has improved over the last 14 years. More people have electricity than ever before. In addition, households are increasingly switching from wood to kerosene and from kerosene to LPG because of the greater convenience and lessened smoke produced in cooking with these fuels.
As the markets for LPG have been liberalized and expanded, many households
have taken advantage of clean-burning LPG for cooking. As poor consumers also move

113
up the energy ladder to kerosene, very few households in Hyderabad are now using wood as a main fuel. This indicates that policies to improve energy access have been moving in the right direction. In spite of the improvements in energy supply and use in the city, there are still some bottlenecks in the distribution system. There is also a substantial lack of knowledge among consumers concerning energy pricing policies and the extent to which some commonly used fuels are subsidized.
A major issue is the effectiveness of energy subsidies in reaching poor urban
households in Hyderabad. Although some subsidies do reach poor people, high-income groups, mainly because of the subsidies for LPG and electric power, are garnering the vast majority of the subsidies. The poor, who spend a significant proportion of their income on energy, are being reached mainly through kerosene subsidies. The implications are clear: the existing structure of energy subsidies is inefficient in meeting the objective of assisting the poor, and there is a need for corrective policy measures.
Increasing urbanization has exercised tremendous pressure on the demand for
fuelwood. Evidence of this is notably marked in the hinterland of metropolitan Hyderabad, mainly along the transport routes. Historically, extensive forest lands have been degraded into scrub woodland or their densities have been substantially reduced by frequent harvesting. In some areas, total deforestation has taken place as a consequence of urban demand. This reduction of biomass adversely affects overall sustainability, which is a cause for concern.
The combination of the following developments has been very beneficial for forest
and scrub areas surrounding Hyderabad: the easing of fuelwood demand in urban areas, the increasingly attractive market for farmers to grow trees, government policies of forest conservation, tree regeneration, social forestry, the prohibition of tree harvesting on government forest lands, and the banning of the outward movement of wood from these forests. There has been a substantial drop in the deforestation rate in the hinterland of Hyderabad, from 28 square kilometers per year during 1928-67 to only 2 square kilometers per year during 1963-87. The deforestation rate calculated through satellite images reveals an even lower rate of forest decimation, at 1.3 square kilometers per year. The satellite data does stress the point that demand for fuelwood in metropolitan Hyderabad exercises considerable pressure on fuelwood resources in the hinterlands.
However, people and communities contemplating growing trees are getting mixed
signals from government and local authorities. On the one hand, there are extension efforts that encourage communities and individuals to plant trees and to manage wood lots and natural woodland areas. This should continue and be expanded. On the other hand, there are barriers and/or constraints that discourage people from growing trees (Arnold, 1979). In theory, permission has to be obtained to thin or fell trees. In practice, this permission has been relaxed for “non-forest” trees such as neem. But a private individual or a community is not free to fell “forest” species, even if they are on private
114
land. This rule is a deterrent to tree planting, especially indigenous tree species, a policy that one arm of government is trying to encourage.
This chapter and previous sections of the book have documented the tremendous
diversity in urban energy transitions and the complex factors that drive urban energy consumption in different contexts, and at different stages. This complex reality raises the issue of what policies are appropriate for cities at different stages of the energy transition to assure efficient and equitable access to energy services, to help alleviate poverty, and to maintain human and ecosystem health. In the next chapter, the insights gleaned from the research findings in this and previous chapters are applied to develop appropriate policies for cities at different stages of economic development.


