Page 1
Confidential. © 2018 IHS MarkitTM. All Rights Reserved.Confidential. © 2017 IHS MarkitTM. All Rights Reserved.
US PetrochemicalsThe growing importance of export markets
EIA Energy ConferenceJune 4, 2018
Blake Eskew, Vice President - Business Development Oil Markets / Midstream / Downstream / Chemicals Houston, TX [email protected]
Page 2
Confidential. © 2018 IHS MarkitTM. All Rights Reserved.
Addressing strategic challenges with interconnected capabilities
Resources
Financial
Consolidated Markets & Solutions
Transportation
© 2017 IHS Markit. All Rights Reserved.
The comprehensive single source for global data & information, key market insights, analysis & forecasts
Page 3
Confidential. © 2018 IHS MarkitTM. All Rights Reserved.
Core Segments within Energy & Natural Resources
• Country E&P Terms and Above-Ground Risk
• Plays and Basins• Costs and Technology• Companies and
Transactions
UPSTREAM
• Global Gas• Coal• Power and Renewables• Regional Gas, Power
and Coal Markets
POWER, GAS, COAL& RENEWABLES
• Long-Term Planning & Scenarios • Climate Strategy
• Curated Content• Integrated Energy Events & CERAWeek
ENERGY-WIDE PERSPECTIVES
• Crude Oil Markets• Midstream Oil and
Natural Gas Liquids• Refining and Marketing• Company Strategies and
Performance
OIL MARKETS, MIDSTREAM, DOWNSTREAM & CHEMICAL
• Chemical Week and Market Daily Service
• Base Chemicals & Plastics
• Specialty Chemicals• Costs & Technology• Company Benchmarking
& Analytics
Our core capabilities serve our energy and chemical customers across the value chain through focused data and insight subscriptions as well as consulting.
Page 4
Confidential. © 2017 IHS MarkitTM. All Rights Reserved.
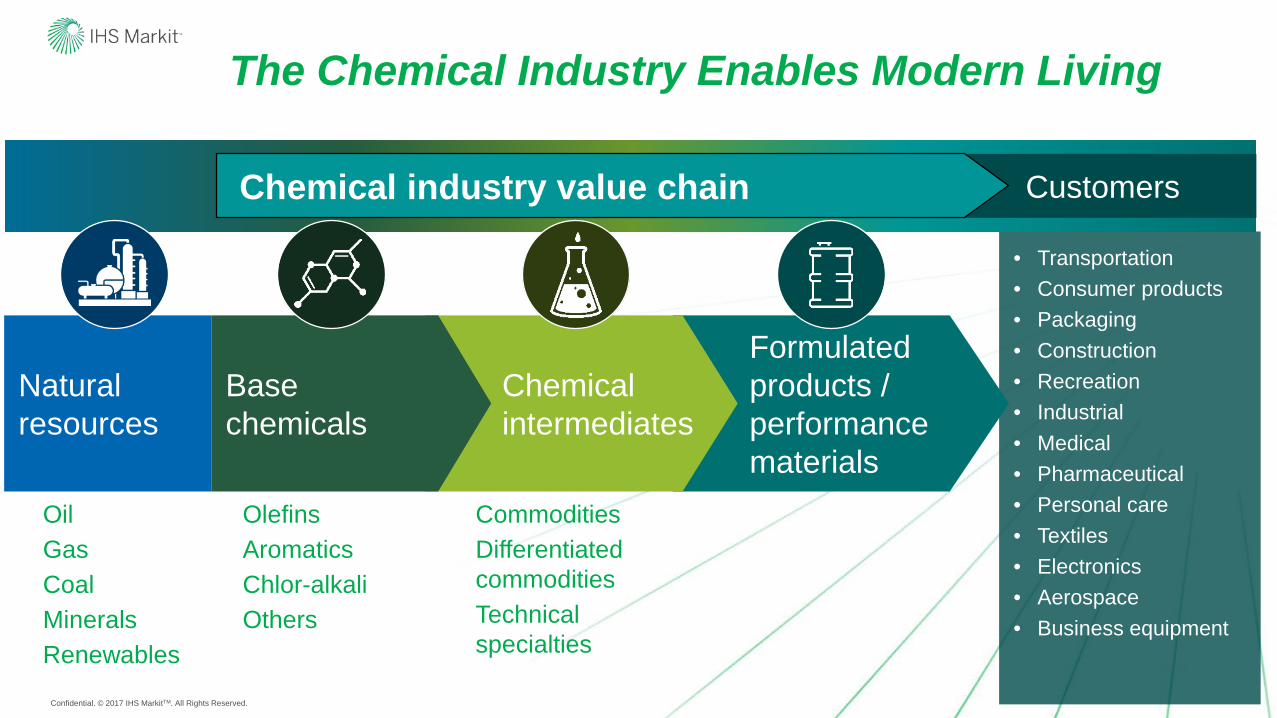
• Transportation• Consumer products• Packaging• Construction• Recreation• Industrial• Medical• Pharmaceutical• Personal care• Textiles• Electronics• Aerospace• Business equipment
OilGasCoalMineralsRenewables
Customers
Olefins AromaticsChlor-alkaliOthers
CommoditiesDifferentiated commoditiesTechnical specialties
Chemical industry value chain
Formulated products / performance materials
Natural resources
Chemicalintermediates
Base chemicals
The Chemical Industry Enables Modern Living
Page 5
Confidential. © 2018 IHS MarkitTM. All Rights Reserved.
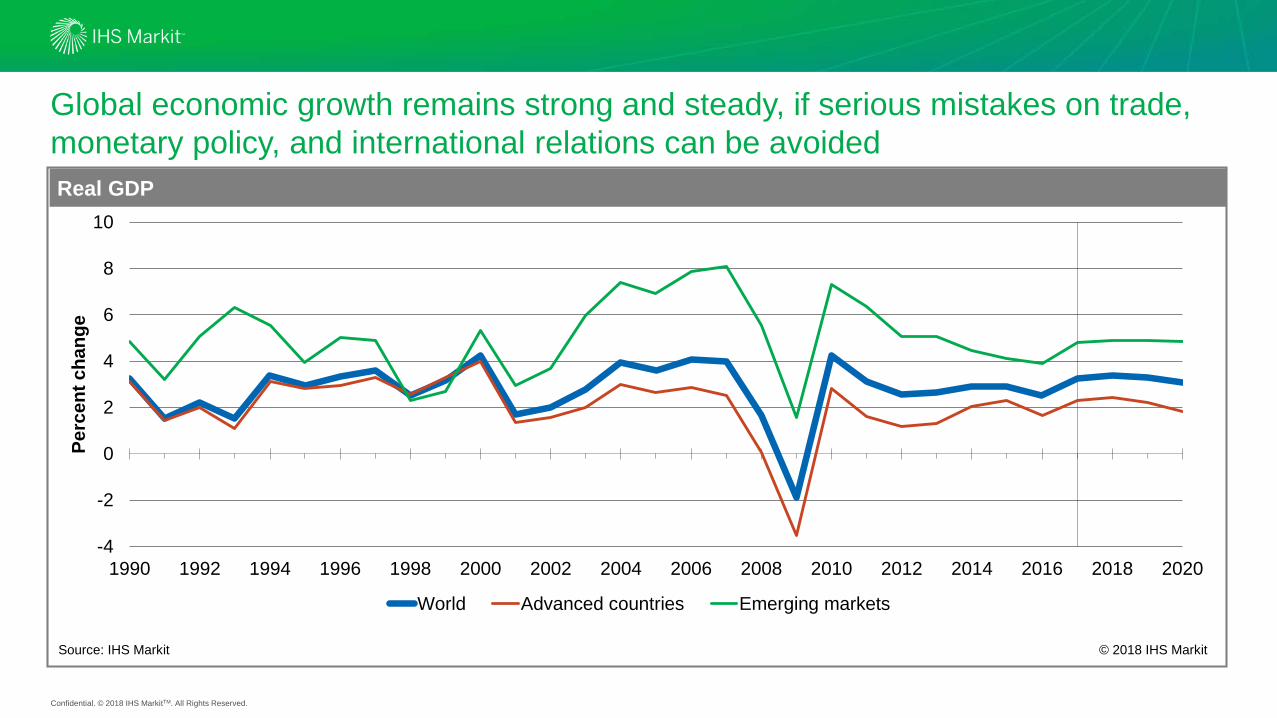
-4
-2
0
2
4
6
8
10
1990 1992 1994 1996 1998 2000 2002 2004 2006 2008 2010 2012 2014 2016 2018 2020
Perc
ent c
hang
e
World Advanced countries Emerging markets
Global economic growth remains strong and steady, if serious mistakes on trade, monetary policy, and international relations can be avoidedReal GDP
Source: IHS Markit © 2018 IHS Markit
Page 6
Confidential. © 2018 IHS MarkitTM. All Rights Reserved.
Economic growth in advanced countries and emerging markets are key drivers to petrochemical demand growth
0
1
2
3
4
1990-2000 2000-2010 2010-2020 2020-2030Ethylene Propylene (PG/CG) Methanol ChlorineBenzene Paraxylene Weighted Average
GDP Elasticity: rate of market growth / rate of global economic growth
Source: IHS Markit © 2018 IHS Markit
Per
cent
age
Page 7
Confidential. © 2018 IHS MarkitTM. All Rights Reserved.
0
1
2
3
4
5
6
7
Ethylene Propylene(PG/CG)
Methanol Chlorine Benzene Paraxylene
Avg. 2012 - 2016 2017 Avg. 2018 - 2022
Global demand growth and 2017 estimated total demand
Source: IHS Markit © 2018 IHS Markit
Mill
ion
Met
ric T
ons
Ethylene and propylene remain in high growth mode; methanol growth stabilizes
152 102
78 73
46 41
Global demand estimate for 2017
Page 8
Confidential. © 2018 IHS MarkitTM. All Rights Reserved.
The energy and petrochemical industries are closely related
Page 9
Confidential. © 2018 IHS MarkitTM. All Rights Reserved.
There are several primary routes to produce olefins
Crude Oil
Natural Gas
Crude Unit
Nat Gas Processing
FCC Unit
Refinery Grade Propylene
Ethylene
Polymer grade PropyleneSteam Cracker
PropyleneSplitter
PropaneDehydrogenation
Methanol-to-OlefinsMethanol-to-Propylene
Coal-to-OlefinsCoal-to-Propylene
Ethane, Propane, Butane
Propane
LPG, Naphtha, Gas Oil
Coal
Nat Gas
Page 10
Confidential. © 2018 IHS MarkitTM. All Rights Reserved.
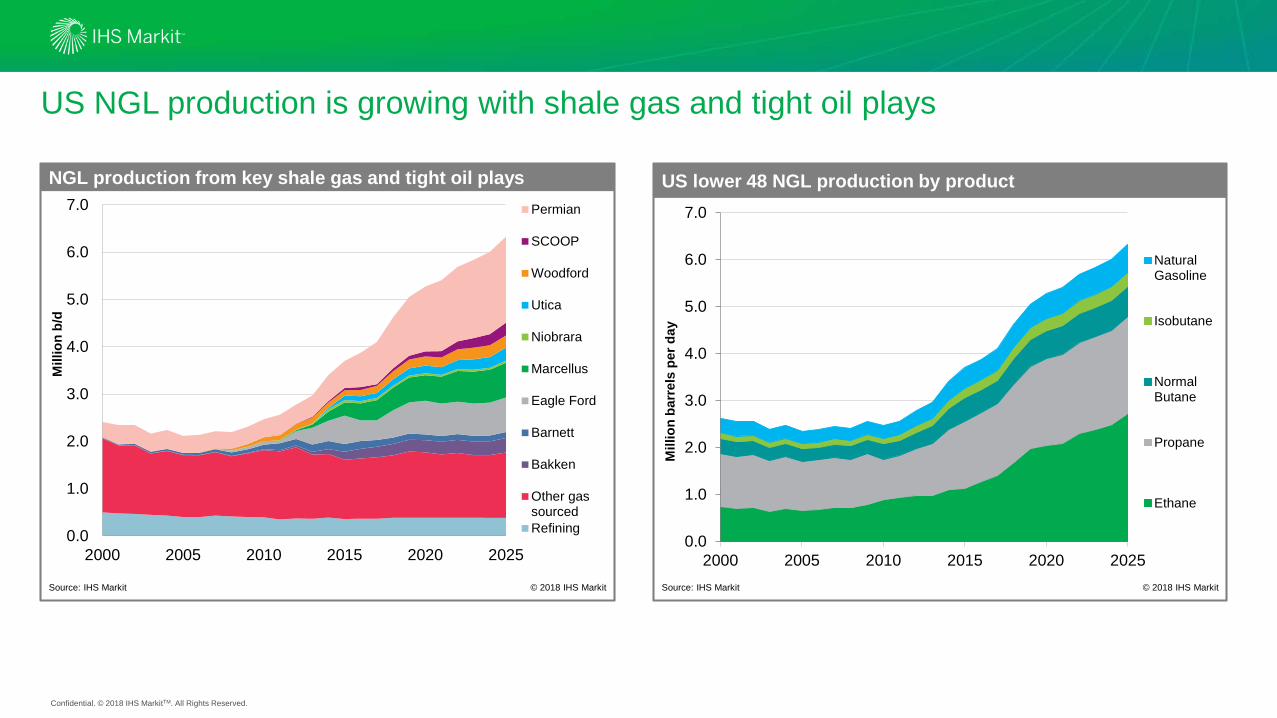
US NGL production is growing with shale gas and tight oil plays
0.0
1.0
2.0
3.0
4.0
5.0
6.0
7.0
2000 2005 2010 2015 2020 2025
NaturalGasoline
Isobutane
NormalButane
Propane
Ethane
US lower 48 NGL production by product
Source: IHS Markit © 2018 IHS Markit
Mill
ion
barr
els
per d
ay
0.0
1.0
2.0
3.0
4.0
5.0
6.0
7.0
2000 2005 2010 2015 2020 2025
Chart Title
Permian
SCOOP
Woodford
Utica
Niobrara
Marcellus
Eagle Ford
Barnett
Bakken
Other gassourcedRefining
NGL production from key shale gas and tight oil plays
Source: IHS Markit © 2018 IHS Markit
Mill
ion
b/d
Page 11
Confidential. © 2018 IHS MarkitTM. All Rights Reserved.
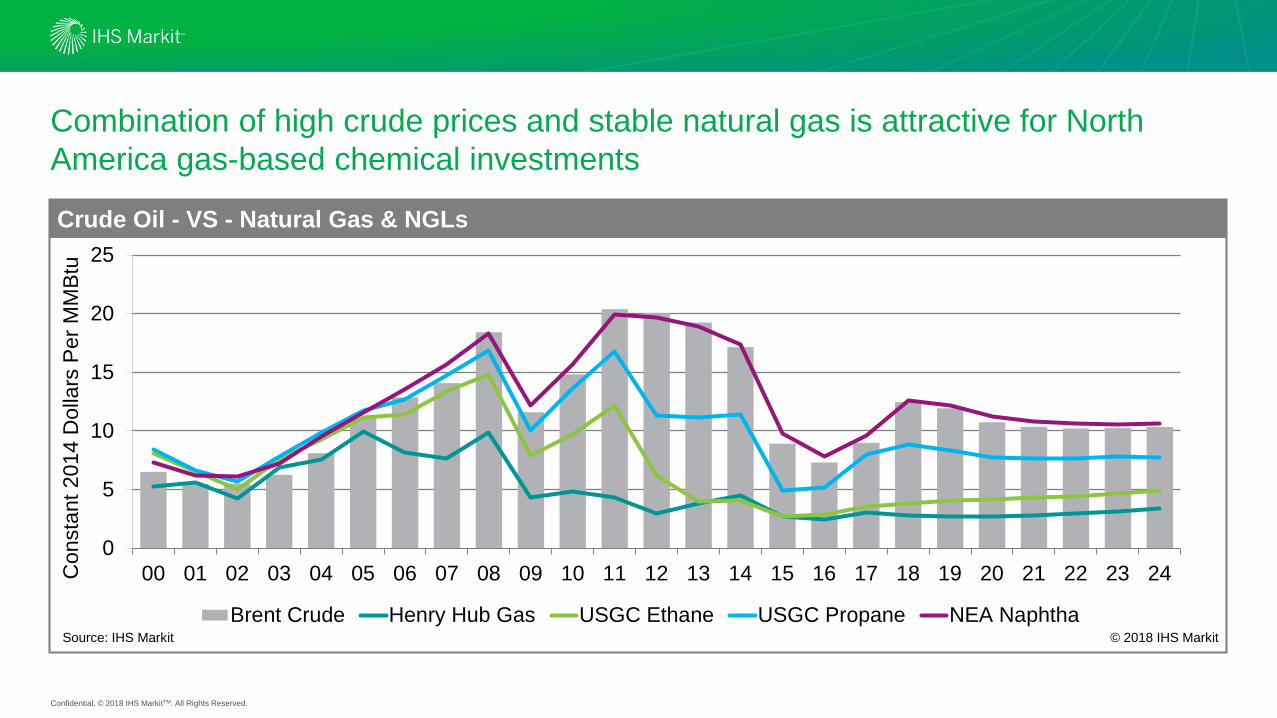
Combination of high crude prices and stable natural gas is attractive for North America gas-based chemical investments
0
5
10
15
20
25
00 01 02 03 04 05 06 07 08 09 10 11 12 13 14 15 16 17 18 19 20 21 22 23 24
Brent Crude Henry Hub Gas USGC Ethane USGC Propane NEA Naphtha
Con
stan
t201
4 D
olla
rs P
er M
MB
tu
Crude Oil - VS - Natural Gas & NGLsCrude Oil - VS - Natural Gas & NGLsCrude Oil - VS - Natural Gas & NGLsCrude Oil - VS - Natural Gas & NGLs
Source: IHS Markit © 2018 IHS Markit
Page 12
Confidential. © 2018 IHS MarkitTM. All Rights Reserved.
Ethane cracking is expected to maintain a large cash cost advantage
0
200
400
600
800
1000
1200
1400
2000 2001 2002 2003 2004 2005 2006 2007 2008 2009 2010 2011 2012 2013 2014 2015 2016 2017USGC - Ethane Northeast Asia - Naphtha
Ethylene Cast Cost Comparison
Source: IHS Markit © 2018 IHS Markit
USD
olla
r Per
Met
ric T
on
Cash cost = Feed + VC + FC – co-product
Page 13
Confidential. © 2018 IHS MarkitTM. All Rights Reserved.
63,832 57,481
21,706 9,812
Global Ethylene production by feed type (KTA ethylene by feed)
Source: IHS Markit © 2018 IHS Markit
Naphtha, 66,669
Ethane, 69,629
Other, 22,891
LPG, 13,383
NGLs increasingly important to olefins as crackers shift to ethane
0%
20%
40%
60%
80%
100%
2000 2003 2006 2009 2012 2015 2018 2021Gasoline (FCC) Naphtha Gas OilNat Gas Ethane PropaneButane Coal Other
Propylene production by feedstock
Source: IHS Markit © 2018 IHS Markit
Propane
More ethane for ethylene more propane for propylene
2017 (inner)Production = 143 MMTA
2022 (outer)Production = 173 MMTA
3.5 MMTA Ethylene~ 9 MMTA LPG
Page 14
Confidential. © 2018 IHS MarkitTM. All Rights Reserved.
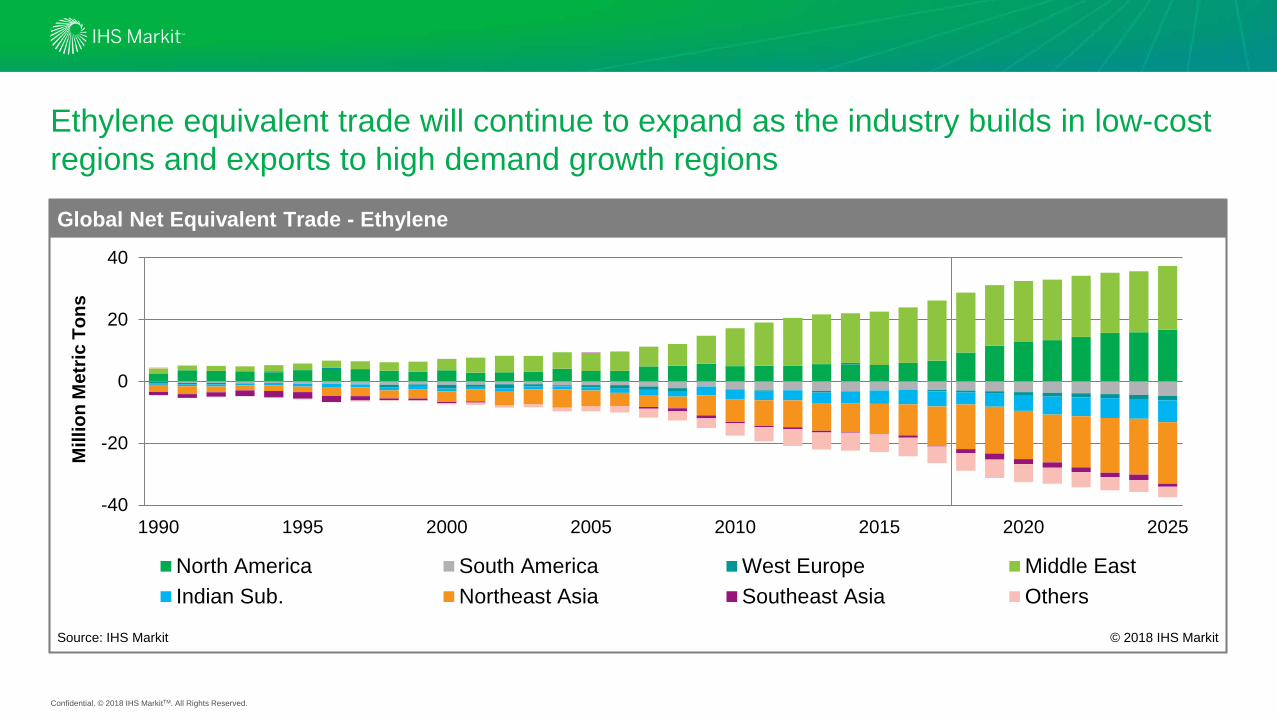
Ethylene equivalent trade will continue to expand as the industry builds in low-cost regions and exports to high demand growth regions
-40
-20
0
20
40
1990 1995 2000 2005 2010 2015 2020 2025
North America South America West Europe Middle EastIndian Sub. Northeast Asia Southeast Asia Others
Global Net Equivalent Trade - Ethylene
Source: IHS Markit © 2018 IHS Markit
Mill
ion
Met
ric T
ons
Page 15
Confidential. © 2018 IHS MarkitTM. All Rights Reserved.
0
10
20
30
40
50
60
70
0.0
0.5
1.0
1.5
2.0
2.5
3.0
3.5
2000 2005 2010 2015 2020 2025
Chart Title
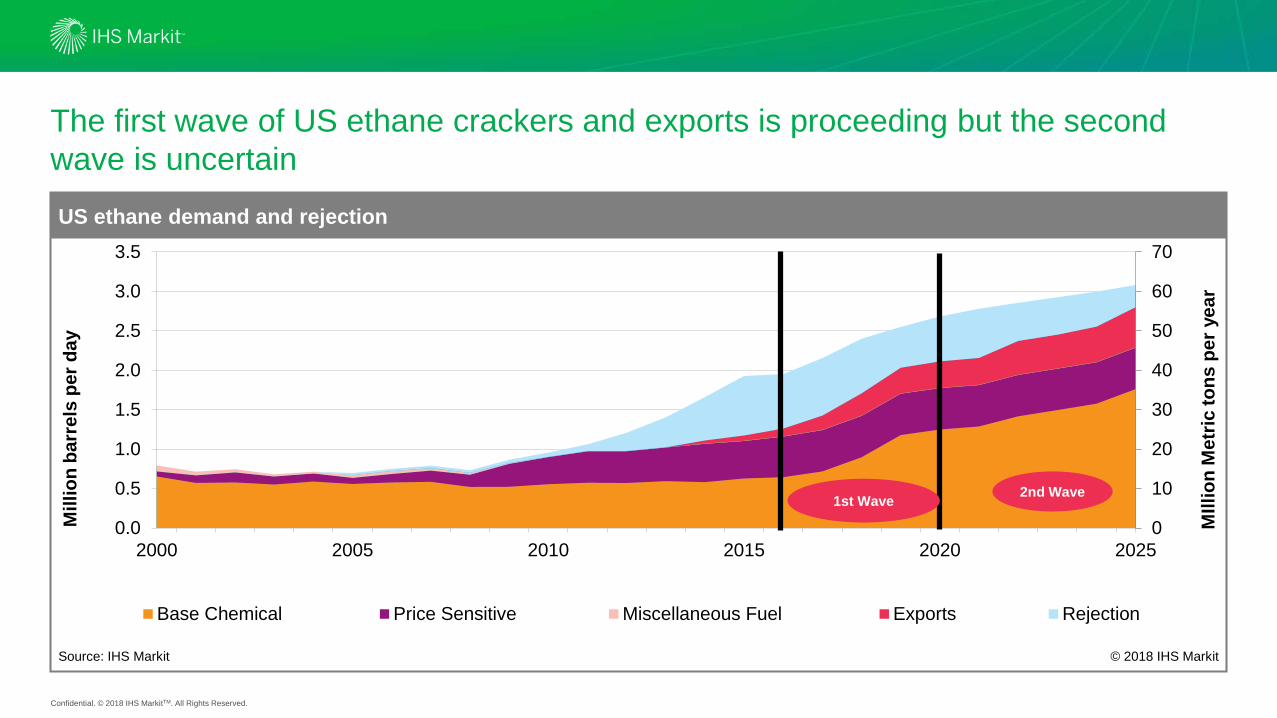
Base Chemical Price Sensitive Miscellaneous Fuel Exports Rejection
US ethane demand and rejection
Source: IHS Markit © 2018 IHS Markit
Mill
ion
barr
els
per d
ay
1st Wave 2nd Wave
MIll
ion
Met
ric to
ns p
er y
ear
The first wave of US ethane crackers and exports is proceeding but the second wave is uncertain
Page 16
Confidential. © 2018 IHS MarkitTM. All Rights Reserved.
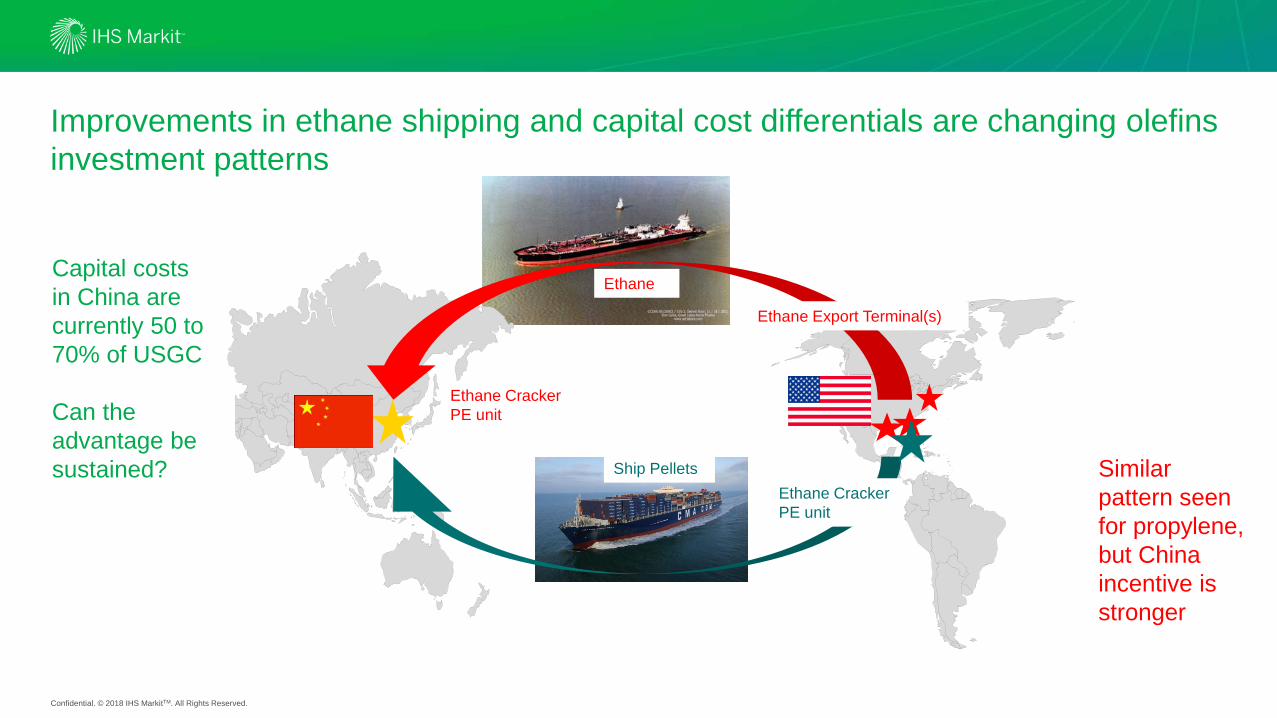
Improvements in ethane shipping and capital cost differentials are changing olefins investment patterns
Ethane Export Terminal(s)
Ethane CrackerPE unit
Ethane
Ship Pellets
Ethane CrackerPE unit
Capital costs in China are currently 50 to 70% of USGC
Can the advantage be sustained? Similar
pattern seen for propylene, but China incentive is stronger
Page 17
Confidential. © 2018 IHS MarkitTM. All Rights Reserved.
Ethylene cash costs and capital cost advantages make Chinese ethane-based capacity competitive
0
100
200
300
400
500
600
700
800
USGC - Ethane China - Ethane from US China - Naphtha Europe - Naphtha
2020-2025 Average
2020-2025 Average
World Ethylene Cast Cost Comparison
Source: IHS Markit © 2018 IHS Markit
USD
olla
r Per
Met
ric T
on
Cash cost = Feed + VC + FC – co-product
• Cash costs for ethane cracking in China are higher than in the US due to ethane transport costs
• But - finished product shipping is reduced or eliminated
• In addition, capital cost savings may outweigh the higher operating and feedstock costs
• Ethane cracking capital cost in China is roughly half of naphtha cracking –economics depend on need for co-products
Page 18
Confidential. © 2018 IHS MarkitTM. All Rights Reserved.
NGL and mixed feed crackers dominate near-term capacity additions
• In addition, over 9 million tons of additional ethane-based units have been announced for China but are still in the planning stages
• In the US, almost 15 million tons of additional ethane-based capacity is under discussion
• With annual demand growth of 6 million tons, the capacity will be needed
• But – is there enough ethane? And where will it be built?
-2000
0
2000
4000
6000
8000
10000
12000
14000
16000
18000
20000
China India Other Asia Middle East Europe/CIS Africa North America
Ethane Other NGL Mixed Naphtha Other
World Ethylene Capacity Changes: 2017-2022
Source: IHS Markit © 2018 IHS Markit
Thou
sand
Met
ric T
ons
Page 19
Confidential. © 2018 IHS MarkitTM. All Rights Reserved.
Energy and chemical exports from North America will continue to rise• Natural gas in North America remains
advantaged versus crude• North America will remain an attractive
region for capital investments in base chemicals, derivatives, and feedstocks
• Ethane to China can work - capital versus operating cost dynamics and supply risk tolerance will determine how much is built
• Second wave of ethane crackers will come – but in US or China?
• ,
19
Page 20
IHS Markit Customer [email protected] : +1 800 IHS CARE (+1 800 447 2273)Europe, Middle East, and Africa: +44 (0) 1344 328 300Asia and the Pacific Rim: +604 291 3600
DisclaimerThe information contained in this presentation is confidential. Any unauthorized use, disclosure, reproduction, or dissemination, in full or in part, in any media or by any means, without the prior written permission of IHS Markit Ltd. or any of its affiliates ("IHS Markit") is strictly prohibited. IHS Markit owns all IHS Markit logos and trade names contained in this presentation that are subject to license. Opinions, statements, estimates, and projections in this presentation (including other media) are solely those of the individual author(s) at the time of writing and do not necessarily reflect the opinions of IHS Markit. Neither IHS Markit nor the author(s) has any obligation to update this presentation in the event that any content, opinion, statement, estimate, or projection (collectively, "information") changes or subsequently becomes inaccurate. IHS Markit makes no warranty, expressed or implied, as to the accuracy, completeness, or timeliness of any information in this presentation, and shall not in any way be liable to any recipient for any inaccuracies or omissions. Without limiting the foregoing, IHS Markit shall have no liability whatsoever to any recipient, whether in contract, in tort (including negligence), under warranty, under statute or otherwise, in respect of any loss or damage suffered by any recipient as a result of or in connection with any information provided, or any course of action determined, by it or any third party, whether or not based on any information provided. The inclusion of a link to an external website by IHS Markit should not be understood to be an endorsement of that website or the site's owners (or their products/services). IHS Markit is not responsible for either the content or output of external websites. Copyright © 2017, IHS MarkitTM. All rights reserved and all intellectual property rights are retained by IHS Markit.