Trends in synchrotron-based tomographic imaging: the SLS experience M. Stampanoni, A. Groso, A. Isenegger, G. Mikuljan, Q. Chen, A. Bertrand, S. Henein, R. Betemps, U. Frommherz, P. B¨ohler, D. Meister, M. Lange and R. Abela Swiss Light Source, Paul Scherrer Institut, CH-5232 Villigen, Switzerland ABSTRACT Synchrotron-based X-ray Tomographic Microscopy (SRXTM) is nowadays a powerful technique for non-destruc- tive, high-resolution investigations of a broad kind of materials. High-brilliance and high-coherence third gen- eration synchrotron radiation facilities allow micrometer and sub-micrometer, quantitative, three-dimensional imaging within very short time and extend the traditional absorption imaging technique to edge-enhanced and phase-sensitive measurements. At the Swiss Light Source TOMCAT, a new beamline for TO mographic M icroscopy and C oherent rA diology experimenT s, has been recently built and started regular user operation in June 2006. The new beamline get photons from a 2.9 T superbend with a critical energy of 11.1 keV. This makes energies above 20 keV easily accessible. To guarantee the best beam quality (stability and homogeneity), the number of optical elements has been kept to a minimum. A Double Crystal Multilayer Monochromator (DCMM) covers an energy range between 8 and 45 keV with a bandwidth of a few percent down to 10 −4 . The beamline can also be operated in white-beam mode, providing the ideal conditions for real-time coherent radiology. This article presents the beamline design, its optical components and the endstation. It further illustrates two recently developed phase contrast techniques and finally gives an overview of recent research topics which make intense use of SRXTM. Keywords: X-ray imaging, synchrotron microtomography, multilayer monochromator, coherent radiology 1. INTRODUCTION The combination of X-ray microscopy with tomographic techniques as well as the exceptional properties of third-generation synchrotron radiation sources allow to obtain volumetric information of a specimen at micron or sub-micron scale with minimal sample preparation. In addition, the coherent nature of synchrotron radiation extends the classical absorption based tomography towards edge-enhanced and phase-contrast investigations. Requirements on the beamline components (beam intensity, size, stability, homogeneity) and detectors (reso- lution, efficiency, speed and noise) are very high and tremendous efforts have been made all over the world to develop high performance synchrotron-based microtomography devices. Sect. 2 presents some technical aspects of TOMCAT, the novel beamline for TO mographic M icroscopy and C oherent rA diology experimenT s, at the Swiss Light Source (SLS). Even though almost the totality of today’s routine users perform absorption-based or ”edge-enhanced” tomography experiments, see Sect. 4, there is a growing interest on phase contrast imaging. The advantages of X-ray phase contrast radiography over conventional radiography are evident. First, the phase shift of light absorbing materials can be sufficiently big to be detected with phase-sensitive methods and, sec- ond, phase signals are produced with much lower dose deposition than absorption, which can be very important when radiation damage becomes an issue. It has been shown that interferometric techniques as proposed by Bonse and Hart, 1 or phase retrieval methods 2 work fine but are somehow difficult to use in a routine experiment because of their complexity (stability and alignment issues for the first one, data processing for the second one). Recently, see Sect. 3, two new methods have been introduced which set a novel approach to the phase contrast problem: the Differential Phase Contrast (DPC) technique 3 and the Modified Bronnikov Algorithm (MBA). 4, 5 The DPC is based on a combination of grid-interferometry and phase stepping and is particularly suited for large objects and when a moderate resolution is required. The MBA is based on fast and direct 3D approach and works perfectly when micrometer resolution is necessary and the samples are small. It appears clear that the development potential of micron- and submicron tomography applications, in absorption or in phase, is far to be accomplished: the SLS and its TOMCAT beamline will be at the forefront in this context. Send correspondence to Marco Stampanoni, E-mail: [email protected], Telephone: +41 56 310 47 24 Invited Paper Developments in X-Ray Tomography V, edited by Ulrich Bonse, Proc. of SPIE Vol. 6318, 63180M, (2006) · 1605-7422/06/$15 · doi: 10.1117/12.679497 Proc. of SPIE Vol. 6318 63180M-1
Transcript
Trends in synchrotron-based tomographic imaging:the SLS experience
M. Stampanoni, A. Groso, A. Isenegger, G. Mikuljan, Q. Chen, A. Bertrand,S. Henein, R. Betemps, U. Frommherz, P. Bohler, D. Meister, M. Lange and R. Abela
Swiss Light Source, Paul Scherrer Institut, CH-5232 Villigen, Switzerland
ABSTRACTSynchrotron-based X-ray Tomographic Microscopy (SRXTM) is nowadays a powerful technique for non-destruc-tive, high-resolution investigations of a broad kind of materials. High-brilliance and high-coherence third gen-eration synchrotron radiation facilities allow micrometer and sub-micrometer, quantitative, three-dimensionalimaging within very short time and extend the traditional absorption imaging technique to edge-enhancedand phase-sensitive measurements. At the Swiss Light Source TOMCAT, a new beamline for TOmographicMicroscopy and Coherent rAdiology experimenTs, has been recently built and started regular user operation inJune 2006. The new beamline get photons from a 2.9 T superbend with a critical energy of 11.1 keV. This makesenergies above 20 keV easily accessible. To guarantee the best beam quality (stability and homogeneity), thenumber of optical elements has been kept to a minimum. A Double Crystal Multilayer Monochromator (DCMM)covers an energy range between 8 and 45 keV with a bandwidth of a few percent down to 10−4. The beamlinecan also be operated in white-beam mode, providing the ideal conditions for real-time coherent radiology. Thisarticle presents the beamline design, its optical components and the endstation. It further illustrates two recentlydeveloped phase contrast techniques and finally gives an overview of recent research topics which make intenseuse of SRXTM.
1. INTRODUCTIONThe combination of X-ray microscopy with tomographic techniques as well as the exceptional properties ofthird-generation synchrotron radiation sources allow to obtain volumetric information of a specimen at micronor sub-micron scale with minimal sample preparation. In addition, the coherent nature of synchrotron radiationextends the classical absorption based tomography towards edge-enhanced and phase-contrast investigations.Requirements on the beamline components (beam intensity, size, stability, homogeneity) and detectors (reso-lution, efficiency, speed and noise) are very high and tremendous efforts have been made all over the world todevelop high performance synchrotron-based microtomography devices. Sect. 2 presents some technical aspectsof TOMCAT, the novel beamline for TOmographic Microscopy and Coherent rAdiology experimenTs, at theSwiss Light Source (SLS). Even though almost the totality of today’s routine users perform absorption-basedor ”edge-enhanced” tomography experiments, see Sect. 4, there is a growing interest on phase contrast imaging.The advantages of X-ray phase contrast radiography over conventional radiography are evident. First, the phaseshift of light absorbing materials can be sufficiently big to be detected with phase-sensitive methods and, sec-ond, phase signals are produced with much lower dose deposition than absorption, which can be very importantwhen radiation damage becomes an issue. It has been shown that interferometric techniques as proposed byBonse and Hart,1 or phase retrieval methods2 work fine but are somehow difficult to use in a routine experimentbecause of their complexity (stability and alignment issues for the first one, data processing for the second one).Recently, see Sect. 3, two new methods have been introduced which set a novel approach to the phase contrastproblem: the Differential Phase Contrast (DPC) technique3 and the Modified Bronnikov Algorithm (MBA).4,5
The DPC is based on a combination of grid-interferometry and phase stepping and is particularly suited forlarge objects and when a moderate resolution is required. The MBA is based on fast and direct 3D approachand works perfectly when micrometer resolution is necessary and the samples are small. It appears clear thatthe development potential of micron- and submicron tomography applications, in absorption or in phase, is farto be accomplished: the SLS and its TOMCAT beamline will be at the forefront in this context.
Send correspondence to Marco Stampanoni, E-mail: [email protected], Telephone: +41 56 310 47 24
Invited Paper
Developments in X-Ray Tomography V, edited by Ulrich Bonse, Proc. of SPIE Vol. 6318, 63180M, (2006) · 1605-7422/06/$15 · doi: 10.1117/12.679497
Proc. of SPIE Vol. 6318 63180M-1
0
,,,0
0 0 W
<
0 0 vi 0
Flu
x (p
hoto
ns I
(s
0.1%
bw)
0 2. TOMCAT: A BEAMLINE FOR TOMOGRAPHIC MICROSCOPY AND
COHERENT RADIOLOGY EXPERIMENTS
The TOMCAT beamline is located at the X02DA port of the SLS and started regular user operation in June 2006.Synchrotron light is delivered by a 2.9 T superbend: compared with the 1.4 T of the normal SLS bending magnetsthis shifts the critical energy of the source from 5.4 keV up to 11.1 keV resulting in a considerable increase offlux at hard X-rays (> 20 keV), see Figure 1.
Machine ParametersRing energy 2.4 GeVRing current 400 mASource parametersMagnetic field 2.9 TCritical energy 11.1 keV / 1.12 AElectron source size (σx, σy) 46 µm, 16 µmElectron source divergence (σ′
Figure 1. Left: estimated photon flux (vertical integrated and 2 mrad horizontal acceptance) for the 2.9 T superbend (fullline) and for the 1.4 T normal bend (dashed line). The gain in flux at energies above 20 keV is evident. Right: Relevantparameters of the source. The vertical divergence is, of course, energy dependent. The value of 0.6 mrad corresponds tothe acceptance of the beamline diaphragm.
2.1. Design and realization
Rationale: Real space, full field imaging, and in particular tomography, needs a homogeneous and stablebeam profile, in order to perform optimal background corrections. Because of the high coherence of the radiationproduced by third-generation synchrotron radiation facilities like the SLS, all the optical components (windows,mirrors and monochromator) must be designed with particular care in order to avoid deterioration of the beamprofile. The design criteria for the optics of the TOMCAT beamline have been:
• Keep the optics as simple as possible (i.e. minimize the number of optical elements)
• Optimize optics for bandwidth rather than for energy resolution
• Monochromatic beam and white beam must be available
• Energy range: 6-45 keV
Window: The machine UHV-sector (10−10 mbar) is separated from the beamline HV (10−7 mbar) by aChemical Vapour Deposited (CVD) diamond window, see Figure 3b. Because of their better surface-roughness,CVD diamond windows are preferred to standard Be-windows. The thickness of the window is 100 µm and itssurface-roughness 2.5 nm RMS. Coherence degradation due to the window has been measured with shearinginterferometry6 and resulted to be negligible.
Optics The main optical component of the TOMCAT beamline is a fixed-exit double crystal multilayermonochromator (DCMM) which covers an energy range from 6 to 45 keV. Design and manufacturing havebeen done by CINEL Strumenti Scientifici, Padova, Italy. The DCMM is located in the front-end, at approxi-mately 7 m from the source: this allows to accept a large angular divergence while keeping the optical elements
Proc. of SPIE Vol. 6318 63180M-2
t1—- //
Figure 2. Left: View of the sector 2 of the SLS tunnel: visible are the magnets of the storage ring (in the foreground)as well as the TOMCAT’s front end (background). The monochromator vacuum chamber is clearly visible on the rightside. Right: View of the mechanics of the mono: the multilayer crystals are mounted on two separate goniometer towers.The first crystal can be adjustd in transversal direction as well as pitch and roll. The second crystal has transversal,longitudinal (up to 850 mm range), vertical as well as pitch, roll and yaw adjustment. Both crystals are supported by abank which is vertical translated and tilted by three jacks.
very compact, see Fig. 2. [Ru/C]100 and a [W/Si]100 multilayer stripes have been coated 8 mm apart from eachother on a Si111 substrate (active area of 150x50 mm2), see Fig. 3c. As a result the energy bandwidth of theDCMM is a few percent when multilayer are used or 10−4 when the silicon is used. The slope errors figures inthe direction along and across the optic are better than 0.5 µrad RMS and 5 µrad RMS respectively. Surfaceroughness is less than 0.3 nm RMS. When operating with multilayers the Bragg angle varies between θB = 1.82◦
and θB = 0.265◦ for energies ranging from 5 keV up to 45 keV. For the low-energy settings, the power densityis 80 mW/mm2 and is dissipated via a water side-cooling. The crystal optics are mounted on two independenthigh-precision goniometers. The first crystal has motorized pitch, roll, and horizontal translation (for stripesselection); the second crystal has the same degrees of freedom and, in addition, yaw and vertical translation.The whole system is positioned on a base plate that can be vertically adjusted. The distance between bothcrystals can be increased up to 850 mm. Instead of using a collimating mirror, the vertical size of the beam is”controlled” by moving the endstation along the beam path (up to 15 m travel range).
Sample manipulator The sample manipulator has been designed and manufactured at PSI. Translation alongall the three space direction is performed with a resolution better than 1 micron. The axis perpendicular to thebeam direction has a reproducibility of 0.1 micron: this is imperative for an artefact-free acquisition of referenceimages. The sample can be centered also with 0.1 micron reproducibility. The rotation axis is air-bearing basedand has a run-out error of less then 1 micron at 100 mm from the rotation surface. The whole system can beswapped by 90◦, see Figure 3d, allowing to scan thick and short sample (vertical rotation axis) or long and thinsamples (horizontal rotation axis).
Detector The most established detection method consists of converting X-rays into visible light with a scintil-lator and projecting them onto a charge coupled device (CCD) with the help of suitable optics.7–10 This approachprovides reliable and reproducible results for a wide range of research fields covering both medicine and biol-ogy11–14 as well as materials science.15–17 The TOMCAT detector follows the same principle: with interchange-able (motorized) objectives the field of view can easily be varied from 0.75x0.75 mm2 up to 11.45x11.45 mm2 withpixel sizes ranging from 0.35x0.35 µm2 up to 5.6x5.6 µm2. The CCD camera has 2048x2048 pixels (7x7 µm2 pitch)and a full frame is read-out in 260 ms with nominal 14 bits. Readout noise is 9 e− at 10 MHz and 12 e− at
Proc. of SPIE Vol. 6318 63180M-3
II _-_.- I IIl
20 MHz, dark current is 0.022 e−/ s/pixel. Table 1 summarizes the several imaging option (field of view andpixel size) available.
Table 1. Specifications of the different objectives available for the microscope
Objective Magnification NA Field of View (mm2) Pixel Size (µm2) Interp. Pixel Size (µm2)∗
PLAPO1.25x 1.25 0.06 11.4 x 11.4 5.6 x 5.6 2.8 x 2.8PLAPO2x 2 0.08 7.15 x 7.15 3.50 x 3.50 1.75 x 1.75UPLAPO4x 4 0.16 3.58 x 3.58 1.75 x 1.75 0.88 x 0.88UPLAPO10x 10 0.40 1.43 x 1.43 0.70 x 0.70 0.35 x 0.35UPLAPO20x 20 0.70 0.72 x 0.72 0.35 x 0.35 0.18 x 0.18UPLAPO40x 40 0.85 0.36 x 0.36 0.18 x 0.18 0.09 x 0.09
Figure 3. (a) The 2.9 T superbend before the installation in the ring. (b) The CVD window installed in the frontend: clearly visible is the copper frame, which is water cooled. (c) Multilayer crystals installed on one goniometer of theTOMCAT monochromator. Visible are the three ([Ru/C]100, [W/Si]100 and Si111) regions on the substrate. (d) Thesample manipulator ”frozen” during the axis swapping procedure.
3. NOVEL APPROACHES TO PHASE CONTRAST IMAGING
Absorption based X-ray radiographic imaging is an invaluable standard tool, used routinely for non-destructiveinvestigations in medicine, biology or environmental and materials science. For important samples as biologicaltissue, polymers, or fiber composites, however, the use of conventional X-ray radiography is limited because
∗The CCD camera has an hardware interpolation feature, which allows to ”double” the resolution of the chip.
Proc. of SPIE Vol. 6318 63180M-4
G1
Incident Distorted I:wave wave
G2Jg
Drift space
e
1000
800
.5(. 600>400a
200
00 0.5 1 1.5 2
Grating positionxg (pm)
0Fringe phase p (rad)
7t 27t
I-
al
a2- x1 x2 x3 x4
these objects show only weak absorption contrast. On the other hand, the cross section for elastic scattering ofhard X rays in matter, which causes a phase shift of the wave passing through the object of interest, is usuallymuch greater than that for absorption. Therefore, recording the X-ray phase shift instead of the absorptionsubstantially increases the contrast. As a consequence, several phase-sensitive X-ray imaging methods have beendeveloped in the past years. They can be classified into interferometric methods,1,18 techniques using an analyzercrystal,19,20 and free-space propagation methods.2,21 These techniques are different in terms of experimentalsetup, requirements in the illuminating radiation and the nature of the detected signal. We introduce here twosolutions that overcome most of the limitations of the previous methods. In section 3.1 we present the so-calleddifferential phase contrast imaging method, which is particulary suited when moderate spatial resolution andlarge field of view are needed. In section 3.2 we describe a full 3D phase imaging method, which is very wellsuited when high spatial resolution and speed are required.
3.1. Differential Phase Contrast (DPC) imaging with grating interferometry
The use of gratings as optical elements in hard X-ray phase imaging can overcome some problems that so farimpair the wider use of phase contrast in X-ray radiography and tomography. Weitkamp et. al3 experimentallyrealized an hard X-rays grating interferometer originally proposed by David et. al .22
3.1.1. Theoretical background
The functional principle of the grating interferometer is depicted in Figure 4.
Figure 4. (A) Functional principle of the grating interferometer, details see text. (B) Principle of phase stepping: (a-d)interferograms of polystyrene spheres (100 and 200 µm diameter) taken at different relative position xg = x1, ..., x4. (e)Intensity oscillation in two different detector pixels i = 1, 2 as a function of xg. For each pixel, the oscillation phase φi
and the average intensity ai over one grating period can be determined, see Ref. [3]. Scale bar 50 microns.
A beamsplitter grating G1 essentially divides the incident beam into the two first diffraction orders. Sincethe wavelength λ of the illuminating hard X-rays (≈ 1 A) is much smaller than the grating pitch (≈ 1 µm),the angle between the two diffracted beams is so small that they overlap almost completely. Downstream of thebeam-splitter grating, the diffracted beams interfere and, when illuminated with a plane or spherical wave, formlinear periodic fringe patterns in planes perpendicular to the optical axis. The idea is to detect the positionsof the fringes and determine from these the shape of the wave front. However, since the pitch of the phasegrating (and thus the spacing of the interference fringes) does not exceed a few microns, an area detector placedin the detection plane will generally not have sufficient resolution to resolve the fringes, and the exact positionof their maxima. Therefore, an absorbing grating G2 with the same periodicity and orientation as the fringesis placed in the detection plane, just in front of the detector. This analyzer grating acts as a transmissionmask for the detector and transforms the local fringe position into signal intensity variation. The recordedsignal contains therefore quantitative information about the phase gradient of the object. To separate this phaseinformation from other contributions to the signal, such as absorption in the sample, inhomogeneous illuminationor imperfections of the gratings, the phase-stepping approach used in visible-light interferometry was adaptedto this setup, see Figure 4(B) and Ref. [23]. The phases ϕ(x, y) of the intensity oscillations in each pixel arerelated to the wave-front phase profile Φ(x, y), the X-ray wavelength λ, the distance d between the two gratings,
Proc. of SPIE Vol. 6318 63180M-5
1(a) •L05 r(I5)$TJ&' • 3(c)
24
21
18
15
12
9
6
3
0
mm
and the period g2 of the absorption grating by the expression ϕ = λdg2
∂Φ∂x . The quantity ϕ contains no other
contributions, particularly no absorption contrast. The phase profile Φ of the object can thus be obtained fromϕ(x, y) by a simple one-dimensional integration.3
3.1.2. Experimental results
The grating interferometer is mechanically very robust, requires little spatial coherence, is polychromatic, quan-titative and scalable up to large field of views. Figure 5 shows the capability of the interferometer in imagingbiological samples. A rat heart placed in a plastic container filled with water (4% formalin) was imaged at anX-ray wavelength of 0.69 A. Two images are stitched together from two frames of 15mm x 15mm, the spacialresolution was 7.5 microns. The grating periods were p1 = 4 µm and p2 = 2 µm, the grating distance wasd = 175 mm. The absorption image (a) shows poor contrast (few percent) mainly due to the lower absorption offatty tissue near the upper end of the sample. On the other hand the phase gradient image (b) shows stronglyenhanced contrast revealing a variety of details. The phase image (c) is obtained by numerical integration of thegradient image and phase shifts of up to 8π are measured. The dose applied to the sample with the differential
Figure 5. Image of a rat heart in formalin solution. (a) absorption, (b) phase gradient and (c) phase image. Data havebeen acquired at ID19 of the ESRF. Images courtesy of F. Pfeiffer, PSI.
phase contrast technique scales with the number of phase steps needed. This number is equal to 3 for a perfectsinusoidal curve. For the sample described in Fig. 5, the number of required steps was 8, so eight times moredose has been deposited in the sample compared to classical absorption tomography. On the other hand, theenormous gain obtained in terms of contrast sufficiently balances the additional irradiation.
3.2. Full 3D phase imaging technique
The methods used so far for phase tomography (quantitative volumetric reconstruction of the refractive index),either interferometric or not, are based on a two step approach: first, the projections of the phase are determinedin the form of Radon projections (phase retrieval) and then the object function, i.e. the refractive index decrementδ is reconstructed applying a conventional filtered backprojection algorithm. As an alternative, Bronnikovsuggested an algorithm which eliminates the intermediate step of 2D phase retrieval and provides a direct 3Dreconstruction of the refractive index of the object.24,25 Since far from absorption edges δ is linearly relatedto the electron density ρ, which is - except for hydrogen rich materials - proportional to the mass density, theresulting reconstruction represents approximately the distribution of the mass density in the sample.
3.2.1. Theoretical background
Let consider a monochromatic plane wave with wavelength λ that propagates along the positive z-axis and thatimpinges upon a thin mixed phase-amplitude object, which is characterized by the linear absorption coefficient
Proc. of SPIE Vol. 6318 63180M-6
µ(x1, x2, x3) and the real part of the index of refraction δ(x1, x2, x3). The intensity distribution I(x, y) at adistance z = d and angle of rotation θ is approximated by the following expression, also known as Transport ofIntensity equation:26–29
Iθz=d (x, y) = Iθ
z=0(x, y) − λd
2π∇⊥
[Iθz=0(x, y) · ∇⊥φθ(x, y)
](1)
with φθ(x, y) being the phase function of the object. Eq. 1 is valid in the near-field Fresnel region d � a2/d,where a is the transversal size of the smallest structure in the object. For a mixed phase-amplitude object withweak and almost homogeneous absorption (i.e. ∂µθ
∂x , ∂µθ
∂y ≈ 0), Eq. 1 simplifies further to:25
Iθz=d (x, y) = Iθ
z=0(x, y)[1 − λd
2π∇2φθ(x, y)
](2)
with ∇2 ≡ ∂2
∂x2 + ∂2
∂y2 . The goal of quantitative phase tomography is to reformulate Eq. 2 to obtain δ(x1, x2, x3)from the knowledge of Iθ
z=d(x, y) for θ ∈ [0, π]. Expressing Eq. 2 as ∇2φθ(x, y) = − 2πλdgθ(x, y) with gθ(x, y) =
Iθz=d(x,y)
Iθz=0(x,y)
−1, applying then the 3D Radon transform (denoted by the symbolˆ), and calculating finally the secondderivative with respect to the variable s = x cos(ω) + y sin(ω) one gets:
∂2
∂s2δ(s, θ, ω) = −1
dgθ(s, ω) (3)
Expression 3 is a theorem which states that from the 2D Radon transform of the measured value g, one candirectly find the 3D Radon transform of δ.25 An explicit inversion formula for the 3D Radon transform was givenby Radon and Lorentz already at the beginning of the previous century. Combining the 2D Radon transformand its backprojection into a single step one obtains:
δ(x1, x2, x3) =1
4πd2
∫ π
0
(q ∗ ∗ gθ)dθ (4)
where the stars indicate a 2D convolution and:
q(x, y) :=|y2|
x2 + y2(5)
This convolution integral can be computed in the Fourier domain by taking the two dimensional Fourier trans-form. In the Fourier domain, Eq. 5 has the low-pass filter form given by [25]:
q(ξ, η) =|ξ|
ξ2 + η2(6)
Expressed in this (filtered backprojection) form, see Eq. 4, the approach becomes very interesting since in caseof a pure phase object (i.e. Iθ
z=0(x, y) = 1) the 3D distribution of the refractive index can be recovered from onlyone single tomographic data set, being:
gθ(x, y) = Iθz=0(x, y) − 1, θ ∈ [0, π] (7)
This is a significant step since (a) the experimental setup can be kept extremely simple (it is actually the same asfor standard, absorption based tomography) and (b) the radiation damage is kept to the minimum, which is ofspecial importance for biological specimens and for potential future in vivo studies. In addition, time consumingdata alignment routines as well as phase retrieval processes become superfluous.
The experimental setup is equivalent to the one for standard absorption tomography. Nevertheless, two additionalconditions have to be satisfied: (i) the sample-detector distance (z) is now increased from the minimum (z = 0)
Proc. of SPIE Vol. 6318 63180M-7
I,SISSIH• -a
used in absorption tomography, to the near field Fresnel region (z = d), (ii) the photon energy is increased tomaximum attainable (with sufficient flux) at the experimental station† in order to satisfy, as much as possible,the weak and almost homogeneous absorption condition. As a test, we investigated the internal microstructureof 200 microns thin wood samples. Even when low photon energy (10 keV) was used there is a weak absorptioncontrast and only the edges of internal structures are visible, see Fig. 6(a). In order to apply the phase tomographymethod in a pure phase object approximation, a single data set Iθ
z=d(x, y)) of 501 angular projections at a sampledetector distance of z = 32 mm and at a photon energy of 25 keV was acquired. For the practical implementationof the filter in Eq. 6 a sufficiently small sampling interval has to be used in the frequency domain. This can beachieved by zero padding the discrete data of the experimental function gθ(x, y). This is a standard technique indigital signal processing to avoid wraparound errors. Fig. 6(b) presents a slice through the sample reconstructedusing Eq. 4 and (the filter) 6. The reconstructed slice shown in Fig. 6(b) is severely corrupted by the residual
Figure 6. Tomographic reconstruction of a 200 microns thin wood sample: (a) absorbtion contrast at 10 keV, (b) phasecontrast, according to Eq. 4 and 6, (c) phase contrast obtained with the MBA. The length of the scale bar is 50 µm,sample courtesy of P. Trtik, ETH Zurich, Switzerland.
absorption artifact (see cap in the center). This means that, even though the absorption level for the woodsample is calculated to be in the range of only 2%, the pure phase object condition is not satisfied and anintensity measurement at zero distance (Iθ
z=0(x, y)) is also required. Here, we adopted another approach: thereconstruction artifacts are corrected by amending the original method leading to what we named Modifiedversion of Bronnikovs Algorithm (MBA). The correction consists of adding, in the denominator of the low-passfilter given in Eq. 6, an absorption dependent correction factor αexp. Consequently, the new filter becomes:
q(ξ, η) =|ξ|
ξ2 + η2 + αexp(8)
The values of αexp to be used are found by using a semi empirical (simulations-experiment) approach, describedin details in Ref. [4,5]. Applying the MBA method, we reconstructed again the data set of the wood sample. Theresult is presented in Fig.6(c). It appears clearly that the absorption artifact has completely disappeared andsimple segmentation (global threshold) can be performed. The MBA was validated using the Differential PhaseContrast Imaging technique, see section 3.1 and again Ref. [5]. In general, the two methods are complementary.The full 3D phase imaging approach (MBA) is experimentally simple, very fast and it is ideally suited forsmall objects when resolution around 1 micron is needed. Deposited dose is equivalent (or lower, since higherphoton energy is used) to the one deposited in conventional tomography. The MBA spatial resolution is limited,equivalently to standard absorption tomography, by the detector resolution to around 1 micron.10 The DPC ismore demanding in terms of instrumentation and acquisition time (therefore also deposited dose) but it is moresensitive and can be scaled up to large fields of view. Spatial resolution is limited to two period of analyzergrating3 e.g. to 2 microns with present fabrication technology.
†For the experiments discussed here, the highest (usable) energy was 25 keV, obtained at the Materials Science beamline4S of the Swiss Light Source.
Proc. of SPIE Vol. 6318 63180M-8
4. APPLICATION OF X-RAY TOMOGRAPHIC MICROSCOPYSynchrotron-based X-ray tomographic microscopy is nowadays an important and powerfool tool for volumetricand nondestructive analysis. This section shows a short palette of basic research currently on-going at the SwissLight Source. The list is incomplete and by far not exhaustive but should be indicative of what are the currenttrends in synchrotron-based microtomography. Applications vary from the investigation of fossilized embryos upto the visualization of the brain or bone microvasculature network. All the experiments presented here are carriedhave been carried out at the tomography station of the SLS,10 located at the Materials Science beamline30
4.1. X-ray tomographic microscopy of fossil embryosAlthough only recently discovered, the fossil record of embryonic development has already begun to challengecherished hypotheses on the origin of major animal groups. Synchrotron-based X-ray Tomographic Microscopyhas provided unparalleled insight into the anatomy and preservation of these fossil remains and this has allowedDonoghue et al.31 to verify competing hypotheses on their nature. With knowledge of both adults and embryosfrom the time of diversification (≈ 540 million years ago) of the major animals groups, it is now possible to testmodels of developmental evolution based on modern model organisms using information from their long-extinctancestors, see Fig. 7.
Figure 7. Left: SEM image of an enrolled embryo (head end at upper left; tail end at top). Center: rendered andvirtually sectioned to show internal structure. Right: segmented to show the structure of the tail. Scale bar: 150 µm.Image courtesy of P. Donoghue, Bristol University, UK.
4.2. Imaging of the vascular network and osteocytic lacunaes system in cortical boneBone strength determination is a crucial point in the worldwide efforts against osteoporosis disease. On amacroscopic scale (0.01-1 mm) bone mass and bone architecture are the dominant parameters determining bonestrength. A new hypothesis, proposed by Schneider et al.,32,33 is that ultrastructural (sub-micron) parameterslike the bone vascular system and the osteocyte lacunae distribution can sensitively improve the prediction ofbone competence. Thanks to a hierarchical imaging approach aimed at the non destructive assessment of theseparameters within two distinct murine models, see Fig. 8, it was possible to show that morphometry of thesequantitative traits is genetically dependent.
4.3. New insights into lung developmentThe lungs represent one of the essential, life supporting organs. The current paradigm states (i) that theformation of new alveoli - the formation of new gas-exchange surface - is completed at the age of 2-3 years and(ii) that a later reactivation of this process is not possible anymore. Therefore, a regeneration of lung tissue by a(re)formation of alveoli after any kind of lung injury is also excluded . Schittny et al.34 showed for the first timethat (i) alveoli may be formed at any time everywhere in the lung and that (ii) in rats new alveoli are formed aslong as the lung is growing. Fig. 9 shows the 3D visualization of the terminal airspaces in a rat lung at differentdevelopmental stages.
Proc. of SPIE Vol. 6318 63180M-9
—
'it vs \ .21 P%fl"W a .L
Figure 8. Three different steps of the hierarchical imaging approach introduced by Schneider et al.. Left: the wholemouse femur, scanned at low resolution (20 µm) on a tabletop device. Center: High-resolution (3.5 µm) image obtainedat the synchrotron showing the vascular network in the cortical bone Right: ultra-high resolution (0.35 µm) showing smalldetails of the vascular network and the distribution of the osteocyte lacunae. The scale bar is 1 mm, 200 microns and50 microns respectively. Images courtesy of P. Schneider, University and ETH Zurich, Switzerland.
Figure 9. 3D Views of the terminal airspaces of a rat at the age of 10 days (a), 21 (b) and 36 days (c). The alveolarizationprocess is clearly visible. Image courtesy of J. Schittny, University of Bern, Switzerland.
4.4. Multiscale imaging and analysis of the brain microvasculature
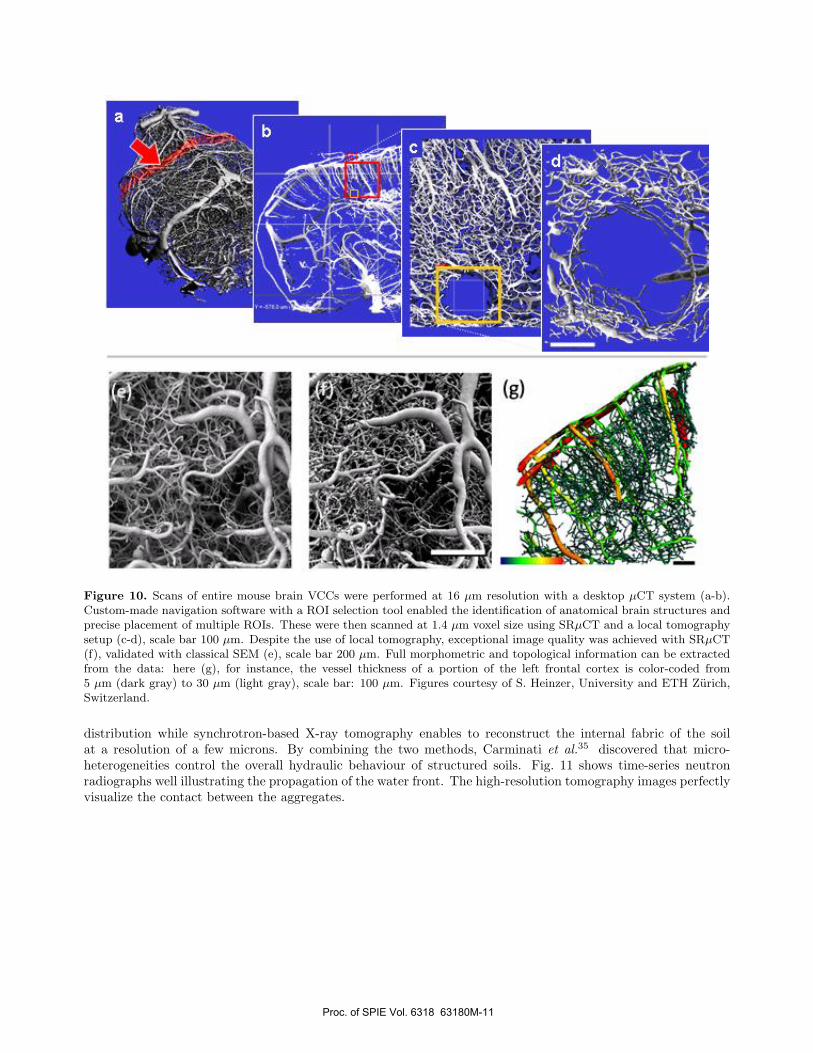
There is a wide range of diseases and normal physiological processes that are associated with alterations of thevascular system in organs. Heinzer et al.13 developed a method based on modified vascular corrosion casting(VCC), scanning electron microscopy (SEM) as well as desktop (µCT) and synchrotron radiation (SRµCT)technologies to image vasculature at increasing levels of resolution. This approach allows nondestructive 3Dvisualization and quantification of large microvascular networks, see Fig. 10, while retaining a precise anatomicalcontext for the region of interest (ROI) scanned at very high resolution. This enables qualitative and quantitativeassessment of vasculature at unprecedented resolution and volume with relatively high throughput, opening newpossibilities to study vessel architecture and vascular alterations in models of disease.
4.5. Monitoring water flow in soils using X-rays and neutron imaging
Soils are characterized by structures, such as aggregates and fissures, that crucially affect the movement ofwater, air and solids. Neutron radiography and tomography are efficient tools for real time monitoring of water
Proc. of SPIE Vol. 6318 63180M-10
Figure 10. Scans of entire mouse brain VCCs were performed at 16 µm resolution with a desktop µCT system (a-b).Custom-made navigation software with a ROI selection tool enabled the identification of anatomical brain structures andprecise placement of multiple ROIs. These were then scanned at 1.4 µm voxel size using SRµCT and a local tomographysetup (c-d), scale bar 100 µm. Despite the use of local tomography, exceptional image quality was achieved with SRµCT(f), validated with classical SEM (e), scale bar 200 µm. Full morphometric and topological information can be extractedfrom the data: here (g), for instance, the vessel thickness of a portion of the left frontal cortex is color-coded from5 µm (dark gray) to 30 µm (light gray), scale bar: 100 µm. Figures courtesy of S. Heinzer, University and ETH Zurich,Switzerland.
distribution while synchrotron-based X-ray tomography enables to reconstruct the internal fabric of the soilat a resolution of a few microns. By combining the two methods, Carminati et al.35 discovered that micro-heterogeneities control the overall hydraulic behaviour of structured soils. Fig. 11 shows time-series neutronradiographs well illustrating the propagation of the water front. The high-resolution tomography images perfectlyvisualize the contact between the aggregates.
Proc. of SPIE Vol. 6318 63180M-11
I mm 10 mm
Figure 11. Top left: soil aggregates are structural units frequently observed in top soils. Diameters range from onemillimeter to a few centimeters. Bottom left: Time-serises of neturon radiographs. Three aggregates were stacked,forming a sample 5 mm wide and 20 mm long. The initial water input propagates downwards, following gravity andcapillary forces. Right: Section of the contact between the aggregates before (top) and after (bottom) drainage. Imagecourtesy of A. Kaestner, ETH Zurich, Switzerland.
5. ACKNOWLEDGEMENTS
We gratefully acknowledge F. Pfeiffer, O. Bunk, C. David (PSI) and P. Cloetens (ESRF) for the measurementswith the grating interferometer at the ESRF.
REFERENCES1. U. Bonse and M. Hart, “An x-ray interferometer,” Applied Physics Letters. 6, pp. 155–157, 1965.2. P. Cloetens, W. Ludwig, J. Baruchel, D. V. Dyck, J. V. Landuyt, J. P. Guigay, and M. Schlenker, “Holo-
tomography: Quantitative phase tomography with micrometer resolution using hard synchrotron radiationX-rays,” Applied Physics Letters 75(19), pp. 2912–2914, 1999.
3. T. Weitkamp, F. Pfeiffer, O. Bunk, A. Diaz, M. Stampanoni, E. Ziegler, P. Cloetens, and C. David, “X-rayphase imaging with a grating interferometer,” Optics Express 13, pp. 6296–6304, 2005.
4. A. Groso, P. Schneider, S. Linga, R. Muller, R. Abela, and M. Stampanoni, “Phase contrast tomography:an alternative approach,” Applied Physics Letters 88, p. 214104, 2006.
5. A. Groso, R. Abela, and M. Stampanoni, “A fast method for high resolution phase contrast tomography,”Submitted .
6. F. Pfeiffer, O. Bunk, C. Schulze-Briese, A. Diaz, T. Weitkamp, C. David, J. F. van der Veen, I. Vartanyants,and I. K. Robinson, “Shearing interferometer for quantifying the coherence of hard x-ray beams,” PhysicalReview Letters 94, pp. 164801–4, 2005.
7. U. Bonse and F. Busch, “X-ray computed microtomography (µCT) using synchrotron radiation (SR),”Progress in Biophysics and Molecular Biology 65(1-2), p. 133, 1996.
8. R. Lee, B. Lai, W. Yun, D. C. Mancini, and Z. Cai, “X-ray microtomography as a fast three-dimensionalimaging technology using a CCD camera coupled with a CdWO4 single-crystal scintillator,” in Developmentsin X-Ray Tomography, U. Bonse, ed., Proc. SPIE 3149, p. 257, 1997.
9. T. Weitkamp, C. Raven, and A. Snigierv, “An imaging and microtomography facility at the ESRF beamlineID 22,” in Developments in X-Ray Tomography II, U. Bonse, ed., Proc. SPIE 3772, p. 311, 1999.
10. M. Stampanoni, G. L. Borchert, P. Wyss, R. Abela, B. D. Patterson, S. Hunt, D. Vermeulen, andP. Ruegsegger, “High resolution X-ray detector for synchrotron-based microtomography,” Nucl. Intrum.Meth. Phys. Res. A 491, pp. 291–301, 2002.
Proc. of SPIE Vol. 6318 63180M-12
11. S. Nuzzo, F. Peyrin, P. Cloetens, J. Baruchel, and G. Boivin, “Quantification of the degree of mineraliza-tion of bone in three dimensions using synchrotron radiation microtomography,” Medical Physics 29(11),pp. 2672–2681, 2002.
12. P. Thurner, P. Wyss, R. Voide, M. Stauber, M. Stampanoni, U. Sennhauser, and R. Muller, “Time-lapsedinvestigation of three-dimensional failure and damage accumulation in trabecular bone using synchrotronlight,” Bone , 2006. In press.
13. S. Heinzer, T. Krucker, M. Stampanoni, R. Abela, E. Meyer, A. Schuler, P. Schneider, and R. Muller,“Hierarchical microimaging for multiscale analysis of large vascular networks,” Neuroimage , 2006. In press.
14. B. Muller, M. Riedel, and P. Thurner, “Three-dimensional characterization of cell clusters using synchrotron-radiation-based micro-computed tomography,” Microscopy and microanalysis 12, pp. 97–105, 2006.
15. R. H. Mathiesen, L. Arnberg, F. Mo, T. Weitkamp, and A. Snigirev, “Time resolved x-ray imaging ofdendritic growth in binary alloys,” Physical Review Letters 83(24), pp. 5062–5065, 1999.
16. M. Heggli, T. E. amd P. Wyss, P. J. Uggowitzer, and A. A. Gusev, “Approaching representative volumeelement size in interpenetrating phase composites,” Advanced Engineering Materials 7(4), pp. 225–229,2005.
17. S. Waelchli, P. R. von Rohr, and M. Stampanoni, “Multiphase flow visualization in microchannels usingx-ray tomographic microscopy (xtm),” Journal of Flow Visualization and Image Processing 12, pp. 1–13,2005.
18. A. Momose, T. Takeda, Y. Itai, and K. Hirano, “Phase-contrast X-ray computed tomography for observingbiological soft tissues,” Nature Med. 2, pp. 473–475, 1996.
19. T. J. Davis, D. Gao, T. E. Gureyev, A. W. Stevenson, and S. W. Wilkins, “Phase-contrast imaging of weaklyabsorbing materials using hard X-rays,” Nature 373, pp. 595–598, 1995.
20. D. Chapman, W. Thomlinson, R. E. Johnston, D. Washburn, E. Pisano, N. Gmur, Z. Zhong, R. Menk,F. Arfelli, and D. Sayers, “Diffraction enhanced x-ray imaging,” Phys. Med. Biol. 42, pp. 2015–2025, 1997.
21. S. W. Wilkins, T. E. Gureyev, D. Gao, A. Pogany, and A. W. Stevenson, “Phase-contrast imaging usingpolychromatic hard x-rays,” Nature 384, pp. 335–337, 1996.
22. C. David, B. Nohammer, H. H. Solak, and E. Ziegler, “Differential x-ray phase contrast imaging using ashearing interferometer,” Applied Physics Letters 81(17), pp. 3287–3290, 2002.
23. K. Creath, “Phase-measurement interferometry techniques,” in Progress In Optics XXVI, E. Wolf, ed.,pp. 349–393, Elsevier Science, 1988.
24. A. V. Bronnikov, “Reconstruction formulas in phase-contrast tomography,” Opt. Comm. 171, pp. 239–244,1999.
25. A. V. Bronnikov, “Theory of quantitative phase-contrast computed tomography,” J. Opt. Soc. Am. A 19,pp. 472–480, 2002.
26. S. C. Mayo, P. R. Miller, S. W. Wilkins, T. J. Davis, D. Gao, T. E. Gureyev, D. Paganin, D. J. Parry,A. Pogany, and A. W. Stevenson, “Quantitative x-ray projection microscopy: phase-contrast and multi-spectral imaging,” Journal of Microscopy 207, pp. 79–96, 2002.
27. L. J. Allen, W. McBride, N. O’Leary, and M. P. Oxley, “Exit wave reconstruction at atomic resolution,”Ultramicroscopy 100, pp. 91–104, 2004.
28. W. K. Hsieh, F. R. Chen, J. J. Kai, and A. I. Kirkland, “Resolution extension and exit wave reconstructionin complex hrem,” Ultramicroscopy 98, pp. 99–114, 2004.
29. J. M. Cowley, Diffraction Physics, North-Holland, Amsterdam, second revised ed., 1981.30. B. D. Patterson, R. Abela, H. Auderset, Q. Chen, F. Fauth, F. Gozzo, G. Ingold, H. Kuhne, M. Lange,
D. Maden, D. Meister, P. Pattison, T. Schmidt, B. Schmitt, C. Schulze-Briese, M. Shi, M. Stampanoni, andP. R. Willmott, “The Materials Science Beamline at the Swiss Light Source design and realization,” Nucl.Intrum. Meth. Phys. Res. A 540, pp. 42–67, 2005.
31. P. C. J. Donoghue, S.Bengtson, X. Dong, N. J. Gostling, T. Huldtgren, J. A. Cunningham, C. Yin, Z. Yue,F. Peng, and M. Stampanoni, “Synchrotron x-ray tomographic microscopy of fossil embryos,” Nature , 2006.In press.
Proc. of SPIE Vol. 6318 63180M-13
32. P. Schneider, M. Stauber, R. Voide, M. Stampanoni, L. R. Donahue, P. Wyss, U. Sennhauser, and R. Muller,“Assessment of murine bone ultrastructure using synchrotron light - towards nano-computed tomography,”in This proceedings,
33. P. Schneider, M. Stauber, R. Voide, M. Stampanoni, L. R. Donahue, and R. Muller, “Hierarchical micro-and nano-compouted tomography: ultrastructural pheotypes in murine bone of two different inbred mousestrains,” Submitted .
34. J. C. Schittny, S. I. Mund, and M. Stampanoni, “Local capillary duplication at the basis of newly formingsepta allow late alveorization of juvenile and young adult lungs,” Submitted .
35. A. Carminati, A. Kaestner, P. Lehmann, H. Fluhler, E. Lehmann, R. Hassanein, P. Vontobel, M. Stam-panoni, and A. Groso, “Monitoring water flow in soils, using neutron and x-ray tomography,” PSI ScientificReport 2005 (1), pp. 28–29.