UNIVERSITÀ DI PISA CORSO DI DOTTORATO IN MICROBIOLOGIA E GENETICA Anno di inizio del corso di dottorato: 2006 “Polymorphic micro-RNA targets and risk of colorectal cancer” RELATORE: CANDIDATA: Dr. Stefano Landi Dr. Debora Landi
Transcript
UNIVERSITÀ DI PISA
CORSO DI DOTTORATO
IN MICROBIOLOGIA E GENETICA
Anno di inizio del corso di dottorato: 2006
“Polymorphic micro-RNA targets and risk of
colorectal cancer”
RELATORE: CANDIDATA:
Dr. Stefano Landi Dr. Debora Landi
2
INDEX
ABSTRACT 4
1. INTRODUCTION 6
1.1. MicroRNA 6
1.1.1. What is a microRNA? 6
1.1.2. MicroRNA discovery 6
1.1.3. Genomic localization 8
1.1.4. MicroRNA biogenesis 9
1.1.5. MicroRNA function 15
1.1.6. MicroRNAs and siRNAs 18
1.1.7. Polymorphisms and microRNA 19
1.1.8. Targets prediction and identification of new miRNAs 21
1.1.9. MicroRNAs and cancer 22
1.2. Sporadic Colorectal Cancer 26
1.2.1. Colorectal cancer epidemiology 26
1.2.2. Risk factors 28
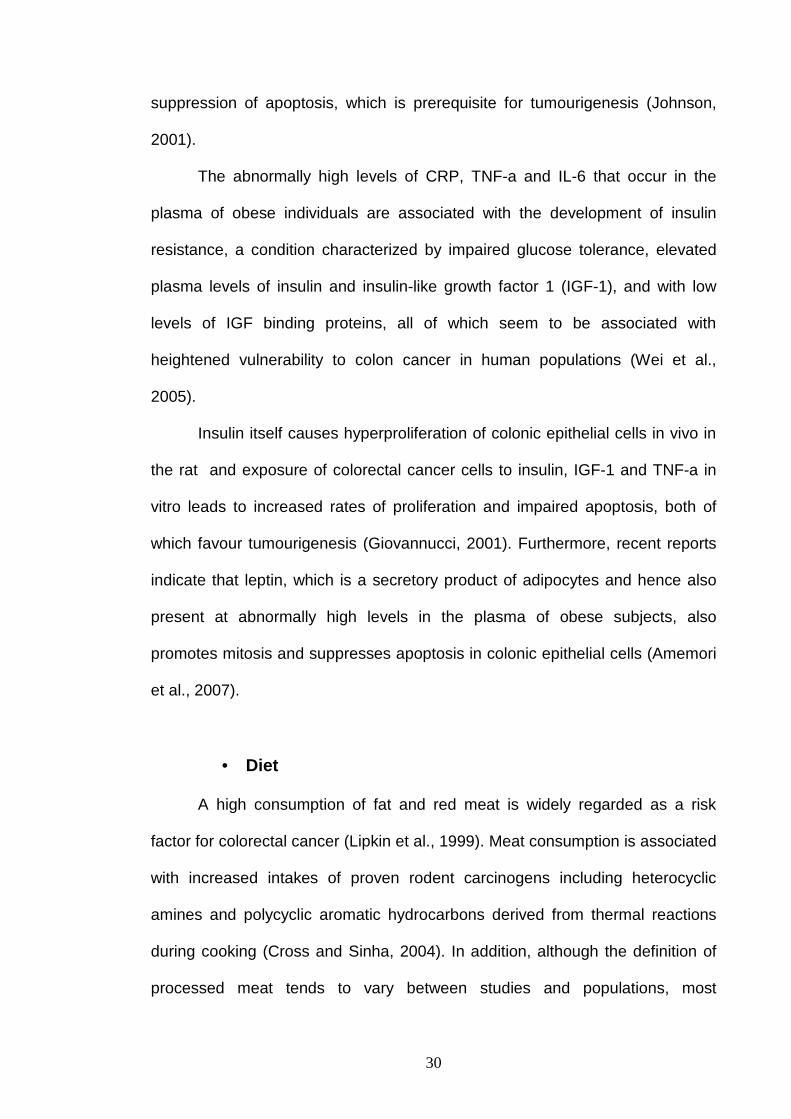
Obesity, physical activity and inflammation 28
Diet 30
1.3. Aim 34
2. MATERIALS AND METHODS 36
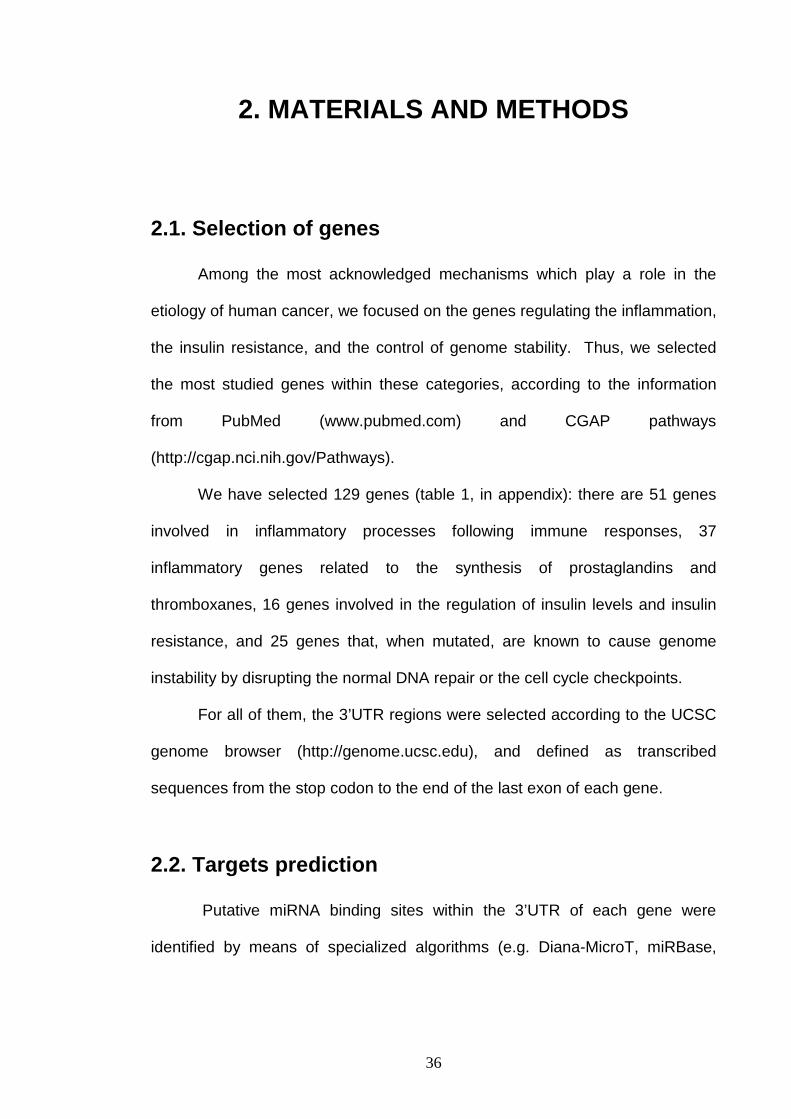
2.1. Selection of genes 36
2.2. Targets prediction 36
2.3. Selection of polymorphisms 38
2.4. Genotyping 40
2.4.1. Study populations 40
Czech Republic 40
Spain 42
Italy 43
3
German 44
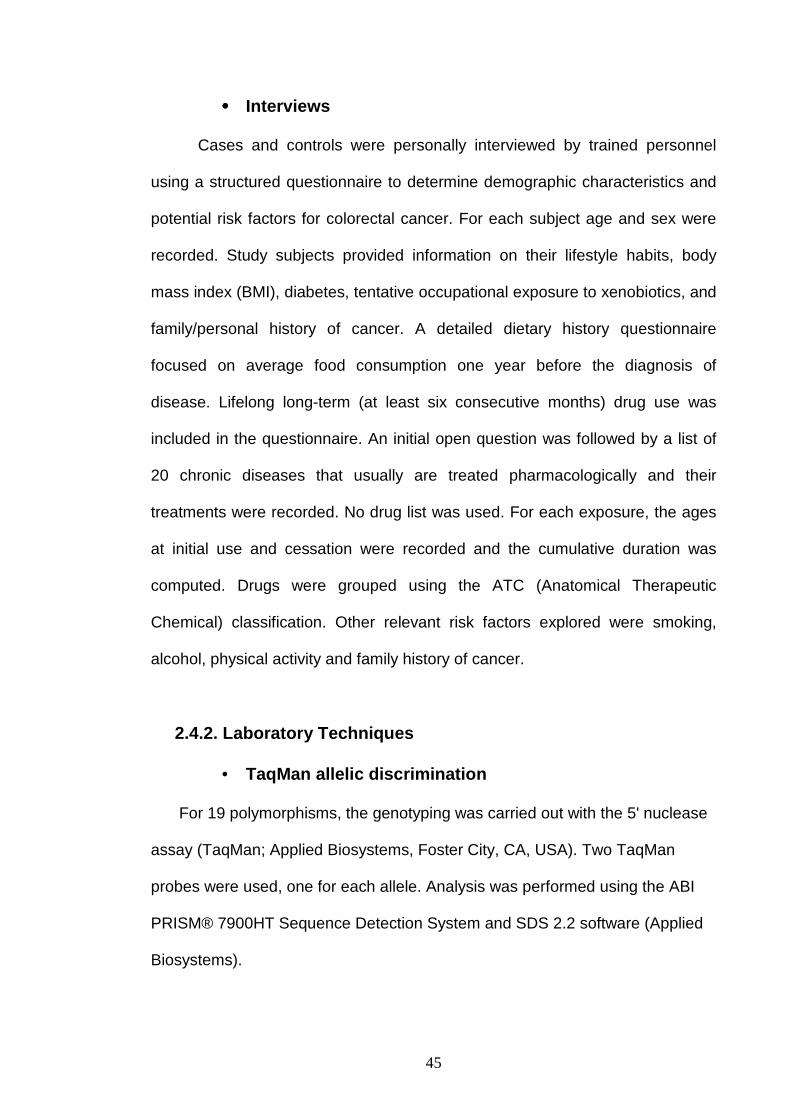
Interviews 45
2.4.2. Laboratory Techniques 45
TaqMan allelic discrimination 45
Oligonucleotide allele specific PCR (ASO-PCR) 48
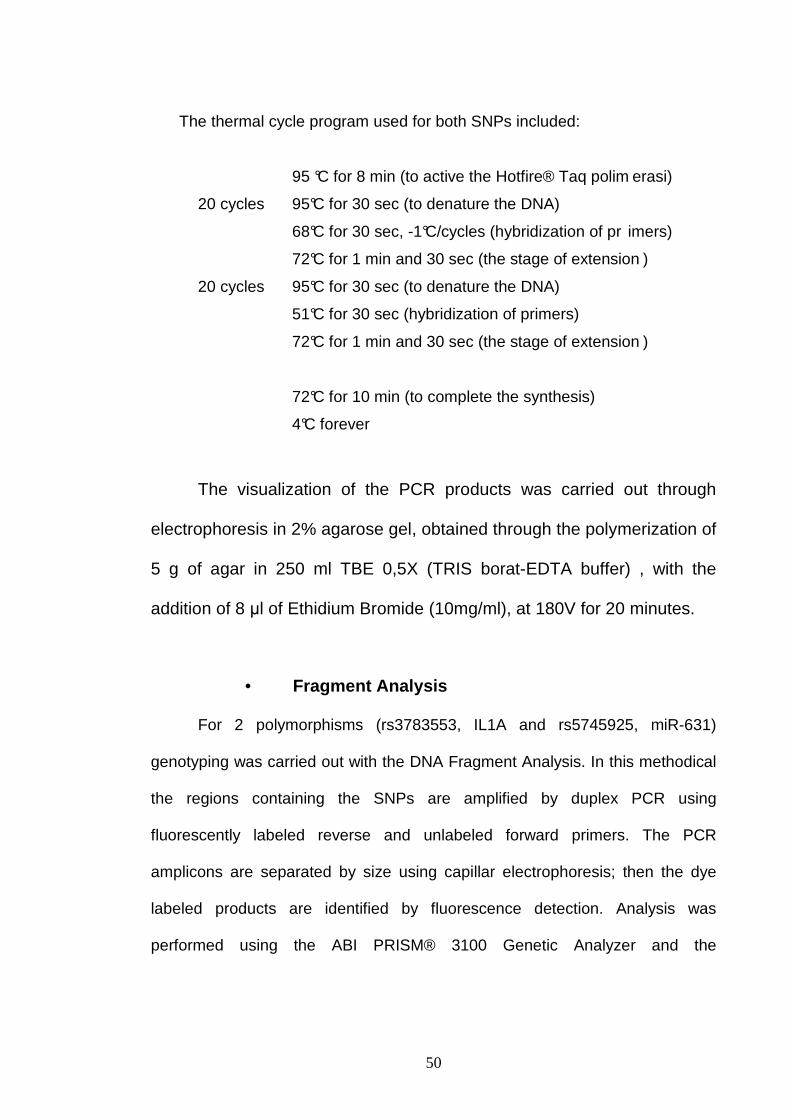
Fragment Analysis 50
2.4.3. Statistical Analysis 52
3. RESULTS 53
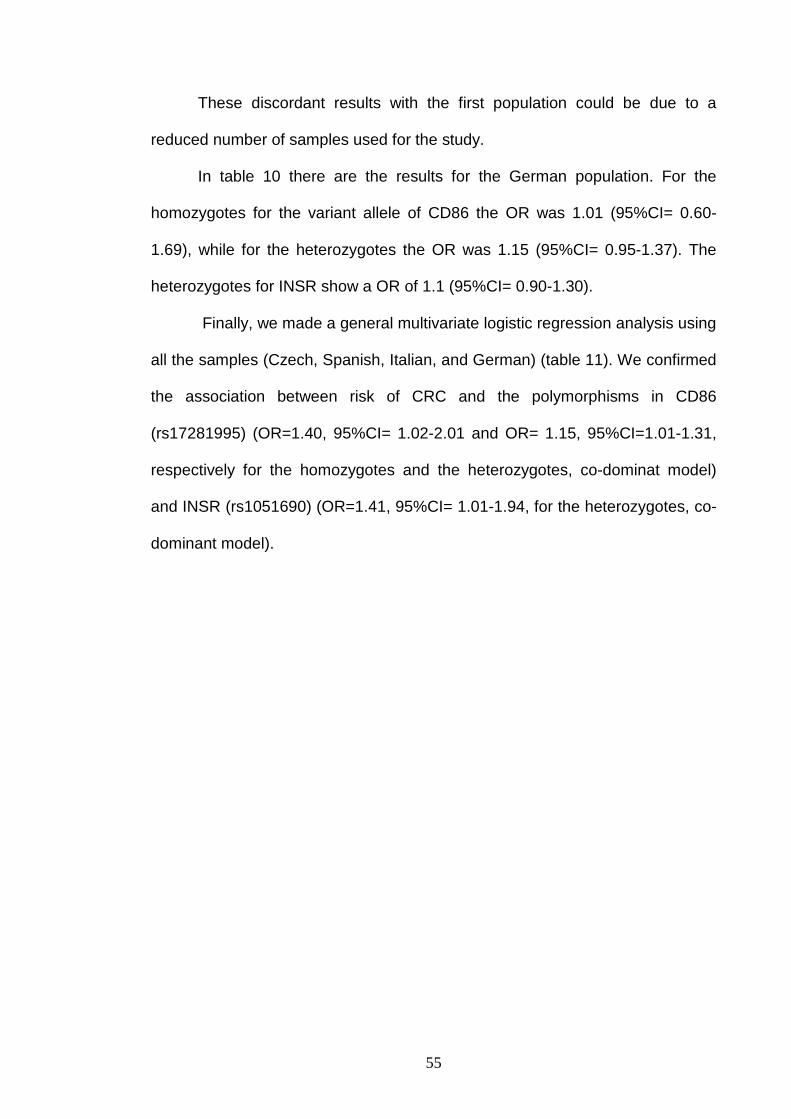
4. DISCUSSION 56
5. CONCLUSIONS 61
6. FUTURE PROSPECTIVES 62
APPENDIX 63
Table1 63
Table2 64
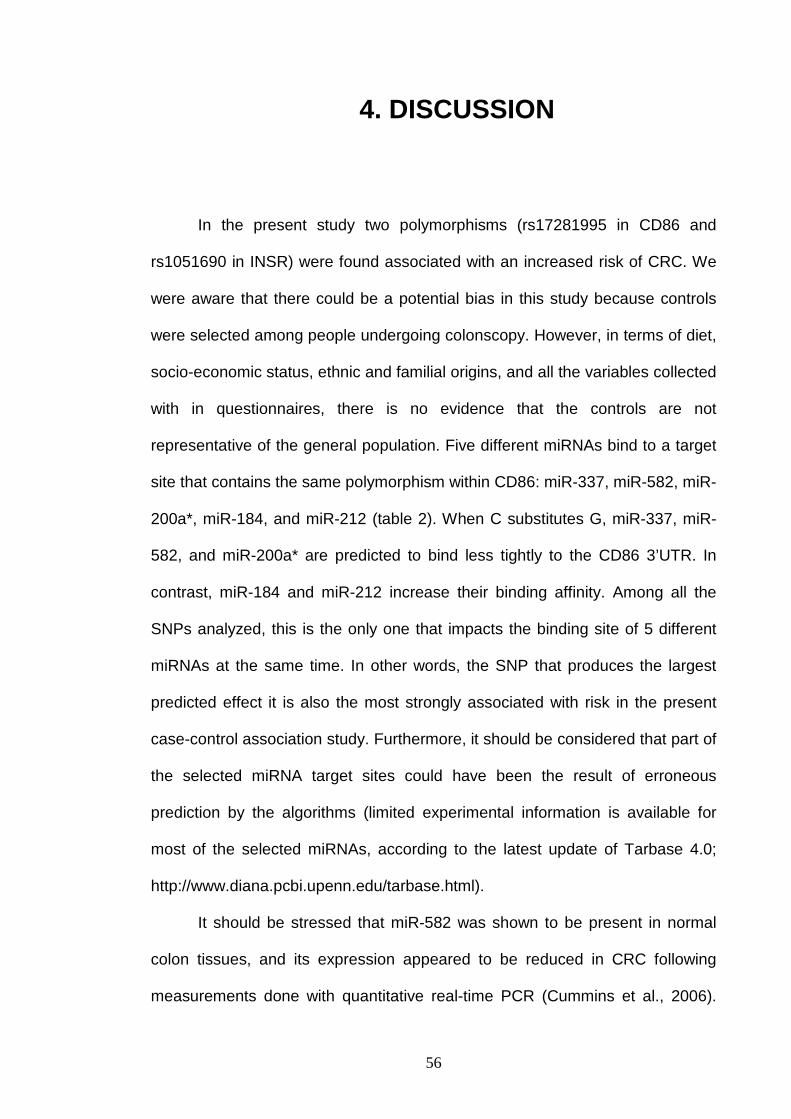
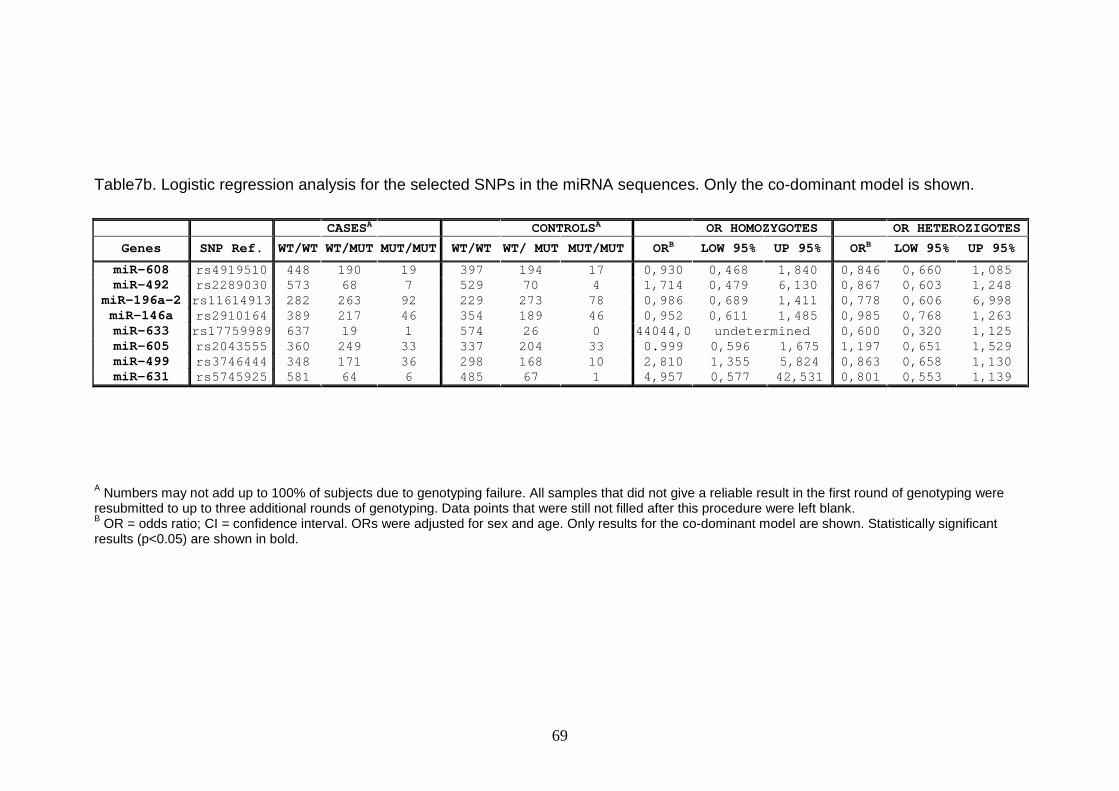
Table3 65
Table4 65
Table5 66
Table6 67
Table7a 68
Table7b 69
Table8 70
Table9 71
Table10 72
Table11 73
BIBLIOGRAPHY 74
4
ABSTRACT
Recent evidence indicate that small non-coding RNA molecules, called
micro-RNAs (miRNA), can bind to the 3’UTRs of mRNAs and interfere with their
translation, thereby regulating cell growth, differentiation, apoptosis, and
tumorigenesis. Genetic polymorphisms can reside on miRNA binding sites.
Thus, it is conceivable that the miRNA regulation may be affected by
polymorphisms on the 3’ UTRs. Since gene de-regulation is one of the key
mechanisms by which cells can progress to cancer, we hypothesize that
common polymorphisms within miRNA target binding sites could play a role in
the individual risk of cancer.
In the present study, we selected the 3’UTR regions of 129 genes candidate
for colorectal cancer (CRC) and we identified putative miRNA binding sites by
Table2. Candidate SNPs in miRNA target sequences, ranked by ∆∆G, expected to have a high impact on the ∆G (|∆∆GTOT|>3.10 KJ/mol) and with a frequency higher than 0.10 in Caucasians.
|∆∆G| |∆∆GTOT| Gene dbSNP ID Variation Frequency miRNA KJ/mol KJ/mol
A Numbers may not add up to 100% of subjects due to genotyping failure. All samples that did not give a reliable result in the first round of genotyping were resubmitted to up to three additional rounds of genotyping. Data points that were still not filled after this procedure were left blank. B OR = odds ratio; CI = confidence interval. ORs were adjusted for sex and age. Only results for the co-dominant model are shown. Statistically significant results (p<0.05) are shown in bold.
69
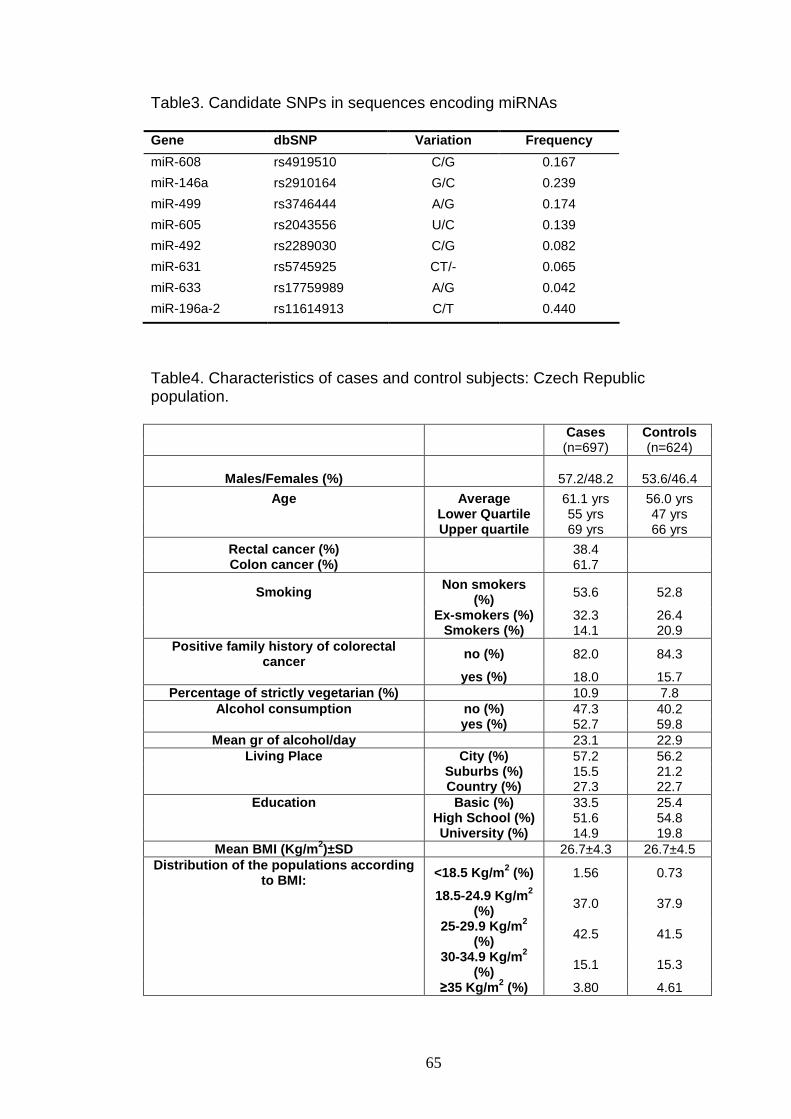
Table7b. Logistic regression analysis for the selected SNPs in the miRNA sequences. Only the co-dominant model is shown.
CASESA CONTROLSA OR HOMOZYGOTES OR HETEROZIGOTES
Genes SNP Ref. WT/WT WT/MUT MUT/MUT WT/WT WT/ MUT MUT/MUT ORB LOW 95% UP 95% ORB LOW 95% UP 95%
A Numbers may not add up to 100% of subjects due to genotyping failure. All samples that did not give a reliable result in the first round of genotyping were resubmitted to up to three additional rounds of genotyping. Data points that were still not filled after this procedure were left blank. B OR = odds ratio; CI = confidence interval. ORs were adjusted for sex and age. Only results for the co-dominant model are shown. Statistically significant results (p<0.05) are shown in bold.
70
Table8. Logistic regression analysis for the SNPs in CD86 and INSR genes: Spain population. Only the co-dominant model is
A Numbers may not add up to 100% of subjects due to genotyping failure. All samples that did not give a reliable result in the first round of genotyping were resubmitted to up to three additional rounds of genotyping. Data points that were still not filled after this procedure were left blank. B OR = odds ratio; CI = confidence interval. ORs were adjusted for sex and age. Only results for the co-dominant model are shown. Statistically significant results (p<0.05) are shown in bold.
71
Table9. Logistic regression analysis for the SNPs in CD86 and INSR genes: Italian population. Only the co-dominant model is
A Numbers may not add up to 100% of subjects due to genotyping failure. All samples that did not give a reliable result in the first round of genotyping were resubmitted to up to three additional rounds of genotyping. Data points that were still not filled after this procedure were left blank. B OR = odds ratio; CI = confidence interval. ORs were adjusted for sex and age. Only results for the co-dominant model are shown. Statistically significant results (p<0.05) are shown in bold.
72
Table10. Logistic regression analysis for the SNPs in CD86 and INSR genes: German population. Only the co-dominant model is
A Numbers may not add up to 100% of subjects due to genotyping failure. All samples that did not give a reliable result in the first round of genotyping were resubmitted to up to three additional rounds of genotyping. Data points that were still not filled after this procedure were left blank. B OR = odds ratio; CI = confidence interval. ORs were adjusted for sex and age. Only results for the co-dominant model are shown. Statistically significant results (p<0.05) are shown in bold.
73
Table11. General logistic regression analysis for the SNPs in CD86 and INSR genes: Czech Republic, Spain, Italian, and German
A Numbers may not add up to 100% of subjects due to genotyping failure. All samples that did not give a reliable result in the first round of genotyping were resubmitted to up to three additional rounds of genotyping. Data points that were still not filled after this procedure were left blank. B OR = odds ratio; CI = confidence interval. ORs were adjusted for sex and age. Only results for the co-dominant model are shown. Statistically significant results (p<0.05) are shown in bold.
BIBLIOGRAPHY
1. Abelson,J.F., Kwan,K.Y., O'Roak,B.J., Baek,D.Y., Stillman,A.A., Morgan,T.M., Mathews,C.A., Pauls,D.L., Rasin,M.R., Gunel,M., Davis,N.R., Ercan-Sencicek,A.G., Guez,D.H., Spertus,J.A., Leckman,J.F., Dure,L.S., Kurlan,R., Singer,H.S., Gilbert,D.L., Farhi,A., Louvi,A., Lifton,R.P., Sestan,N., and State MW (2005). Sequence variants in SLITRK1 are associated with Tourette's syndrome. Science. 310, 317-320.
2. Akao,Y., Nakagawa,Y., and Naoe,T. (2006). let-7 microRNA functions as a potential growth suppressor in human colon cancer cells. Biol. Pharm. Bull. 29, 903-906.
3. Ambros,V., Bartel,B., Bartel,D.P., Burge,C.B., Carrington,J.C., Chen,X., Dreyfuss,G., Eddy,S.R., Griffiths-Jones,S., Marshall,M., Matzke,M., Ruvkun,G., and Tuschl,T. (2003a). A uniform system for microRNA annotation. RNA. 9, 277-279.
4. Ambros,V., Lee,R.C., Lavanway,A., Williams,P.T., and Jewell,D. (2003b). MicroRNAs and other tiny endogenous RNAs in C. elegans. Curr. Biol. 13, 807-818.
5. Ambros,V., Lee,R.C., Lavanway,A., Williams,P.T., and Jewell,D. (2003c). MicroRNAs and other tiny endogenous RNAs in C. elegans. Curr. Biol. 13, 807-818.
6. Amemori,S., Ootani,A., Aoki,S., Fujise,T., Shimoda,R., Kakimoto,T., Shiraishi,R., Sakata,Y., Tsunada,S., Iwakiri,R., and Fujimoto,K. (2007). Adipocytes and preadipocytes promote the proliferation of colon cancer cells in vitro. Am. J. Physiol Gastrointest. Liver Physiol. 292, G923-G929.
7. Ames,B.N. (2001). DNA damage from micronutrient deficiencies is likely to be a major cause of cancer. Mutat. Res. 475, 7-20.
8. Aravin,A.A., Hannon,G.J., and Brennecke,J. (2007). The Piwi-piRNA pathway provides an adaptive defense in the transposon arms race. Science. 318, 761-764.
9. Aravin,A.A., Naumova,N.M., Tulin,A.V., Vagin,V.V., Rozovsky,Y.M., and Gvozdev,V.A. (2001). Double-stranded RNA-mediated silencing of genomic tandem repeats and transposable elements in the D. melanogaster germline. Curr. Biol. 11, 1017-1027.
12. Baskerville,S. and Bartel,D.P. (2005). Microarray profiling of microRNAs reveals frequent coexpression with neighboring miRNAs and host genes. RNA. 11, 241-247.
13. Basyuk,E., Suavet,F., Doglio,A., Bordonne,R., and Bertrand,E. (2003). Human let-7 stem-loop precursors harbor features of RNase III cleavage products. Nucleic Acids Res. 31, 6593-6597.
15. Bernstein,E., Caudy,A.A., Hammond,S.M., and Hannon,G.J. (2001). Role for a bidentate ribonuclease in the initiation step of RNA interference. Nature. 409, 363-366.
16. Bhatia,S., Edidin,M., Almo,S.C., and Nathenson,S.G. (2006). B7-1 and B7-2: similar costimulatory ligands with different biochemical, oligomeric and signaling properties. Immunol. Lett. 104, 70-75.
17. Bingham,S.A., Pignatelli,B., Pollock,J.R., Ellul,A., Malaveille,C., Gross,G., Runswick,S., Cummings,J.H., and O'Neill,I.K. (1996). Does increased endogenous formation of N-nitroso compounds in the human colon explain the association between red meat and colon cancer? Carcinogenesis. 17, 515-523.
18. Borchert,G.M., Lanier,W., and Davidson,B.L. (2006). RNA polymerase III transcribes human microRNAs. Nat. Struct. Mol. Biol. 13, 1097-1101.
19. Boyle,P. and Langman,J.S. (2000). ABC of colorectal cancer: Epidemiology. BMJ 321, 805-808.
20. Brennecke,J., Stark,A., Russell,R.B., and Cohen,S.M. (2005). Principles of microRNA-target recognition. PLoS. Biol. 3, e85.
21. Calin,G.A., Dumitru,C.D., Shimizu,M., Bichi,R., Zupo,S., Noch,E., Aldler,H., Rattan,S., Keating,M., Rai,K., Rassenti,L., Kipps,T., Negrini,M., Bullrich,F., and Croce,C.M. (2002). Frequent deletions and down-regulation of micro- RNA genes miR15 and miR16 at 13q14 in chronic lymphocytic leukemia. Proc. Natl. Acad. Sci. U. S. A 99, 15524-15529.
22. Calin,G.A., Ferracin,M., Cimmino,A., Di,L.G., Shimizu,M., Wojcik,S.E., Iorio,M.V., Visone,R., Sever,N.I., Fabbri,M., Iuliano,R., Palumbo,T., Pichiorri,F., Roldo,C., Garzon,R., Sevignani,C., Rassenti,L., Alder,H., Volinia,S., Liu,C.G., Kipps,T.J., Negrini,M., and Croce,C.M. (2005). A MicroRNA signature associated with prognosis and progression in chronic lymphocytic leukemia. N. Engl. J. Med. 353, 1793-1801.
23. Carmell,M.A., Xuan,Z., Zhang,M.Q., and Hannon,G.J. (2002). The Argonaute family: tentacles that reach into RNAi, developmental control, stem cell maintenance, and tumorigenesis. Genes Dev. 16, 2733-2742.
25. Chan,J.A., Krichevsky,A.M., and Kosik,K.S. (2005). MicroRNA-21 is an antiapoptotic factor in human glioblastoma cells. Cancer Res. 65, 6029-6033.
26. Cimmino,A., Calin,G.A., Fabbri,M., Iorio,M.V., Ferracin,M., Shimizu,M., Wojcik,S.E., Aqeilan,R.I., Zupo,S., Dono,M., Rassenti,L., Alder,H., Volinia,S., Liu,C.G., Kipps,T.J., Negrini,M., and Croce,C.M. (2005). miR-15 and miR-16 induce apoptosis by targeting BCL2. Proc. Natl. Acad. Sci. U. S. A. 102, 13944-13949.
27. Clop,A., Marcq,F., Takeda,H., Pirottin,D., Tordoir,X., Bibe,B., Bouix,J., Caiment,F., Elsen,J.M., Eychenne,F., Larzul,C., Laville,E., Meish,F., Milenkovic,D., Tobin,J., Charlier,C., and Georges,M. (2006). A mutation creating a potential illegitimate microRNA target site in the myostatin gene affects muscularity in sheep. Nat. Genet. 38, 813-818.
28. Cross,A.J. and Sinha,R. (2004). Meat-related mutagens/carcinogens in the etiology of colorectal cancer. Environ. Mol. Mutagen. 44, 44-55.
29. Cullen,B.R. (2004). Transcription and processing of human microRNA precursors. Mol. Cell 16, 861-865.
30. Cummins,J.M., He,Y., Leary,R.J., Pagliarini,R., Diaz,L.A., Jr., Sjoblom,T., Barad,O., Bentwich,Z., Szafranska,A.E., Labourier,E., Raymond,C.K., Roberts,B.S., Juhl,H., Kinzler,K.W., Vogelstein,B., and Velculescu,V.E. (2006). The colorectal microRNAome. Proc. Natl. Acad. Sci. U. S. A 103, 3687-3692.
31. Duan,R., Pak,C., and Jin,P. (2007). Single nucleotide polymorphism associated with mature miR-125a alters the processing of pri-miRNA. Hum. Mol. Genet. 16, 1124-1131.
32. Dugas,D.V. and Bartel,B. (2004). MicroRNA regulation of gene expression in plants. Curr. Opin. Plant Biol. 7, 512-520.
33. Eis,P.S., Tam,W., Sun,L., Chadburn,A., Li,Z., Gomez,M.F., Lund,E., and Dahlberg,J.E. (2005). Accumulation of miR-155 and BIC RNA in human B cell lymphomas. Proc. Natl. Acad. Sci. U. S. A. 102, 3627-3632.
34. Esquela-Kerscher,A. and Slack,F.J. (2006). Oncomirs - microRNAs with a role in cancer. Nat. Rev. Cancer. 6, 259-269.
35. Esteller,M. and Herman,J.G. (2002). Cancer as an epigenetic disease: DNA methylation and chromatin alterations in human tumours. J. Pathol. 196, 1-7.
36. Fantuzzi,G. (2005). Adipose tissue, adipokines, and inflammation. J. Allergy Clin. Immunol. 115, 911-919.
77
37. Filipowicz,W., Jaskiewicz,L., Kolb,F.A., and Pillai,R.S. (2005). Post-transcriptional gene silencing by siRNAs and miRNAs. Curr. Opin. Struct. Biol. 15, 331-341.
38. Fire,A., Xu,S., Montgomery,M.K., Kostas,S.A., Driver,S.E., and Mello,C.C. (1998). Potent and specific genetic interference by double-stranded RNA in Caenorhabditis elegans. Nature. %19;391, 806-811.
39. Flood,D.M., Weiss,N.S., Cook,L.S., Emerson,J.C., Schwartz,S.M., and Potter,J.D. (2000). Colorectal cancer incidence in Asian migrants to the United States and their descendants. Cancer Causes Control 11, 403-411.
40. Foti,D., Iuliano,R., Chiefari,E., and Brunetti,A. (2003). A nucleoprotein complex containing Sp1, C/EBP beta, and HMGI-Y controls human insulin receptor gene transcription. Mol. Cell Biol. 23, 2720-2732.
41. Fukuda,T., Yamagata,K., Fujiyama,S., Matsumoto,T., Koshida,I., Yoshimura,K., Mihara,M., Naitou,M., Endoh,H., Nakamura,T., Akimoto,C., Yamamoto,Y., Katagiri,T., Foulds,C., Takezawa,S., Kitagawa,H., Takeyama,K., O'Malley,B.W., and Kato,S. (2007). DEAD-box RNA helicase subunits of the Drosha complex are required for processing of rRNA and a subset of microRNAs. Nat. Cell Biol. 9, 604-611.
42. Gafa,R. and Lanza,G. (1998). [Expression of protein p53 in the adenoma-colorectal carcinoma sequence]. Pathologica. 90, 351-356.
43. Garland,C.F. and Garland,F.C. (2006). Do sunlight and vitamin D reduce the likelihood of colon cancer? Int. J. Epidemiol. 35, 217-220.
44. Gauwerky,C.E., Huebner,K., Isobe,M., Nowell,P.C., and Croce,C.M. (1989). Activation of MYC in a masked t(8;17) translocation results in an aggressive B-cell leukemia. Proc. Natl. Acad. Sci. U. S. A. 86, 8867-8871.
45. Giovannucci,E. (2001). Insulin, insulin-like growth factors and colon cancer: a review of the evidence. J. Nutr. 131, 3109S-3120S.
46. Giovannucci,E., Stampfer,M.J., Colditz,G.A., Rimm,E.B., Trichopoulos,D., Rosner,B.A., Speizer,F.E., and Willett,W.C. (1993). Folate, methionine, and alcohol intake and risk of colorectal adenoma. J. Natl. Cancer Inst. 85, 875-884.
47. Gregory,R.I., Chendrimada,T.P., Cooch,N., and Shiekhattar,R. (2005). Human RISC couples microRNA biogenesis and posttranscriptional gene silencing. Cell. 123, 631-640.
48. Griffiths-Jones,S., Grocock,R.J., van,D.S., Bateman,A., and Enright,A.J. (2006). miRBase: microRNA sequences, targets and gene nomenclature. Nucleic Acids Res. 34, D140-D144.
78
49. Guil,S. and Caceres,J.F. (2007). The multifunctional RNA-binding protein hnRNP A1 is required for processing of miR-18a. Nat. Struct. Mol. Biol. 14, 591-596.
50. Gunter,M.J. and Leitzmann,M.F. (2006). Obesity and colorectal cancer: epidemiology, mechanisms and candidate genes. J. Nutr. Biochem. 17, 145-156.
51. Gunter,M.J., Stolzenberg-Solomon,R., Cross,A.J., Leitzmann,M.F., Weinstein,S., Wood,R.J., Virtamo,J., Taylor,P.R., Albanes,D., and Sinha,R. (2006). A prospective study of serum C-reactive protein and colorectal cancer risk in men. Cancer Res. 66, 2483-2487.
52. Hall,M.N., Campos,H., Li,H., Sesso,H.D., Stampfer,M.J., Willett,W.C., and Ma,J. (2007). Blood levels of long-chain polyunsaturated fatty acids, aspirin, and the risk of colorectal cancer. Cancer Epidemiol. Biomarkers Prev. 16, 314-321.
53. Han,J., Lee,Y., Yeom,K.H., Kim,Y.K., Jin,H., and Kim,V.N. (2004). The Drosha-DGCR8 complex in primary microRNA processing. Genes Dev. 18, 3016-3027.
54. Han,J., Lee,Y., Yeom,K.H., Nam,J.W., Heo,I., Rhee,J.K., Sohn,S.Y., Cho,Y., Zhang,B.T., and Kim,V.N. (2006). Molecular basis for the recognition of primary microRNAs by the Drosha-DGCR8 complex. Cell 125, 887-901.
55. Haruta,T., Imamura,T., Iwanishi,M., Egawa,K., Goji,K., and Kobayashi,M. (1995). Amplification and analysis of promoter region of insulin receptor gene in a patient with leprechaunism associated with severe insulin resistance. Metabolism. 44, 430-437.
56. He,L., Thomson,J.M., Hemann,M.T., Hernando-Monge,E., Mu,D., Goodson,S., Powers,S., Cordon-Cardo,C., Lowe,S.W., Hannon,G.J., and Hammond,S.M. (2005). A microRNA polycistron as a potential human oncogene. Nature. 435, 828-833.
57. Humphreys,D.T., Westman,B.J., Martin,D.I., and Preiss,T. (2005). MicroRNAs control translation initiation by inhibiting eukaryotic initiation factor 4E/cap and poly(A) tail function. Proc. Natl. Acad. Sci. U. S. A. 102, 16961-16966.
58. Iorio,M.V., Ferracin,M., Liu,C.G., Veronese,A., Spizzo,R., Sabbioni,S., Magri,E., Pedriali,M., Fabbri,M., Campiglio,M., Menard,S., Palazzo,J.P., Rosenberg,A., Musiani,P., Volinia,S., Nenci,I., Calin,G.A., Querzoli,P., Negrini,M., and Croce,C.M. (2005). MicroRNA gene expression deregulation in human breast cancer. Cancer Res. 65, 7065-7070.
59. Iwai,N. and Naraba,H. (2005). Polymorphisms in human pre-miRNAs. Biochem. Biophys. Res. Commun. 331, 1439-1444.
79
60. John,B., Enright,A.J., Aravin,A., Tuschl,T., Sander,C., and Marks,D.S. (2004). Human MicroRNA targets. PLoS. Biol. 2, e363.
62. Johnson,I.T. (2001). Mechanisms and anticarcinogenic effects of diet-related apoptosis in the intestinal mucosa. Nutr. Res. Rev. 14, 229-256.
63. Johnson,S.M., Grosshans,H., Shingara,J., Byrom,M., Jarvis,R., Cheng,A., Labourier,E., Reinert,K.L., Brown,D., and Slack,F.J. (2005). RAS is regulated by the let-7 microRNA family. Cell. 120, 635-647.
64. Kadowaki,T., Kadowaki,H., Rechler,M.M., Serrano-Rios,M., Roth,J., Gorden,P., and Taylor,S.I. (1990). Five mutant alleles of the insulin receptor gene in patients with genetic forms of insulin resistance. J. Clin. Invest. 86, 254-264.
65. Keku,T.O., Lund,P.K., Galanko,J., Simmons,J.G., Woosley,J.T., and Sandler,R.S. (2005). Insulin resistance, apoptosis, and colorectal adenoma risk. Cancer Epidemiol. Biomarkers Prev. 14, 2076-2081.
66. Kelly,D. and Conway,S. (2005). Bacterial modulation of mucosal innate immunity. Mol. Immunol. 42, 895-901.
67. Kim,V.N. (2006). Small RNAs just got bigger: Piwi-interacting RNAs (piRNAs) in mammalian testes. Genes Dev. 20, 1993-1997.
68. Kiriakidou,M., Nelson,P.T., Kouranov,A., Fitziev,P., Bouyioukos,C., Mourelatos,Z., and Hatzigeorgiou,A. (2004). A combined computational-experimental approach predicts human microRNA targets. Genes Dev. 18, 1165-1178.
70. Krutzfeldt,J., Poy,M.N., and Stoffel,M. (2006). Strategies to determine the biological function of microRNAs. Nat. Genet. 38 Suppl:S14-9., S14-S19.
71. Kutay,H., Bai,S., Datta,J., Motiwala,T., Pogribny,I., Frankel,W., Jacob,S.T., and Ghoshal,K. (2006). Downregulation of miR-122 in the rodent and human hepatocellular carcinomas. J. Cell Biochem. 99, 671-678.
72. Lagos-Quintana,M., Rauhut,R., Meyer,J., Borkhardt,A., and Tuschl,T. (2003). New microRNAs from mouse and human. RNA. 9, 175-179.
80
73. Lai,E.C. (2002). Micro RNAs are complementary to 3' UTR sequence motifs that mediate negative post-transcriptional regulation. Nat. Genet. 30, 363-364.
74. Lamlum,H., Papadopoulou,A., Ilyas,M., Rowan,A., Gillet,C., Hanby,A., Talbot,I., Bodmer,W., and Tomlinson,I. (2000). APC mutations are sufficient for the growth of early colorectal adenomas. Proc. Natl. Acad. Sci. U. S. A. 97, 2225-2228.
75. Law,M.E., Templeton,K.L., Kitange,G., Smith,J., Misra,A., Feuerstein,B.G., and Jenkins,R.B. (2005). Molecular cytogenetic analysis of chromosomes 1 and 19 in glioma cell lines. Cancer Genet. Cytogenet. 160, 1-14.
76. Lee,R.C. and Ambros,V. (2001). An extensive class of small RNAs in Caenorhabditis elegans. Science 294, 862-864.
77. Lee,R.C., Feinbaum,R.L., and Ambros,V. (1993b). The C. elegans heterochronic gene lin-4 encodes small RNAs with antisense complementarity to lin-14. Cell. 75, 843-854.
78. Lee,R.C., Feinbaum,R.L., and Ambros,V. (1993a). The C. elegans heterochronic gene lin-4 encodes small RNAs with antisense complementarity to lin-14. Cell 75, 843-854.
79. Lee,Y., Kim,M., Han,J., Yeom,K.H., Lee,S., Baek,S.H., and Kim,V.N. (2004). MicroRNA genes are transcribed by RNA polymerase II. EMBO J. 23, 4051-4060.
80. Lewis,B.P., Shih,I.H., Jones-Rhoades,M.W., Bartel,D.P., and Burge,C.B. (2003). Prediction of mammalian microRNA targets. Cell. 115, 787-798.
82. Lin,H.J., Probst-Hensch,N.M., Louie,A.D., Kau,I.H., Witte,J.S., Ingles,S.A., Frankl,H.D., Lee,E.R., and Haile,R.W. (1998). Glutathione transferase null genotype, broccoli, and lower prevalence of colorectal adenomas. Cancer Epidemiol. Biomarkers Prev. 7, 647-652.
83. Lindbo,J.A., Silva-Rosales,L., Proebsting,W.M., and Dougherty,W.G. (1993). Induction of a Highly Specific Antiviral State in Transgenic Plants: Implications for Regulation of Gene Expression and Virus Resistance. Plant Cell. 5, 1749-1759.
84. Lingel,A., Simon,B., Izaurralde,E., and Sattler,M. (2004). Nucleic acid 3'-end recognition by the Argonaute2 PAZ domain. Nat. Struct. Mol. Biol. 11, 576-577.
85. Linsley,P.S., Brady,W., Grosmaire,L., Aruffo,A., Damle,N.K., and Ledbetter,J.A. (1991). Binding of the B cell activation antigen B7 to CD28
81
costimulates T cell proliferation and interleukin 2 mRNA accumulation. J. Exp. Med. 173, 721-730.
86. Lipkin,M., Reddy,B., Newmark,H., and Lamprecht,S.A. (1999). Dietary factors in human colorectal cancer. Annu. Rev. Nutr. 19:545-86., 545-586.
87. Liu,J., Carmell,M.A., Rivas,F.V., Marsden,C.G., Thomson,J.M., Song,J.J., Hammond,S.M., Joshua-Tor,L., and Hannon,G.J. (2004). Argonaute2 is the catalytic engine of mammalian RNAi. Science. 305, 1437-1441.
88. Lund,E.K., Wharf,S.G., Fairweather-Tait,S.J., and Johnson,I.T. (1999). Oral ferrous sulfate supplements increase the free radical-generating capacity of feces from healthy volunteers. Am. J. Clin. Nutr. 69, 250-255.
89. MacInnis,R.J., English,D.R., Hopper,J.L., Gertig,D.M., Haydon,A.M., and Giles,G.G. (2006). Body size and composition and colon cancer risk in women. Int. J. Cancer. 118, 1496-1500.
90. Maniataki,E. and Mourelatos,Z. (2005). A human, ATP-independent, RISC assembly machine fueled by pre-miRNA. Genes Dev. 19, 2979-2990.
91. Martin,M.M., Buckenberger,J.A., Jiang,J., Malana,G.E., Nuovo,G.J., Chotani,M., Feldman,D.S., Schmittgen,T.D., and Elton,T.S. (2007). The human angiotensin II type 1 receptor +1166 A/C polymorphism attenuates microrna-155 binding. J. Biol. Chem. 282, 24262-24269.
92. Martinez,J. and Tuschl,T. (2004). RISC is a 5' phosphomonoester-producing RNA endonuclease. Genes Dev. 18, 975-980.
93. Michael,M.Z., O' Connor,S.M., van Holst Pellekaan,N.G., Young,G.P., and James,R.J. (2003). Reduced accumulation of specific microRNAs in colorectal neoplasia. Mol. Cancer Res. 1, 882-891.
94. Moore,L.L., Bradlee,M.L., Singer,M.R., Splansky,G.L., Proctor,M.H., Ellison,R.C., and Kreger,B.E. (2004). BMI and waist circumference as predictors of lifetime colon cancer risk in Framingham Study adults. Int. J. Obes. Relat Metab Disord. 28, 559-567.
95. Mourelatos,Z., Dostie,J., Paushkin,S., Sharma,A., Charroux,B., Abel,L., Rappsilber,J., Mann,M., and Dreyfuss,G. (2002). miRNPs: a novel class of ribonucleoproteins containing numerous microRNAs. Genes Dev. 16, 720-728.
96. Munkholm,P. (2003). Review article: the incidence and prevalence of colorectal cancer in inflammatory bowel disease. Aliment. Pharmacol. Ther. 18 Suppl 2:1-5., 1-5.
82
97. Nelson,P.T., Hatzigeorgiou,A.G., and Mourelatos,Z. (2004). miRNP:mRNA association in polyribosomes in a human neuronal cell line. RNA. 10, 387-394.
98. Norat,T., Bingham,S., Ferrari,P., Slimani,N., Jenab,M., Mazuir,M., Overvad,K., Olsen,A., Tjonneland,A., Clavel,F., Boutron-Ruault,M.C., Kesse,E., Boeing,H., Bergmann,M.M., Nieters,A., Linseisen,J., Trichopoulou,A., Trichopoulos,D., Tountas,Y., Berrino,F., Palli,D., Panico,S., Tumino,R., Vineis,P., Bueno-de-Mesquita,H.B., Peeters,P.H., Engeset,D., Lund,E., Skeie,G., Ardanaz,E., Gonzalez,C., Navarro,C., Quiros,J.R., Sanchez,M.J., Berglund,G., Mattisson,I., Hallmans,G., Palmqvist,R., Day,N.E., Khaw,K.T., Key,T.J., San,J.M., Hemon,B., Saracci,R., Kaaks,R., and Riboli,E. (2005). Meat, fish, and colorectal cancer risk: the European Prospective Investigation into cancer and nutrition. J. Natl. Cancer Inst. 97, 906-916.
99. Nottrott,S., Simard,M.J., and Richter,J.D. (2006). Human let-7a miRNA blocks protein production on actively translating polyribosomes. Nat. Struct. Mol. Biol. 13, 1108-1114.
100. Novina,C.D. and Sharp,P.A. (2004). The RNAi revolution. Nature 430, 161-164.
102. Okabayashi,Y., Maddux,B.A., McDonald,A.R., Logsdon,C.D., Williams,J.A., and Goldfine,I.D. (1989b). Mechanisms of insulin-induced insulin-receptor downregulation. Decrease of receptor biosynthesis and mRNA levels. Diabetes 38, 182-187.
103. Okabayashi,Y., Maddux,B.A., McDonald,A.R., Logsdon,C.D., Williams,J.A., and Goldfine,I.D. (1989a). Mechanisms of insulin-induced insulin-receptor downregulation. Decrease of receptor biosynthesis and mRNA levels. Diabetes 38, 182-187.
104. Okamura,K., Hagen,J.W., Duan,H., Tyler,D.M., and Lai,E.C. (2007). The mirtron pathway generates microRNA-class regulatory RNAs in Drosophila. Cell. 130, 89-100.
105. Orabona,C., Grohmann,U., Belladonna,M.L., Fallarino,F., Vacca,C., Bianchi,R., Bozza,S., Volpi,C., Salomon,B.L., Fioretti,M.C., Romani,L., and Puccetti,P. (2004). CD28 induces immunostimulatory signals in dendritic cells via CD80 and CD86. Nat. Immunol. 5, 1134-1142.
106. Otani,T., Iwasaki,M., Sasazuki,S., Inoue,M., and Tsugane,S. (2006). Plasma C-reactive protein and risk of colorectal cancer in a nested case-control study: Japan Public Health Center-based prospective study. Cancer Epidemiol. Biomarkers Prev. 15, 690-695.
83
107. Pallante,P., Visone,R., Ferracin,M., Ferraro,A., Berlingieri,M.T., Troncone,G., Chiappetta,G., Liu,C.G., Santoro,M., Negrini,M., Croce,C.M., and Fusco,A. (2006). MicroRNA deregulation in human thyroid papillary carcinomas. Endocr. Relat Cancer 13, 497-508.
108. Parkin,D.M., Bray,F., Ferlay,J., and Pisani,P. (2005a). Global cancer statistics, 2002. CA Cancer J. Clin. 55, 74-108.
109. Parkin,D.M., Bray,F., Ferlay,J., and Pisani,P. (2005b). Global cancer statistics, 2002. CA Cancer J. Clin. 55, 74-108.
110. Pasquinelli,A.E., Reinhart,B.J., Slack,F., Martindale,M.Q., Kuroda,M.I., Maller,B., Hayward,D.C., Ball,E.E., Degnan,B., Muller,P., Spring,J., Srinivasan,A., Fishman,M., Finnerty,J., Corbo,J., Levine,M., Leahy,P., Davidson,E., and Ruvkun,G. (2000). Conservation of the sequence and temporal expression of let-7 heterochronic regulatory RNA. Nature. 408, 86-89.
111. Pechlivanis,S., Pardini,B., Bermejo,J.L., Wagner,K., Naccarati,A., Vodickova,L., Novotny,J., Hemminki,K., Vodicka,P., and Forsti,A. (2007). Insulin pathway related genes and risk of colorectal cancer: INSR promoter polymorphism shows a protective effect. Endocr. Relat Cancer. 14, 733-740.
112. Petersen,C.P., Bordeleau,M.E., Pelletier,J., and Sharp,P.A. (2006). Short RNAs repress translation after initiation in mammalian cells. Mol. Cell. 21, 533-542.
113. Petri,N., Tannergren,C., Holst,B., Mellon,F.A., Bao,Y., Plumb,G.W., Bacon,J., O'Leary,K.A., Kroon,P.A., Knutson,L., Forsell,P., Eriksson,T., Lennernas,H., and Williamson,G. (2003). Absorption/metabolism of sulforaphane and quercetin, and regulation of phase II enzymes, in human jejunum in vivo. Drug Metab Dispos. 31, 805-813.
114. Pillai,R.S., Bhattacharyya,S.N., Artus,C.G., Zoller,T., Cougot,N., Basyuk,E., Bertrand,E., and Filipowicz,W. (2005). Inhibition of translational initiation by Let-7 MicroRNA in human cells. Science. 309, 1573-1576.
115. Pirola,L., Johnston,A.M., and Van,O.E. (2004). Modulation of insulin action. Diabetologia 47, 170-184.
116. Pischon,T., Lahmann,P.H., Boeing,H., Friedenreich,C., Norat,T., Tjonneland,A., Halkjaer,J., Overvad,K., Clavel-Chapelon,F., Boutron-Ruault,M.C., Guernec,G., Bergmann,M.M., Linseisen,J., Becker,N., Trichopoulou,A., Trichopoulos,D., Sieri,S., Palli,D., Tumino,R., Vineis,P., Panico,S., Peeters,P.H., Bueno-de-Mesquita,H.B., Boshuizen,H.C., Van,G.B., Palmqvist,R., Berglund,G., Gonzalez,C.A., Dorronsoro,M., Barricarte,A., Navarro,C., Martinez,C., Quiros,J.R., Roddam,A., Allen,N., Bingham,S., Khaw,K.T., Ferrari,P., Kaaks,R., Slimani,N., and Riboli,E. (2006). Body size and risk of colon and rectal cancer in the European
84
Prospective Investigation Into Cancer and Nutrition (EPIC). J. Natl. Cancer Inst. 98, 920-931.
117. Provost,P., Dishart,D., Doucet,J., Frendewey,D., Samuelsson,B., and Radmark,O. (2002). Ribonuclease activity and RNA binding of recombinant human Dicer. EMBO J. 21, 5864-5874.
118. Puig,O. and Tjian,R. (2005). Transcriptional feedback control of insulin receptor by dFOXO/FOXO1. Genes Dev. 19, 2435-2446.
121. Rodriguez,A., Griffiths-Jones,S., Ashurst,J.L., and Bradley,A. (2004). Identification of mammalian microRNA host genes and transcription units. Genome Res. 14, 1902-1910.
122. Roldo,C., Missiaglia,E., Hagan,J.P., Falconi,M., Capelli,P., Bersani,S., Calin,G.A., Volinia,S., Liu,C.G., Scarpa,A., and Croce,C.M. (2006). MicroRNA expression abnormalities in pancreatic endocrine and acinar tumors are associated with distinctive pathologic features and clinical behavior. J. Clin. Oncol. 24, 4677-4684.
123. Rome,S., Meugnier,E., and Vidal,H. (2004). The ubiquitin-proteasome pathway is a new partner for the control of insulin signaling. Curr. Opin. Clin. Nutr. Metab Care 7, 249-254.
125. Ross,R., Leger,L., Morris,D., de,G.J., and Guardo,R. (1992). Quantification of adipose tissue by MRI: relationship with anthropometric variables. J. Appl. Physiol. 72, 787-795.
126. Ruby,J.G., Jan,C.H., and Bartel,D.P. (2007). Intronic microRNA precursors that bypass Drosha processing. Nature. 448, 83-86.
127. Rusinov,V., Baev,V., Minkov,I.N., and Tabler,M. (2005). MicroInspector: a web tool for detection of miRNA binding sites in an RNA sequence. Nucleic Acids Res. 33, W696-W700.
128. Saito,Y., Liang,G., Egger,G., Friedman,J.M., Chuang,J.C., Coetzee,G.A., and Jones,P.A. (2006). Specific activation of microRNA-127 with downregulation of the proto-oncogene BCL6 by chromatin-modifying drugs in human cancer cells. Cancer Cell. 9, 435-443.
129. Samanic,C., Chow,W.H., Gridley,G., Jarvholm,B., and Fraumeni,J.F., Jr. (2006). Relation of body mass index to cancer risk in 362,552 Swedish men. Cancer Causes Control. 17, 901-909.
85
130. Scott,G.K., Goga,A., Bhaumik,D., Berger,C.E., Sullivan,C.S., and Benz,C.C. (2007). Coordinate suppression of ERBB2 and ERBB3 by enforced expression of micro-RNA miR-125a or miR-125b. J. Biol. Chem. 282, 1479-1486.
131. Seggerson,K., Tang,L., and Moss,E.G. (2002). Two genetic circuits repress the Caenorhabditis elegans heterochronic gene lin-28 after translation initiation. Dev. Biol. 243, 215-225.
132. Sethupathy,P., Borel,C., Gagnebin,M., Grant,G.R., Deutsch,S., Elton,T.S., Hatzigeorgiou,A.G., and Antonarakis,S.E. (2007). Human microRNA-155 on chromosome 21 differentially interacts with its polymorphic target in the AGTR1 3' untranslated region: a mechanism for functional single-nucleotide polymorphisms related to phenotypes. Am. J. Hum. Genet. 81, 405-413.
133. Siezen,C.L., Bueno-de-Mesquita,H.B., Peeters,P.H., Kram,N.R., van,D.M., and van Kranen,H.J. (2006). Polymorphisms in the genes involved in the arachidonic acid-pathway, fish consumption and the risk of colorectal cancer. Int. J. Cancer. 119, 297-303.
134. Smalheiser,N.R. (2003). EST analyses predict the existence of a population of chimeric microRNA precursor-mRNA transcripts expressed in normal human and mouse tissues. Genome Biol. 4, 403.
135. Smalheiser,N.R. and Torvik,V.I. (2005). Mammalian microRNAs derived from genomic repeats. Trends Genet. 21, 322-326.
136. Sullivan,C.S. and Ganem,D. (2005). MicroRNAs and viral infection. Mol. Cell. 20, 3-7.
137. Suvas,S., Singh,V., Sahdev,S., Vohra,H., and Agrewala,J.N. (2002). Distinct role of CD80 and CD86 in the regulation of the activation of B cell and B cell lymphoma. J. Biol. Chem. 277, 7766-7775.
138. Tam,W., Ben-Yehuda,D., and Hayward,W.S. (1997). bic, a novel gene activated by proviral insertions in avian leukosis virus-induced lymphomas, is likely to function through its noncoding RNA. Mol. Cell Biol. 17, 1490-1502.
139. Taniguchi,C.M., Emanuelli,B., and Kahn,C.R. (2006). Critical nodes in signalling pathways: insights into insulin action. Nat. Rev. Mol. Cell Biol. 7, 85-96.
140. Tanzer,A. and Stadler,P.F. (2004). Molecular evolution of a microRNA cluster. J. Mol. Biol. 339, 327-335.
141. Tivol,E.A., Borriello,F., Schweitzer,A.N., Lynch,W.P., Bluestone,J.A., and Sharpe,A.H. (1995). Loss of CTLA-4 leads to massive lymphoproliferation and fatal multiorgan tissue destruction, revealing a critical negative regulatory role of CTLA-4. Immunity. 3, 541-547.
86
142. Tomari,Y. and Zamore,P.D. (2005). Perspective: machines for RNAi. Genes Dev. 19, 517-529.
143. Tuynman,J.B., Peppelenbosch,M.P., and Richel,D.J. (2004). COX-2 inhibition as a tool to treat and prevent colorectal cancer. Crit Rev. Oncol. Hematol. 52, 81-101.
144. van,P.G., Verhoeven,D.T., Verhagen,H., and Goldbohm,R.A. (1999). Brassica vegetables and cancer prevention. Epidemiology and mechanisms. Adv. Exp. Med. Biol. 472:159-68., 159-168.
145. Vella,M.C., Choi,E.Y., Lin,S.Y., Reinert,K., and Slack,F.J. (2004). The C. elegans microRNA let-7 binds to imperfect let-7 complementary sites from the lin-41 3'UTR. Genes Dev. 18, 132-137.
146. Vogelstein,B., Fearon,E.R., Hamilton,S.R., Kern,S.E., Preisinger,A.C., Leppert,M., Nakamura,Y., White,R., Smits,A.M., and Bos,J.L. (1988). Genetic alterations during colorectal-tumor development. N. Engl. J. Med. 319, 525-532.
147. Vuckovic,S., Florin,T.H., Khalil,D., Zhang,M.F., Patel,K., Hamilton,I., and Hart,D.N. (2001). CD40 and CD86 upregulation with divergent CMRF44 expression on blood dendritic cells in inflammatory bowel diseases. Am. J. Gastroenterol. 96, 2946-2956.
148. Wei,E.K., Ma,J., Pollak,M.N., Rifai,N., Fuchs,C.S., Hankinson,S.E., and Giovannucci,E. (2005). A prospective study of C-peptide, insulin-like growth factor-I, insulin-like growth factor binding protein-1, and the risk of colorectal cancer in women. Cancer Epidemiol. Biomarkers Prev. 14, 850-855.
149. Wickramasinghe,S.N. and Fida,S. (1994). Bone marrow cells from vitamin B12- and folate-deficient patients misincorporate uracil into DNA. Blood. 83, 1656-1661.
150. Wood,L.D., Parsons,D.W., Jones,S., Lin,J., Sjoblom,T., Leary,R.J., Shen,D., Boca,S.M., Barber,T., Ptak,J., Silliman,N., Szabo,S., Dezso,Z., Ustyanksky,V., Nikolskaya,T., Nikolsky,Y., Karchin,R., Wilson,P.A., Kaminker,J.S., Zhang,Z., Croshaw,R., Willis,J., Dawson,D., Shipitsin,M., Willson,J.K., Sukumar,S., Polyak,K., Park,B.H., Pethiyagoda,C.L., Pant,P.V., Ballinger,D.G., Sparks,A.B., Hartigan,J., Smith,D.R., Suh,E., Papadopoulos,N., Buckhaults,P., Markowitz,S.D., Parmigiani,G., Kinzler,K.W., Velculescu,V.E., and Vogelstein,B. (2007). The genomic landscapes of human breast and colorectal cancers. Science. 318, 1108-1113.
151. Wu,L. and Belasco,J.G. (2005). Micro-RNA regulation of the mammalian lin-28 gene during neuronal differentiation of embryonal carcinoma cells. Mol. Cell Biol. 25, 9198-9208.
152. Yekta,S., Shih,I.H., and Bartel,D.P. (2004). MicroRNA-directed cleavage of HOXB8 mRNA. Science. 304, 594-596.
87
153. Yi,R., Qin,Y., Macara,I.G., and Cullen,B.R. (2003). Exportin-5 mediates the nuclear export of pre-microRNAs and short hairpin RNAs. Genes Dev. 17, 3011-3016.
154. Yoshizato,K., Shirotani,T., Furukawa,N., Taguchi,T., Motoshima,H., Toyonaga,T., Hirashima,Y., Kawashima,J., Ebina,Y., Shichiri,M., and Araki,E. (2001). Identification of a cis-acting element and a novel trans-acting factor of the human insulin receptor gene in HepG2 and rat liver cells. Biochem. Biophys. Res. Commun. %19;280, 428-434.
155. Youngren,J.F. (2007). Regulation of insulin receptor function. Cell Mol. Life Sci. 64, 873-891.
156. Zamore,P.D., Tuschl,T., Sharp,P.A., and Bartel,D.P. (2000). RNAi: double-stranded RNA directs the ATP-dependent cleavage of mRNA at 21 to 23 nucleotide intervals. Cell 101, 25-33.
157. Zeng,Y. (2006). Principles of micro-RNA production and maturation. Oncogene 25, 6156-6162.
158. Zeng,Y. and Cullen,B.R. (2004). Structural requirements for pre-microRNA binding and nuclear export by Exportin 5. Nucleic Acids Res. 32, 4776-4785.
159. Zeng,Y. and Cullen,B.R. (2005). Efficient processing of primary microRNA hairpins by Drosha requires flanking nonstructured RNA sequences. J. Biol. Chem. 280, 27595-27603.
160. Zeng,Y., Wagner,E.J., and Cullen,B.R. (2002). Both natural and designed micro RNAs can inhibit the expression of cognate mRNAs when expressed in human cells. Mol. Cell 9, 1327-1333.
161. Zhang,H., Kolb,F.A., Brondani,V., Billy,E., and Filipowicz,W. (2002). Human Dicer preferentially cleaves dsRNAs at their termini without a requirement for ATP. EMBO J. 21, 5875-5885.
162. Zhang,H., Kolb,F.A., Jaskiewicz,L., Westhof,E., and Filipowicz,W. (2004). Single processing center models for human Dicer and bacterial RNase III. Cell. 118, 57-68.