New constraints on dike injection and fault slip during the 1975–1984Krafla rift crisis, NE IcelandJ. Hollingsworth,1,2 Sébastien Leprince,1 François Ayoub,1 and Jean-Philippe Avouac1
Received 31 October 2012; revised 9 April 2013; accepted 19 May 2013.
[1] Correlation of KH9 spy and SPOT5 satellite images, airphotos, digital elevationmodel differencing, electronic distance measurement, and leveling survey data is used toconstrain the deformation resulting from the 1975–1984 Krafla rifting crisis. We find thatdiking typically extends to depths of 5 km, while the dike tops range from 0 km in thecaldera region to 3 km at the northern end of the rift. Extension is accommodated bydiking at depth and normal faulting in the shallowest crust. In the southern section of theKrafla rift, surface opening is 80% of the dike opening at depth. Over the 70–80 kmlength of the rift, the average dike opening was 4.3–5.4 m. From these estimates, wecalculate the total geodetic moment released over the Krafla rift crisis,4.4–9.0 � 1019 Nm, which is an order of magnitude higher than the seismic momentreleased over the same time period, � 5.8 � 1018 Nm. The total volume of magma addedto the upper crust was 1.1–2.1 � 109 m3. This study highlights how optical imagecorrelation using inexpensive declassified spy satellite and airphotos, combined withsimple models of crustal deformation, can provide important constraints on thedeformation resulting from past earthquake and volcanic events.Citation: Hollingsworth, J., S. Leprince, F. Ayoub, and J.-P. Avouac (2013), New constraints on dike injection and fault slipduring the 1975–1984 Krafla rift crisis, NE Iceland, J. Geophys. Res. Solid Earth, 118, doi:10.1002/jgrb.50223.
1. Introduction[2] Over the last 20 years, detailed geodetic observation
of plate boundary zones and continental interiors has pro-vided fundamental insight into the nature of continentaldeformation. In contrast, these techniques have provided rel-atively little information on how plates rift apart and createnew crust, since these processes typically occur at oceanicspreading centers where geodetic observation is more chal-lenging. Both normal faulting and magma injection via dikesand sills are key processes occurring within oceanic riftzones, with the interplay between these two processes play-ing a key role in controlling the topographic evolution ofrift zones around the world [e.g., De Chabalier and Avouac,1994; Buck et al., 2005, 2006; Behn and Ito, 2008; Itoand Behn, 2008]. However, rift zone topography is typi-cally formed over many earthquake and volcanic cycles andthus provides only limited insight into the processes whichoperate over the course of a single seismic or magmatic cycleand which ultimately accommodate plate spreading.
1Division of GPS, California Institute of Technology, Pasadena,California, USA.
2Géoazur, University of Nice Sophia-Antipolis, CNRS, Observatoire dela Côte d’Azur, Valbonne, France.
Corresponding author: J. Hollingsworth, Division of GPS, CaliforniaInstitute of Technology, MC 100-23, Pasadena, CA 91125, USA.([email protected])
[3] Where plate spreading occurs on land, it providesa unique opportunity to investigate both the seismic andmagmatic cycles operating within rift zones using satellitegeodesy [Wright et al., 2012]. Unfortunately, there are fewplaces on Earth where this occurs because plate spreadingtypically reduces the level of topography below that of theoceans. Furthermore, little seismic moment is released dur-ing episodic rifting events involving dike injection, therebymaking them hard to detect. These factors, coupled with thenarrow time window covered by satellite geodesy, mean thatthere are still only a few examples where dike injection andfault activation have been captured in detail.
[4] The best studied examples come from the East Africanrift, where major episodes of dike injection occurred in theAsal rift in 1978 [Abdallah et al., 1979] and the MandaHararo rift (Afar) in 2005–2010 [Wright et al., 2006, 2012].Interferometric synthetic aperture radar measurements span-ning the entire Afar crisis provided dense measurementson the surface deformation, thereby allowing the pattern offault slip and dike opening in the upper crust to be deter-mined through inverse elastic dislocation modeling [Wrightet al., 2006; Barisin et al., 2009; Hamling et al., 2009, 2010;Grandin et al., 2010]. An important result from these stud-ies has been the identification of a zone of reduced openingin the shallowest crust (<2 km), similar to the “shallow slipdeficit” seen in various large continental strike slip earth-quakes [Simons et al., 2002; Fialko et al., 2005; Sudhausand Jónsson, 2011; Elliott et al., 2012].
[5] Although the East African rift provides a setting inwhich dike injections can be studied using satellite geodesy,
HOLLINGSWORTH ET AL.: THE 1975–1984 KRAFLA RIFT CRISIS
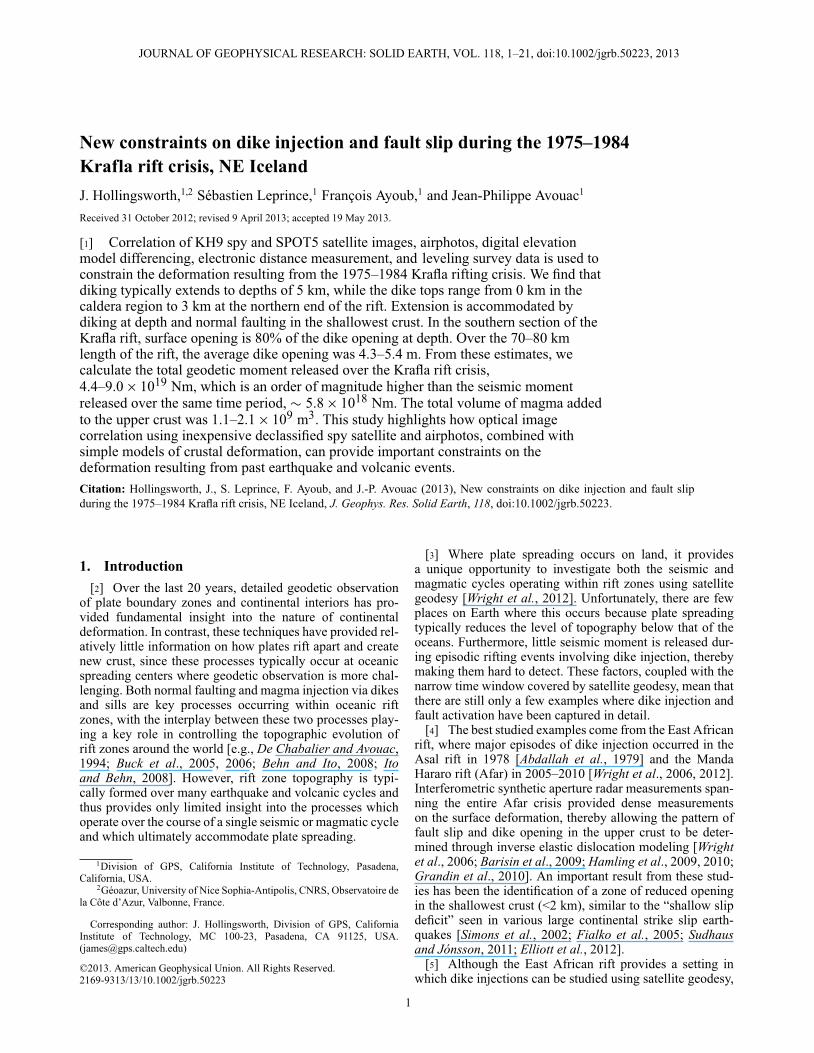
Figure 1. (a) Topographic map of the northern central region of Iceland. Yellow circles show the locationof microearthquakes (Mw � 2.8) between 1990 and 2010 from the South Iceland Lowland earthquake cat-alog of the Iceland Meteorological Office. Red arrows show GPS velocities from Árnadóttir et al. [2009]relative to stable North America. Black earthquake focal mechanisms are earthquake centroid determi-nations from the Global centroid moment tensor (CMT) catalog. Heavy dashed black lines show theboundaries of the Northern Volcanic Zone (NVZ), across which all the plate spreading between Eurasiaand North America is accommodated at this latitude. Transparent white areas highlight the various fissureswarms which lie within the NVZ, which accommodate this plate spreading through a combination offault slip and magmatic injection. The red area highlights the Krafla fissure swarm. The heavy black circleshows the location of the Krafla caldera. (b) Profile showing the total amount of opening along the fissureswarm, based on survey data from Tryggvason [1984] and image correlation data from Hollingsworthet al. [2012], overlying a swath topographic profile along the length of the Krafla fissure swarm (cor-responding to the white box in Figure 1c). Horizontal black lines show the lateral extent and timing ofdikes injected into the crust throughout the crisis; red lines show fissure eruptions. Vertical blue lineshows the location of the Krafla caldera. (c) Topographic map of the Krafla region. White lines indicatefaults active during the Holocene. Heavy white line and stippled white region show the Jökulsá á Fjöllumriver and delta. White dashed region is Myvatn lake. Blue circle shows the limits of the Krafla caldera.Orange star shows the location of the best-fitting mogi source (i.e., magma chamber) beneath the Kraflacaldera, calculated from inversion of geodetic data spanning the 1984 eruption [Árnadóttir et al., 1998].White star shows the location of a much deeper magma source at 21 km, which is currently inflating[de Zeeuw-van Dalfsen et al., 2004]. This also corresponds to a broad zone of uplift comprising theStoraviti and Grjothals topographic highs (yellow dotted line). The Global CMT solution is shown for the13 January 1976 earthquake.
it is not a true oceanic rift zone and therefore may differ fromplate spreading in an oceanic setting.
[6] The 1975–1984 Krafla rift crisis in NE Iceland pro-vides a unique example where episodic dike injection wascaptured geodetically, albeit by traditional surveying tech-niques rather than satellite geodesy, in an oceanic rift setting,albeit one also under the influence of a hot spot activity
(Figure 1) [Björnsson et al., 1977; Sigmundsson, 2006]. Bycomparing the results from elastic dislocation models withleveling data from the northern end of the rift, Rubin andPollard [1988] and Rubin [1992] found the surface exten-sion to be 160% of the thickness of the dike at depth. Incontrast, using a similar approach, the authors found surfaceextension to be only 40% of that at depth (more consistent
HOLLINGSWORTH ET AL.: THE 1975–1984 KRAFLA RIFT CRISIS
with deformation in the Afar crisis) for the southern end ofthe rift. Although these studies highlight the heterogeneousnature of deformation along strike of the Krafla rift zone,they only focus on two dike injections out of 15–20. There-fore, very little is known about the total 3-D distribution offault slip/dike opening throughout the entire Krafla riftingcrisis. The goal of this paper is to better address this problemusing recent measurements from correlation of declassi-fied optical satellite and aerial photos [Hollingsworth et al.,2012], in combination with DEMs computed from aerialphotos, and preexisting geodetic data. Although various datalimitations prevent an inversion scheme for the slip/openingdistribution as used in Afar [e.g., Grandin et al., 2009],we are nevertheless able to constrain the first-order patternof crustal deformation preserved in these data sets using asimpler modeling approach similar to that used by Rubinand Pollard [1988] and Rubin [1992]. Nevertheless, weacknowledge that simple dislocation modeling using an elas-tic half-space [Okada, 1985, 1992] may not simulate well theeffects of brittle deformation in the subsurface of the Kraflarift zone, where rocks are extensively fractured and sub-ject to low confining stress, leading to a significant amountof anelastic deformation. Furthermore, the high geothermalgradient will lead to a more complicated elastic structurewith depth.
2. Overview of the 1975–1984 KraflaRifting Crisis
[7] On 20 December 1975, intense microseismicity,tilting, and eruption of volcanic material occurred in theKrafla caldera region of the Northern Volcanic Zone of NEIceland, marking the onset of a 9 year period of seismic andvolcanic activity in which the crust extended by up to � 9 m[Björnsson et al., 1977; Tryggvason, 1994; Hollingsworthet al., 2012]. During this time, various dikes were injectedinto the crust, propagating 70–80 km along a NNE-strikingzone of intense surface faulting and fissuring, known as theKrafla Fissure Swarm. Seismic activity remained high untilJanuary–February 1976, with much of the activity confinedto the caldera itself. However, the largest earthquake of theentire crisis occurred �70 km north of the caldera on 13January 1976 (Mw6.3). This earthquake occurred offshore inthe Axarfjördur region (Figure 1c). The right-lateral focalmechanism suggested slip on a NW-SE transform fault, inresponse to NW-SE extension further south in response tothe dike injection. However, Hollingsworth et al. [2012]have suggested that the dilatational component in the focalmechanism may result from a separate dike injection at thenorthern end of the rift.
[8] Various dikes were injected over the following years,mostly in the caldera region near the southern end of thefissure swarm. Only one further dike (January 1978) wasthought to extend northward as far as the Jökulsá á Fjöllumriver delta (Figures 1b and 1c). Lavas were erupted close tothe caldera region, and mostly during the latter stages of thecrisis, presumably once dikes had relieved all the extensionalstress at depth. The crisis ended with the most extensiveeruption between 4 and 18 September 1984, which coveredthe caldera and extended 10 km to the north (Figure 1c).Between 1975 and 1984, around nine separate eruptionsoccurred and 20 dikes were injected into the crust, which
resulted in 9–10 m of opening near the caldera, decreasingto 3–4 m near the coastline to the north [Wendt et al.,1985; Tryggvason, 1984; Árnadóttir et al., 1998; Buck et al.,2006; Hollingsworth et al., 2012]. The non-uniform patternof surface opening, which resembles triangular slip distri-butions for various large earthquakes [Manighetti et al.,2005] therefore raises questions about how plate spreading isaccommodated throughout the Northern Volcanic Zone overgeological time.
3. Methodology and Data3.1. Data (Pre-crisis and Post-crisis)
[9] In this paper, we use measurements of surfacedeformation obtained by the optical image correlationtechnique as input for both inverse and forward elasticdislocation models to better constrain the style and mag-nitude of deformation throughout the Krafla rift zone.This technique compares two images of the Earth’s sur-face that were acquired at different times and estimatesany pixel shifts between them with subpixel precision.This technique takes advantage of the recently developedCOSI-Corr software package (COSI-Corr, available forfree download from www.tectonics.caltech.edu/slip_history/spot_coseis/index.html), which allows optical images to beortho-rectified, co-registered, and then correlated using aniterative, unbiased processor that estimates the phase planein the Fourier domain [Leprince et al., 2007b, 2007a, 2008;Ayoub et al., 2009a]. This process produces two correlationimages, each representing one of the horizontal ground dis-placement components in the East-West and North-Southdirection. In practice, this technique is able to resolve dis-placements as low as one tenth of the input pixel size. Imagescan be successfully correlated with each other, despite thewide variety of imaging systems used to acquire data. Themethodology for correlating historical satellite and airphotodata differs from modern satellite data, since the imageswere acquired with a film-based frame camera system, ratherthan a pushbroom sensor (for a detailed description for cor-relating airphotos, see Ayoub et al. [2009a]). Knowledge ofthe camera system (such as the focal length, fiducial lengths,optical distortion) used to acquire airphotos or film-basedsatellite images is required to determine the interior orien-tation parameters of the camera, which is in turn needed tosuccessfully ortho-rectify and co-register the images usingCOSI-Corr. In the case of airphotos, this information is typ-ically available in the form of a calibration report whichaccompanies the images.
[10] In this study, we build on the study of Hollingsworthet al. [2012], who correlate KH9 spy satellite, SPOT5 satel-lite, and airphotos to measure surface deformation through-out the Krafla rifting crisis. For more details on the dataused and how it was processed, the reader is referredto their paper. Because optical image correlation primar-ily constrains the horizontal displacement field, we createhigh-resolution digital elevation models (DEMs) from stereoairphotos of the Krafla rift zone acquired before and after thecrisis. The relative difference between these DEMs revealsthe vertical deformation within the rift, thereby allowing usto resolve the full 3-D deformation field for certain loca-tions in the rift zone. Stereo DEMs are extracted using LeicaPhotogrammetry Suite, which is available as an add-on
HOLLINGSWORTH ET AL.: THE 1975–1984 KRAFLA RIFT CRISIS
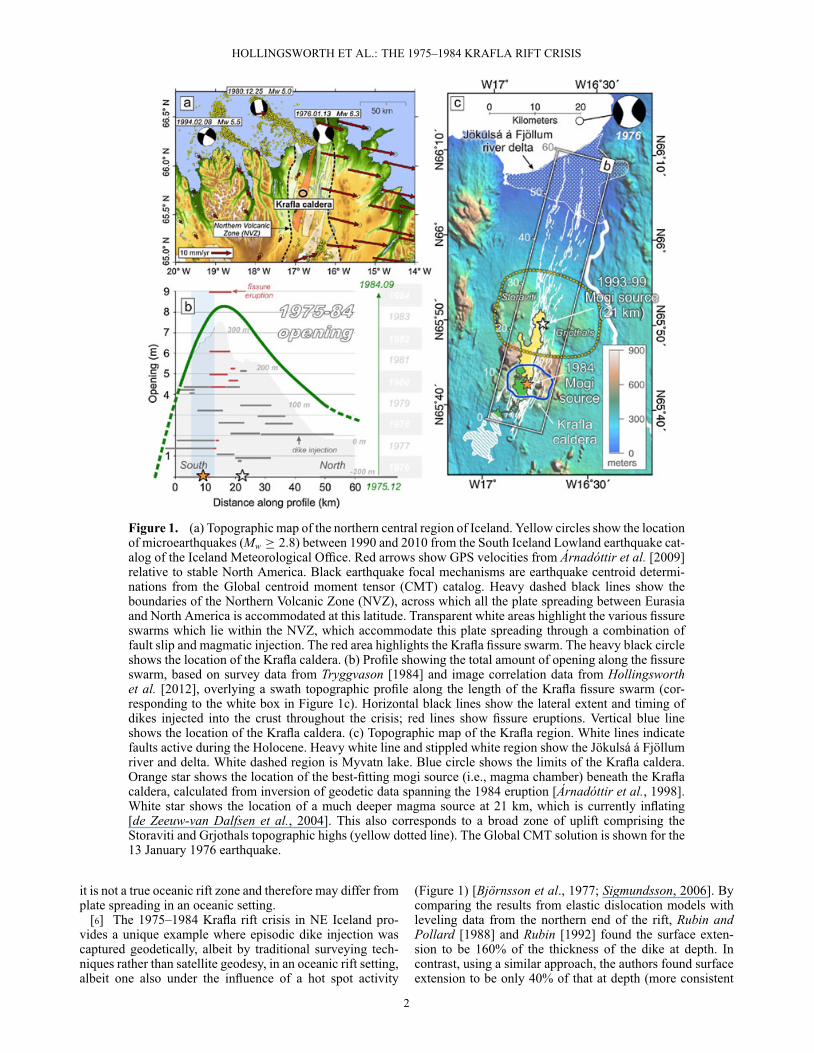
Figure 2. Topographic map of the Krafla region of NE Iceland. White lines show various faults andfissures which make up the Krafla fissure swarm and which have been active throughout the Late Quater-nary. Blue circle shows the boundary of the Krafla caldera [from Björnsson et al., 1977], which is thoughtto have formed during the last interglacial (Eemian) period (114–130 kyr) [Brandsdotttir et al., 1997].Yellow and green areas show the extent of lava flows during the 1975–1984 and 1725–1929 eruptions,respectively [Björnsson et al., 1977]. Large red box shows the footprint of the SPOT5 satellite image cor-related with a KH9 hexagon spy satellite image from 1977 (the footprint of which covers an even largerarea than shown in this figure). Black boxes show the location of airphoto correlations used throughoutthis study. (b) Plot showing the spatial and temporal coverage of the different data sets used to constrainopening during the 1975–1984 Krafla rifting crisis. The gray zone shows the duration of the crisis.
module for the ERDAS GIS software package. This tech-nique takes advantage of the stereo effect between differentairphotos covering the same area but acquired with differ-ent view angles. The differences in parallax between twoimages, coupled with information on the camera systemused, and ground referencing information allow the shape ofthe landscape to be recovered using classic photogrammetrymethods [e.g., Wolf et al., 2000].
3.2. Inversion Methodology[11] Using simple elastic dislocation modeling [Okada,
1985], we estimate the geometry and magnitude of open-ing/slip for dikes/faults which best fit the Krafla surfacedisplacement field. Due to the different spatial and tempo-ral coverage of the various optical and survey data sets usedin the analysis, we focus our discussion on the southern,central, and northern ends of the rift zone separately(Figure 2). In section 4.1, we invert for the best-fittingdike and fault geometries using displacements measuredfrom correlation of KH9 (1977) and SPOT5 (2002) images,and electronic distance measurement (EDM) data, collectedbetween 1978 and 1989, from the southern end of the rift(Figure 4). In section 4.2, we use the horizontal displacementfield from correlation of airphotos spanning the entire crisis
(1957–1990), as well as vertical displacements obtainedfrom differencing pre-crisis and post-crisis stereo airphotoDEMs (Figure 6), to constrain elastic models of diking andfaulting in the central section of the rift (Figure 7). A similarapproach is used in section 4.3 where airphoto (1976–1990)and KH9-SPOT5 (1977–2002) correlation data (Figure 8),DEM differencing data (1976–1990; Figure 9), and level-ing survey data (1976–1978; Figure 10) are used to betterconstrain the 1978 dike injection in the northern end of therift. Finally, in section 4.4, we investigate an apparent pre-crisis contraction across the rift by comparing the surfacedisplacement field produced by deep deflation of two magmachambers (approximated by mogi sources) to triangulationdata collected from the caldera region (southern end of therift) between 1965 and 1971 (Figure 11).
[12] We use the Metropolis-Hastings algorithm (a Markovchain Monte Carlo method) [e.g., Tarantola, 2004;Ofeigsson et al., 2011; Anderson and Segall, 2013] to invertfor the dike parameters which best reproduce the relativesurface displacements close to the Krafla rift zone. Thisapproach assumes that a dike can be described by uniformopening of a rectangular tensile crack in an elastic half-space[Okada, 1985, 1992], which may only be true to first order,since we are ignoring any variations in elastic structure, and
HOLLINGSWORTH ET AL.: THE 1975–1984 KRAFLA RIFT CRISIS
extensive fracturing of rock throughout the crust. The inver-sion begins with a dike model randomly generated from arange of likely dike parameter values; for each parameter,we assume a uniform probability distribution within boundschosen a priori: (for KH9-SPOT data) depth to the top ofthe dike, 0.0–0.6 km; dike width, 2.0–7.0 km; opening,3.5–8.5 m; dike length, 18.0–24 km; UTM Easting, 418000–420000—dike dip is fixed at 90°, and UTM Northing is fixedat 7297000. (for EDM data) depth to the top of the dike, 0.0–0.6 km; dike width, 2.0–7.0 km; opening, 3.5–8.5 m; dikelength, 11.0–19 km; UTM Easting, 418400–420400—dikedip is fixed at 90°, and UTM Northing is fixed at 7297000.The starting range of values was estimated prior to inversionand was chosen to encompass a broad range of values whichwe thought would encompass the best-fitting values. We ranseveral test inversions, to check that our range of startingvalues yielded acceptance ratios of �50%, so the inver-sion would run efficiently. The only significant differencebetween the initial range of dike parameters in each inver-sion is dike length (18–24 km for KH9-SPOT and 11–19 kmfor EDM); these values were adjusted so the best-fittingvalue for dike length would fall approximately in the mid-dle of the range of initial values. Due to the small number ofEDM data points, and their limited distribution at either endof the rift, the EDM data are likely to be less accurate thanthe KH9-SPOT5 correlation data in constraining the dikelength, which may therefore account for the difference in thebest-fitting dike length values (16 km for EDM, comparedwith 21 km for KH9-SPOT5 data).
[13] During the inversion, the difference between themodel and measured surface displacements is used to calcu-late the likelihood function, which is then maximized overseveral million iterations by use of a L2-norm cost func-tion. This yields the most likely dike parameters describingthe injection, given the range of models allowed during theinversion (equation (1)) [see also Tarantola, 2004].
L = C�exp�
–0.5/�2 �X
[M – D]2 – log�� � p
2��
� N�
(1)
where L is the likelihood function, � is the standard devia-tion in the displacement measurements (i.e., the error, 0.75 mfor KH9-SPOT5 measurements and 0.1 m for EDM), M isthe model displacement length change, D is the observeddisplacement length change (3-D length change for EDMdata, E-W length change for the KH9-SPOT5 data), N isthe number of observations made, and C is a constant usedto adjust the dynamic range of the likelihood (which isforced to lie within the range 1015 and 10–15, to avoidunderflow/overflow inaccuracies when calculating the like-lihood in MATLAB).
[14] Once the likelihood is computed for a given start-ing model, each parameter describing the dike model israndomly adjusted to create a new model and resulting like-lihood value. If the “new” likelihood is greater than or equalto the “old” likelihood value, the new model parameters areaccepted. Otherwise, the new model parameters are acceptedbased on the ratio of “old” likelihood to “new” likelihoodvalues [for further details, see Tarantola, 2004]; therefore,if the model fit is only slightly worse, it is more likely tobe accepted than if it is significantly worse. If a new modelis rejected, the last accepted model is re-used. In this way,the model space is explored through a random walk that
samples the probability density of the dike parameter space.The ability to accept a worse-fitting model means the inver-sion does not get stuck on local maxima in the probabilitydensity function, thereby sampling the full probability dis-tribution. For the inversion to work efficiently, the extentto which the new model parameters can vary from the lastaccepted model can be adjusted so that the acceptance torejection ratio is � 50%.
4. Results4.1. Southern Krafla Rift: Constraints on DikeOpening From KH9 and SPOT Satellite Data(1977–2002) and EDM Data (1978–1989)
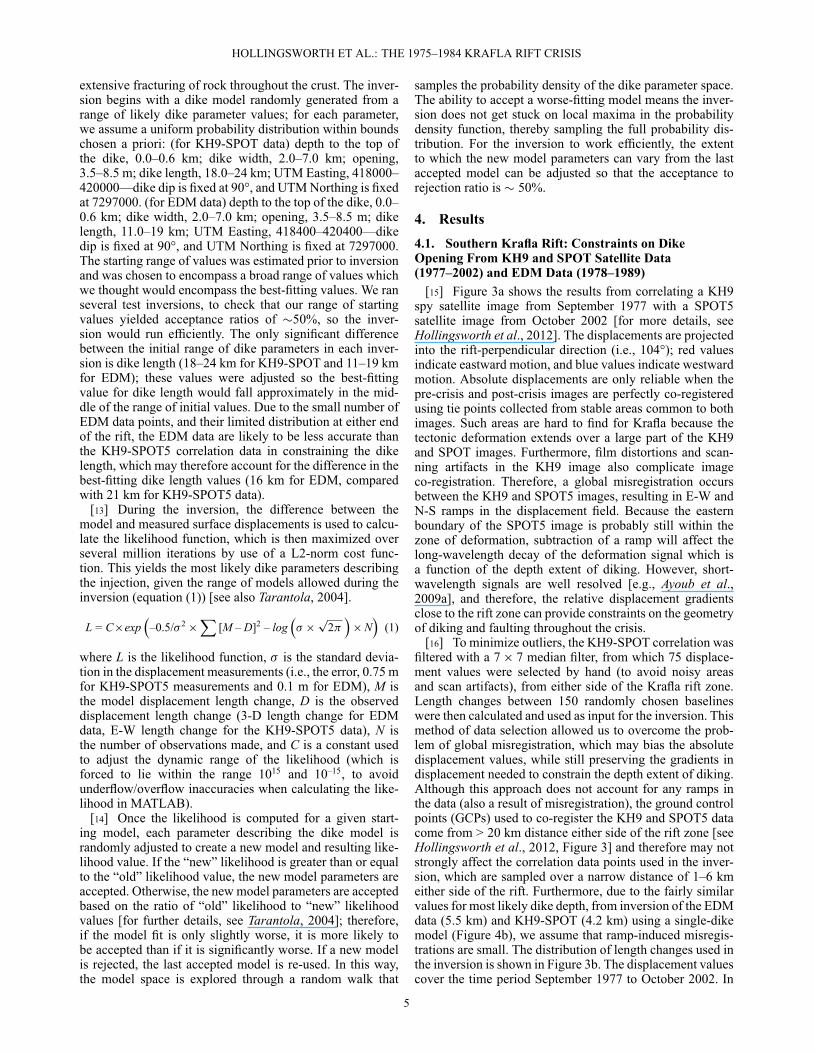
[15] Figure 3a shows the results from correlating a KH9spy satellite image from September 1977 with a SPOT5satellite image from October 2002 [for more details, seeHollingsworth et al., 2012]. The displacements are projectedinto the rift-perpendicular direction (i.e., 104°); red valuesindicate eastward motion, and blue values indicate westwardmotion. Absolute displacements are only reliable when thepre-crisis and post-crisis images are perfectly co-registeredusing tie points collected from stable areas common to bothimages. Such areas are hard to find for Krafla because thetectonic deformation extends over a large part of the KH9and SPOT images. Furthermore, film distortions and scan-ning artifacts in the KH9 image also complicate imageco-registration. Therefore, a global misregistration occursbetween the KH9 and SPOT5 images, resulting in E-W andN-S ramps in the displacement field. Because the easternboundary of the SPOT5 image is probably still within thezone of deformation, subtraction of a ramp will affect thelong-wavelength decay of the deformation signal which isa function of the depth extent of diking. However, short-wavelength signals are well resolved [e.g., Ayoub et al.,2009a], and therefore, the relative displacement gradientsclose to the rift zone can provide constraints on the geometryof diking and faulting throughout the crisis.
[16] To minimize outliers, the KH9-SPOT correlation wasfiltered with a 7 � 7 median filter, from which 75 displace-ment values were selected by hand (to avoid noisy areasand scan artifacts), from either side of the Krafla rift zone.Length changes between 150 randomly chosen baselineswere then calculated and used as input for the inversion. Thismethod of data selection allowed us to overcome the prob-lem of global misregistration, which may bias the absolutedisplacement values, while still preserving the gradients indisplacement needed to constrain the depth extent of diking.Although this approach does not account for any ramps inthe data (also a result of misregistration), the ground controlpoints (GCPs) used to co-register the KH9 and SPOT5 datacome from > 20 km distance either side of the rift zone [seeHollingsworth et al., 2012, Figure 3] and therefore may notstrongly affect the correlation data points used in the inver-sion, which are sampled over a narrow distance of 1–6 kmeither side of the rift. Furthermore, due to the fairly similarvalues for most likely dike depth, from inversion of the EDMdata (5.5 km) and KH9-SPOT (4.2 km) using a single-dikemodel (Figure 4b), we assume that ramp-induced misregis-trations are small. The distribution of length changes used inthe inversion is shown in Figure 3b. The displacement valuescover the time period September 1977 to October 2002. In
HOLLINGSWORTH ET AL.: THE 1975–1984 KRAFLA RIFT CRISIS
Figure 3. (a) Displacement map for the Krafla rift zone between 1977 and 2002. Displace-ments are perpendicular to the rift zone, which strikes 014°. Colored lines show 15 km wideswath profiles crossing the southern, central, and northern parts of the rift. (b) Displacementmap corresponding to the black box in Figure 3a, showing the location of length changes (blacklines) used in the inversion (we invert just the E-W component). (c) Location of length changes(red lines) measured by an EDM network (see text for details) across the southern Krafla rift.(d–f) Displacement profiles crossing the southern, central, and northern sections of the Krafla rift (seeFigure 3a for profile locations). Thick gray line in Figure 3d shows the E-W displacement profile pro-duced by the most likely dike-opening and fault slip parameters obtained by inversion; for comparison,see Figure 4. Black ellipses highlight a step in the displacement field resulting from a scanning artifact[Hollingsworth et al., 2012].
addition to the image correlation data, we also invert sur-vey measurements made from an Electronic Distance Meternetwork deployed between 1978 and 1989 [Tryggvason,1994, Table 1]. The high precision of EDM data (< 0.1 mstandard deviation compared with 0.5–1.0 m from imagecorrelation), coupled with the similar deformation signal asrecorded in the KH9-SPOT5 correlation, and coverage span-ning both rift flanks (Figure 3c), allows two independentdeterminations of the best-fitting dike parameters. So thatwe can directly compare the output from both inversions, weonly use image correlation displacements collected from thesame region as the EDM data. To avoid complexities fromshallow faulting, we only invert data from outside the riftzone, which is most sensitive to the deeper processes relatedto diking.
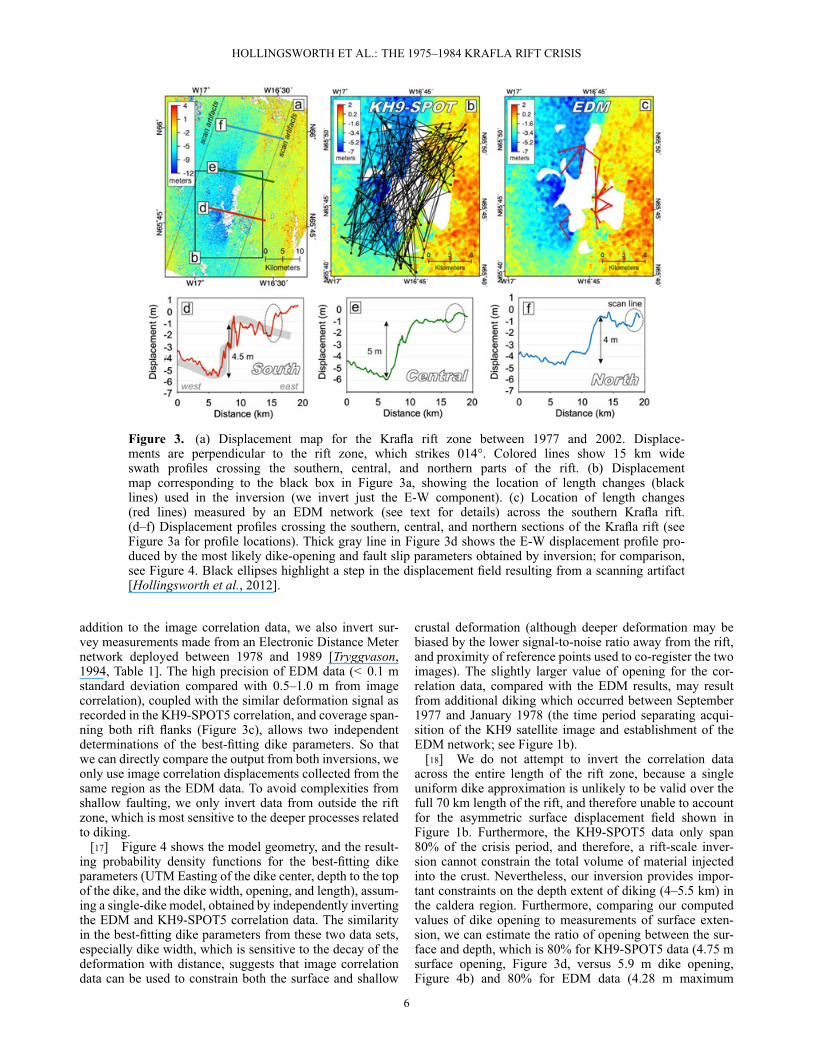
[17] Figure 4 shows the model geometry, and the result-ing probability density functions for the best-fitting dikeparameters (UTM Easting of the dike center, depth to the topof the dike, and the dike width, opening, and length), assum-ing a single-dike model, obtained by independently invertingthe EDM and KH9-SPOT5 correlation data. The similarityin the best-fitting dike parameters from these two data sets,especially dike width, which is sensitive to the decay of thedeformation with distance, suggests that image correlationdata can be used to constrain both the surface and shallow
crustal deformation (although deeper deformation may bebiased by the lower signal-to-noise ratio away from the rift,and proximity of reference points used to co-register the twoimages). The slightly larger value of opening for the cor-relation data, compared with the EDM results, may resultfrom additional diking which occurred between September1977 and January 1978 (the time period separating acqui-sition of the KH9 satellite image and establishment of theEDM network; see Figure 1b).
[18] We do not attempt to invert the correlation dataacross the entire length of the rift zone, because a singleuniform dike approximation is unlikely to be valid over thefull 70 km length of the rift, and therefore unable to accountfor the asymmetric surface displacement field shown inFigure 1b. Furthermore, the KH9-SPOT5 data only span80% of the crisis period, and therefore, a rift-scale inver-sion cannot constrain the total volume of material injectedinto the crust. Nevertheless, our inversion provides impor-tant constraints on the depth extent of diking (4–5.5 km) inthe caldera region. Furthermore, comparing our computedvalues of dike opening to measurements of surface exten-sion, we can estimate the ratio of opening between the sur-face and depth, which is 80% for KH9-SPOT5 data (4.75 msurface opening, Figure 3d, versus 5.9 m dike opening,Figure 4b) and 80% for EDM data (4.28 m maximum
HOLLINGSWORTH ET AL.: THE 1975–1984 KRAFLA RIFT CRISIS
Figure 4. (a) Cartoon showing a single-dike rift model geometry (left) and dike/normal fault geome-try (right), which are both inverted using a Monte Carlo inversion technique (see text for details). (b)Probability density functions for different dike parameters which best fit the EDM (1978–1989) and KH9-SPOT5 (1977–2002) correlation data, assuming a single-dike model. Each plot is made up of 15–20separate inversions, to ensure the inversion is not sensitive to the starting model. Each inversion consistsof > 3 million different models. (c) Inversion results for a dike-two fault model, although we only varythe fault slip for the KH9-SPOT correlation data inversion.
surface length change, Table 1, versus 5.4 m dike opening,Figure 4b).
[19] Because the displacement values used in ourinversion lie outside the central rift zone (�1 km wide),the best-fitting dike model is not well constrained for theshallow part of the crust (top 1 km). Also, correlation ofKH9-SPOT5 and airphotos [see also Hollingsworth et al.,2012] clearly reveals localized fault slip on rift-boundingnormal faults, which are not accounted for by a single-dike model. Therefore, to better understand the deformation
within the upper few kilometers of the Krafla rift zone,we invert both the KH9-SPOT5 correlation and EDM datausing a model with two shallow normal faults above a dike(Figures 4a and 4c). The normal faults are constrained todip at 50°, typical for oceanic normal faulting earthquakes[Thatcher and Hill, 1995] and consistent with predictionsfrom rigid-plastic and elasto-plastic deformation models ofnormal faulting above a vertical crack [Gerbault et al.,1998], and extend from the surface to a depth of 0.8 km,thus forming a 1 km wide rift valley. Using the KH9-SPOT5
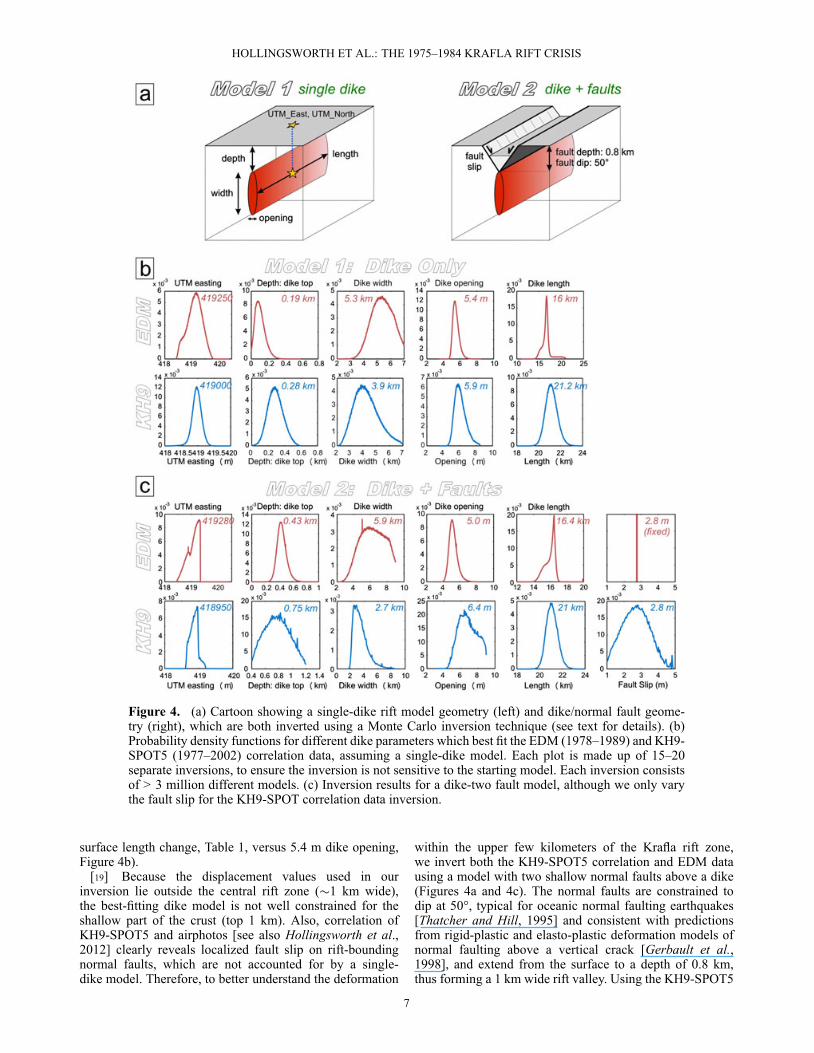
aLength changes measure the displacement between 1978 and 1989 [data from Tryggvason, 1991]. Data points within therift zone were not used in the inversion due to the added complexity from surface faulting. Although the 95% confidencelimits for each station were given as 0.02 m in the original data table, we do not know how these were determined. Therefore,we use a higher 95% confidence limit of 0.1 m.
correlation data, we invert for the best-fitting fault slip,which is fixed to be the same for both faults, yielding valuesof 2.8 m. The fault slip does not converge on a best-fittingvalue for the EDM data, presumably due to trade-offs result-ing from the sparse EDM data coverage; therefore, we fixthe fault slip at 2.8 m. The inversion results for the dike andfaulting model are shown in Figure 4c. The results are sim-ilar to the single-dike model, except that the depth to thetop of the dike increases from 0.19 km to 0.43 km for theEDM data, and 0.28 km to 0.75 km for the KH9-SPOT5data. The depth to the bottom of the dike increases slightlyfrom 5.5 km to 6.3 km for the EDM data (= depth to diketop + dike width) and decreases slightly from 4.2 km to3.45 km for the KH9-SPOT5 data. Dike opening decreasesfrom 5.4 m to 5.0 m (EDM) and increases from 5.9 mto 6.4 m (KH9-SPOT5). Thus, inclusion of shallow nor-mal faults does not affect the dike parameters dramatically,although the accommodation of extension by faulting in theshallowest crust tends to push the dike top to greater depths.The zone of overlap between the dike and faults is relativelysmall (only a few hundred meters). The ratio of surfaceopening to dike opening yields similar values to the single-dike model: 86% for the EDM data (4.28 m versus 5.0 m)and 74% for the KH9-SPOT5 data (4.75 m versus 6.4 m).The surface displacement profile produced by the most likelydike opening and fault slip parameters from inversion of theKH9-SPOT5 correlation data is shown in comparison withthe raw KH9-SPOT5 displacement data in Figure 3d.
[20] To see how much fault slip would be expectedfor two stress-free planes passively slipping in responseto a dike at depth, we also calculated the Coulomb stresschange expected on receiver faults oriented 50° above adike opening by 5.0 m and 6.4 m (the best-fit dike widths
from EDM and KH9-SPOT5 data; Figure 5). Because weuse a simple dike model with constant opening on a verti-cal dislocation, the Coulomb stress change goes to infinityimmediately above the dike. The stress change at the surfacemay provide a more realistic estimate of the stress changeproduced by the dike; although at 0.8 km depth, the prox-imity to the dike tip singularity may still influence the stresschanges at the surface.
[21] The Coulomb stress change at the surface producedby cumulative dike opening of 5.0 m is � 59 MPa and75 MPa for a 6.4 m dike. Inclusion of 2.8 m slip on conju-gate normal faults above the dike relieves a large proportionof the Coulomb stress, accounting for 76% of the stress(14 MPa remaining) for a 5.0 m dike and 60% of thestress (30 MPa remaining) for a 6.4 m dike (Figures 5a and5b). Although the residual Coulomb stress change remain-ing at the surface is still unrealistically high (14–30 MPa),this is strongly affected by the proximity to the singular-ity above the dike. Although we do not model taperingdikes in this study, to keep the modeling as simple as pos-sible, we find that inclusion of tapered dikes significantlyreduces the residual Coulomb stress at the surface to val-ues < 10 MPa. Nevertheless, to completely relieve theCoulomb stress change above the dike, we would need hor-izontal extension across the faults to nearly equal the dikeopening, which suggests that either a deficit of slip remainsin the shallow crust at Krafla or the faults had alreadyaccommodated some of this slip before the crisis began.
4.2. Central Krafla Rift: Constraints on Dike Openingand Fault Slip From Airphotos (1957–1990)
[22] Using high-resolution measurements of the hor-izontal and vertical deformation fields obtained from
8
HOLLINGSWORTH ET AL.: THE 1975–1984 KRAFLA RIFT CRISIS
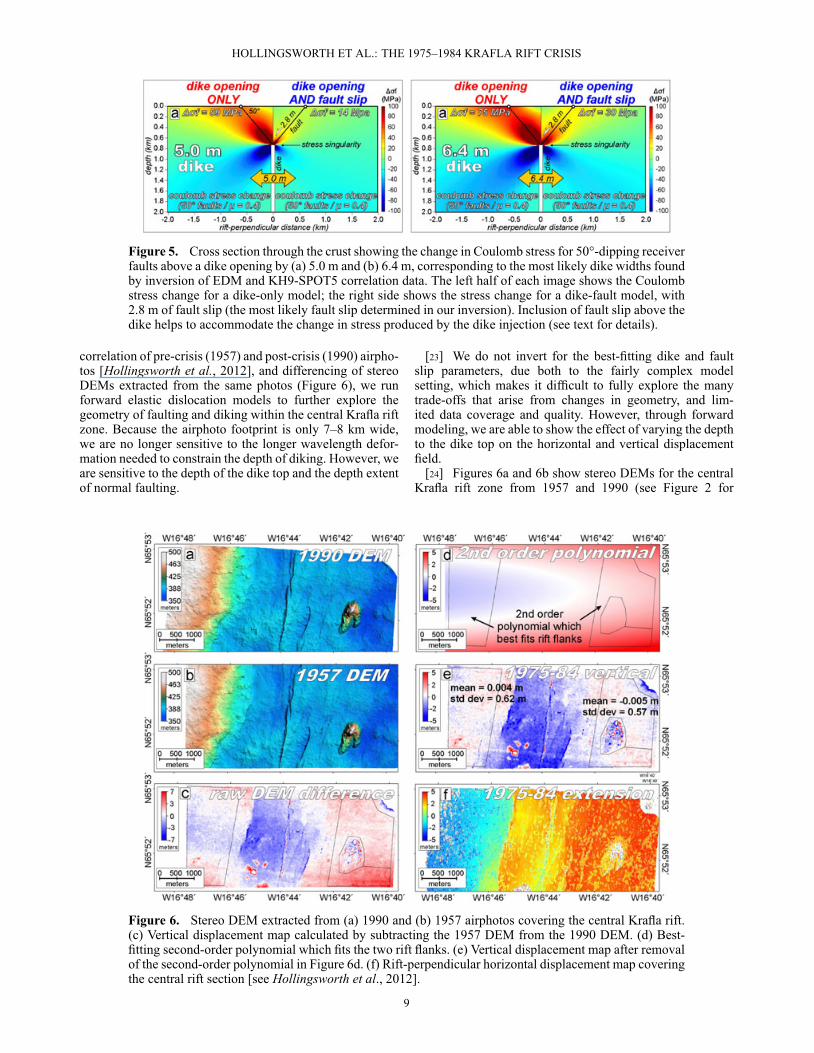
Figure 5. Cross section through the crust showing the change in Coulomb stress for 50°-dipping receiverfaults above a dike opening by (a) 5.0 m and (b) 6.4 m, corresponding to the most likely dike widths foundby inversion of EDM and KH9-SPOT5 correlation data. The left half of each image shows the Coulombstress change for a dike-only model; the right side shows the stress change for a dike-fault model, with2.8 m of fault slip (the most likely fault slip determined in our inversion). Inclusion of fault slip above thedike helps to accommodate the change in stress produced by the dike injection (see text for details).
correlation of pre-crisis (1957) and post-crisis (1990) airpho-tos [Hollingsworth et al., 2012], and differencing of stereoDEMs extracted from the same photos (Figure 6), we runforward elastic dislocation models to further explore thegeometry of faulting and diking within the central Krafla riftzone. Because the airphoto footprint is only 7–8 km wide,we are no longer sensitive to the longer wavelength defor-mation needed to constrain the depth of diking. However, weare sensitive to the depth of the dike top and the depth extentof normal faulting.
[23] We do not invert for the best-fitting dike and faultslip parameters, due both to the fairly complex modelsetting, which makes it difficult to fully explore the manytrade-offs that arise from changes in geometry, and lim-ited data coverage and quality. However, through forwardmodeling, we are able to show the effect of varying the depthto the dike top on the horizontal and vertical displacementfield.
[24] Figures 6a and 6b show stereo DEMs for the centralKrafla rift zone from 1957 and 1990 (see Figure 2 for
Figure 6. Stereo DEM extracted from (a) 1990 and (b) 1957 airphotos covering the central Krafla rift.(c) Vertical displacement map calculated by subtracting the 1957 DEM from the 1990 DEM. (d) Best-fitting second-order polynomial which fits the two rift flanks. (e) Vertical displacement map after removalof the second-order polynomial in Figure 6d. (f) Rift-perpendicular horizontal displacement map coveringthe central rift section [see Hollingsworth et al., 2012].
HOLLINGSWORTH ET AL.: THE 1975–1984 KRAFLA RIFT CRISIS
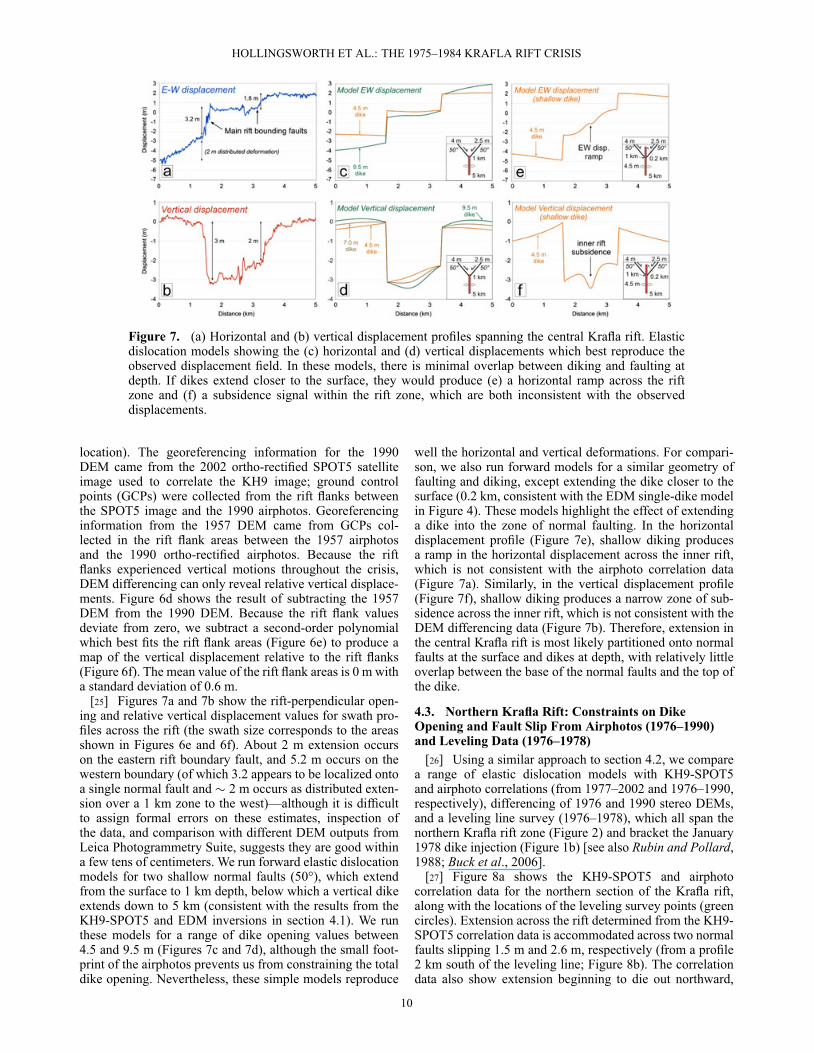
Figure 7. (a) Horizontal and (b) vertical displacement profiles spanning the central Krafla rift. Elasticdislocation models showing the (c) horizontal and (d) vertical displacements which best reproduce theobserved displacement field. In these models, there is minimal overlap between diking and faulting atdepth. If dikes extend closer to the surface, they would produce (e) a horizontal ramp across the riftzone and (f) a subsidence signal within the rift zone, which are both inconsistent with the observeddisplacements.
location). The georeferencing information for the 1990DEM came from the 2002 ortho-rectified SPOT5 satelliteimage used to correlate the KH9 image; ground controlpoints (GCPs) were collected from the rift flanks betweenthe SPOT5 image and the 1990 airphotos. Georeferencinginformation from the 1957 DEM came from GCPs col-lected in the rift flank areas between the 1957 airphotosand the 1990 ortho-rectified airphotos. Because the riftflanks experienced vertical motions throughout the crisis,DEM differencing can only reveal relative vertical displace-ments. Figure 6d shows the result of subtracting the 1957DEM from the 1990 DEM. Because the rift flank valuesdeviate from zero, we subtract a second-order polynomialwhich best fits the rift flank areas (Figure 6e) to produce amap of the vertical displacement relative to the rift flanks(Figure 6f). The mean value of the rift flank areas is 0 m witha standard deviation of 0.6 m.
[25] Figures 7a and 7b show the rift-perpendicular open-ing and relative vertical displacement values for swath pro-files across the rift (the swath size corresponds to the areasshown in Figures 6e and 6f). About 2 m extension occurson the eastern rift boundary fault, and 5.2 m occurs on thewestern boundary (of which 3.2 appears to be localized ontoa single normal fault and � 2 m occurs as distributed exten-sion over a 1 km zone to the west)—although it is difficultto assign formal errors on these estimates, inspection ofthe data, and comparison with different DEM outputs fromLeica Photogrammetry Suite, suggests they are good withina few tens of centimeters. We run forward elastic dislocationmodels for two shallow normal faults (50°), which extendfrom the surface to 1 km depth, below which a vertical dikeextends down to 5 km (consistent with the results from theKH9-SPOT5 and EDM inversions in section 4.1). We runthese models for a range of dike opening values between4.5 and 9.5 m (Figures 7c and 7d), although the small foot-print of the airphotos prevents us from constraining the totaldike opening. Nevertheless, these simple models reproduce
well the horizontal and vertical deformations. For compari-son, we also run forward models for a similar geometry offaulting and diking, except extending the dike closer to thesurface (0.2 km, consistent with the EDM single-dike modelin Figure 4). These models highlight the effect of extendinga dike into the zone of normal faulting. In the horizontaldisplacement profile (Figure 7e), shallow diking producesa ramp in the horizontal displacement across the inner rift,which is not consistent with the airphoto correlation data(Figure 7a). Similarly, in the vertical displacement profile(Figure 7f), shallow diking produces a narrow zone of sub-sidence across the inner rift, which is not consistent with theDEM differencing data (Figure 7b). Therefore, extension inthe central Krafla rift is most likely partitioned onto normalfaults at the surface and dikes at depth, with relatively littleoverlap between the base of the normal faults and the top ofthe dike.
4.3. Northern Krafla Rift: Constraints on DikeOpening and Fault Slip From Airphotos (1976–1990)and Leveling Data (1976–1978)
[26] Using a similar approach to section 4.2, we comparea range of elastic dislocation models with KH9-SPOT5and airphoto correlations (from 1977–2002 and 1976–1990,respectively), differencing of 1976 and 1990 stereo DEMs,and a leveling line survey (1976–1978), which all span thenorthern Krafla rift zone (Figure 2) and bracket the January1978 dike injection (Figure 1b) [see also Rubin and Pollard,1988; Buck et al., 2006].
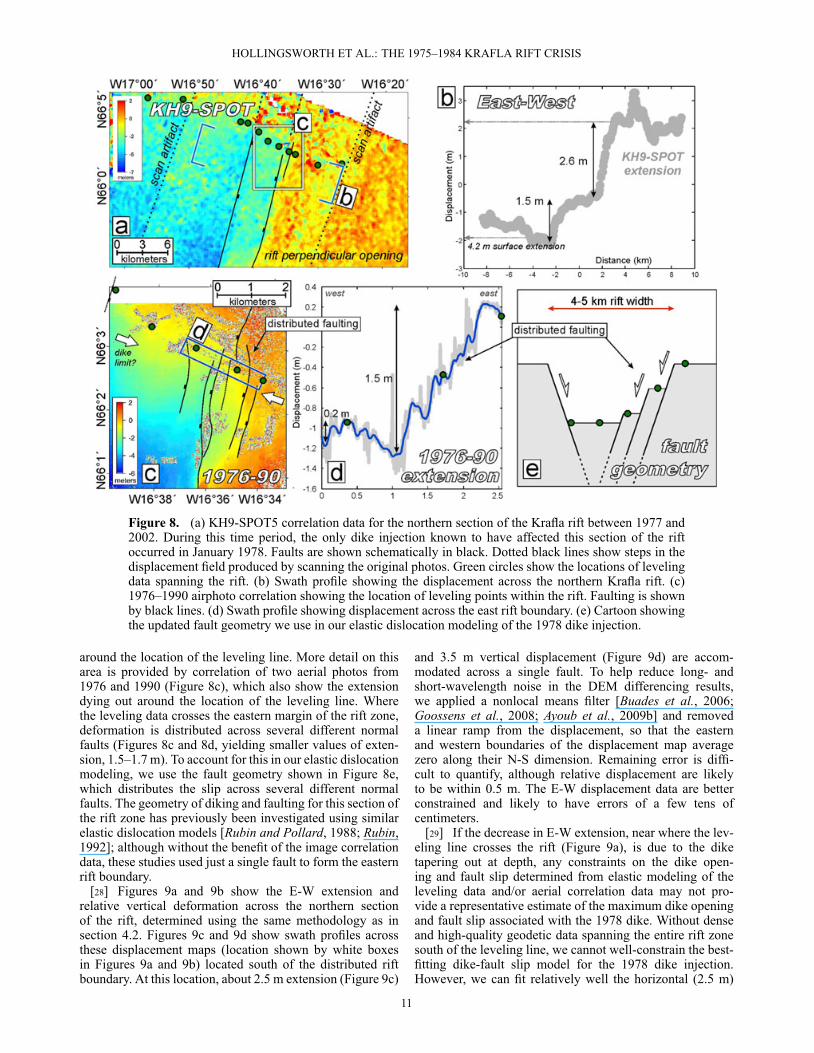
[27] Figure 8a shows the KH9-SPOT5 and airphotocorrelation data for the northern section of the Krafla rift,along with the locations of the leveling survey points (greencircles). Extension across the rift determined from the KH9-SPOT5 correlation data is accommodated across two normalfaults slipping 1.5 m and 2.6 m, respectively (from a profile2 km south of the leveling line; Figure 8b). The correlationdata also show extension beginning to die out northward,
HOLLINGSWORTH ET AL.: THE 1975–1984 KRAFLA RIFT CRISIS
Figure 8. (a) KH9-SPOT5 correlation data for the northern section of the Krafla rift between 1977 and2002. During this time period, the only dike injection known to have affected this section of the riftoccurred in January 1978. Faults are shown schematically in black. Dotted black lines show steps in thedisplacement field produced by scanning the original photos. Green circles show the locations of levelingdata spanning the rift. (b) Swath profile showing the displacement across the northern Krafla rift. (c)1976–1990 airphoto correlation showing the location of leveling points within the rift. Faulting is shownby black lines. (d) Swath profile showing displacement across the east rift boundary. (e) Cartoon showingthe updated fault geometry we use in our elastic dislocation modeling of the 1978 dike injection.
around the location of the leveling line. More detail on thisarea is provided by correlation of two aerial photos from1976 and 1990 (Figure 8c), which also show the extensiondying out around the location of the leveling line. Wherethe leveling data crosses the eastern margin of the rift zone,deformation is distributed across several different normalfaults (Figures 8c and 8d, yielding smaller values of exten-sion, 1.5–1.7 m). To account for this in our elastic dislocationmodeling, we use the fault geometry shown in Figure 8e,which distributes the slip across several different normalfaults. The geometry of diking and faulting for this section ofthe rift zone has previously been investigated using similarelastic dislocation models [Rubin and Pollard, 1988; Rubin,1992]; although without the benefit of the image correlationdata, these studies used just a single fault to form the easternrift boundary.
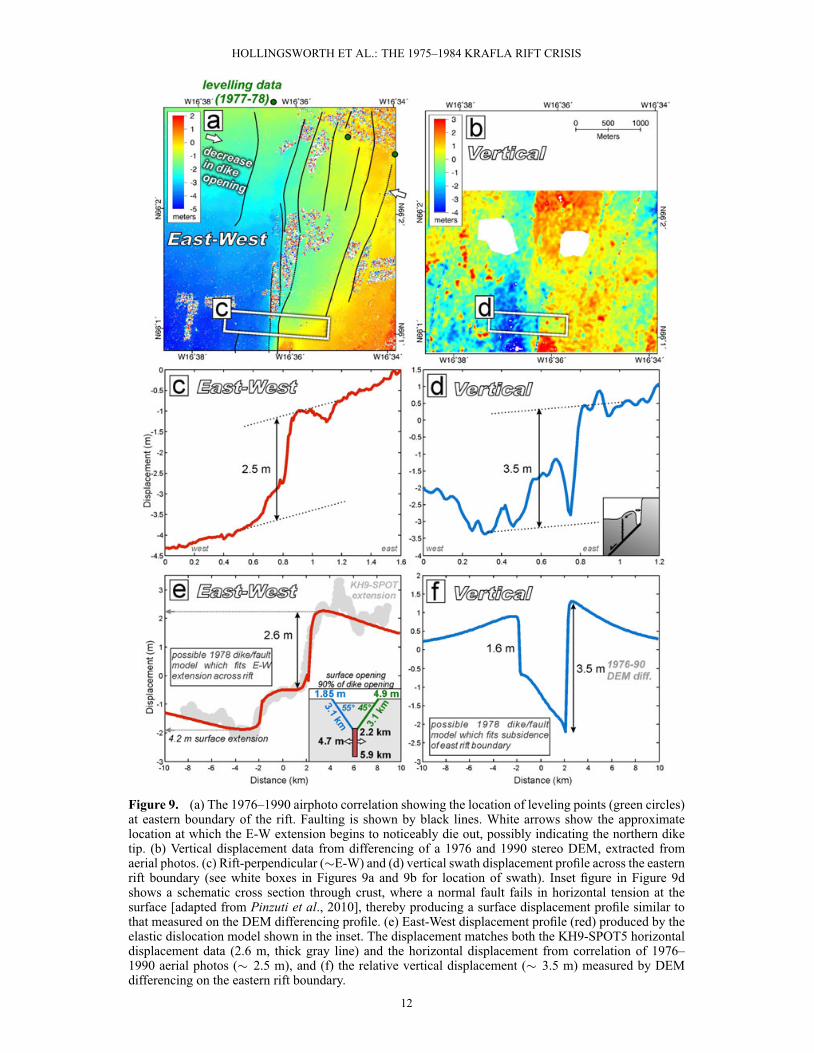
[28] Figures 9a and 9b show the E-W extension andrelative vertical deformation across the northern sectionof the rift, determined using the same methodology as insection 4.2. Figures 9c and 9d show swath profiles acrossthese displacement maps (location shown by white boxesin Figures 9a and 9b) located south of the distributed riftboundary. At this location, about 2.5 m extension (Figure 9c)
and 3.5 m vertical displacement (Figure 9d) are accom-modated across a single fault. To help reduce long- andshort-wavelength noise in the DEM differencing results,we applied a nonlocal means filter [Buades et al., 2006;Goossens et al., 2008; Ayoub et al., 2009b] and removeda linear ramp from the displacement, so that the easternand western boundaries of the displacement map averagezero along their N-S dimension. Remaining error is diffi-cult to quantify, although relative displacement are likelyto be within 0.5 m. The E-W displacement data are betterconstrained and likely to have errors of a few tens ofcentimeters.
[29] If the decrease in E-W extension, near where the lev-eling line crosses the rift (Figure 9a), is due to the diketapering out at depth, any constraints on the dike open-ing and fault slip determined from elastic modeling of theleveling data and/or aerial correlation data may not pro-vide a representative estimate of the maximum dike openingand fault slip associated with the 1978 dike. Without denseand high-quality geodetic data spanning the entire rift zonesouth of the leveling line, we cannot well-constrain the best-fitting dike-fault slip model for the 1978 dike injection.However, we can fit relatively well the horizontal (2.5 m)
HOLLINGSWORTH ET AL.: THE 1975–1984 KRAFLA RIFT CRISIS
Figure 9. (a) The 1976–1990 airphoto correlation showing the location of leveling points (green circles)at eastern boundary of the rift. Faulting is shown by black lines. White arrows show the approximatelocation at which the E-W extension begins to noticeably die out, possibly indicating the northern diketip. (b) Vertical displacement data from differencing of a 1976 and 1990 stereo DEM, extracted fromaerial photos. (c) Rift-perpendicular (�E-W) and (d) vertical swath displacement profile across the easternrift boundary (see white boxes in Figures 9a and 9b for location of swath). Inset figure in Figure 9dshows a schematic cross section through crust, where a normal fault fails in horizontal tension at thesurface [adapted from Pinzuti et al., 2010], thereby producing a surface displacement profile similar tothat measured on the DEM differencing profile. (e) East-West displacement profile (red) produced by theelastic dislocation model shown in the inset. The displacement matches both the KH9-SPOT5 horizontaldisplacement data (2.6 m, thick gray line) and the horizontal displacement from correlation of 1976–1990 aerial photos (� 2.5 m), and (f) the relative vertical displacement (� 3.5 m) measured by DEMdifferencing on the eastern rift boundary.
12
HOLLINGSWORTH ET AL.: THE 1975–1984 KRAFLA RIFT CRISIS
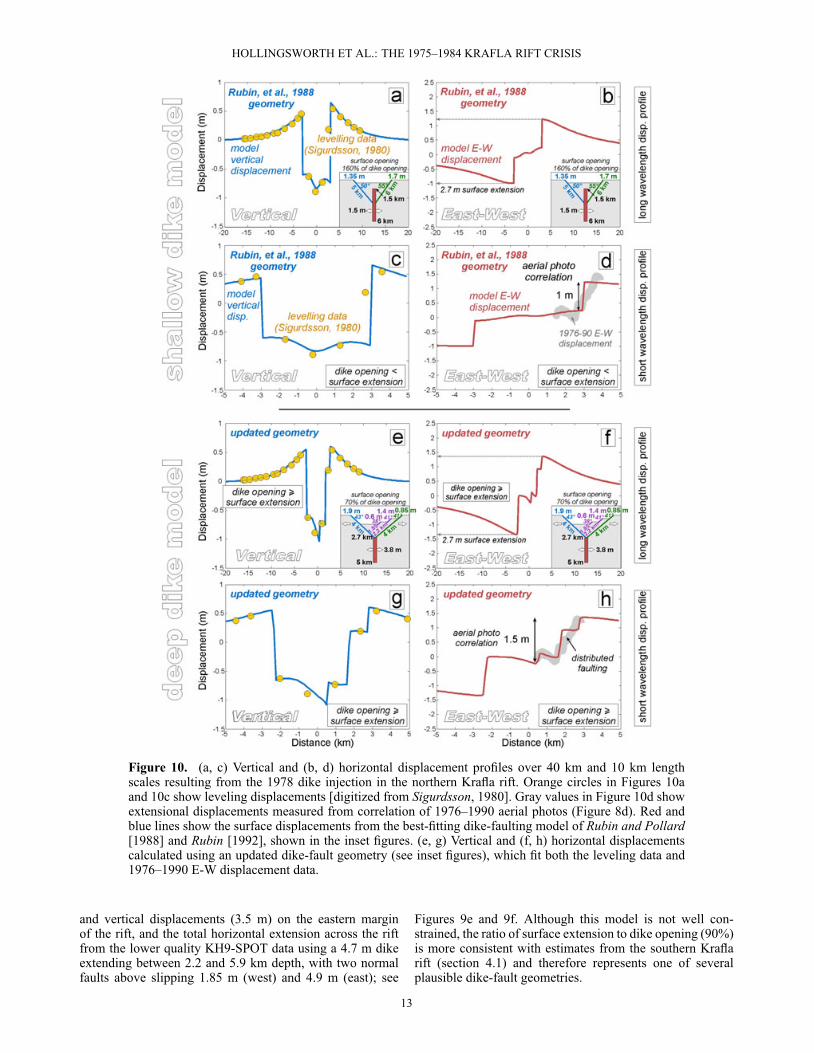
Figure 10. (a, c) Vertical and (b, d) horizontal displacement profiles over 40 km and 10 km lengthscales resulting from the 1978 dike injection in the northern Krafla rift. Orange circles in Figures 10aand 10c show leveling displacements [digitized from Sigurdsson, 1980]. Gray values in Figure 10d showextensional displacements measured from correlation of 1976–1990 aerial photos (Figure 8d). Red andblue lines show the surface displacements from the best-fitting dike-faulting model of Rubin and Pollard[1988] and Rubin [1992], shown in the inset figures. (e, g) Vertical and (f, h) horizontal displacementscalculated using an updated dike-fault geometry (see inset figures), which fit both the leveling data and1976–1990 E-W displacement data.
and vertical displacements (3.5 m) on the eastern marginof the rift, and the total horizontal extension across the riftfrom the lower quality KH9-SPOT data using a 4.7 m dikeextending between 2.2 and 5.9 km depth, with two normalfaults above slipping 1.85 m (west) and 4.9 m (east); see
Figures 9e and 9f. Although this model is not well con-strained, the ratio of surface extension to dike opening (90%)is more consistent with estimates from the southern Kraflarift (section 4.1) and therefore represents one of severalplausible dike-fault geometries.
13
HOLLINGSWORTH ET AL.: THE 1975–1984 KRAFLA RIFT CRISIS
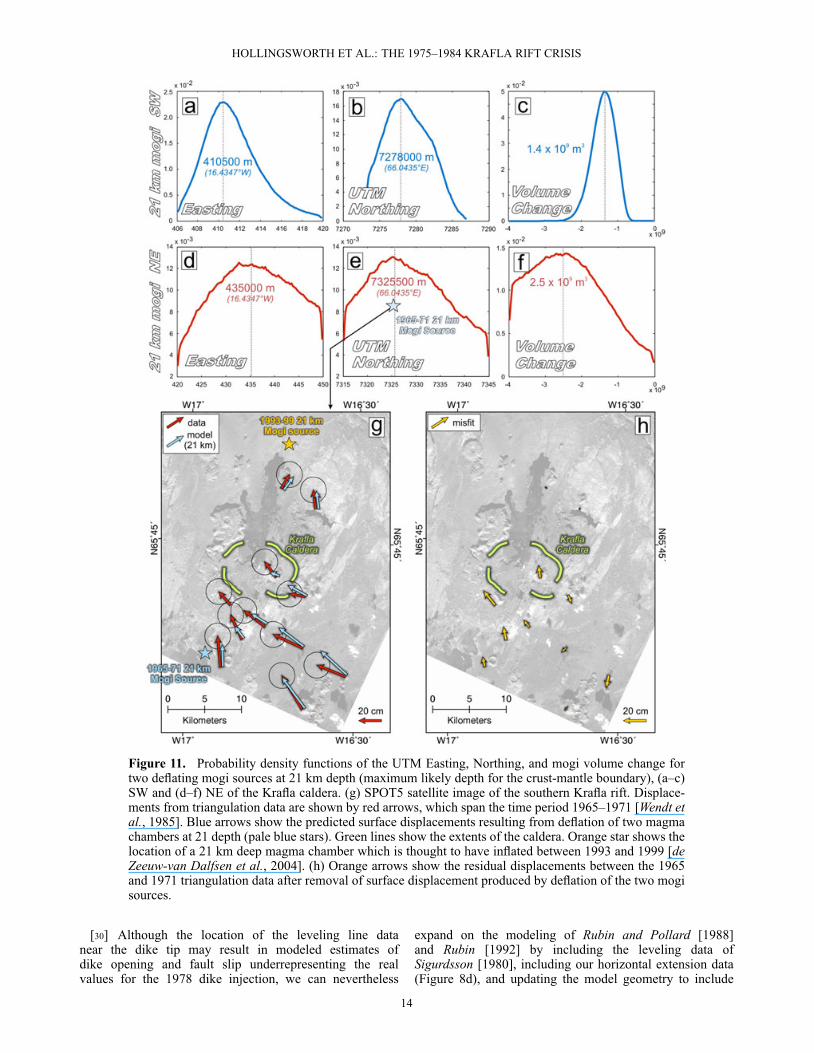
Figure 11. Probability density functions of the UTM Easting, Northing, and mogi volume change fortwo deflating mogi sources at 21 km depth (maximum likely depth for the crust-mantle boundary), (a–c)SW and (d–f) NE of the Krafla caldera. (g) SPOT5 satellite image of the southern Krafla rift. Displace-ments from triangulation data are shown by red arrows, which span the time period 1965–1971 [Wendt etal., 1985]. Blue arrows show the predicted surface displacements resulting from deflation of two magmachambers at 21 depth (pale blue stars). Green lines show the extents of the caldera. Orange star shows thelocation of a 21 km deep magma chamber which is thought to have inflated between 1993 and 1999 [deZeeuw-van Dalfsen et al., 2004]. (h) Orange arrows show the residual displacements between the 1965and 1971 triangulation data after removal of surface displacement produced by deflation of the two mogisources.
[30] Although the location of the leveling line datanear the dike tip may result in modeled estimates ofdike opening and fault slip underrepresenting the realvalues for the 1978 dike injection, we can nevertheless
expand on the modeling of Rubin and Pollard [1988]and Rubin [1992] by including the leveling data ofSigurdsson [1980], including our horizontal extension data(Figure 8d), and updating the model geometry to include
HOLLINGSWORTH ET AL.: THE 1975–1984 KRAFLA RIFT CRISIS
more distributed faulting on the eastern rift boundary(Figure 8e).
[31] Figures 10a–10d show the vertical and horizontaldeformation profiles from Rubin and Pollard [1988] whichbest fit the leveling data. Figures 10a and 10c, and 10band 10d show the data fit over two different length scales,one covering a 40 km profile across the rift and rift flanksand the second covering a 10 km profile across just therift (figure inset shows the dike-fault geometry). The modelfits the leveling data well, with the exception of one pointon the eastern rift boundary (Figure 10c). The model alsounderestimates extension across the eastern rift boundary by� 0.5 m, compared with the horizontal displacement profilefrom the 1976–1990 aerial photo correlation (gray profilein Figure 10d). Figures 10e–10h show similar displace-ment profiles calculated using an updated model geometrywhich includes three faults at the eastern rift boundary,thus better approximating the distributed faulting whichis clearly expressed in the aerial photo correlation data(Figure 9c). In this updated dike-fault model, the surfaceextension (2.7 m) is around 70% of the dike opening (3.8 m),which is consistent with the values from the southern Kraflarift (section 4.1), while the dike and faults do not overlapsignificantly within the crust.
[32] The complicated model geometry shown inFigures 10e–10h precludes an easy exploration of all thetrade-offs between the different parameters, and so it doesnot represent a unique solution. Nevertheless, it shows thatalternative dike-fault models in which dike opening is equalto or greater than the surface extension, with only minoroverlap between faults and dikes in the crust, may alsoexplain the surface deformation data.
4.4. Deep Deflation Prior to the 1975–84 KraflaRifting Crisis
[33] Wendt et al. [1985] established a triangulation net-work covering the southern section of the Krafla rift over theperiod 1965–1971 (Figure 11). The authors found contrac-tions of � 0.5 m across the rift zone, which they claim werenot due to a scale error (the relative shortening of the lineswas also confirmed by a purely directional network). Trian-gulation points from close to the caldera region (the “free”,open circles of Wendt et al., 1985) also show � 0.25 mnorthward motion, relative to stations in nondeforming areasfurther from the rift zone. The authors suggest that the north-ward component in these velocities is a result either fromtectonic deformation prior to the rifting crisis or from rota-tions in the triangulation network caused by nondetectedobservation errors. Assuming the velocity field around thecaldera is the result of magma-induced deformation, thedecrease in velocities toward the caldera could be explainedby deflation of a deep magma source, possibly as magmamigrates to shallower depths prior to the crisis. Using a mogisource to approximate deflation of a deep magma source[e.g., Mogi, 1958; de Zeeuw-van Dalfsen et al., 2004], weinvert the 1965–1971 velocity field of Wendt et al. [1985],using the same method as section 4.1, to determine the best-fitting parameters defining two mogi sources, location (UTMEasting and Northing) and volume change (Figure 11), tosee what kind of deflation may be required to fit the trian-gulation data (Figures 11a–11f). Because the data NE of thecaldera cannot be explained by the same mogi source which
accounts for contraction south of the caldera (red arrows inFigure 11g), we invert for a second mogi source to the NE(blue star in Figure 11e shows location relative to the mapin g). Because this mogi source is only constrained by twostations, the depth and location are not well constrained. Fur-thermore, if we allow mogi depths to vary, the inversionconverges on depths of �30 km, where the deformation isunlikely to be elastic. Therefore, we fix the depth of the mogisources to lie near the base of the crust at 21 km, consis-tent with seismic reflection results from the Krafla region[Staples et al., 1997]. This depth is also where de Zeeuw-vanDalfsen et al. [2004] located an inflating mogi source for theperiod 1993–1999.
[34] The best-fitting mogi displacements are shown bythe blue arrows in Figure 11g and the residuals inFigure 11h. Because the residuals are relatively large, thetwo source mogi model explored here does not representa unique solution. The probability density functions shownin Figures 11a–11f therefore represent the most likely mogisource parameters, given the various assumptions outlinedabove, especially that the triangulation displacements are notthe result of survey errors. The best-fitting mogi locations(blue stars in Figure 11g) lie significantly away from thecaldera and the 1993–1999 mogi source, although they dogenerally lie along the rift axis—however, we find that thelocations vary significantly depending on the mogi depthsused and inclusion of the additional mogi source to the NEwhich is strongly influenced by only two stations. Further-more, Wendt et al. [1985] state that the northward velocitiesmay be influenced by rotations in the triangulation net-work caused by nondetected observation errors. Therefore,we consider our best-fitting mogi locations to be poorlyconstrained. Nevertheless, the volume change of the mogisource is strongly controlled by the 0.5 m of contractionacross the region, which Wendt et al. [1985] claim is wellresolved. Deflation of the southern mogi source is � 1.4 �109 m3, while deflation of the northern source is 2.5�109 m3
(although this value is also not well constrained). Therefore,the combined deflation is likely to be larger than 1.4�109 m3,and potentially between 1.4 and 3.9 � 109 m3. Neverthe-less, a significant problem with modeling the triangulationdata with deep deflation of mogi sources is that the vol-ume of material that has left these deeper magma chambersmust have been introduced at higher levels in the crust. Thiswould produce a larger surface deformation signal, over-printing the deeper deflation signal, which we do not see.The question of where this material has gone is discussed insection 5.1.
5. Discussion5.1. Summary of Deformation
[35] Using a combination of data sets, including corre-lation of KH9 and SPOT5 satellite images and airphotos,DEM differencing, EDM, and leveling data, we measurethe deformation resulting from the 1975–1984 Krafla riftcrisis. In section 4.1, we use KH9-SPOT5 correlation andEDM measurements to constrain deformation at the south-ern section of the rift between 1977 and 1978, and the endof the crisis. Opening occurs primarily on a 5–6 m widedike injected between 0.5 and 5 km in the upper crust,with a surface : dike opening ratio of � 80%. Airphoto
HOLLINGSWORTH ET AL.: THE 1975–1984 KRAFLA RIFT CRISIS
correlations and DEM differencing for the central section ofthe rift indicate that extension is partitioned onto dikes atdepths of � 1 km and normal faults at depths � 1 km. Inthe northern Krafla rift, KH9-SPOT5 and airphoto correla-tions, DEM differencing, and leveling data indicate openingon dikes between 3 and 5 km and normal faulting at depths� 3 km. Therefore, the upper depth limit for dikes alongthe Krafla rift zone varies from from 0 to 0.5 km in thesouth, � 1 km in the central, and � 2–3 km in the northernsections of the rift zone. The lower depth limit appears tobe relatively consistent at 4–5 km in the southern and north-ern sections. Extension is partitioned onto dikes at depth andfaults near the surface, and the two do not appear to overlapsignificantly.
[36] Based on the ratio of surface to dike opening(� 80%), the total dike opening at depth may exceed thesurface opening summarized in Figure 1b by > 20%. Thetotal opening, averaged along the entire 70–80 km length ofthe rift zone is 4.3 m. Therefore, the average dike openingat depth may range between 4.3 and 5.4 m. Assuming anaverage vertical extent of 3–4 km for dikes injected through-out the rift, we calculate a total volume of 0.9–1.7�109 m3 ofmagma injected into the crust over the whole crisis. The vol-ume of the erupted material may be calculated from its aerialextent (40 km2) and average thickness (5–10 m, determinedfrom aerial photo DEMs), yielding 0.2–0.4 � 109 m3. There-fore, the total volume of material which was erupted/injectedduring the Krafla rift crisis is estimated to be 1.1–2.1 �109 m3. This value is similar to the volume of material leav-ing the shallow magma chamber beneath the Krafla calderabetween 1975 and 1984 (0.79–0.85 � 109 m3) estimated by[Harris et al., 2000] using geodetic data from Tryggvason[1984] and Ewart et al. [1991].
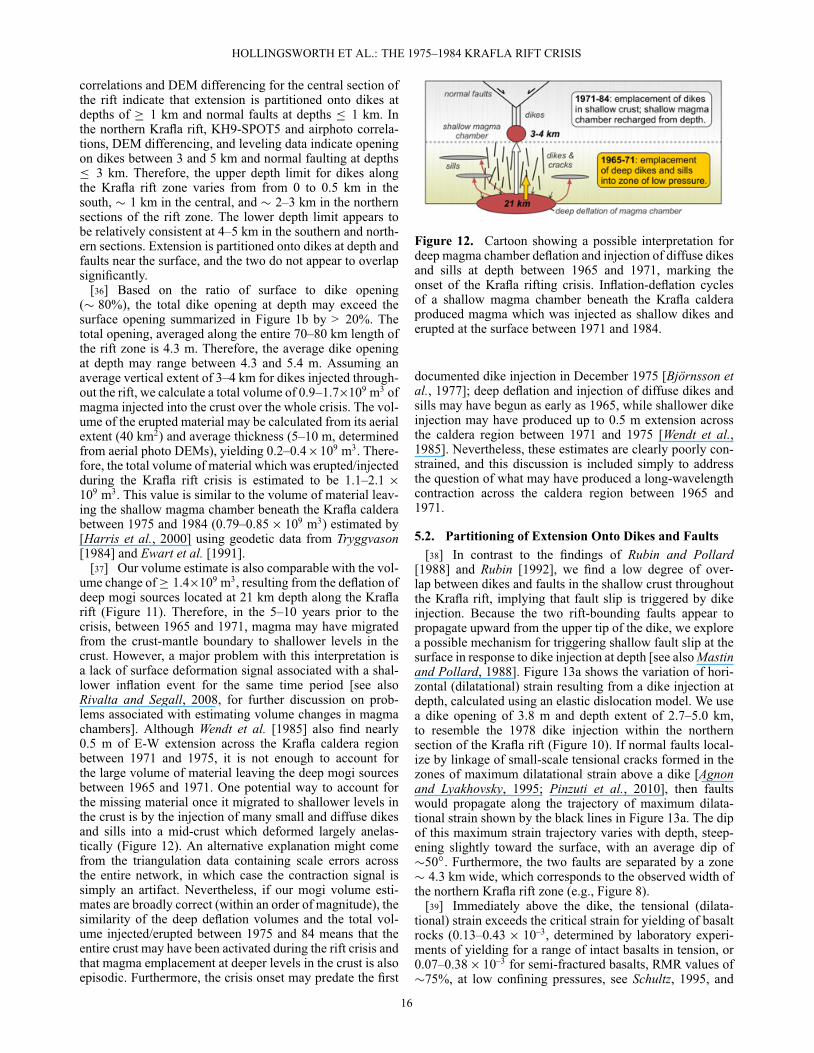
[37] Our volume estimate is also comparable with the vol-ume change of � 1.4�109 m3, resulting from the deflation ofdeep mogi sources located at 21 km depth along the Kraflarift (Figure 11). Therefore, in the 5–10 years prior to thecrisis, between 1965 and 1971, magma may have migratedfrom the crust-mantle boundary to shallower levels in thecrust. However, a major problem with this interpretation isa lack of surface deformation signal associated with a shal-lower inflation event for the same time period [see alsoRivalta and Segall, 2008, for further discussion on prob-lems associated with estimating volume changes in magmachambers]. Although Wendt et al. [1985] also find nearly0.5 m of E-W extension across the Krafla caldera regionbetween 1971 and 1975, it is not enough to account forthe large volume of material leaving the deep mogi sourcesbetween 1965 and 1971. One potential way to account forthe missing material once it migrated to shallower levels inthe crust is by the injection of many small and diffuse dikesand sills into a mid-crust which deformed largely anelas-tically (Figure 12). An alternative explanation might comefrom the triangulation data containing scale errors acrossthe entire network, in which case the contraction signal issimply an artifact. Nevertheless, if our mogi volume esti-mates are broadly correct (within an order of magnitude), thesimilarity of the deep deflation volumes and the total vol-ume injected/erupted between 1975 and 84 means that theentire crust may have been activated during the rift crisis andthat magma emplacement at deeper levels in the crust is alsoepisodic. Furthermore, the crisis onset may predate the first
Figure 12. Cartoon showing a possible interpretation fordeep magma chamber deflation and injection of diffuse dikesand sills at depth between 1965 and 1971, marking theonset of the Krafla rifting crisis. Inflation-deflation cyclesof a shallow magma chamber beneath the Krafla calderaproduced magma which was injected as shallow dikes anderupted at the surface between 1971 and 1984.
documented dike injection in December 1975 [Björnsson etal., 1977]; deep deflation and injection of diffuse dikes andsills may have begun as early as 1965, while shallower dikeinjection may have produced up to 0.5 m extension acrossthe caldera region between 1971 and 1975 [Wendt et al.,1985]. Nevertheless, these estimates are clearly poorly con-strained, and this discussion is included simply to addressthe question of what may have produced a long-wavelengthcontraction across the caldera region between 1965 and1971.
5.2. Partitioning of Extension Onto Dikes and Faults[38] In contrast to the findings of Rubin and Pollard
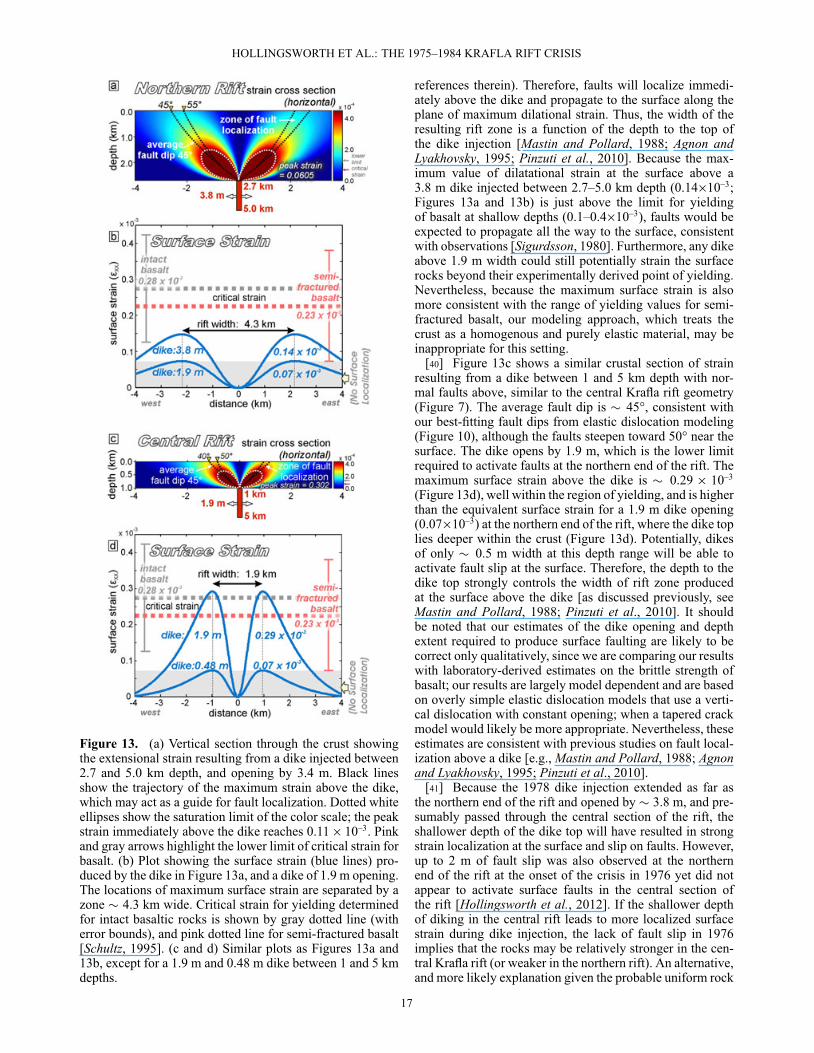
[1988] and Rubin [1992], we find a low degree of over-lap between dikes and faults in the shallow crust throughoutthe Krafla rift, implying that fault slip is triggered by dikeinjection. Because the two rift-bounding faults appear topropagate upward from the upper tip of the dike, we explorea possible mechanism for triggering shallow fault slip at thesurface in response to dike injection at depth [see also Mastinand Pollard, 1988]. Figure 13a shows the variation of hori-zontal (dilatational) strain resulting from a dike injection atdepth, calculated using an elastic dislocation model. We usea dike opening of 3.8 m and depth extent of 2.7–5.0 km,to resemble the 1978 dike injection within the northernsection of the Krafla rift (Figure 10). If normal faults local-ize by linkage of small-scale tensional cracks formed in thezones of maximum dilatational strain above a dike [Agnonand Lyakhovsky, 1995; Pinzuti et al., 2010], then faultswould propagate along the trajectory of maximum dilata-tional strain shown by the black lines in Figure 13a. The dipof this maximum strain trajectory varies with depth, steep-ening slightly toward the surface, with an average dip of�50ı. Furthermore, the two faults are separated by a zone� 4.3 km wide, which corresponds to the observed width ofthe northern Krafla rift zone (e.g., Figure 8).
[39] Immediately above the dike, the tensional (dilata-tional) strain exceeds the critical strain for yielding of basaltrocks (0.13–0.43 � 10–3, determined by laboratory experi-ments of yielding for a range of intact basalts in tension, or0.07–0.38 � 10–3 for semi-fractured basalts, RMR values of�75%, at low confining pressures, see Schultz, 1995, and
HOLLINGSWORTH ET AL.: THE 1975–1984 KRAFLA RIFT CRISIS
Figure 13. (a) Vertical section through the crust showingthe extensional strain resulting from a dike injected between2.7 and 5.0 km depth, and opening by 3.4 m. Black linesshow the trajectory of the maximum strain above the dike,which may act as a guide for fault localization. Dotted whiteellipses show the saturation limit of the color scale; the peakstrain immediately above the dike reaches 0.11 � 10–3. Pinkand gray arrows highlight the lower limit of critical strain forbasalt. (b) Plot showing the surface strain (blue lines) pro-duced by the dike in Figure 13a, and a dike of 1.9 m opening.The locations of maximum surface strain are separated by azone � 4.3 km wide. Critical strain for yielding determinedfor intact basaltic rocks is shown by gray dotted line (witherror bounds), and pink dotted line for semi-fractured basalt[Schultz, 1995]. (c and d) Similar plots as Figures 13a and13b, except for a 1.9 m and 0.48 m dike between 1 and 5 kmdepths.
references therein). Therefore, faults will localize immedi-ately above the dike and propagate to the surface along theplane of maximum dilational strain. Thus, the width of theresulting rift zone is a function of the depth to the top ofthe dike injection [Mastin and Pollard, 1988; Agnon andLyakhovsky, 1995; Pinzuti et al., 2010]. Because the max-imum value of dilatational strain at the surface above a3.8 m dike injected between 2.7–5.0 km depth (0.14�10–3;Figures 13a and 13b) is just above the limit for yieldingof basalt at shallow depths (0.1–0.4�10–3), faults would beexpected to propagate all the way to the surface, consistentwith observations [Sigurdsson, 1980]. Furthermore, any dikeabove 1.9 m width could still potentially strain the surfacerocks beyond their experimentally derived point of yielding.Nevertheless, because the maximum surface strain is alsomore consistent with the range of yielding values for semi-fractured basalt, our modeling approach, which treats thecrust as a homogenous and purely elastic material, may beinappropriate for this setting.
[40] Figure 13c shows a similar crustal section of strainresulting from a dike between 1 and 5 km depth with nor-mal faults above, similar to the central Krafla rift geometry(Figure 7). The average fault dip is � 45°, consistent withour best-fitting fault dips from elastic dislocation modeling(Figure 10), although the faults steepen toward 50° near thesurface. The dike opens by 1.9 m, which is the lower limitrequired to activate faults at the northern end of the rift. Themaximum surface strain above the dike is � 0.29 � 10–3
(Figure 13d), well within the region of yielding, and is higherthan the equivalent surface strain for a 1.9 m dike opening(0.07�10–3) at the northern end of the rift, where the dike toplies deeper within the crust (Figure 13d). Potentially, dikesof only � 0.5 m width at this depth range will be able toactivate fault slip at the surface. Therefore, the depth to thedike top strongly controls the width of rift zone producedat the surface above the dike [as discussed previously, seeMastin and Pollard, 1988; Pinzuti et al., 2010]. It shouldbe noted that our estimates of the dike opening and depthextent required to produce surface faulting are likely to becorrect only qualitatively, since we are comparing our resultswith laboratory-derived estimates on the brittle strength ofbasalt; our results are largely model dependent and are basedon overly simple elastic dislocation models that use a verti-cal dislocation with constant opening; when a tapered crackmodel would likely be more appropriate. Nevertheless, theseestimates are consistent with previous studies on fault local-ization above a dike [e.g., Mastin and Pollard, 1988; Agnonand Lyakhovsky, 1995; Pinzuti et al., 2010].
[41] Because the 1978 dike injection extended as far asthe northern end of the rift and opened by � 3.8 m, and pre-sumably passed through the central section of the rift, theshallower depth of the dike top will have resulted in strongstrain localization at the surface and slip on faults. However,up to 2 m of fault slip was also observed at the northernend of the rift at the onset of the crisis in 1976 yet did notappear to activate surface faults in the central section ofthe rift [Hollingsworth et al., 2012]. If the shallower depthof diking in the central rift leads to more localized surfacestrain during dike injection, the lack of fault slip in 1976implies that the rocks may be relatively stronger in the cen-tral Krafla rift (or weaker in the northern rift). An alternative,and more likely explanation given the probable uniform rock
HOLLINGSWORTH ET AL.: THE 1975–1984 KRAFLA RIFT CRISIS
type throughout the rift, may come from a weakening mech-anism introduced as the dike passes along the rift when thepressure in the dike tip cavity is no longer maintained bymagmatic volatiles [Ziv et al., 2000]. Another possibilityis that a stronger extensional stress at the northern end ofthe rift, compared with the central rift, may have causedmagma to preferentially accumulate in the north, therebypassing through the central rift section without accumulat-ing there; although this hypothesis requires that the magmadoes not freeze while passing through the central rift section.The dike could also have passed through the central rift atgreater depths than at the northern end of the rift, therebyonly activating faults in the north. However, these hypothe-ses require an explanation either for the dike increasing andthen decreasing in depth as it propagates along the rift, orthe northern rift being in a significantly increased state oftensional stress than the central rift.
[42] Our best-fitting fault dips from elastic dislocationmodeling of both the central and northern sections of theKrafla rift range between 40–50ı. Although we do not fullyexplore the range of fault dips using an inversion approach,we generally find that steeper fault dips do not produceenough horizontal extension to match the aerial photo andKH9-SPOT5 correlation data. Although these angles areless than the theoretical 60ı for normal fault initiation, aspredicted by Mohr-Coulomb faulting theory, they are con-sistent with the average dip of normal faulting earthquakesfrom oceanic spreading centers [Thatcher and Hill, 1995].Possible explanations for these lower angles may includereactivation of 45ı normal faults formed above dike injec-tions as new oceanic crust is created, and relatively lowcoefficients of friction within spreading centers. Therefore,as oceanic crust migrates away from spreading centers withtime, through repeated dike injection, a pervasive structuralweakness is produced (oriented �45ı), which is exploitedin future earthquakes [e.g. Thatcher and Hill, 1995]. Never-theless, for large strains, the theories of rigid-plasticity andelasto-plasticity both predict normal fault dips of 45–50ı
above a vertical dike [Gerbault et al., 1998].
5.3. Contribution of Aseismic and Seismic Deformation[43] The only significant earthquake of the Krafla cri-
sis occurred at the northern end of the rift on 13 January1976 (Mw 6.3; see Figure 1c). Although the depth of thisearthquake is not well constrained by the NEIC and GlobalCMT catalogs, the depths of post-1990 microearthquakessurrounding the 1976 epicenter [Einarsson, 1991;Rögnvaldsson et al., 1998] range from from 3 to 15 km[as detected by the South Iceland Lowland (SIL) seismicnetwork; see also Hollingsworth et al., 2012], thereforesuggesting a similar depth for the 1976 event. Studies of themicroseismicity for the wider Tjörnes Fracture Zone regionshow similar earthquake depths, with the majority of eventsoccurring between 3 and 8 km depth [Rögnvaldsson et al.,1998]. Hollingsworth et al. [2012] suggest the CLVD com-ponent of the 1976 focal mechanism (Figure 1c) may resultfrom a volumetric change associated with dike injectionbeneath the northern section of the rift. Provided the dikeopened by more than �3.5 m, and at depths greater than orequal to 3 km, normal faults would be expected to local-ize above the dike, reaching the surface in a 5–6 km widerift zone. This value is consistent with field and geodetic
measurements of surface deformation covering the earlystages of the Krafla crisis, which indicate slip on normalfaults in the Jökulsá á Fjöllum river delta (Figure 1c), sep-arated by a 5–6 km wide zone of subsidence [Tryggvason,1976; Hollingsworth et al., 2012].
[44] The seismic moment released by the 1976 earth-quake was 3.3�1018 Nm (Global CMT catalog). Additionalearthquakes recorded by the NEIC catalog during the crisis(between 20th December 1975 and 1st October 1984) addsan additional 2.5�1018 Nm (from earthquakes located within10 km of the 80 km long rift zone). Therefore, the total seis-mic moment released during the crisis is �5.8�1018 Nm,which is equivalent to one Mw 6.7 earthquake. The totalgeodetic moment for a dike measuring 70–80 km by 3–4 km,and opening by 4.3–5.4 m, is 2.7–5.2�1019 Nm (assum-ing a rigidity modulus of 30 GPa). The moment releasefrom two faults 70–80 km long, 1–2 km wide, and slipping�4 m is 1.7–3.8�1019 Nm. Therefore, the combined geode-tic moment release from both dike injection and fault slip is4.4–9.0�1019 Nm, equivalent to one Mw 7.0–7.2 earthquake.The seismic moment therefore only accounts for �9% of thetotal geodetic moment. Similar values of 8% were obtainedfor the 1978 Asal rift crisis [Stein et al., 1991], and 10% forthe 2005 dike injection which kick-started the 2005–2009Afar crisis [Grandin et al., 2009].
5.4. Schematic Model of the Krafla Crisisand Longer-Term Rifting
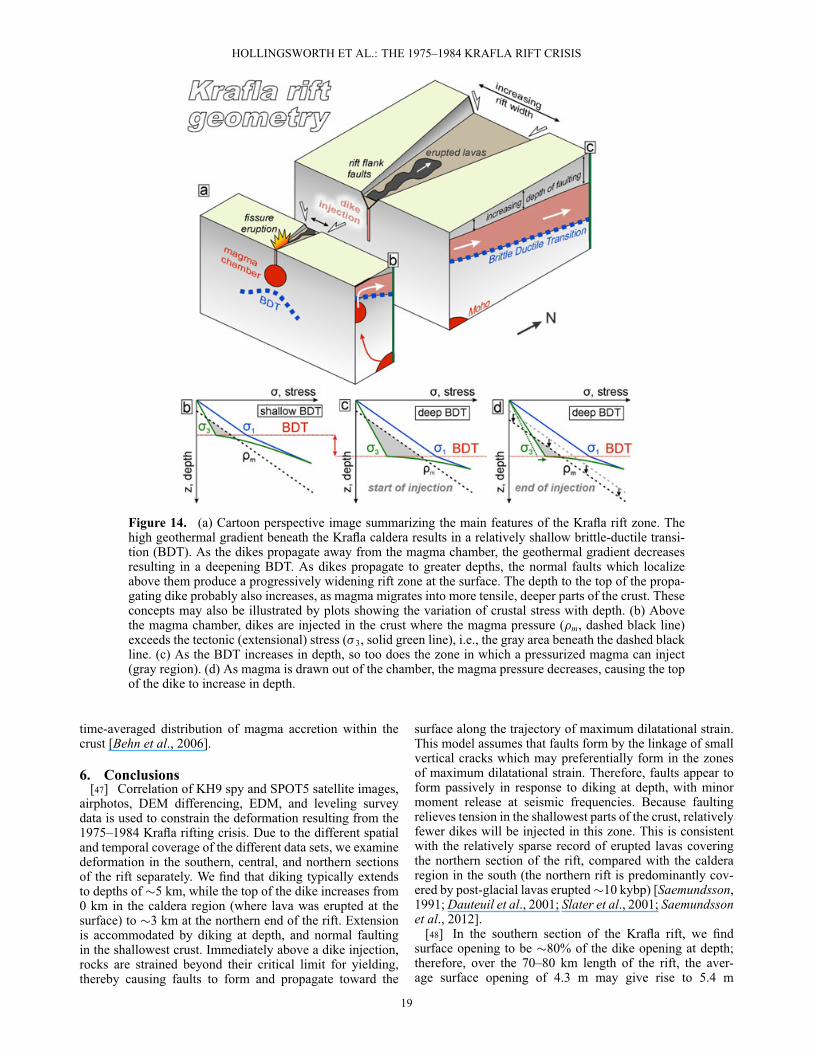
[45] Figure 14a shows a cartoon illustration of the possi-ble structure of the Krafla rift zone, based on the findingsof this paper. Beneath the Krafla caldera, the high geother-mal gradient results in a shallow brittle-ductile transition(BDT; Figure 14b) [see also Grandin et al., 2012]. Dikesare injected in the depth range where the magma pressureexceeds the horizontal/tectonic stress (� 3). As the dike prop-agates along the rift, the decreasing geothermal gradientcauses the BDT to increase in depth (Figure 14c). As theBDT depth increases, so too does the difference between thetectonic stress (� 3) and lithostatic stress (� 1), thus causingthe base of the propagating dike to increase in depth. Further-more, with continued dike propagation, the magma pressure(�m) decreases as magma is removed from the chamber, forc-ing the top of the dike to increase in depth (Figure 14d).These two effects work in tandem, thereby resulting in thegradual deepening of laterally propagating dikes away fromthe magma chamber. Evidence for this effect can be seenat the surface, as the width of the Krafla rift zone increasesaway from the caldera region (Figure 1c). This hypothesisassumes minor overlap between dikes and faults.
[46] Topography is also thought to control the geom-etry of diking and faulting in rift zones over geologicaltimescales [Behn et al., 2006]. As dikes propagate to greaterdepths with distance from the magma chamber, the nor-mal faults above them become correspondingly larger. Thiscreates greater rift flank topography which leads to flexu-ral compression in the base of the crust beneath the rift,thus forcing dikes closer to the surface [Behn et al., 2006].Shallow dikes produce smaller faults, which reduce thecreation of rift flank topography. Therefore, over geologictimescales, lateral dike injection appears to be a self-limitingprocess whereby dike-generated faulting and topographyresult in an efficient feedback mechanism that controls the
HOLLINGSWORTH ET AL.: THE 1975–1984 KRAFLA RIFT CRISIS
Figure 14. (a) Cartoon perspective image summarizing the main features of the Krafla rift zone. Thehigh geothermal gradient beneath the Krafla caldera results in a relatively shallow brittle-ductile transi-tion (BDT). As the dikes propagate away from the magma chamber, the geothermal gradient decreasesresulting in a deepening BDT. As dikes propagate to greater depths, the normal faults which localizeabove them produce a progressively widening rift zone at the surface. The depth to the top of the propa-gating dike probably also increases, as magma migrates into more tensile, deeper parts of the crust. Theseconcepts may also be illustrated by plots showing the variation of crustal stress with depth. (b) Abovethe magma chamber, dikes are injected in the crust where the magma pressure (�m, dashed black line)exceeds the tectonic (extensional) stress (� 3, solid green line), i.e., the gray area beneath the dashed blackline. (c) As the BDT increases in depth, so too does the zone in which a pressurized magma can inject(gray region). (d) As magma is drawn out of the chamber, the magma pressure decreases, causing the topof the dike to increase in depth.
time-averaged distribution of magma accretion within thecrust [Behn et al., 2006].
6. Conclusions[47] Correlation of KH9 spy and SPOT5 satellite images,
airphotos, DEM differencing, EDM, and leveling surveydata is used to constrain the deformation resulting from the1975–1984 Krafla rifting crisis. Due to the different spatialand temporal coverage of the different data sets, we examinedeformation in the southern, central, and northern sectionsof the rift separately. We find that diking typically extendsto depths of �5 km, while the top of the dike increases from0 km in the caldera region (where lava was erupted at thesurface) to �3 km at the northern end of the rift. Extensionis accommodated by diking at depth, and normal faultingin the shallowest crust. Immediately above a dike injection,rocks are strained beyond their critical limit for yielding,thereby causing faults to form and propagate toward the
surface along the trajectory of maximum dilatational strain.This model assumes that faults form by the linkage of smallvertical cracks which may preferentially form in the zonesof maximum dilatational strain. Therefore, faults appear toform passively in response to diking at depth, with minormoment release at seismic frequencies. Because faultingrelieves tension in the shallowest parts of the crust, relativelyfewer dikes will be injected in this zone. This is consistentwith the relatively sparse record of erupted lavas coveringthe northern section of the rift, compared with the calderaregion in the south (the northern rift is predominantly cov-ered by post-glacial lavas erupted �10 kybp) [Saemundsson,1991; Dauteuil et al., 2001; Slater et al., 2001; Saemundssonet al., 2012].
[48] In the southern section of the Krafla rift, we findsurface opening to be �80% of the dike opening at depth;therefore, over the 70–80 km length of the rift, the aver-age surface opening of 4.3 m may give rise to 5.4 m
HOLLINGSWORTH ET AL.: THE 1975–1984 KRAFLA RIFT CRISIS
for the average total dike opening. Combining these esti-mates with our estimated depth range for diking (3–4 km),we calculate the geodetic moment released over the entireKrafla crisis, 4.4–9.0�1019 Nm, which is an order of mag-nitude higher than the seismic moment released over thesame time period, �5.8�1018 Nm. The total volume ofmagma added to the Krafla upper crust throughout thecrisis was 1.1–2.1�109 m3 (i.e., the sum of both intrudedand erupted material). This value is remarkably similar tothe volume of magma, �1.4�109 m3, which may havemigrated from 21 km to shallower depths beneath the calderaregion between 1965–71, prior to the onset of the crisis in1975. However, because there is no corresponding signalfor inflation of a shallow magma chamber between 1965and 1971, the pre-rift contraction may simply reflect anerror in the 1965–71 triangulation survey (thus, it is simplycoincidental that the two volumes are similar in magni-tude). However, if diffuse diking and sill injection at deep-to-middle crust depths occurred, with minimal surfacesignal, then it suggests that the Krafla rift crisis may havebegun as early as 1965, with the onset of deep magmamovements before gradually migrating to shallower depths.If this behavior typically precedes all such rifting crises,it suggests that future events may potentially be forecastfrom the detection of deep magma movements in the yearspreceding a crisis.
[49] This study highlights how optical image correla-tion using inexpensive declassified spy satellite and aerialphotography can provide important constraints on the defor-mation field resulting from past earthquake and volcanicevents.
[50] Acknowledgments. Part of this research was funded by theGordon and Betty Moore Foundation through Grant GBM 2808 to theAdvanced Earth Observation Project at Caltech. We also thank the KeckInstitute for Space Studies for financial support. Thora Arnadottir kindlyprovided EDM displacement data for the Krafla rift from 1978 to 1989[Tryggvason, 1991]. Arzan Surazakov provided helpful advice and discus-sion regarding ortho-rectification of KH9 Hexagon data. The decision tolook at displacement in the epipolar perpendicular direction was inspiredby discussions with Renaud Binet. Bjarney Gudbjornsdottir and CarstenKristinsson (National Land Survey of Iceland) were extremely helpfulwith locating and scanning all airphotos used in this study. Tim Smith(USGS contractor working within Earth Resources Observation and Sci-ence, EROS) provided valuable assistance with scanning KH9 spy satelliteimages. This work greatly benefited from detailed reviews by Tim Wrightand an anonymous reviewer. Various aspects of this study benefited fromdiscussions with Raphael Grandin, Mark Simons, Sylvain Barbot, JohnMaclennan, Dan McKenzie, Gilles Peltzer, and Alex Copley. We are grate-ful to Heather Steele and Lisa Christiansen, who helped with orderingimagery and provided GIS support. Various images in this paper werecreated using the public domain Generic Mapping Tools (GMT) soft-ware [Wessel and Smith, 1998]. This is Tectonics Observatory contributionnumber 232.
ReferencesAbdallah, A., V. Courtillot, M. Kasser, A. Le Dain, J. Léipine, B. Robineau,
J. Ruegg, P. Tapponnier, and A. Tarantola (1979), Relevance of Afar seis-micity and volcanism to the mechanics of accreting plate boundaries,Nature, 282, 17–23.
Agnon, A., and V. Lyakhovsky (1995), Damage distribution and localiza-tion during dyke intrusion, in Physics and Chemistry of Dykes, edited byH. Baer, pp. 65–78, Balkema, Rotterdam, Netherlands.
Anderson, K., and P. Segall (2013), Bayesian inversion of data fromeffusive volcanic eruptions using physics-based models: Application toMount St. Helens 2004–2008, J. Geophys. Res., doi:10.1002/jgrb.50169,in press.
Árnadóttir, T., F. Sigmundsson, and P. Delaney (1998), Sources of crustaldeformation associated with the Krafla, Iceland, eruption of September1984, Geophys. Res. Lett., 25(7), 1043–1046.
Árnadóttir, T., B. Lund, W. Jiang, H. Geirsson, H. Björnsson, P. Einarsson,and T. Sigurdsson (2009), Glacial rebound and plate spreading: Resultsfrom the first countrywide GPS observations in Iceland, Geophys. J. Int.,177, 691–716, doi:10.1111/j.1365-246X.2008.04059.x.
Ayoub, F., S. Leprince, and J. Avouac (2009a), Co-registration and correla-tion of aerial photographs for ground deformation measurements, ISPRSJ. Photogramm. Remote Sens., 64(6), 551–560.
Ayoub, F., S. Leprince, and L. Keene (2009b), COSI-CORR User’s Guide.Co-registration of Optically Sensed Images and Correlation, Calif. Inst.of Technol., Pasadena, Calif.
Barisin, I., S. Leprince, B. Parsons, and T. Wright (2009), Surface dis-placements in the September 2005 Afar rifting event from satelliteimage matching: Asymmetric uplift and faulting, Geophys. Res. Lett., 36,L07301, doi:10.1029/2008GL036431.
Behn, M., and G. Ito (2008), Magmatic and tectonic extension at mid-oceanridges: 1. Controls on fault characteristics, Geochem. Geophys. Geosyst.,9, Q08O10, doi:10.1029/2008GC001965.
Behn, M., W. Buck, and I. Sacks (2006), Topographic controls on dikeinjection in volcanic rift zones, Earth Planet. Sci. Lett., 246(3–4),188–196, doi:10.1016/j.epsl.2006.04.005.
Björnsson, A., K. Saemundsson, P. Einarsson, E. Tryggvason, and K.Gronvold (1977), Current rifting episode in North Iceland, Nature, 266,318–323.
Brandsdotttir, B., W. Menke, P. Einarsson, R. White, and R. Staples (1997),Faroe-Iceland ridge experiment 2. Crustal structure of Krafia centralvolcano, J. Geophys. Res., 102, 7867–7886.
Buades, A., B. Coll, and J. Morel (2006), The staircasing effect in neigh-borhood filters and its solution, IEEE Trans. Image Process., 15(6),1499–1505.
Buck, W., L. Lavier, and A. Poliakov (2005), Modes of faulting at mid-ocean ridges, Nature, 434, 719–723.
Buck, W., P. Einarsson, and B. Brandsdóttir (2006), Tectonic stress andmagma chamber size as controls on dike propagation: Constraints fromthe 1975–1984 Krafla rifting episode, J. Geophys. Res., 111, B12404,doi:10.1029/2005JB003879.
Dauteuil, O., J. Angelier, F. Bergerat, S. Verrier, and T. Villemin (2001),Deformation partitioning inside a fissure swarm of the northern Icelandicrift, J. Struct. Geol., 23, 1359–1372.
De Chabalier, J., and J. Avouac (1994), Kinematics of the Asal rift(Djibouti) determined from the deformation of Fieale volcano, Science,265, 1677–1681.
de Zeeuw-van Dalfsen, E., R. Pedersen, F. Sigmundsson, and C. Pagli(2004), Satellite radar interferometry 1993–1999 suggests deep accu-mulation of magma near the crust-mantle boundary at the Krafla vol-canic system, Iceland, Geophys. Res. Lett., 31, L13611, doi:10.1029/2004GL020059.
Einarsson, P. (1991), Earthquakes and present-day tectonism in Iceland,Tectonophysics, 189, 261–279.
Elliott, J., E. Nissen, P. England, J. Jackson, S. Lamb, Z. Li, M. Oehlers,and B. Parsons (2012), Slip in the 2010–2011 Canterbury earthquakes,New Zealand, J. Geophys. Res., 117, B03401, doi:10.1029/2011JB008868.
Ewart, J., B. Voight, and A. Björnsson (1991), Elastic deformation mod-els of Krafla Volcano, Iceland, for the decade 1975 through 1985, Bull.Volcanol., 53, 436–459.
Fialko, Y., D. Sandwell, M. Simons, and P. Rosen (2005), Three-dimensional deformation caused by the Bam, Iran, earthquake andthe origin of shallow slip deficit, Nature, 435, 295–299, doi:10.1038/nature03425.
Gerbault, M., A. Poliakov, and M. Daignieres (1998), Prediction of fault-ing from the theories of elasticity and plasticity: What are the limits?J. Struct. Geol., 20(2–3), 301–320.
Goossens, B., H. Luong, A. Pizurica, and W. Philips (2008), An improvednon-local denoising algorithm, in Proceedings of the 2008 InternationalWorkshop on Local and Non-Local Approximation in Image Process-ing, edited by J. Astola, K. Egiazarian, and V. Katkovnik, pp. 143–156,Lausanne, Switzerland.
Grandin, R., A. Socquet, M.-P. Doin, E. Jacques, J.-B. de Chabalier, andG. King (2010), Transient rift opening in response to multiple dikeinjections in the Manda Hararo rift (Afar, Ethiopia) imaged by time-dependent elastic inversion of interferometric synthetic aperture radardata, J. Geophys. Res., 115, B09403, doi:10.1029/2009JB006883.
Grandin, R., A. Socquet, C. Doubre, E. Jacques, and G. King (2012), Elasticthickness control of lateral dyke intrusion at mid-ocean ridges, EarthPlanet. Sci. Lett., 319–320, 83–95.
Grandin, R., et al. (2009), September 2005 Manda Hararo-Dabbahu riftingevent, Afar (Ethiopia): Constraints provided by geodetic data, J. Geo-phys. Res., 114, B08404, doi:10.1029/2008JB005843.
Hamling, I., A. Ayele, L. Bennati, E. Calais, C. Ebinger, D. Keir, E. Lewi,T. Wright, and G. Yirgu (2009), Geodetic observations of the ongoing
HOLLINGSWORTH ET AL.: THE 1975–1984 KRAFLA RIFT CRISIS
Dabbahu rifting episode: New dyke intrusions in 2006 and 2007,Geophys. J. Int., 178, 989–1003.
Hamling, I., T. Wright, E. Calais, L. Bennati, and E. Lewi (2010), Stresstransfer between thirteen successive dyke intrusions in Ethiopia, Nat.Geosci., 3, 713–717.
Harris, A., J. Murray, S. Aries, M. Davies, L. Flynn, M. Wooster, R. Wright,and D. Rothery (2000), Effusion rate trends at Etna and Krafla and theirimplications for eruptive mechanisms, J. Volcanol. Geotherm. Res., 102,237–270.
Hollingsworth, J., S. Leprince, F. Ayoub, and J. Avouac (2012), Deforma-tion during the 1975–1984 Krafla rifting crisis, NE Iceland, measuredfrom historical optical imagery, J. Geophys. Res., 117, B11407,doi:10.1029/2012JB009140.
Ito, G., and M. Behn (2008), Magmatic and tectonic extension at mid-oceanridges: 2. Origin of axial morphology, Geochem. Geophys. Geosyst., 9,Q09O12, doi:10.1029/2008GC001970.
Leprince, S., F. Ayoub, Y. Klinger, and J.-P. Avouac (2007a), Co-registration of optically sensed images and correlation (COSI-Corr): Anoperational methodology for ground deformation measurements, in Inter-national Geoscience and Remote Sensing Symposium (IGARSS), vol. 6,pp. 2700–2702, IEEE International, Barcelona, Spain.
Leprince, S., S. Barbot, F. Ayoub, and J.-P. Avouac (2007b), Orthorec-tification, coregistration, and subpixel correlation of satellite images,application to ground deformation measurements, IEEE Trans. Geosci.Remote Sens., 45(6), 1529–1558.
Leprince, S., E. Berthier, F. Ayoub, C. Delacourt, and J. Avouac (2008),Monitoring earth surface dynamics with optical imagery, Eos Trans.AGU, 89(1), 1–2.
Manighetti, I., M. Campillo, C. Sammis, M. Mai, and G. King (2005),Evidence for self-similar, triangular slip distributions on earthquakes:Implications on earthquake and fault mechanics, J. Geophys. Res., 110,B05302, doi:10.1029/2004JB003174.
Mastin, L., and D. Pollard (1988), Surface deformation and shallow dikeintrusion processes at Inyo Craters, Long Valley, California, J. Geophys.Res., 93(B11), 13,221–13,235.
Mogi, K. (1958), Relations between the eruptions of various volcanoes andthe deformation of the ground surface around them, Bull. EarthquakeRes. Inst., 36, 99–134.
Ofeigsson, B., A. Hooper, F. Sigmundsson, E. Sturkell, and R. Grapenthin(2011), Deep magma storage at Hekla volcano, Iceland, revealedby InSAR time series analysis, J. Geophys. Res., 116, B05401,doi:10.1029/2010JB007576.
Okada, Y. (1985), Surface deformations due to shear and tensile faults in ahalf-space, Bull. Seismol. Soc. Am., 75, 1135–1154.
Okada, Y. (1992), Internal deformation due to shear and tensile faults in ahalf-space, Bull. Seismol. Soc. Am., 82(2), 1018–1040.
Pinzuti, P., A. Mignan, and G. King (2010), Surface morphology of activenormal faults in hard rock: Implications for the mechanics of the AsalRift, Djibouti, Earth Planet. Sci. Lett., 299, 169–179.
Rivalta, E., and P. Segall (2008), Magma compressibility and the miss-ing source for some dike intrusions, Geophys. Res. Lett., 35, L04306,doi:10.1029/2007GL032521.
Rögnvaldsson, S., A. Gudmundsson, and R. Slunga (1998), Seismotectonicanalysis of the Tjörnes Fracture Zone, an active transform fault in northIceland, J. Geophys. Res., 103(B12), 30,117–30,129.
Rubin, A. (1992), Dike-induced faulting and graben subsidence in volcanicrift zones, J. Geophys. Res., 97(B2), 1839–1858.
Rubin, A., and D. Pollard (1988), Dike-induced faulting in rift zones ofIceland and Afar, Geology, 16, 413–417.
Saemundsson, K. (1991), Náttúra aslands, pp. 25–95, Jardfraedi Krofluk-erfisins [The Geology of the Krafla volcanic System], Hid aslenskaNatturufraedifelag, Reykjavik, Iceland.
Saemundsson, K., A. Hjartarson, I. Kaldal, M. Sigurgeirsson, S.Kristinsson, and S. Víkingsson (2012), Geological Map of the NorthernVolcanic Zone, Iceland. Nothern Part 1:100 000, Iceland GeoSurvey andLandsvirkjun, Reykjavik, Iceland.
Schultz, R. (1995), Limits on strength and deformation properties of jointedbasaltic rock masses, Rock Mech. Rock Eng., 28(1), 1–15.
Sigmundsson, F. (2006), Iceland Geodynamics: Crustal Deformation andDivergent Plate Tectonics, 209 pp., Springer, Chichester, U. K.
Sigurdsson, O. (1980), Surface deformation of the Krafla fissure swarm intwo rifting events, J. Geophys., 47, 154–159.
Simons, M., Y. Fialko, and L. Rivera (2002), Coseismic deformationfrom the 1999 Mw 7.1 Hector Mine, California, earthquake as inferredfrom InSAR and GPS observations, Bull. Seismol. Soc. Am., 92,1390–1402.
Slater, L., D. McKeznie, K. Grönvold, and N. Shimizu (2001), Melt gener-ation and movement beneath Theistareykir, NE Iceland, J. Petrol., 42(2),321–354, doi:10.1093/petrology/42.2.321.
Staples, R., R. White, B. Brandsdotttir, W. Menke, P. Maguire, and J.McBride (1997), Färoe-Iceland Ridge Experiment 1. Crustal structure ofnortheastern Iceland, J. Geophys. Res., 102(B4), 7849–7866.
Stein, R., P. Briole, J. Ruegg, P. Tapponnier, and F. Gasse (1991), Contem-porary, Holocene, and Quaternary deformation of the Asal Rift, Djibouti:Implications for the mechanics of slow spreading ridges, J. Geophys.Res., 96(B13), 21,789–21,806.
Sudhaus, H., and S. Jónsson (2011), Source model for the 1997 Zirkuhearthquake (Mw = 7.2) in Iran derived from JERS and ERS InSARobservations, Geophys. J. Int., 185, 676–692.
Tarantola, A. (2004), Inverse Problem Theory and Methods for ModelParameter Estimation, 1st ed., SIAM: Society for Industrial and AppliedMathematics, Philadelphia, Pa.
Thatcher, W., and D. Hill (1995), A simple model for the fault-generatedmorphology of slow-spreading mid-ocean ridges, J. Geophys. Res., 100,561–570.
Tryggvason, E. (1976), Ground movement in North Iceland during theearthquake swarm of 1975-1976 (in Icelandic, with English summary),Náttúrufraedingurinn, 46, 124–128.
Tryggvason, E. (1984), Widening of the Krafla fissure swarm dur-ing the 1975–1981 volcano-tectonic episode, Bull. Volcanol., 47(1),47–69.
Tryggvason, E. (1991), Magnitude of deformation of active volcanoes inIceland, Cahiers du Centre européen de géodynamique et de séismologie,4, 37–49.
Tryggvason, E. (1994), Surface deformation at the Krafla volcano,North Iceland, 1982–1992, Bull. Volcanol., 2, 98–107, doi:10.1007/BF00304105.
Wendt, K., D. Möller, and B. Ritter (1985), Geodetic measurementsof surface deformations during the present rifting episode in NEIceland, J. Geophys. Res., 90(B12), 10,163–10,172, doi:10.1029/jb090ib12p10163.
Wessel, P., and W. H. F. Smith (1998), New, improved version of genericmapping tools released, Eos Trans. AGU, 79(47), 579.
Wolf, P., B. DeWitt, and B. Wilkinson (2000), Elements of PhotogrammetryWith Application in GIS, 608 pp. 3rd ed., McGraw-Hill, New York.
Wright, T., C. Ebinger, J. Biggs, A. Ayele, G. Yirgu, D. Keir, and A. Stork(2006), Magma-maintained rift segmentation at continental rupture in the2005 Afar dyking episode, Nature, 442, 291–294.
Wright, T. et al. (2012), Geophysical constraints on the dynamics ofspreading centres from rifting episodes on land, Nat. Geosci., 5,242–250.
Ziv, A., A. Rubin, and A. Agnon (2000), Stability of dike intrusion alongpreexisting fractures, J. Geophys. Res., 105, 5947–5961.