Performance Measures For The Quarter Ending June 30, 2011 Written and compiled by: The Division of Transportation System Information Office of Strategic Planning and Performance Measurement 1120 N St. Sacramento, CA 95814
Transcript
Performance Measures For The Quarter Ending
June 30, 2011
Written and compiled by:
The Division of Transportation System Information
Office of Strategic Planning and Performance Measurement
1120 N St. Sacramento, CA 95814
Caltrans Performance Measures For The Quarter Ending June 30, 2011
______________________________________________________________________________________________________________ - ii -
TABLE OF CONTENTS
TABLE OF CONTENTS…………………………………………………………………………….
ii
OVERVIEW…....…………………………………………….…………………………….…….…
1
UPDATES SINCE LAST QUARTER..……..………………………………..……………………….
2
WEB SITE AND CONTACT………..………….………..…………………………………………..
Caltrans Performance Measures For The Quarter Ending June 30, 2011
______________________________________________________________________________________________________________ - iii -
OBJECTIVE 3.3 PURPOSE AND NEED OF PROJECTS……....……………………… 22OBJECTIVE 3.4 PROJECT CONSTRUCTION COSTS……..………………………… 22OBJECTIVE 3.5 LOW BIDS VS. ENGINEER’S ESTIMATES…………………………
SERVICE OBJECTIVE 5.1 EMPLOYEE ATTRITION RATE……………………………………… 31OBJECTIVE 5.2 COMPLIANCE WITH RESPONSE TIMES AND MILESTONES.………. 31OBJECTIVE 5.3 EMPLOYEES ARE ENCOURAGED TO TRY NEW IDEAS………….. 32OBJECTIVE 5.4 SATISFACTION OF EXTERNAL STAKEHOLDERS….……………… 33OBJECTIVE 5.5 ADEQUACY OF TRAINING FOR EMPLOYEES.....…………………. 34OBJECTIVE 5.6 MANAGEMENT-EMPLOYEE COMMUNICATIONS….………………. 35OBJECTIVE 5.7 EMPLOYEES’ SATISFACTION WITH JOB TOOLS.…………..…… 35OBJECTIVE 5.8 JOB OFFERS ACCEPTED BY FIRST-CHOICE CANDIDATES…....… 36
Overview Since 2005, the California Department of Transportation (Caltrans) has been reporting a select set of performance measures to the Business, Transportation and Housing Agency (BTH) on a quarterly basis. The quarterly reports submitted to the BTH include the "vital few" performance measures (represented in this report by the Key Dashboard Indicators) that Caltrans has identified to reflect the goals and objectives in 2007-2012 Caltrans’ Strategic Plan. Other performance measures were also developed to guide Caltrans in its efforts to implement its five-year Strategic Plan. This report provides these additional performance measures along with the "vital few" previously reported to the BTH. The performance measures reported herein align with the current objectives identified in the Strategic Plan. The objectives were set by the Caltrans Strategic Planning Work Group based on each measure’s historical trend and baseline data presented during the development of the Strategic Plan. The baseline for each measure was generally established using the data available during the spring of 2007. In addition to being an excellent tool for reporting Caltrans performance, this report is also a resource to guide management in decision making. The information contained within this report is an indication of past management decisions. The overall goal of this report is to provide managers critical information on performance so that future decisions will improve Caltrans performance. This report consists of two major sections. The first section presents the key dashboard indicators for the performance measures that are identified in the Strategic Plan. For a quick glimpse of the current status of the measures relative to their respective goals, current data and targets are depicted in the form of gauges on a dashboard to represent the progress of the respective measures. The second section provides a series of data points spanning over multiple quarters, calendar years or fiscal years. The series of data points are presented in graphical charts to track the trends and monitor the progress of the specific measures, so that appropriate adjustments can be made en route to achieving the strategic goals and objectives. The performance measures presented in this report are generally compiled from the information provided by various Caltrans divisions or offices that collected data for their respective areas of responsibilities, as well as data compiled from external sources. The data sources are credited on the respective graphical charts and where applicable, any additional resources are also indicated in the footnotes for the specific measures. All the graphs and charts that are presented in Section 2 of this report were created and designed based on the data compiled from various sources.
Caltrans Performance Measures For The Quarter Ending June 30, 2011
This report includes a total of 55 performance measures to support the goals and objectives that are identified in the 2007-2012 Caltrans’ Strategic Plan. There are three measures that are currently in various stages of data collection process and the status of each of these measures is reported herein. There are 31 measures that have updated data for this quarter since they were previously reported in the last quarter. These updates are reflected in the revised charts and/or are indicated in the footnotes (or in the comments column for the dashboard gauges). Highlights include meeting and/or exceeding targets or trending positively in:
PM 2.1c - Percent of good (operating) detectors (overall);
PM 2.3b - Total Train and Bus Revenue;
PM 3.2a - Project Approval and Environmental Documents (PA/ED) – percent of projects;
PM 3.2e - Cooperative Agreements – percent executed within 60 days of Headquarters’ approval;
PM 3.4a - Total construction costs of projects at Proposed Final Estimate (PFE) as a percentage of total original contract allotment;
PM 4.2b - Timely use of funds;
PM 4.2c - Percent of invoices issued to individuals or entities that owe the Department money prepared within 30 calendar days of receipt of documentation;
PM 4.2d - Percent of total payments made to vendors and other government agencies within the time limits imposed by the Prompt Payment Act or as specified in the contract;
PM 4.5 - Percent of parcels identified in the Excess Land Disposal Plan and disposed of (on target);
PM 4.7c - Percent of the tort in which Legal Division obtains favorable results;
PM 4.7d - Percent of external audits identified in the annual service plan that are completed.
PM 5.2a - Request for Authorization to Proceed packages submitted by local agencies that are reviewed and processed by Caltrans and are ready for submittal to FHWA;
Those measures which did not meet their targets this quarter include;
PM 1.2 - Number of work-related fatalities in a calendar year;
PM 1.3 - Worker Incident Rate - Work-related injuries and illnesses in previous 12 months;
PM 2.2b - Percent of major incidents cleared in less than 90 minutes;
PM 2.4b - Percent of available funds used for Mass Transportation projects that pass through Caltrans to local recipients;
Highlights of This Quarter’s Achievements
Caltrans Performance Measures For The Quarter Ending June 30, 2011
PM 3.2b - Right of Way (R/W) Certification – percent of projects;
PM 3.2c - Ready to List (RTL) – Percent of projects.;
PM 3.2d - Construction Contract Acceptance (CCA) – percent of projects;
PM 3.5a - Percent difference between total low bids and total of all engineer’s estimates;
PM 3.5b - Percent of projects with low bid > 110% of Engineer's Estimate;
PM 3.5b - Percent of projects with low bid within +/- 10% of engineer’s estimate;
PM 4.1a - Pavement Condition – Percent of distressed lane miles;
PM 4.2a - Percent of federal subvention formula funds obligated for local projects (on/off State highway system);
PM 4.2c - Percent of invoices issued to individuals or entities that owe the Department money prepared within 30 calendar days of receipt of documentation;
PM 4.2e - Percent of employee payments processed within 10 working days of receipt of Travel Expense Claim (TEC) by Accounting;
PM 4.6 - Percent of facilities with critical infrastructure deficiencies remediated;
PM 4.7a - Percentage of equipment that is available to the user (fleet uptime);
PM 4.7c - Percent of the eminent domain and contract cases in which Legal Division obtains favorable results;
PM 4.7e - Percent of mandated audits that are completed (Missed goal by 0.1 %);
PM 5.1 - Employee Attrition Rate;
PM 5.2b - Percent of encroachment permits approved within the statutory 60-day limit; and,
PM 5.8 - Percent of first-choice candidates that accept the Department’s entry-level job offers.
Measures under development or where data is not yet available include:
PM 2.1e - Percent detection coverage in urban areas;
PM 2.2a - Travel Time Reliability on selected corridors in California; and,
PM 3.3a - Percent of projects that meet their approved purpose and need at project completion.
The measures with annual or biennial data collection cycles will be updated as the latest data becomes available. For those annual measures that are reported by fiscal year (FY), FY refers to the fiscal year for the State of California which starts on July 1 and ends on June 30 of the following year, unless indicated otherwise (e.g. FFY refers to a federal fiscal year which begins October 1 and ends September 30).
Caltrans Performance Measures For The Quarter Ending June 30, 2011
Updates The Office of Strategic Planning and Performance Measurement (OSPPM) is continuing to make revisions to the Quarterly Performance Report. This is an ongoing effort in response to survey feedback (http://www.dot.ca.gov/quarterlyreportsurvey.php), management needs, and general report improvements. If there are any comments or suggestions for improvements to the Quarterly Report, please visit the survey link above or contact OSPPM by sending an e-mail to Steve Guenther, [email protected]. This quarter, Measure 3.1b - Percent Functional Indirect Cost Rate Proposal (ICRP) has been removed upon request by Project Delivery management. It was determined that this was not an effective measure for Project Delivery to report on a quarterly basis. Measure 3.5a - Percent difference between total low bids and total engineer’s estimates has also been removed. It was determined that the measure should be removed because it represents a blending of all bids proposals and does not accurately represent the information the Department wishes to convey.
The most current report of Caltrans’ Performance Measures is posted on the Caltrans Internet home page, (http://www.dot.ca.gov/) under “Highlights” the link to the document is titled “Latest Report of Caltrans’ Performance Measures”. In an effort to continually improve the performance report, a link to a short survey has been added below the document link. Caltrans’ performance report for the quarter ending December 2007 was the first edition made available to the public and it was published on the Internet in March 2008. Previous editions of the performance report will continue to be available for download on the Internet, at http://www.dot.ca.gov/perf/. Caltrans’ performance reports from earlier quarters and fiscal years (including earlier internal editions) are available on the Office of Strategic Planning and Performance Measurement (OSPPM) Intranet site, at http://onramp.dot.ca.gov/hq/osppm/ (note that this Intranet site is only accessible from within Caltrans’ internal network). To report any deficiency in the graphical representation of the data, or any questions or concerns about the performance measures reported herein, please contact the Office of Strategic Planning and Performance Measurement by sending an e-mail to Steve Guenther, [email protected].
Web Site and Contact
Caltrans Performance Measures For The Quarter Ending June 30, 2011
Only the most updated data for key dashboard indicators are shown in Section 1 of this report. For more comprehensive details of these indicators and other performance measures, please refer to Section 2 of this report. Due to software changes, the key indicators in Section 1 are temporarily being represented by green and red arrows. In most cases, the current data represents the latest information available for the quarter. However, some of the data are only collected and reported on an annual basis (by calendar year or fiscal year). For these annual measures, the gauges will only be updated once a year and no quarterly updates will be reported.
Section 1: Key Dashboard Indicators
Caltrans Performance Measures For The Quarter Ending June 30, 2011
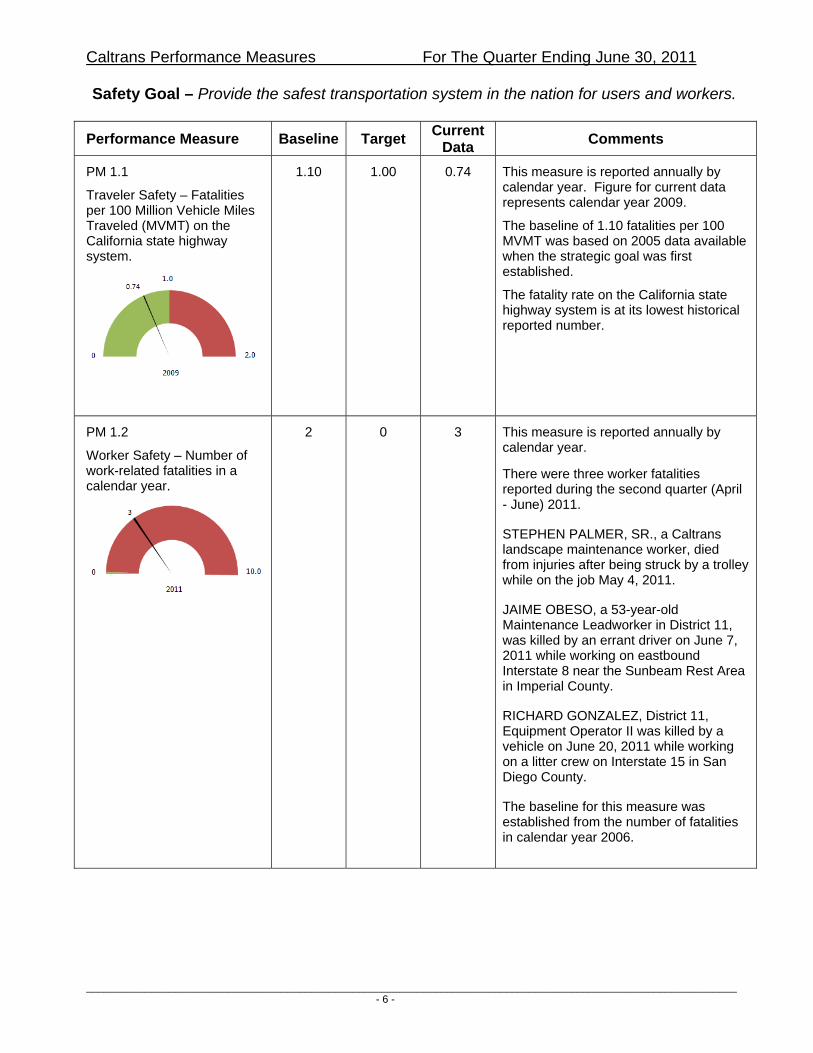
Safety Goal – Provide the safest transportation system in the nation for users and workers.
Performance Measure Baseline Target Current
Data Comments
PM 1.1
Traveler Safety – Fatalities per 100 Million Vehicle Miles Traveled (MVMT) on the California state highway system.
1.10
1.00
0.74
This measure is reported annually by calendar year. Figure for current data represents calendar year 2009.
The baseline of 1.10 fatalities per 100 MVMT was based on 2005 data available when the strategic goal was first established.
The fatality rate on the California state highway system is at its lowest historical reported number.
PM 1.2
Worker Safety – Number of work-related fatalities in a calendar year.
2 0 3 This measure is reported annually by calendar year.
There were three worker fatalities reported during the second quarter (April - June) 2011.
STEPHEN PALMER, SR., a Caltrans landscape maintenance worker, died from injuries after being struck by a trolley while on the job May 4, 2011.
JAIME OBESO, a 53-year-old Maintenance Leadworker in District 11, was killed by an errant driver on June 7, 2011 while working on eastbound Interstate 8 near the Sunbeam Rest Area in Imperial County.
RICHARD GONZALEZ, District 11, Equipment Operator II was killed by a vehicle on June 20, 2011 while working on a litter crew on Interstate 15 in San Diego County.
The baseline for this measure was established from the number of fatalities in calendar year 2006.
Caltrans Performance Measures For The Quarter Ending June 30, 2011
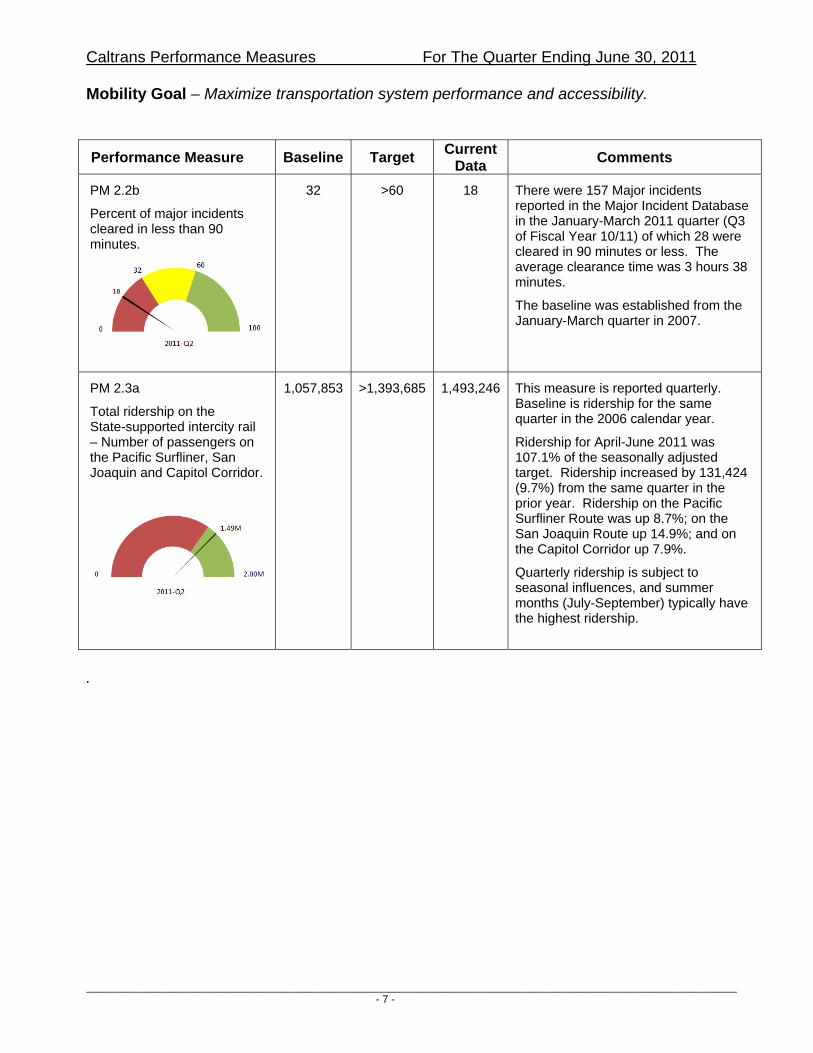
Mobility Goal – Maximize transportation system performance and accessibility.
.
Performance Measure Baseline Target Current
Data Comments
PM 2.2b
Percent of major incidents cleared in less than 90 minutes.
32 >60 18 There were 157 Major incidents reported in the Major Incident Database in the January-March 2011 quarter (Q3 of Fiscal Year 10/11) of which 28 were cleared in 90 minutes or less. The average clearance time was 3 hours 38 minutes.
The baseline was established from the January-March quarter in 2007.
PM 2.3a
Total ridership on the State-supported intercity rail – Number of passengers on the Pacific Surfliner, San Joaquin and Capitol Corridor.
1,057,853 >1,393,685
1,493,246 This measure is reported quarterly. Baseline is ridership for the same quarter in the 2006 calendar year.
Ridership for April-June 2011 was 107.1% of the seasonally adjusted target. Ridership increased by 131,424 (9.7%) from the same quarter in the prior year. Ridership on the Pacific Surfliner Route was up 8.7%; on the San Joaquin Route up 14.9%; and on the Capitol Corridor up 7.9%.
Quarterly ridership is subject to seasonal influences, and summer months (July-September) typically have the highest ridership.
Caltrans Performance Measures For The Quarter Ending June 30, 2011
Delivery Goal – Efficiently deliver quality transportation projects and services.
Performance Measure Baseline Target Current Data
Comments
PM 3.2a
Project Approval and Environmental Document (PA/ED)1 – Percent of projects.
93
>90 93 This measure is reported quarterly. Baseline is the fourth quarter data for FY 2005/06.
The percentage represents delivery of 137 of 147 planned milestones through the fourth quarter of FY 2010/2011.
Based on analysis by management, the target has been adjusted from 100% to 90%.
PM 3.2b
Right of Way (R/W) Certification2 – Percent of projects.
99
100 99 This measure is reported quarterly. Baseline is the fourth quarter data for FY 2005/06.
The percentages represent delivery of 309 of 311 planned milestones through the fourth quarter of FY 2010/2011.
PM 3.2c
Ready to List (RTL)3 – Percent of projects.
99
100 94 This measure is reported quarterly. Baseline is the fourth quarter data for FY 2005/06.
The percentages represent delivery of 342 of 346 planned milestones through the fourth quarter of FY 2010/2011.
PM 3.2d
Construction Contract Acceptance (CCA)4 – Percent of projects.
88 100 87 This measure is reported quarterly. Baseline is the fourth quarter data for FY 2005/06.
The percentages represent delivery of 187 of 216 planned milestones through the fourth quarter of FY 2010/2011.
Notes: 1. The PA/ED milestone represents completion of preliminary engineering and environmental analyses and investigations for the project
alternatives under investigation, as required by the National Environmental Policy Act (NEPA) and the California Environmental Quality Act (CEQA); state and federal approval of a final Environmental Document (if required); selection of a preferred alternative; and approval of the selected project through the Project Report.
2. At the R/W Certification milestone, certification is made that all R/W activities (i.e., appraisals, acquisitions, relocation assistance, utility coordination, etc.) have been completed in accordance with the Code of Federal Regulations, per 23 CFR 635.309(c)(1), (2), or (3).
3. The RTL milestone is a point at which projects are ready to be advertised to attract bids from the contractors. 4. CCA means that all construction project work has been completed in accordance with all the requirements of the contract. 5. Current data represents the percent of projects that met the planned delivery milestones for capital projects. Actual delivery compared
to the planned delivery through the fiscal year quarter.
Caltrans Performance Measures For The Quarter Ending June 30, 2011
Delivery Goal – Efficiently deliver quality transportation projects and services.
Performance Measure Baseline Target Current
Data Comments
Delivery milestones for capital projects. Current data represents the percent of projects that met the planned delivery milestones.
Actual delivery compared to the planned delivery through the fiscal year quarter.
PM 3.2e
Cooperative agreements – Percent executed within 60 days of Headquarters' approval.
40
>80 81
This measure is reported quarterly. Baseline reflects the percent of cooperative agreements in FY 2006/07 that were executed within 60 days of Headquarters' approval. Out of a total of 87 agreements developed from April 1, 2011 through June 30, 2011, and measured according to the 60-day performance criteria, 52 agreements (or 81%) were developed within 60 days or less, while 12 agreements (or 19%) took longer than 60 days to develop.
PM 3.5b
Percent of projects with low bid within ±10% of engineer's estimate.
33.5 >50 38.4 For FY 2010/11 Q4 low bids for 236 of 614 projects were within +/- 10% of the engineer's estimate. Low bids for 496 of 614 projects were >110% of the engineer's estimate.
Target is at least 50% of the projects have a low bid within ±10% of the engineer’s estimate.
Baseline reflects the cumulative data for FY 2005/06.
Caltrans Performance Measures For The Quarter Ending June 30, 2011
Stewardship Goal – Preserve and enhance California's resources and assets.
Performance Measure Baseline Target Current
Data Comments
PM 4.1a
Pavement condition – Percent of distressed lane miles.
28 <30 26 This measure is reported annually by calendar year. Baseline represents data for calendar year 2005 and current data reflects calendar year 2007. Percent of distressed lane miles has decreased from 28% in 2005 to 26% in 2007. The 2009 survey did not collect data for the entire system (only the NHS) and one of the distress types (faulting) was not collected.
PM 4.2a
Federal subvention formula funds obligated for local projects (on/off State highway system) – Percent of funds obligated.
100
100 104 This measure is reported annually by federal fiscal year (FFY), with a target of obligating 100% of available funds at the end of the FFY. Available funds are based on projection at the beginning of FFY. Baseline is the obligational authority (OA) for local projects used by the State of California in FFY 2006. Local Assistance delivered 100% of the available $1.2 billion of FFY 2010 Formula OA. In addition, Local Assistance delivered 100% of the additional $44 million of August Redistribution Formula OA provided to Local Assistance.
PM 4.2d
Percent of total payments made to vendors and other government agencies within the time limits imposed by the Prompt Payment Act or as specified in the contract.
99
>99 99.7 Baseline was established from the second quarter of 2006. . In the 4th quarter of 2010/11, 99.68% (243,335 of 244,107) of vendor invoice payments were made timely.
Caltrans Performance Measures For The Quarter Ending June 30, 2011
Service Goal – Promote quality service through an excellent workforce.
Performance Measure Baseline Target Current
Data Comments
PM 5.2a
"Request for Authorization to Proceed" packages submitted by local agencies that are reviewed and processed by Caltrans and are ready for submittal to Federal Highway Administration (FHWA) – Percent processed within 30 days of receiving the complete and accurate request.
93 100 100 This measure is reported quarterly. The baseline was established using the quarterly data reported for January-March 2008. FFY Q3 2011 (April - June) represents a 7% increase from the prior quarter, which was 93%.
Prior to beginning work on the federal-aid highway system for which federal reimbursement will be sought, a local agency must receive federal "Authorization to Proceed" from the FHWA. This performance measure indentifies the percentage of complete and accurate "Request for Authorization to Proceed" that are received, reviewed and processed by Caltrans within 30 days.
PM 5.4a
Percent of external survey respondents who said Caltrans was doing a good or excellent job.
User Survey:
User Survey:
53
User Survey:
>61
User Survey:
55
Due to budget constraints, there has not been an external stakeholder survey since 2007.
Baseline of 53% for user survey was based on the 2001 Caltrans External Customer Survey – Telephone Survey (quantitative results were compiled from user survey, but only qualitative results were available from stakeholder survey). There was no comparable survey question in the 2005 external customer survey. The target is to increase by 15% (or 115% from the baseline) the percentage of external customers who are satisfied with Caltrans services.
Figures for current data represent overall results from the 2007 External Survey of Transportation Users and Stakeholders. For the stakeholder survey, since no quantitative data was available when the target was originally set, the 2007 survey result established the baseline.
Stakeholder Survey:
Stakeholder Survey:
68
Stakeholder Survey:
>78
Stakeholder Survey:
68
Caltrans Performance Measures For The Quarter Ending June 30, 2011
This section presents the data points for each performance measure as a series of line graphs or bar charts spanning over multiple reporting cycles. The reporting cycles for each measure may be in terms of quarters, calendar years or fiscal years, as applicable to each specific measure. For those measures with annual (or biennial) data collection, the graphical charts will only be updated annually (or biennially) and no quarterly updates will be provided. Only those measures that have updates for this quarter are in color. These charts are intended to provide a graphical depiction of the various performance measures over several reporting cycles. As the series of data points are plotted over time, they serve as a good management tool to track the historical trends of the measures and to project future performance. Where the targets of specific measures are identified in the objectives or in the annual operational plans, these targets are plotted over the same graphs and they are used as a yardstick to gauge the progress of the specific performance measures. The progress can be monitored and appropriate adjustments may be made periodically by management to ensure that the measures are moving ahead towards meeting or beating the strategic goals and objectives.
Section 2: Trends and Progress of Performance Measures
Caltrans Performance Measures For The Quarter Ending June 30, 2011
Safety Goal – Provide the safest transportation system in the nation for users and workers. Objective 1.1 – By 2008, reduce the fatality rate on the California state highway system (SHS) to 1.00 per 100 million vehicle miles traveled and continuously reduce annually thereafter toward a goal of the lowest rate in the nation. PM 1.1 Traveler Safety – Fatalities per 100 MVMT on the California state highway system.
TargetData Sources: National Highway Traffic Safety Administration; and Division of Traffic Operations.
Desired Trend< 1.00
Notes
1. Data for U.S.A. and California (all roads) is taken from the Fatality Analysis Reporting System (FARS), National Highway Traffic Safety Administration. FARS contains data on a census of fatal traffic crashes within the 50 States, the District of Columbia, and Puerto Rico.
2. Data for the California State Highway System (SHS) is provided by the Division of Traffic Operations. For 2009, the fatality rate was 0.74 fatalities/100 Million Vehicle Miles (MVM) of Travel.
3. This measure is reported on an annual basis and current data represents calendar year 2008 and 2009 (national), the latest data available.
PM 1.2 Worker Safety – Number of work-related fatalities.
1 1
0 0
3
1
2
3
1
2
1
3
0
1
2
3
2000 2001 2002 2003 2004 2005 2006 2007 2008 2009 2010 2011Calendar Year Actual
TargetData Source: Division of Human Resources.
Desired Trend
= 0
Notes
1. There were three worker fatalities reported during the second quarter (April - June) 2011.
STEPHEN PALMER, SR., a Caltrans landscape maintenance worker, died from injuries after being struck by a trolley while on the job May 4, 2011.
JAIME OBESO, a 53-year-old Maintenance Leadworker in District 11, was killed by an errant driver on June 7, 2011 while working on eastbound Interstate 8 near the Sunbeam Rest Area in Imperial County.
RICHARD GONZALEZ, District 11, Equipment Operator II was killed by a vehicle on June 20, 2011 while working on a litter crew on Interstate 15 in San Diego County.
Caltrans Performance Measures For The Quarter Ending June 30, 2011
Notes 1. The current figure (6.96) reflects the incident rate (IR) through the second quarter (January – June) in calendar year (CY) 2011. 2. The 2010 Incident Rate (IR) is a 3.4% reduction from CY 2009 IR. 3. IR is subject to being updated to reflect late reporting of incidents from the field. Employees may seek medical attention weeks
or sometimes months after the initial exposure to an incident that didn't require immediate medical attention. The 2004 IR has since been updated to 8.29 and it is now less susceptible to changes than more recent IR for 2005 and 2006. (2007 figure has been updated from 7.52 in the previous report).
4. Based on consultation with the Office of Health and Safety Services (under the Division of Human Resources), and for consistency and continuity with the original target set for 2008 (as previously reported to the BTH), the 2012 target identified in the Strategic Plan is based on 25% reduction from the baseline IR in 2004. Using the originally established baseline of 8.12, 2012 target is 75% of 8.12, i.e. 6.09 (this figure has been updated to be consistent with the "Safety Statistics for Year 2007" memo from the Deputy Director for Administration and Information Technology).
Caltrans Performance Measures For The Quarter Ending June 30, 2011
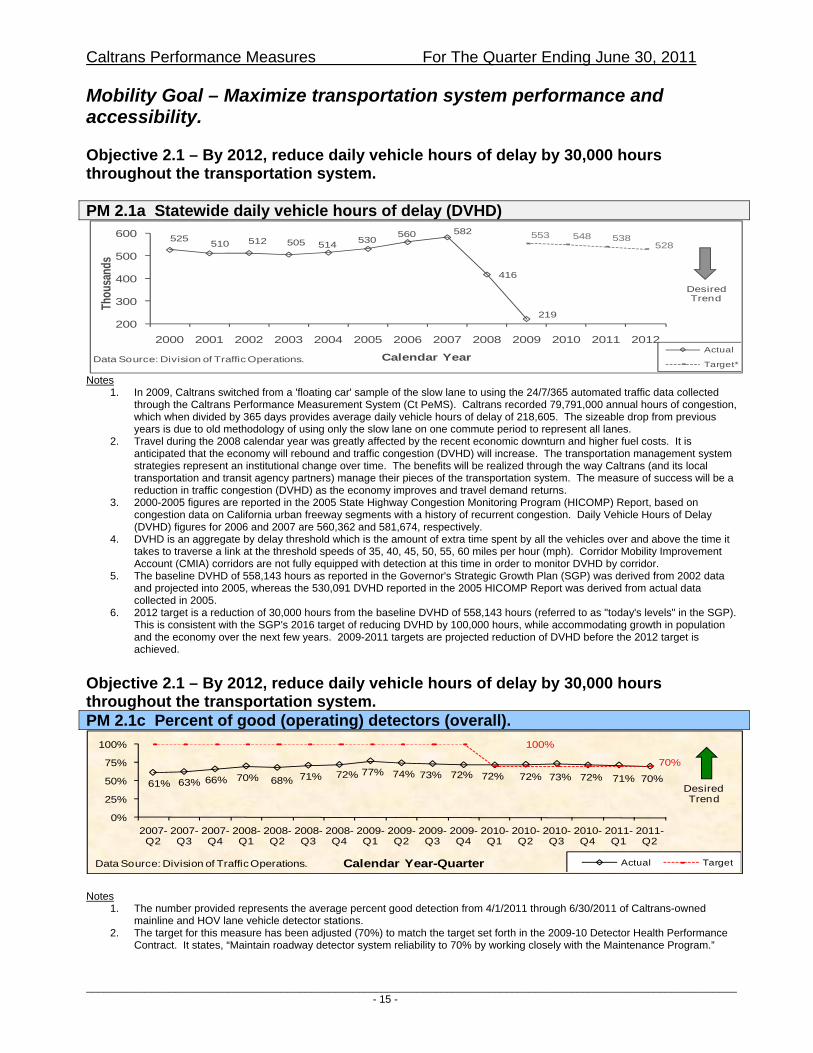
Mobility Goal – Maximize transportation system performance and accessibility. Objective 2.1 – By 2012, reduce daily vehicle hours of delay by 30,000 hours throughout the transportation system. PM 2.1a Statewide daily vehicle hours of delay (DVHD)
Target*Data Source: Division of Traffic Operations.
Desired Trend
Notes 1. In 2009, Caltrans switched from a 'floating car' sample of the slow lane to using the 24/7/365 automated traffic data collected
through the Caltrans Performance Measurement System (Ct PeMS). Caltrans recorded 79,791,000 annual hours of congestion, which when divided by 365 days provides average daily vehicle hours of delay of 218,605. The sizeable drop from previous years is due to old methodology of using only the slow lane on one commute period to represent all lanes.
2. Travel during the 2008 calendar year was greatly affected by the recent economic downturn and higher fuel costs. It is anticipated that the economy will rebound and traffic congestion (DVHD) will increase. The transportation management system strategies represent an institutional change over time. The benefits will be realized through the way Caltrans (and its local transportation and transit agency partners) manage their pieces of the transportation system. The measure of success will be a reduction in traffic congestion (DVHD) as the economy improves and travel demand returns.
3. 2000-2005 figures are reported in the 2005 State Highway Congestion Monitoring Program (HICOMP) Report, based on congestion data on California urban freeway segments with a history of recurrent congestion. Daily Vehicle Hours of Delay (DVHD) figures for 2006 and 2007 are 560,362 and 581,674, respectively.
4. DVHD is an aggregate by delay threshold which is the amount of extra time spent by all the vehicles over and above the time it takes to traverse a link at the threshold speeds of 35, 40, 45, 50, 55, 60 miles per hour (mph). Corridor Mobility Improvement Account (CMIA) corridors are not fully equipped with detection at this time in order to monitor DVHD by corridor.
5. The baseline DVHD of 558,143 hours as reported in the Governor's Strategic Growth Plan (SGP) was derived from 2002 data and projected into 2005, whereas the 530,091 DVHD reported in the 2005 HICOMP Report was derived from actual data collected in 2005.
6. 2012 target is a reduction of 30,000 hours from the baseline DVHD of 558,143 hours (referred to as "today's levels" in the SGP). This is consistent with the SGP's 2016 target of reducing DVHD by 100,000 hours, while accommodating growth in population and the economy over the next few years. 2009-2011 targets are projected reduction of DVHD before the 2012 target is achieved.
Objective 2.1 – By 2012, reduce daily vehicle hours of delay by 30,000 hours throughout the transportation system. PM 2.1c Percent of good (operating) detectors (overall).
Calendar Year-Quarter Actual TargetData Source: Division of Traffic Operations.
Desired Trend
100%
70%
Notes
1. The number provided represents the average percent good detection from 4/1/2011 through 6/30/2011 of Caltrans-owned mainline and HOV lane vehicle detector stations.
2. The target for this measure has been adjusted (70%) to match the target set forth in the 2009-10 Detector Health Performance Contract. It states, “Maintain roadway detector system reliability to 70% by working closely with the Maintenance Program.”
Caltrans Performance Measures For The Quarter Ending June 30, 2011
PM 2.1e Percent detection coverage in urban areas. Status: This measure is being re-evaluated to determine the best method for reporting. This issue is expected to be resolved by December 2011. It is being proposed that this measure will be reported annually rather than quarterly, as the amount of detection deployed does greatly vary each quarter. Objective 2.2 –By 2012, increase reliability by 10% throughout the transportation system. PM 2.2a Travel Time Reliability on selected corridors in California Status: The variation in travel time on selected corridors in California was targeted for reporting beginning in January 2011. We are not meeting this target because we are continuing talks with FHWA to determine the appropriate travel time information they would prefer to be reported. The Department would like to use one consistent measure to report in all documents (Quarterly Performance Report, Mobility Performance Report, and FHWA Stewardship Agreement). PM 2.2b Percent of major incidents cleared in less than 90 minutes.
TargetData Source: Division of Traffic Operations.
Desired Trend
Notes
1. There were 157 Major incidents reported in the Major Incident Database in the January-March 2011 quarter (Q3 of Fiscal Year 10/11) of which 28 were cleared in 90 minutes or less. The average clearance time was 3 hours 38 minutes.
2. This report is subject to seasonal influences (i.e., weather, holiday season, etc.). Major incidents are defined as all unplanned, non-recurring events that reduce highway capacity and require both CHP and Caltrans to respond to the incident scene. Data gathered is related to clearance times only and no evaluation of cause is provided for incidents less than 4 hours. However, an evaluation process for this category of incidents is being developed. In addition, to remedy the situation, Caltrans is in the process of revising data collection methods and software in conjunction with new policies in the field between California Highway Patrol (CHP) and Caltrans.
Caltrans Performance Measures For The Quarter Ending June 30, 2011
Objective 2.3 –By 2012, increase intercity rail ridership on the State-supported routes by 28%. PM 2.3a Intercity rail ridership by route (Pacific Surfliner, San Joaquin, and Capital Corridor), and total ridership for the three routes.
1. Ridership for April-June 2011 was 107.1% of the seasonally adjusted target. Ridership increased by 131,424 (9.7%) from the same quarter in the prior year. Ridership on the Pacific Surfliner Route was up 8.7%; on the San Joaquin Route up 14.9%; and on the Capitol Corridor up 7.9%.
2. With 2006 total ridership as a baseline (4,773,813 riders), 2008 target is 104% of baseline; 2009 target is 108% of baseline; 2010 target is 112% of baseline; 2011 target is 120% of baseline; and 2012 target is 128% of baseline (or 6.110 million riders).
3. Ridership numbers published in the California State Rail Plan are based on the federal fiscal years, and are different from the numbers shown above.
PM 2.3b Total Train and Bus Revenue.
$26,239,000$23,534,000
$28,050,000
$30,807,000
$28,771,221$26,305,000
$28,223,000
$24,156,000
$27,342,000
$31,526,000
$28,425,927$25,169,000
$0
$5,000,000
$10,000,000
$15,000,000
$20,000,000
$25,000,000
$30,000,000
$35,000,000
2010-Q1 2010-Q2 2010-Q3 2010-Q4 2011-Q1 2011-Q2
Reve
nues
Calendar Year Revenues TargetData Source: Division of Rail.
Desired Trend
Notes
1. Beginning in Federal Fiscal Year 2010 the State has switched to fixed price contracts. Consequently, the expenses charged to the State do not reflect actual operational expenses, making the calculation of a farebox ratio (revenues divided by expenses) no longer valid.
2. Financial results are not available until approximately 65 days after the end of each month, consequently April-June 2011 data is not available, and the previous quarter January-March 2011 is shown. The revenue for January-March 2010 was $23,534,000, so the revenue has increased by 11.8 percentage points from the same quarter in 2009-10.
3. The target is established as 10% above the same quarter the previous year.
Caltrans Performance Measures For The Quarter Ending June 30, 2011
Objective 2.4 –By 2012, reduce single occupancy vehicle (SOV) commute trips by 5%. PM 2.4a Single occupancy vehicle as a percentage of total commute trips in California.
Data Sources: U.S. Census, 1990 and 2000; American Community Survey, 2002-2007.
Desired Trend
Notes
1. With 2005 data as a baseline, targets for 2008-2012 vary between 99% and 95% of the baseline. 2. The 2005 American Community Survey was the latest data available when the target was originally set. 3. Categories of commute trips include: drove alone (or single occupant vehicle (SOV)), carpooled, public transportation, walked,
bicycle, motorcycle, other means, and worked at home. 4. Public transportation category included taxicab in the 1990 and 2000 Census, and in the 2002 and 2003 American Community
Survey (ACS). Since the 2004 ACS, however, taxicab has been excluded from the public transportation category and grouped with "other means".
5. Data is subject to sampling variability. In addition, the ACS estimates are subject to nonsampling error.
PM 2.4b Percent of available funds used for Mass Transportation projects that pass through Caltrans to local recipients.
Quarter by Fiscal Year Actual TargetData Source: Division of Mass Transportation.
Desired Trend= 100%
100%
Notes
1. Delay in allocation of funds was due to problems arising from the transition to Caltrans new accounting system, EFIS. 2. Beginning in Q1 of FY 2007/08, the methodology has changed to track the running total of funds processed and passed to local
agencies through the quarter. Previously, only projects that were active during the quarter were calculated and projects that were completed before the quarter began were omitted from the calculation.
3. In Q1 of FY 2008/09, the State grants allocation dropped to $62 million as compared to $482 million in Q1 of FY 2007/08 (although the Federal funds were being allocated and encumbered at a similar rate as last year). The decrease of $420 million in allocated and encumbered State funds has lowered the overall pass through rate for FY 2008/09 and Q1 of FY 2009/2010.
Caltrans Performance Measures For The Quarter Ending June 30, 2011
Delivery Goal – Efficiently deliver quality transportation projects and services. Objective 3.1 – By 2012, impact the overall cost to deliver capital projects by:
a. Reducing the support to capital ratio to 32% or lower; PM 3.1a Capital outlay support cost to capital cost ratio (at Construction Contract Acceptance [CCA] milestone).
Fiscal YearData Source: Division of Project Management.
Desired Trend
35.8%
Data Source: Division of Project Management.
Desired Trend
26.9%
36.9%
Notes
1. Support cost includes project development and construction administration costs. 2. The ratio is calculated on an annual basis. A trend line is used to manage the overall year-to-year program wide trends. 3. The ratio is sensitive to the fluctuation of capital value. A significant increase in capital value for FY 2005/06 caused the ratio to
go down; and likewise, a significant decrease in capital value for FY 2006/07 primarily resulted in a higher ratio.
Caltrans Performance Measures For The Quarter Ending June 30, 2011
Fiscal Year and Quarter Actual TargetData Source: Division of Project Management.
Desired Trend
Notes
1. The percentages represent delivery of 137 of 147 planned milestones through the fourth quarter of FY 2010/2011 2. Based on analysis by management, the target has been adjusted from 100% to 90%. 3. The PA/ED milestone represents completion of preliminary engineering and environmental analyses and investigations for the
project alternatives under investigation, as required by the National Environmental Policy Act (NEPA) and the California Environmental Quality Act (CEQA); state and federal approval of a final Environmental Document (if required); selection of a preferred alternative; and approval of the selected project through the Project Report. Final project design cannot be initiated until the PA/ED milestone has been achieved.
PM 3.2b Percent delivery of planned Right of Way (R/W) Certification milestone for programmed capital projects.
1. The percentages represent delivery of 309 of 311 planned milestones through the fourth quarter of FY 2010/2011. 2. At the R/W Certification milestone, certification is made that all R/W activities (i.e., appraisals, acquisitions, relocation assistance,
utility coordination, etc.) have been completed in accordance with 23 CFR 635.309(c)(1), (2), or (3).
PM 3.2c Percent delivery of planned Ready To List (RTL) milestone for programmed capital projects.
1. The percentages represent delivery of 342 of 346 planned milestones in Director McKim's Contracts for Delivery through the fourth quarter of FY 2010/2011.
2. Figures for FY 2005/06 through FY 2009/10 represent delivery of planned RTL milestones as specified in the Director’s Contracts for Delivery with the 12 districts.
3. A project is considered RTL when the Project Engineer certifies that all applicable design, right of way, environmental, regulatory and statutory conditions have been addressed in the plans, specifications, and estimate (PS&E). The product at RTL is a draft construction contract that is ready to list for advertisement pending funding approval and contract document reproduction.
Caltrans Performance Measures For The Quarter Ending June 30, 2011
Fiscal Year and QuarterActual TargetData Source: Division of Project Management.
Desired Trend
Notes
1. The percentages represent delivery of 187 of 216 planned milestones through the fourth quarter quarter of FY 2010/2011. 2. CCA means that Caltrans has determined that all construction project work has been completed in accordance with all the
requirements of the contract.
PM 3.2e Number and percentage of Cooperative Agreements developed and deemed executable within 60 days from the date of "Request for Cooperative Agreement" to the date that the "Cooperative Agreement is sent to the Local Agency for execution.
1. Out of a total of 49 agreements developed and deemed executable from April 1, 2011 through June 30, 2011, and measured according to the 60-day performance criteria, 43 agreements (or 88%) were developed within 60 days or less, while 6 agreements (or 12%) took longer than 60 days to develop.
2. The target for Performance Measure 3.2e has been adjusted from 100% to 80% to better align with the Program goal. 3. Performance Measure 3.2e has changed as the beginning of FY 2009/10. The original performance measure was not
adequately capturing the time and effort provided by the Local Agencies during the development of the Coop. The new performance measure targets the true intent, which is to provide a 60-day turn-around once an agreement is defined.
Caltrans Performance Measures For The Quarter Ending June 30, 2011
Objective 3.3 – By 2012, ensure 100% of projects meet their approved purpose and need at project completion. PM 3.3a Percent of projects that meet their approved purpose and need at project completion. Status: A process to collect this data is under development. Objective 3.4 – Each year, ensure that the total construction costs of projects do not exceed 100% of their total original allotment. PM 3.4a Total construction costs of projects at Proposed Final Estimate (PFE) as a percentage of total original contract allotment.
1. Data for Q4 FY 2010/11 is cumulative from July 1, 2010 through June 30, 2011. 2. Original contract allotment = the bid amount + contingency + state furnished material + supplemental work funds.
Caltrans Performance Measures For The Quarter Ending June 30, 2011
Objective 3.5 –Each year, keep the total of all low bids within ± 5% of the total of all engineer’s estimates. PM 3.5b Percent of projects with low bid within ±10% of engineer's estimate; and Percent of projects with low bid greater than 110% of engineer's estimate.
Fiscal Year and QuarterLow Bid within ±10% Low Bid >110% of Est.Data Source: Division of Engineering Services.
Desired Trend
Notes
1. For FY 2010/11 low bids for 236 of 614 projects were within +/- 10% of the engineer's estimate. Low bids for 496 of 614 projects were <110% of the engineer's estimate.
2. Figures include all bid-opened projects, except for Minor B or emergency contracts. The cost limit for Minor B projects ($147,000 for 2008-2009) is defined by California Public Contract Code, Section 10105.
3. Target is at least 50% of the projects have a low bid within ±10% of the engineer’s estimate.
Caltrans Performance Measures For The Quarter Ending June 30, 2011
Stewardship Goal – Preserve and enhance California's resources and assets. Objective 4.1 –By 2012, ensure that distressed pavement does not exceed 30% of the system's lane miles. PM 4.1a Pavement Condition – Percent of distressed lane miles.
Calendar Year% Distressed TargetData Source: Division of Pavement Management.
Desired Trend
Stated target by 2012.
Notes
1. Currently using distressed lane miles from the 2007 survey (26%). The 2009 survey did not collect data for the entire system (only the NHS) and one of the distress types (faulting) was not collected. The 2010 survey will be available August 2011.
2. 2006 pavement survey was delayed to 2007. The percentage shown for 2006 is interpolated. 3. The dotted line are forecast for pavement distress levels in 2008-2012, based on current State Highway Operation and Protection
Program (SHOPP) funding for pavement projects. Meeting the stated target of 30% by 2012 will require a significant increase in SHOPP funding for pavement projects.
Objective 4.2 –Each year, ensure that 100% of Caltrans' financial resources are available when and where needed. PM 4.2a Percent of federal subvention formula funds obligated for local projects (on/off State highway system).
1. Q1-Q3 figures reflect progress towards meeting the Federal fiscal year-end target of obligating 100% of available funds. Historical trends indicate that during the first two quarters of the FFY, the obligation of projects is typically low and it increases in the third quarter with a large number of projects being obligated at the end of the FFY.
2. Local Assistance has delivered approximately 51.9% of the available $1.2 billion of FFY 2011 Formula OA. With one quarter remaining in the FFY, July through September is typically the highest period for delivery of federal projects as this represents the last period that locals may deliver projects without the risk of losing federal funds. Last FFY's delivery through June 30, 2010, was 45.5%.
Caltrans Performance Measures For The Quarter Ending June 30, 2011
Quarter by Federal Fiscal Year Actual TargetData Source: Division of Local Assistance.
Desired Trend
Notes
1. Goal met for the quarter ending June 30, 2011. 2. An inactive project is defined as a project with no financial activity in the past 12 months. Inactive projects, subject to quarterly
review, are based on the criteria detailed in the Code of Federal Regulations (23 CFR Part 630.106). 3. The target was revised from 15% to 10% as the percentage of inactive projects had declined from a high of 18% in Q2 of FFY
2007 to the low of 9% in Q3 of FFY 2008.
PM 4.2c Percent of invoices issued to individuals or entities that owe the Department money prepared within 30 calendar days of receipt of documentation.
99.9% 99.8% 99.2% 100.0%
95.1%97% 97%
60%70%80%90%
100%
2006/07 2007/08 2008/09 2009/10 2010/11Q4
Fiscal Year and Quarter Actual TargetData Source: Division of Accounting.
Desired Trend
Notes
1. The FY 2010/11 Q4 figure reflects 6,128 of 6,443 invoices that were prepared within 30 calendar days.
PM 4.2d Percent of total payments made to vendors and other government agencies within the time limits imposed by the Prompt Payment Act or as specified in the contract.
99.8%99.7% 99.7%
99.1%99.7%
99% 99%
98%
99%
100%
2006/07 2007/08 2008/09 2009/10 2010/11Q4
Fiscal Year and Quarter Actual TargetData Source: Division of Accounting.
Desired Trend
Notes
1. In the 4th quarter of 2010/11, 99.68% (243,335 of 244,107) of vendor invoice payments were made timely.
Caltrans Performance Measures For The Quarter Ending June 30, 2011
PM 4.2e Percent of employee payments processed within 10 working days of receipt of Travel Expense Claim (TEC) by Accounting.
100% 99.6% 93.7%
90.3% 89.7%
100%
0%
25%
50%
75%
100%
2006/07 2007/08 2008/09 2009/10 2010/11Q4
Fiscal Year and Quarter Actual
TargetData Source: Division of Accounting.
Desired Trend
Notes
1. The current figure of 89.73% reflects 16,273 of 18,134 TEC’s processed within 10 days of receipt for Q4 FY 2010/11. 2. TEC processing time increased due to staffing resources on E-FIS project. Additional workload increase due to processing
District 4 transit subsidies - 900 additional TECs per month. Staff is self-directed to allow E-FIS work on furlough Fridays.
Objective 4.3 –By 2012, increase maintenance level of service (LOS) scores to: 80 in Litter and Debris; 95 in Striping; 95 in Guardrail; 87 for overall roadway level of service.
PM 4.3a Maintenance LOS in Litter and Debris; PM 4.3b Maintenance LOS in Striping; PM 4.3c Maintenance LOS in Guardrail; PM 4.3d Maintenance LOS for overall roadway.
1. Maintenance operational plan for FY 2009/10 calls for holding the overall roadway LOS at 86. It is anticipated that it will be difficult to hold the overall roadway LOS at current level due to under-investment in roadway maintenance/rehabilitation over the past five years.
2. The overall roadway LOS rating is an average of all roadway elements (travelway, drainage, roadside and traffic guidance) levels of service.
3. Annual LOS targets for FYs 2008-2012 are shown in dashed lines.
Desired Trend
Caltrans Performance Measures For The Quarter Ending June 30, 2011
Objective 4.4 –Each year, ensure environmental commitments are documented and implemented on 100% of projects. PM 4.4b Percentage of projects that have an updated Environmental Commitments Records (ECR) at Ready to List (RTL) milestone.
82%
97% 97%
100%
0%
50%
100%
2007/08 2008/09 2009/10
Fiscal YearActual
TargetData Source: Division of Environmental Analysis
Desired Trend
Notes
1. Current data for FY 2009/10 represents 115 of 118 deliveries (97%). 2. Measure 4.4a - Percentage of projects that have an updated Certificate of Environmental Compliance at CCA is currently being
tracked by the Standard Tracking and Exchange Vehicle for Environmental (STEVE) tool and the Preliminary Environmental Analysis Report (PEAR) database. The first reporting is set for FY 2010/11.
Objective 4.5 –Each year, dispose of 100% of the parcels identified as excess in the annual Real Property Retention Review. PM 4.5 Percent of parcels identified in the Excess Land Disposal Plan and disposed of.
63%
113%128%
100% 100% 100%
0%
50%
100%
2008/09 2009/10 2010/11
Fiscal YearActual
Target
Desired Trend
Data Source: Division of Right of Way and Land Surveys.
292 258
206325
180230
Notes
1. The Department's Excess Land Disposal Contract commitment was 180 parcels for fiscal year 2010/2011 and 230 were disposed (128%).
2. This performance measure was previously reported on a Calendar Year cycle. This did not coincide with the current annual Excess Land Disposal Plan, which is reported on a Fiscal Year basis. The current graph represents the new reporting of this performance measure.
Caltrans Performance Measures For The Quarter Ending June 30, 2011
Objective 4.6 –Identify all critical infrastructure deficiencies for facilities by 2010 and remediate 25% of the deficiencies by 2012. PM 4.6 Percent of facilities with critical infrastructure deficiencies remediated.
8.3%12.5%
15.6%18.8%
15.6%
25%
0%
10%
20%
30%
2007/08 2008/09 2009/10 2010/11 2011/12
Fiscal Year
Actual
TargetData Source: Division of Business, Facilities, and
Desired Trend
Notes
1. Reported for the first time for FY 2007/08, with 8.3% remediated cumulatively. 2. Target is to remediate critical infrastructure deficiencies in two out of eight office facilities (25%). 3. The District 1 Preliminary Plans and Working Drawings are scheduled to be completed in FY 2011-12 (21.9%) and Construction
to begin in FY 2011-12 (25.0%). Objective 4.7 –Manage Caltrans' assets (human resource, information, facilities, and equipment) efficiently and effectively to ensure that 100% of its authorized resources are protected and available when and where needed. PM 4.7a Percentage of equipment that is available to the user (fleet uptime).
83.76%
87.84%
91.44%
89.30%
88.01%
87.80%
87.63%
87.90%
86.70%
85.50%
80.70%
78.40%75.95%
71.00%68.00% 67.00%
100%
65%
75%
85%
95%
Q1 Q2 Q3 Q4 Q1 Q2 Q3 Q4 Q1 Q2 Q3 Q4 Q1 Q2 Q3 Q4
2007/08 2008/09 2009/10 2010/11
Quarter by Fiscal Year Actual Target
Desired Trend
Notes
1. The latest data represents a 1.00% decrease in fleet uptime from the previous quarter. This decrease is attributed to the lagging effects of furlough days and decreases in budget. The inoperable equipment has begun to become backed up and there are not sufficient resources to maintain fleet uptimes. This trend is expected to continue.
2. Equipment uptime data is collected on a nightly basis, seven days per week. 3. Uptime percentages based on data from Fleet Management System.
PM 4.7b Percent approval rating of the Legal Division from an annual performance survey of senior Department managers.
94%
98%
95% 95% 95%95%
90%
95%
100%
2006 2007 2008 2009 2010
Calendar Year
Actual
TargetData Source: Legal Program.
Desired Trend
Notes
1. Surveys were sent to the Deputy Directors, District Directors, Deupty District Directors in late December for calender year 2010. 16 of the 148 Surveys were returned. 100% of the ratings were "good" or better. Overall average rating was 4.29 on a 5 point scale. (4="Superior") Key points learned were: provide additional litigation support.
Caltrans Performance Measures For The Quarter Ending June 30, 2011
PM 4.7c Percent of the tort, eminent domain, and contract cases in which Legal Division obtains favorable results.
95% 97%98% 95% 97%
93% 95%
97% 97%94%
59% 58% 45% 54% 63%
95%
0%
25%
50%
75%
100%
2006/07 2007/08 2008/09 2009/10 2010/11
Fiscal YearTort Eminent Domain
Contract Target
Desired Trend
Data Source: Legal Program.
Notes 1. For FY 2010/11, Legal has met the 95% target for tort litigation. For eminent domain and contract litigation, Legal is working with
Department staff on strategies to increase the success rate.
PM 4.7d Percent of external audits identified in the annual service plan that are completed.
91.4%
100.4%
107.0%116.0%
100.0%
100%
80%
90%
100%
110%
120%
2006/07 2007/08 2008/09 2009/10 2010/11
Fiscal YearActual TargetData Source: Audits and Investigations Program.
Desired Trend= 100%
Notes
1. A&I's External Audit Section's Plan of Service estimated a total of 313 external audit assignments would be completed in FY 10/11. A total of 291 assignments (93% of the plan of service) were actually completed. As such, we fulfilled our performance measure (100%).
PM 4.7e Percent of mandated audits that are completed.
89.1%
99.6% 99.4% 99.9% 99.9%100%
80%
90%
100%
2006/07 2007/08 2008/09 2009/10 2010/11
Fiscal Year Actual
TargetData Source: Audits and Investigations Program.
Desired Trend= 100%
Notes
1. A&I's Internal Audit Section completed all of the mandated audits for CAL-Card and FISMA cycles, however, the final Cal-Card audit report issuance is awaiting responses from the affected Districts and Divisions. As such, we are 99.9% complete in fulfilling our mandatory audits.
2. Mandated audits are: Department of General Services contract, Cal-Card delegation authority, and FISMA cycles. FISMA (Financial Integrity and State Manager's Accountability) Act of 1983 requires A&I to assess whether internal accounting and administrative controls are operating in a satisfactory manner and communicate results to management.
Caltrans Performance Measures For The Quarter Ending June 30, 2011
Objective 4.8 –By 2012, reduce the number of distressed bridges to 5% of all bridges. PM 4.8a Bridge Condition – Number and percent of distressed bridges.
739
703
685 779 817
1,06
4
870
676
683
5.9% 5.6% 5.5%6.2% 6.5%
8.5%
6.8%
5.4% 5.5%5%
0.0%
2.0%
4.0%
6.0%
8.0%
10.0%
0
500
1000
# of B
ridge
s
2012
# of Bridges
% of Bridges
Desired Trend
Data Source: Division of Maintenance.
Desired Trend
Notes
1. Distressed bridges represent those with identified rehabilitation needs. Bridges with scour and seismic needs were included as distressed bridges beginning in FY 2007/08.
2. FY 2011/12 target is based on the stated objective for the year 2012. Annual targets for FY 2008/09 through FY 2010/11 will be dependent upon funding level for each of those years.
3. Data are reported annually and represent State-owned bridges only.
PM 4.8b Bridge Condition – Network bridge health index (BHI) number.
Fiscal Year Actual TargetData Source: Division of Maintenance.
Desired Trend
Notes
1. The target for FY 2008/09 has been adjusted from 95 to 94 based on management consensus of maintaining a Network BHI of 94 by FY 2011/2012.
2. Data are reported annually and represent State-owned bridges only.
PM 4.8c Bridge Condition – Percent of State-owned bridges classified as structurally deficient or functionally obsolete (SD/FO).
13%
14.7%14%
13%
10%
12%
14%
Fiscal Year
Actual
TargetData Source: Division of Maintenance.
Desired Trend
Notes
1. The term "structurally deficient" should not be misconstrued to mean a bridge is in danger of collapsing. Structurally deficient means the bridge needs repairs to prevent minor problems such as minor cracks, erosion, peeling paint, pot hole, etc. from becoming more serious.
2. Until the 2007/08 FY, 14% of State highway bridges are classified as structurally deficient and functionally obsolete. In 2008/09 FY, 13% of the bridges were reported as structurally deficient. This is the lowest reporting for this performance measure.
3. The SD/FO designation includes only those bridges eligible for federal Highway Bridge Program (HBP) funds.
Caltrans Performance Measures For The Quarter Ending June 30, 2011
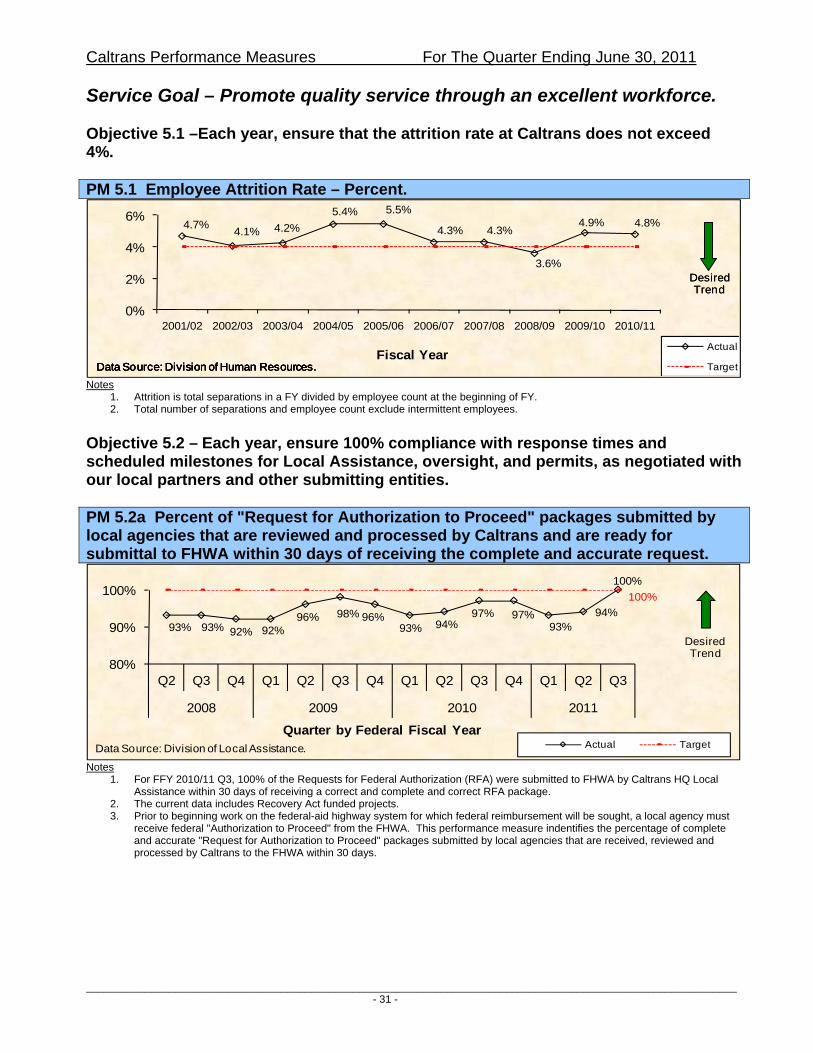
Service Goal – Promote quality service through an excellent workforce. Objective 5.1 –Each year, ensure that the attrition rate at Caltrans does not exceed 4%. PM 5.1 Employee Attrition Rate – Percent.
Data Source: Division of Human Resources.Data Source: Division of Human Resources.
Desired Trend
Data Source: Division of Human Resources. Notes
1. Attrition is total separations in a FY divided by employee count at the beginning of FY. 2. Total number of separations and employee count exclude intermittent employees.
Objective 5.2 – Each year, ensure 100% compliance with response times and scheduled milestones for Local Assistance, oversight, and permits, as negotiated with our local partners and other submitting entities. PM 5.2a Percent of "Request for Authorization to Proceed" packages submitted by local agencies that are reviewed and processed by Caltrans and are ready for submittal to FHWA within 30 days of receiving the complete and accurate request.
93% 93% 92% 92%96% 98% 96%
93% 94%97% 97%
93%94%
100%
100%
80%
90%
100%
Q2 Q3 Q4 Q1 Q2 Q3 Q4 Q1 Q2 Q3 Q4 Q1 Q2 Q3
2008 2009 2010 2011
Quarter by Federal Fiscal YearActual TargetData Source: Division of Local Assistance.
Desired Trend
Notes
1. For FFY 2010/11 Q3, 100% of the Requests for Federal Authorization (RFA) were submitted to FHWA by Caltrans HQ Local Assistance within 30 days of receiving a correct and complete and correct RFA package.
2. The current data includes Recovery Act funded projects. 3. Prior to beginning work on the federal-aid highway system for which federal reimbursement will be sought, a local agency must
receive federal "Authorization to Proceed" from the FHWA. This performance measure indentifies the percentage of complete and accurate "Request for Authorization to Proceed" packages submitted by local agencies that are received, reviewed and processed by Caltrans to the FHWA within 30 days.
Caltrans Performance Measures For The Quarter Ending June 30, 2011
PM 5.2b Percent of encroachment permits approved within the statutory 60-day limit.
89% 89%91%
87% 87%
91% 91% 91%88% 90% 89%
88%
100%
80%
90%
100%
Q1 Q2 Q3 Q4 Q1 Q2 Q3 Q4 Q1 Q2 Q3 Q4
2008/09 2009/10 2010/11
Quarter by Fiscal Year
Actual
Target
Data Source: Division of Traffic Operations.
Desired Trend
Notes
1. The number provided (88) represents the percentage of encroachment permits approved within the statutory 60 day limit during the April - June 2011 quarter (Q4 of FY 2010/11). The data is taken from the Encroachment Permit Management System (EPMS), which was implemented in January 2008. Those permits that exceeded 60-day approval were due to multiple review cycles and pending responses from the applicant.
2. The EPMS along with the future E-permitting system in a few years hence will allow for more accurate statewide tracking of encroachment permit approvals. The Feasibility Study Report for E-permitting is being updated to be consistent with the Information Technology Capitol Plan.
Objective 5.3 –By 2012, increase by 15% the percentage of Caltrans employees who agree or strongly agree that employees are encouraged to try new ideas and new ways of doing things to improve Caltrans. PM 5.3 Percent of Caltrans employees who agree or strongly agree that employees are encouraged to try new ideas and new ways of doing things to improve Caltrans.
39%
45%
41%
43%
45%
35%
40%
45%
2006 2008 2010 2012
Year of Employee SurveyData Source: Office of Strategic Planning andPerformance Measurement.
Desired Trend
Notes
1. Due to budget constraints, there has not been an employee survey since 2008. 2. No comparable survey questions in the 1999 and 2002 Employee Surveys. 3. Favorable result from the 2006 Employee Survey was 39%, which established the baseline for improvements. 4. 2008 target represents 105% of 39; 2010 target represents 110% of 39; and 2012 target represents 115% of 39.
Caltrans Performance Measures For The Quarter Ending June 30, 2011
Objective 5.4 –By 2012, increase by 15% the percentage of external stakeholders who are satisfied with Caltrans services. PM 5.4a Percent of survey respondents who said Caltrans was doing a good or excellent job.
Data Source: Office of Strategic Planning andPerformance Measurement.
Notes
1. Due to budget constraints, there has not been an external customer survey since 2007. 2. No quantitative data was available for stakeholder responses in the 2001 External Customer Survey. Hence, the survey result
from the 2007 Stakeholder Survey segment established the baseline for the stakeholder portion of the External Customer Survey.
3. A slightly different survey question was used in the 2005 External Customer Survey (see PM 5.4b). 4. 2007 figures are based on the "overall" responses from the respective User Survey and Stakeholder Survey segments of the
2007 External Customer Survey. 5. The 2009 target for the User Survey represents 108% of 53 (baseline from the 2001 data), whereas the 2009 target for the
Stakeholder Survey represents 108% of 68 (baseline from the 2007 data). The 2012 targets represent 115% of 53 for the User Survey and 115% of 68 for the Stakeholder Survey, respectively.
6. Target years are based on the expectation of the availability of new External Customer Survey results.
PM 5.4b Percent of survey respondents who said Caltrans was doing a good or excellent job in fulfilling its mission of improving mobility across California.
39%
48%45%
0%
25%
50%
2001 2005 2007 2012 Target
Year of External Customer Survey
Desired Trend
Response rate is 123% of 39 (from 2005 survey).
Data Source: Office of Strategic Planning andPerformance Measurement.
Notes 1. Due to budget constraints, there has not been an external customer survey since 2007. 2. A slightly different survey question was used in the 2001 External Customer Survey (see PM 5.4a). 3. Based on responses from the User Survey segment of the 2007 External Customer Survey. 4. The 2012 target represents 115% of 39 (or 15% improvement from the 2005 baseline of 39). The 2007 External Customer
Survey result already exceeded the target of 15% improvement from the 2005 baseline. 5. Previous reports showed an improvement of 21% from 2005 to 2007, which was calculated from the actual unrounded
percentages of 39.4% in 2005 and 47.9% in 2007, i.e. (47.9 - 39.4) ÷ 39.4 × 100% = 21%.
Caltrans Performance Measures For The Quarter Ending June 30, 2011
PM 5.4c Percent of survey respondents who said: "Over the last two years, Caltrans' performance has improved, gotten worse, stayed about the same, or don't know."
16%
25%
43%
11% 8% 9%
63%60%
46%
10% 7%2%
0%
20%
40%
60%
80%
2005 (User) 2007 (User) 2007 (Stakeholder)
Year of External Customer Survey
Improved
Gotten Worse
The Same
Don't Know
Desired Trend
Data Source: Office of Strategic Planning andPerformance Measurement.
Notes
1. Due to budget constraints, there has not been an external customer survey since 2007. 2. No quantitative data was available for stakeholder responses in the 2005 External Customer Survey. 3. Based on responses from the User Survey segment of the 2007 External Customer Survey. 4. Based on responses from the Stakeholder Survey segment of the 2007 External Customer Survey. 5. The response rate for "improved" in the 2007 User Survey is an increase of 54% from the 2005 External Customer Survey (i.e.
25.0 is 154% of 16.2). This increase has already exceeded the stated target (in Objective 5.4) of 15% improvement from the baseline of 16.2 (i.e. 115% of 16.2 is only 18.6).
Objective 5.5 – By 2012, increase by 5% the percentage of Caltrans employees who agree or strongly agree that the training they have received at Caltrans has adequately prepared them for the work they do. PM 5.5 Percent of Caltrans employees who agree or strongly agree that the training they have received at Caltrans has adequately prepared them for the work they do.
62%
58%
63%
61%
64%65%
66%
55%
60%
65%
70%
1999 2002 2006 2008 2010 2012
Year of Employee Survey
% Favorable
Target
Desired Trend
Data Source: Office of Strategic Planning andPerformance Measurement.
Notes 1. Due to budget constraints, there has not been an employee survey since 2008. 2. Based on the (2006) survey firm's internal data: U.S. Norm = 57%, P65 Norm = 66%. U.S. Norm represents the 50th percentile,
whereas P65 Norm represents the 65th percentile of the general working population in the U.S. 3. 2008 target represents 101% of 63; 2010 target represents 103% of 63; and 2012 target represents 105% of 63 (or 5%
improvement from the 2006 baseline of 63).
Caltrans Performance Measures For The Quarter Ending June 30, 2011
Objective 5.6 –Increase the percentage of Caltrans employees who rate Caltrans management as good or very good at being open and honest in communications with employees, by (from baseline) 15% in 2008, 30% in 2010, and 50% in 2012. PM 5.6 Percent of Caltrans employees who rate Caltrans management as good or very good at being open and honest in communications with employees.
43%
48%
56%
37%
53%
30%
40%
50%
60%
2006 2008 2010 2012Year of Employee Survey
Desired Trend
Data Source: Office of Strategic Planning andPerformance Measurement.
Notes
1. Due to budget constraints, there has not been an employee survey since 2008. 2. Favorable result from the 2006 Employee Survey was 37%, which established the baseline for improvements. 3. Based on the 2006 survey firm's internal data: U.S. Norm = 52%, P65 Norm = 57%. U.S. Norm represents the 50th percentile,
whereas P65 Norm represents the 65th percentile of the general working population in the U.S. 4. No comparable survey questions in the 1999 and the 2002 Employee Surveys. 5. 2008 target represents 115% of 37; 2010 target represents 130% of 37; and 2012 target represents 150% of 37 (or 50%
improvement from the baseline of 37). Objective 5.7 –By 2012, increase by 15% the percentage of Caltrans employees who agree or strongly agree that they are satisfied with the availability of the tools necessary to do their job. PM 5.7 Percent of Caltrans employees who agree or strongly agree that they are satisfied with the availability of the tools necessary to do their job.
64%
67%
70%
61% 62%
55%
60%
65%
70%
75%
2006 2008 2010 2012
Year of Employee Survey
Desired Trend
Data Source: Office of Strategic Planning andPerformance Measurement.
Notes 1. Due to budget constraints, there has not been an employee survey since 2008. 2. Favorable result from the 2006 Employee Survey was 61%, which established the baseline for improvements. 3. Based on the 2006 survey firm's internal data: U.S. Norm = 67%, P65 Norm = 76%. U.S. Norm represents the 50th percentile,
whereas P65 Norm represents the 65th percentile of the general working population in the U.S. 4. No comparable survey questions in the 1999 and the 2002 Employee Surveys. 5. 2008 target represents 105% of 61; 2010 target represents 110% of 61; and 2012 target represents 115% of 61 (or 15%
improvement from the baseline of 61).
Caltrans Performance Measures For The Quarter Ending June 30, 2011
Objective 5.8 –By 2012, increase by 20% the percentage of first-choice candidates that accept the Department's entry-level job offers. PM 5.8 Percent of first-choice candidates that accept the Department's entry-level job offers.
81% 85% 85.7% 80.5% 81.1% 85.1%75.0% 76.9% 76.0%
100.0%
81.8% 75.0%75.0%
97%
0%
20%
40%
60%
80%
100%
Q3 Q4 Q1 Q2 Q3 Q4 Q1 Q2 Q3 Q4 Q1 Q2 Q3
2007/08 2008/09 2009/10 2010/11
Quarter by Fiscal Year Actual TargetData Source: Division of Human Resources.
Desired Trend
Notes
1. Division of Human Resources sent the Hiring Quality Assessment Survey to 37 hiring supervisors. Of the 4 responses received, 75% ( 3 ) indicated they were able to hire their first choice candidate.
2. Due to Caltrans internal hiring freeze, first choice hiring was impacted. 3. First-choice candidates increased by 25% from last quarter (2nd Qtr. 2011). 4. The baseline of 81% was an average of February - March 2008 data. The target is 120% of the baseline (or 20% improvement
over the baseline of 81%).
Caltrans Performance Measures For The Quarter Ending June 30, 2011