92
2015
2015

United States Department of Agriculture National Agricultural Statistics Service
New England Field Office
November 2016
This issue of the New England Agricultural Statistics 2015 contains the most accurate, reliable, and unbiased information on the crop, livestock, and other agricultural products for each of the six New England States.
This publication satisfies the growing need for accurate, reliable, and unbiased information and data. The data comes from farmers, agricultural businesses, County Extensions, and other USDA agencies from across the New England States.
The data is used to provide facts to decision makers that determine the future of agriculture in their State. The goal for this publication remains unchanged. That goal is to provide the public with data to help them understand the current situation of agriculture within each of the New England States and in the region as a whole.
I wish to thank the thousands of farm operators across the region who participated in the surveys we conducted throughout the year. We understand the time commitment needed to complete these questionnaires and fully appreciate your effort. We strive to assure all your individual reports and business data are held in the strictest confidence. You are the heart and soul of our program, for without your cooperation, the rest of the story could not be accurately written.
Sincerely,
Gary R. Keough State Statistician
New England Agricultural Statistics
2015
Compiled and Issued by the USDA National Agricultural Statistics Service
New England Field Office
Gary R. Keough, State Statistician Sherry Deane, Survey Statistician
53 Pleasant Street, Room 3450 Concord, NH 03301
603-224-9639 Fax: 603-225-1434
Connecticut Department of Agriculture
Steven K. Reviczky, Commissioner
New Hampshire Department of Agriculture,
Markets and Food Lorraine Stuart Merrill, Commissioner
Maine Department of Agriculture, Conservation and Forestry
Walter E. Whitcomb, Commissioner
Rhode Island Department of Environmental Management
Division of Agriculture and Marketing Kenneth D. Ayars, Chief
Massachusetts Department of Agricultural Resources
John Lebeaux, Commissioner
Vermont Agency of Agriculture, Food and Markets
Chuck Ross, Secretary
In Cooperation with the United States Department of Agriculture National Agricultural Statistics Service
Hubert Hamer, Administrator
Published November 2016
USDA National Agricultural Statistics Service
New England Field Office
Gary R. Keough, State Statistician
Sherry Deane, Survey Statistician
National Association of State Departments of Agriculture (NASDA)
NASDA Supervisors for Field Enumerators
Kevin Bragg (NH) Marcia Gartley (Aroostook County, ME)
Valerie Harris (Southern ME) Fernand Lacasse (VT)
Prescott Wright (RI, Cape Cod / Eastern CT) Marcia Kendall (Western CT / Western MA)

New England Agricultural Statistics 1 USDA, National Agricultural Statistics Service
Table of Contents
General
Farm Numbers
Number of Farms, Land in Farms, and Value per Acre, by Sales Class — New England: 2011-2015 .................................... 5
Farm Real Estate and Agricultural Land Value per Acre — New England: 2011-2015 .......................................................... 6
Cash Rents
Cash Rents for Cropland and Pasture, by County — Connecticut: 2014-2016 ........................................................................ 7
Cash Rents for Cropland and Pasture, by County and District — Maine: 2014-2016 ............................................................. 7
Cash Rents for Cropland and Pasture, by County — Massachusetts: 2014-2016 .................................................................... 8
Cash Rents for Cropland and Pasture, by County — New Hampshire: 2014-2016 ................................................................. 8
Cash Rents for Cropland and Pasture, by County — Rhode Island: 2014-2016 ...................................................................... 9
Cash Rents for Cropland and Pasture, by County — Rhode Island: 2014-2016 ...................................................................... 9
Farm Production Expenditures
Farm Production Expenditures, Major Input Items, Average per Farm, and Total — Atlantic Region and
United States: 2013-2014 ...................................................................................................................................................... 10
Farm Labor
Quarterly and Annual Agricultural Labor Wage Rates for Hired Workers, Number of Workers, and Hours
Worked — Northeast: 2011-2015 ........................................................................................................................................... 12
Quarterly Agricultural Labor Wage Rates by Type of Farm and Economic Class — Northeast: 2011-2015 ........................ 13
Farm Computer Use
Farm Computer Usage – States and United States: 2011, 2013, 2015 ................................................................................. 14
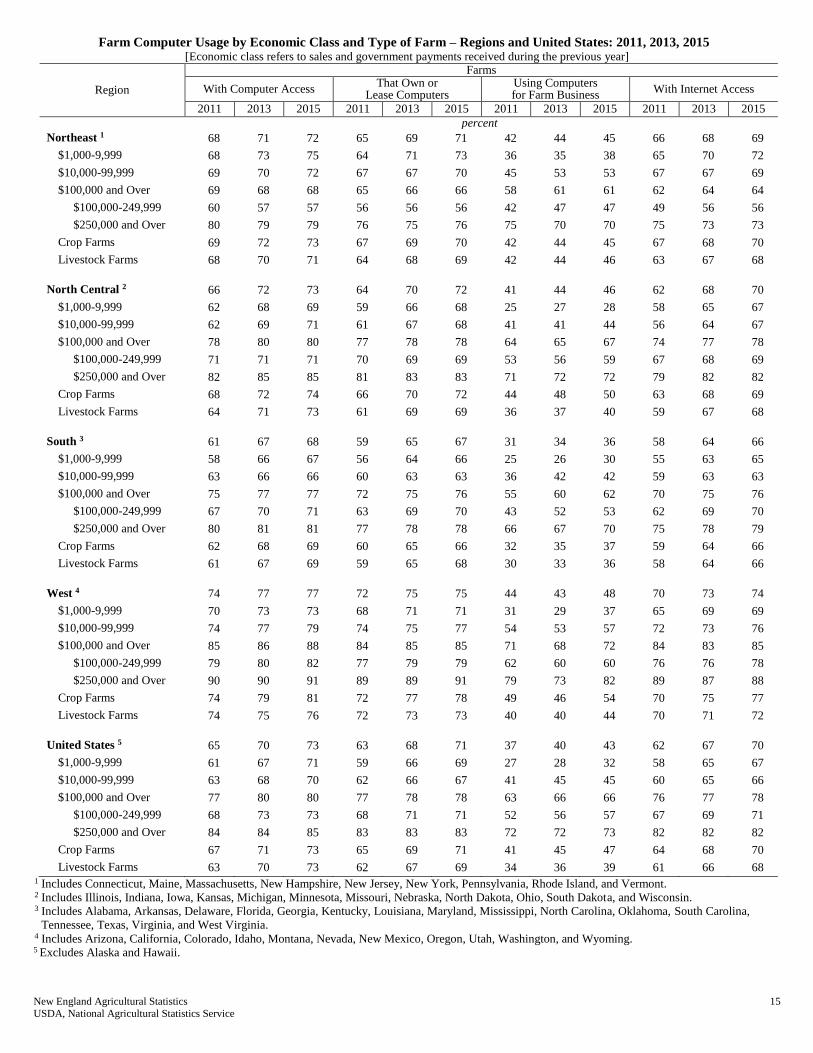
Farm Computer Usage by Economic Class and Type of Farm – Regions and United States: 2011, 2013, 2015 ................ 15
Primary Method of Internet Access – States and United States: 2011, 2013, 2015.............................................................. 16
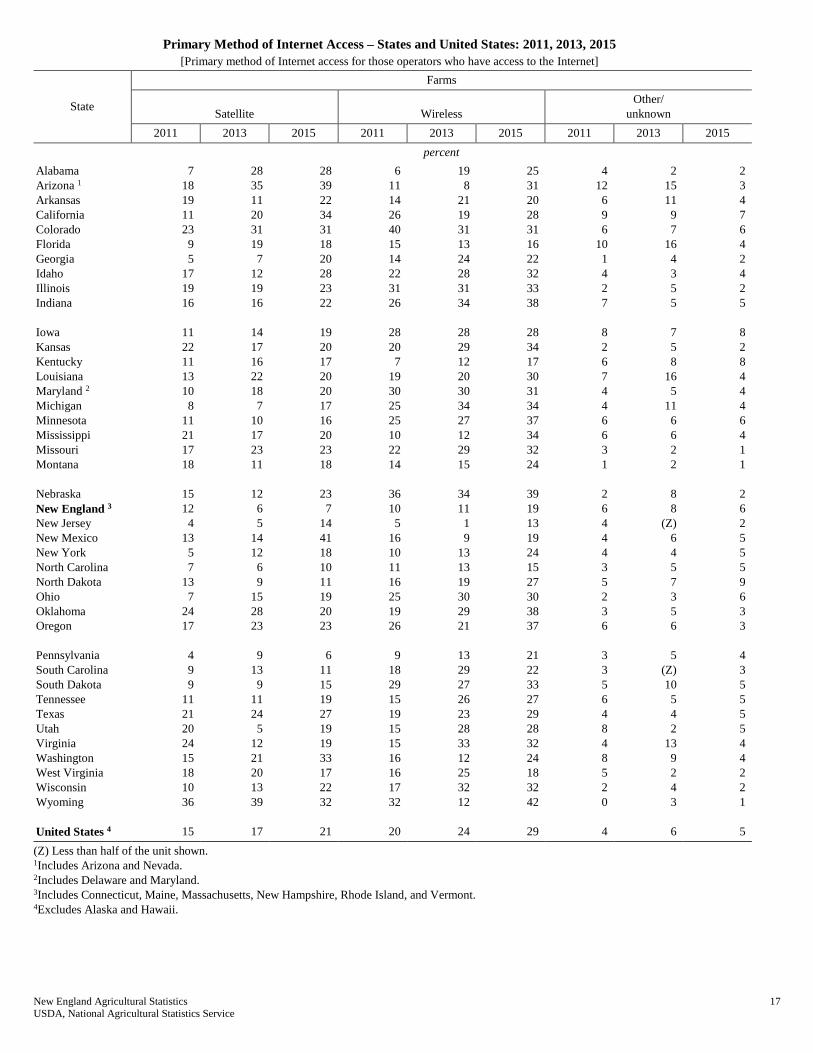
Primary Method of Internet Access – States and United States: 2011, 2013, 2015.............................................................. 17
Weather
Average Precipitation, Monthly and Annual by State – New England: 2011-2015 ............................................................. 18
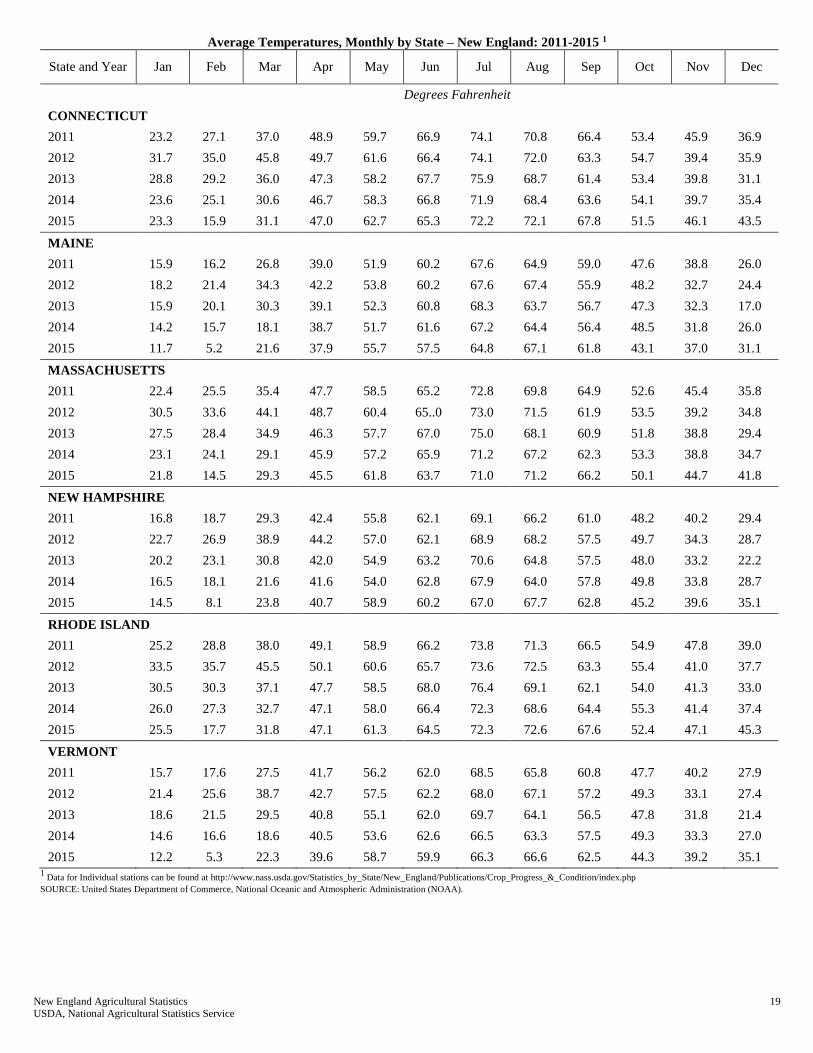
Average Temperatures, Monthly by State – New England: 2011-2015 ............................................................................... 19
Crops
Field Crops
Alfalfa Hay Area Harvested, Yield, Production, Price, and Value — New England: 2011-2015 .......................................... 20
Other Hay Area Harvested, Yield, Production, Price, and Value — New England: 2011-2015 ............................................ 21
All Hay Area Harvested, Yield, Production, Price, and Value — New England: 2011-2015 ................................................ 22
Hay Stocks on Farm by Position and Month — New England: 2011-2015 ........................................................................... 23
Alfalfa Forage Area Harvested, Yield, and Production — Vermont: 2011-2015................................................................... 24
All Forage Area Harvested, Yield, and Production — Vermont: 2011-2015 ......................................................................... 24
Alfalfa Haylage and Greenchop Area Harvested, Yield, and Production — Vermont: 2011-2015 ....................................... 24
All Haylage and Greenchop Area Harvested, Yield, and Production — Vermont: 2011-2015 ............................................. 24
Corn for Silage Area Planted and Harvested, Yield, Production, Price, and Value — New England: 2011-2015 ................ 25
Barley Area Planted and Harvested, Yield, Production, Price, and Value — Maine: 2011-2015 .......................................... 26
Oats Area Planted and Harvested, Yield, Production, Price, and Value — Maine: 2011-2015 ............................................. 26
Broadleaf Tobacco (Type 51) Area Harvested, Yield, Production, Price, and Value — New England: 2011-2015 ............. 26
Shade Tobacco (Type 61) Area Harvested, Yield, Production, Price, and Value — New England: 2011-2015 ................... 27

2 New England Agricultural Statistics USDA, National Agricultural Statistics Service
Table of Contents
Field Crops Cont.
All Tobacco Area Harvested, Yield, Production, Price, and Value — New England: 2011-2015 ......................................... 27
Fall Potatoes Acreage, Yield, and Production, by State — United States: 2014-2015 ........................................................... 28
Fall Potatoes Area Planted and Harvested, Yield, Production, Disposition, Price, and Value — New
England: 2011-2015 .............................................................................................................................................................. 29
Potatoes Percent of Acres Planted, by Variety and Type – Maine: 2010-2015 .................................................................... 30
Potatoes Number of Hills per Acre, by Type – Maine: 2011-2015....................................................................................... 30
Potatoes (Round Whites) Percent of Net Yield, by Size Group – Maine: 2010-2015 .......................................................... 30
Long Potatoes (Russet and Shepody) Size Categories – Maine: 2011-2015 ........................................................................ 30
Potatoes (Round Whites and All Long Potatoes) Percent of Net Yield, by Grade and Type – Maine: 2010-2015 .............. 31
Fall Potatoes Harvest Loss, by Type – Maine: 2011-2015 ................................................................................................... 31
Potato Prices Received by Farmers, by Month and Marketing Year Average — Maine: 2011-2015 .................................... 31
Fall Potato Production and Stocks, by Selected Months — Maine: 2011-2015 ..................................................................... 31
Fruits and Vegetables, Fresh Market
Sweet Corn Area Planted and Harvested, Yield, Production, Price, and Value — New England: 2011-2015 ...................... 32
Garlic and Kale for Fresh Market Yield and Price – New England: 2015 ............................................................................ 34
Asparagus for Fresh Market Yield and Price – New England: 2011-2015 ........................................................................... 34
Snap Beans, Beets, and Broccoli for Fresh Market Yield and Price – New England: 2011-2015 ........................................ 35
Cabbage, Cantaloupe, and Carrots for Fresh Market Yield and Price – New England: 2011-2015 ..................................... 36
Cauliflower, Cucumbers, and Eggplant for Fresh Market Yield and Price – New England: 2011-2015 ............................. 37
Lettuce, by Type for Fresh Market Yield and Price – New England: 2011-2015 ................................................................. 38
Onions, by Type and Green Peas for Fresh Market Yield and Price – New England: 2011-2015 ....................................... 39
Peppers, by Type and Pumpkins for Fresh Market Yield and Price – New England: 2011-2015 ........................................ 40
Rutabaga and Squash, by Type for Fresh Market Yield and Price – New England: 2011-2015 .......................................... 41
Spinach, Tomatoes, and Watermelon for Fresh Market Yield and Price – New England: 2011-2015 ................................. 42
Blueberries, Raspberries, and Strawberries for Fresh Market Yield and Price – New England: 2011-2015 ........................ 43
Peaches and Pears for Fresh Market Yield and Price – New England: 2011-2015 .............................................................. 44
Grapes for Fresh Market Acreage, Yield, Production, Price and Value – New England: 2015 ........................................... 44
Fruit
Apple Acreage, Yield, Production, Price, and Value — New England: 2011-2015 ............................................................... 45
Apple Production, Price, and Value, by Utilization — New England: 2011-2015 ................................................................. 46
Peach Acreage, Yield, Production, Price, and Value — New England: 2011-2015 ............................................................... 47
Cranberry Acreage, Yield, Production, Utilization, Price, and Value — Massachusetts: 2011-2015 .................................... 47
Cranberry Acreage, Yield, Production, Utilization, Price, and Value – Maine: 2011-2015 ................................................. 48
Wild Blueberry Acreage, Yield, Production, Price, and Value, by Utilization — Maine: 2011-2015 ................................... 48
Livestock
Cattle and Calves
Cattle and Calves Number on Farms, January 1, Inventory Value and Value per Head — New
England: 2012-2016 .............................................................................................................................................................. 49
Cattle and Calves Inventory, Supply, and Disposition — New England: 2011-2015 ............................................................ 50
All Cattle and Calves Production and Income — New England: 2011-2015 ......................................................................... 51
Licensed Dairy Herds — New England: 2011-2015............................................................................................................... 52
All Cattle and Calves Number on Farms, January 1, by County — Vermont: 2012-2016 ..................................................... 52
Milk Cows Number on Farms, January 1, by County — Vermont: 2012-2016 ..................................................................... 52

New England Agricultural Statistics 3 USDA, National Agricultural Statistics Service
Table of Contents
Dairy
Annual Milk Production and Value — New England: 2011-2015 ......................................................................................... 53
Annual Milk and Cream Marketings, Price, and Income — New England: 2011-2015 ........................................................ 54
Annual Milk Used Where Produced and Gross Producer Income — New England: 2011-2015........................................... 55
Milk Cows and Production, by Quarter — New England: 2011-2015 ................................................................................... 56
Milk Cows and Production, by Month — Vermont: 2011-2015 ............................................................................................ 57
Annual Average Milk Price — New England: 2011-2015 ..................................................................................................... 58
Milk, Wholesale Prices Received by Farmers, by Month and Marketing Year Average — Vermont: 2011-2015................ 58
Dairy Plants Manufacturing One or More Dairy Products — New England: 2011-2015 ...................................................... 58
Milk Production Costs and Returns per Hundredweight Sold – New England: 2014–2015 ................................................ 59
Hogs and Pigs
Hogs and Pigs Inventory by Class, Value, and Value per Head, December 1 — New England: 2011-2015 ........................ 60
Hogs and Pigs Inventory, Supply, and Disposition — New England: 2011-2015 ................................................................. 61
Hogs and Pigs Production, Marketings, and Income — New England: 2011-2015 .............................................................. 62
Sheep and Lambs
Sheep and Lambs Inventory by Class, Value, and Value per Head, January 1 — New England: 2012-2016 ....................... 63
Sheep and Lambs Inventory, Supply, Disposition, and Income — New England: 2011-2015 .............................................. 63
Sheep and Lambs Wool Production, Price, and Value — New England: 2011-2015 ............................................................ 63
Goats
Goats Number on Farms, January 1, by Type — New England: 2012-2016 ......................................................................... 63
Poultry
Chickens Number on Farms, Inventory Value, and Value per Head, December 1 — New England: 2011-2015 ................. 64
Chickens Sold and Value of Sales — New England: 2011-2015 ........................................................................................... 65
Egg Production and Value of Sales — New England: 2011-2015 ......................................................................................... 66
Chickens Average Number of All Layers on Hand During the Month — New England: 2011-2015 ................................... 67
Number of Eggs Layed per 100 for All Layers During the Month — New England: 2011-2015 ......................................... 67
Total Egg Production, by Month — New England: 2011-2015 ............................................................................................. 67
Specialty Commodities
Maple Syrup
Maple Syrup Taps, Yield, Price, and Production — New England: 2011-2015..................................................................... 68
Maple Syrup Price by Type of Sales and Size of Container – Selected States: 2014-2015 .................................................. 71
Maple Syrup Bulk Price – Selected States: 2014-2015 ........................................................................................................ 71
Maple Syrup Percent of Sales by Type – Selected States: 2014-2015 ................................................................................. 72
Bee and Honey
Honey Number of Colonies, Yield, Production, Stocks, Price, and Value — New England: 2011-2015 .............................. 72
Honey Bee Number of Colonies, Maximum, Lost, Percent Lost, Added, Renovated, and Percent Renovated — Northeast and United States: January 1, 2016 and January-March 2016.............................................................................. 73
Cold Storage and Slaughter
Stocks in Cold Storage, by Month – New England: 2011-2015 ........................................................................................... 74
Butter in Cold Storage, by Month – United States: 2011-2015 ............................................................................................ 74
Commercial Livestock Slaughter Plants, Number Slaughtered, and Weight – New England: 2011-2015 .......................... 75

4 New England Agricultural Statistics USDA, National Agricultural Statistics Service
Table of Contents
Resources
New England Agricultural Directory .................................................................................................................................... 76
Customer Service .................................................................................................................................................................. 85
National Reports.................................................................................................................................................................... 86
New England Agricultural Statistics 5 USDA, National Agricultural Statistics Service
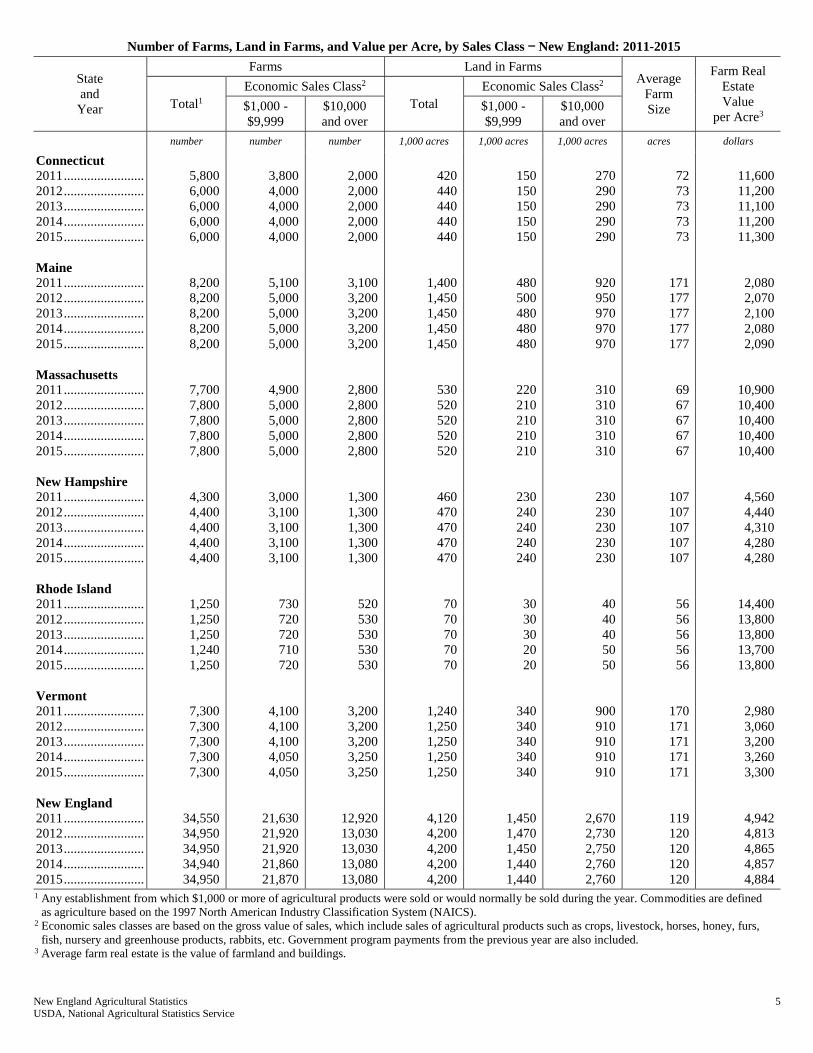
Number of Farms, Land in Farms, and Value per Acre, by Sales Class — New England: 2011-2015
State
and
Year
Farms Land in Farms Average
Farm
Size
Farm Real
Estate
Value
per Acre3 Total1
Economic Sales Class2
Total
Economic Sales Class2
$1,000 -
$9,999
$10,000
and over
$1,000 -
$9,999
$10,000
and over
number number number 1,000 acres 1,000 acres 1,000 acres acres dollars
Connecticut 2011 ........................
2012 ........................
2013 ........................
2014 ........................
2015 ........................
Maine 2011 ........................
2012 ........................
2013 ........................
2014 ........................
2015 ........................
Massachusetts 2011 ........................
2012 ........................
2013 ........................
2014 ........................
2015 ........................
New Hampshire 2011 ........................
2012 ........................
2013 ........................
2014 ........................
2015 ........................
Rhode Island 2011 ........................
2012 ........................
2013 ........................
2014 ........................
2015 ........................
Vermont 2011 ........................
2012 ........................
2013 ........................
2014 ........................
2015 ........................
New England 2011 ........................
2012 ........................
2013 ........................
2014 ........................
2015 ........................
5,800
6,000
6,000
6,000
6,000
8,200
8,200
8,200
8,200
8,200
7,700
7,800
7,800
7,800
7,800
4,300
4,400
4,400
4,400
4,400
1,250
1,250
1,250
1,240
1,250
7,300
7,300
7,300
7,300
7,300
34,550
34,950
34,950
34,940
34,950
3,800
4,000
4,000
4,000
4,000
5,100
5,000
5,000
5,000
5,000
4,900
5,000
5,000
5,000
5,000
3,000
3,100
3,100
3,100
3,100
730
720
720
710
720
4,100
4,100
4,100
4,050
4,050
21,630
21,920
21,920
21,860
21,870
2,000
2,000
2,000
2,000
2,000
3,100
3,200
3,200
3,200
3,200
2,800
2,800
2,800
2,800
2,800
1,300
1,300
1,300
1,300
1,300
520
530
530
530
530
3,200
3,200
3,200
3,250
3,250
12,920
13,030
13,030
13,080
13,080
420
440
440
440
440
1,400
1,450
1,450
1,450
1,450
530
520
520
520
520
460
470
470
470
470
70
70
70
70
70
1,240
1,250
1,250
1,250
1,250
4,120
4,200
4,200
4,200
4,200
150
150
150
150
150
480
500
480
480
480
220
210
210
210
210
230
240
240
240
240
30
30
30
20
20
340
340
340
340
340
1,450
1,470
1,450
1,440
1,440
270
290
290
290
290
920
950
970
970
970
310
310
310
310
310
230
230
230
230
230
40
40
40
50
50
900
910
910
910
910
2,670
2,730
2,750
2,760
2,760
72
73
73
73
73
171
177
177
177
177
69
67
67
67
67
107
107
107
107
107
56
56
56
56
56
170
171
171
171
171
119
120
120
120
120
11,600
11,200
11,100
11,200
11,300
2,080
2,070
2,100
2,080
2,090
10,900
10,400
10,400
10,400
10,400
4,560
4,440
4,310
4,280
4,280
14,400
13,800
13,800
13,700
13,800
2,980
3,060
3,200
3,260
3,300
4,942
4,813
4,865
4,857
4,884 1 Any establishment from which $1,000 or more of agricultural products were sold or would normally be sold during the year. Commodities are defined
as agriculture based on the 1997 North American Industry Classification System (NAICS). 2 Economic sales classes are based on the gross value of sales, which include sales of agricultural products such as crops, livestock, horses, honey, furs,
fish, nursery and greenhouse products, rabbits, etc. Government program payments from the previous year are also included. 3 Average farm real estate is the value of farmland and buildings.

6 New England Agricultural Statistics USDA, National Agricultural Statistics Service
Farm Real Estate and Agricultural Land Value per Acre — New England: 2011-2015
Year Farm Real Estate
Value per Acre1 2
Cropland
Value per Acre2
Pastureland
Value per Acre3
dollars dollars dollars
2011 ................................
2012 ................................
2013 ................................
2014 ................................
2015 ................................
4,942
4,813
4,865
4,857
4,884
7,170
7,120
7,060
7,020
7,090
5,730
5,760
5,840
5,790
5,840
1 Average farm real estate is the value of farmland and buildings. 2 Includes Connecticut, Maine, Massachusetts, New Hampshire, Rhode Island, and Vermont. 3 Includes Connecticut, Delaware, Maine, Maryland (prior to 2014), Massachusetts, New Hampshire, Rhode Island, and Vermont.
0
1,000
2,000
3,000
4,000
5,000
6,000
CT ME MA NH RI VT
Nu
mb
er
of
Farm
s
Number of Farms, by Economic Sales Class —New England States: 2015
$1,000 - $9,999
$10,000 and Over
New England Agricultural Statistics 7 USDA, National Agricultural Statistics Service
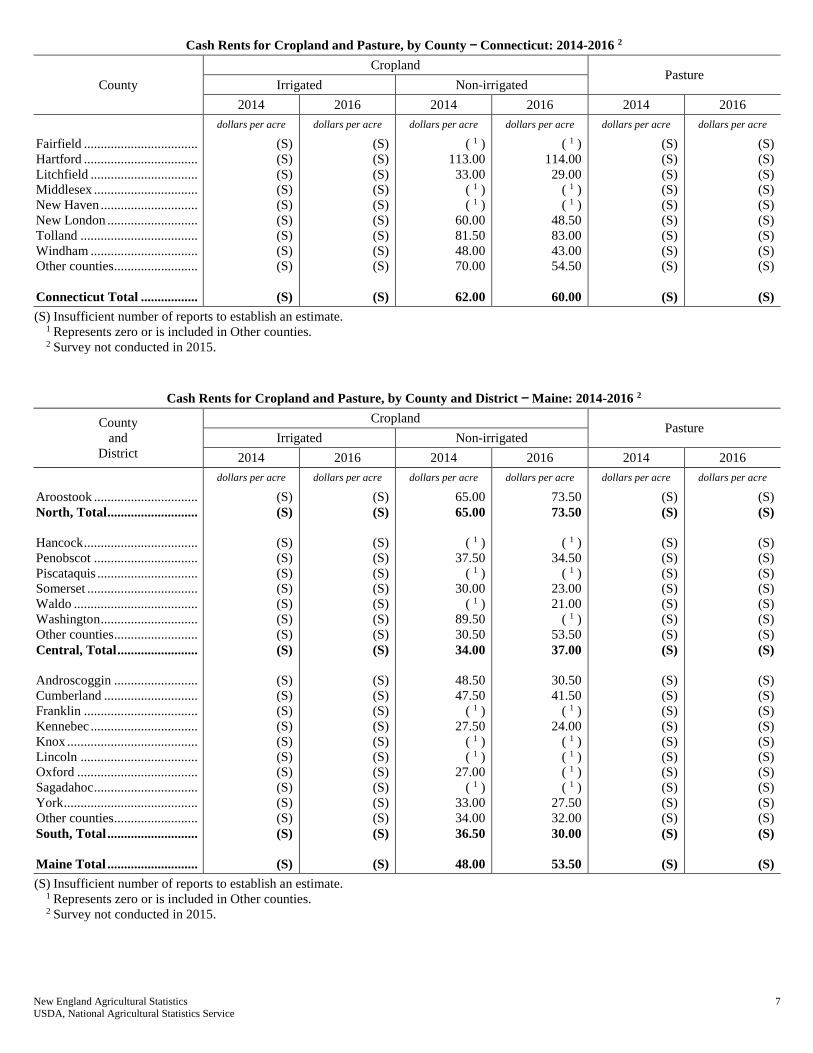
Cash Rents for Cropland and Pasture, by County — Connecticut: 2014-2016 2
County
Cropland Pasture
Irrigated Non-irrigated
2014 2016 2014 2016 2014 2016
dollars per acre dollars per acre dollars per acre dollars per acre dollars per acre dollars per acre
Fairfield ..................................
Hartford ..................................
Litchfield ................................
Middlesex ...............................
New Haven .............................
New London ...........................
Tolland ...................................
Windham ................................
Other counties .........................
Connecticut Total .................
(S)
(S)
(S)
(S)
(S)
(S)
(S)
(S)
(S)
(S)
(S)
(S)
(S)
(S)
(S)
(S)
(S)
(S)
(S)
(S)
( 1 )
113.00
33.00
( 1 )
( 1 )
60.00
81.50
48.00
70.00
62.00
( 1 )
114.00
29.00
( 1 )
( 1 )
48.50
83.00
43.00
54.50
60.00
(S)
(S)
(S)
(S)
(S)
(S)
(S)
(S)
(S)
(S)
(S)
(S)
(S)
(S)
(S)
(S)
(S)
(S)
(S)
(S)
(S) Insufficient number of reports to establish an estimate. 1 Represents zero or is included in Other counties. 2 Survey not conducted in 2015.
Cash Rents for Cropland and Pasture, by County and District — Maine: 2014-2016 2
County
and
District
Cropland Pasture
Irrigated Non-irrigated
2014 2016 2014 2016 2014 2016
dollars per acre dollars per acre dollars per acre dollars per acre dollars per acre dollars per acre
Aroostook ...............................
North, Total ...........................
Hancock ..................................
Penobscot ...............................
Piscataquis ..............................
Somerset .................................
Waldo .....................................
Washington .............................
Other counties .........................
Central, Total ........................
Androscoggin .........................
Cumberland ............................
Franklin ..................................
Kennebec ................................
Knox .......................................
Lincoln ...................................
Oxford ....................................
Sagadahoc ...............................
York ........................................
Other counties .........................
South, Total ...........................
Maine Total ...........................
(S)
(S)
(S)
(S)
(S)
(S)
(S)
(S)
(S)
(S)
(S)
(S)
(S)
(S)
(S)
(S)
(S)
(S)
(S)
(S)
(S)
(S)
(S)
(S)
(S)
(S)
(S)
(S)
(S)
(S)
(S)
(S)
(S)
(S)
(S)
(S)
(S)
(S)
(S)
(S)
(S)
(S)
(S)
(S)
65.00
65.00
( 1 )
37.50
( 1 )
30.00
( 1 )
89.50
30.50
34.00
48.50
47.50
( 1 )
27.50
( 1 )
( 1 )
27.00
( 1 )
33.00
34.00
36.50
48.00
73.50
73.50
( 1 )
34.50
( 1 )
23.00
21.00
( 1 )
53.50
37.00
30.50
41.50
( 1 )
24.00
( 1 )
( 1 )
( 1 )
( 1 )
27.50
32.00
30.00
53.50
(S)
(S)
(S)
(S)
(S)
(S)
(S)
(S)
(S)
(S)
(S)
(S)
(S)
(S)
(S)
(S)
(S)
(S)
(S)
(S)
(S)
(S)
(S)
(S)
(S)
(S)
(S)
(S)
(S)
(S)
(S)
(S)
(S)
(S)
(S)
(S)
(S)
(S)
(S)
(S)
(S)
(S)
(S)
(S)
(S) Insufficient number of reports to establish an estimate. 1 Represents zero or is included in Other counties. 2 Survey not conducted in 2015.
8 New England Agricultural Statistics USDA, National Agricultural Statistics Service
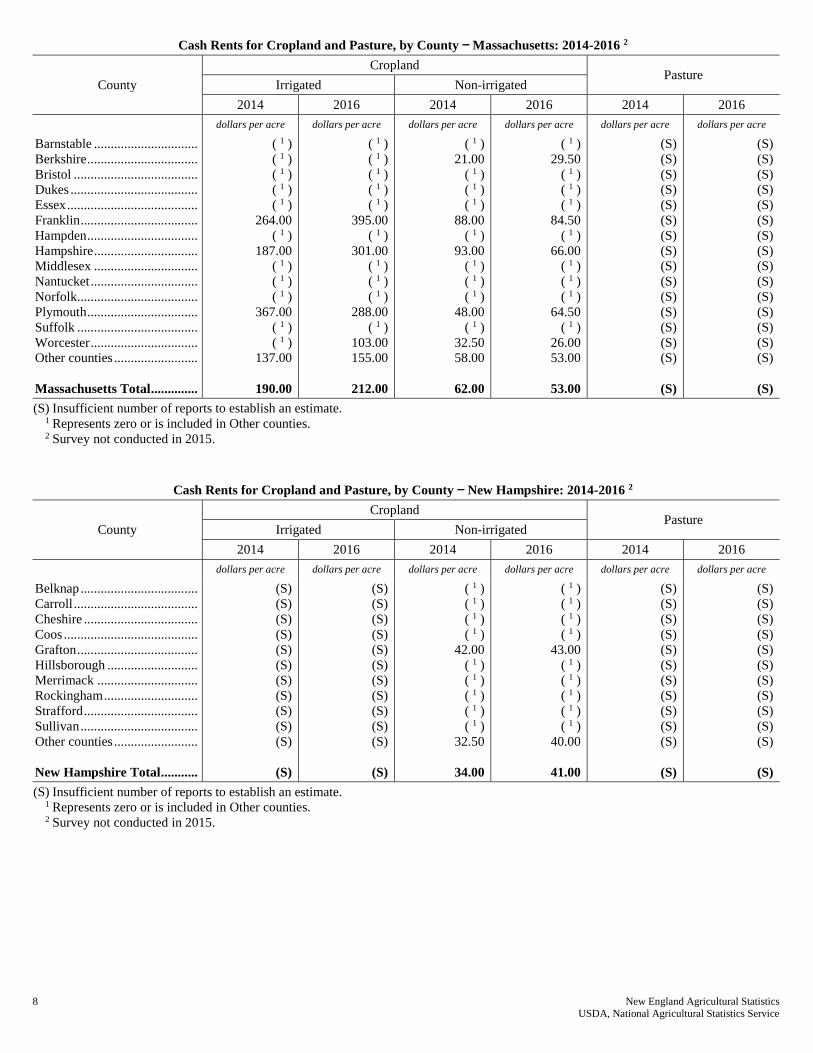
Cash Rents for Cropland and Pasture, by County — Massachusetts: 2014-2016 2
County
Cropland Pasture
Irrigated Non-irrigated
2014 2016 2014 2016 2014 2016
dollars per acre dollars per acre dollars per acre dollars per acre dollars per acre dollars per acre
Barnstable ...............................
Berkshire .................................
Bristol .....................................
Dukes ......................................
Essex .......................................
Franklin ...................................
Hampden .................................
Hampshire ...............................
Middlesex ...............................
Nantucket ................................
Norfolk....................................
Plymouth .................................
Suffolk ....................................
Worcester ................................
Other counties .........................
Massachusetts Total ..............
( 1 )
( 1 )
( 1 )
( 1 )
( 1 )
264.00
( 1 )
187.00
( 1 )
( 1 )
( 1 )
367.00
( 1 )
( 1 )
137.00
190.00
( 1 )
( 1 )
( 1 )
( 1 )
( 1 )
395.00
( 1 )
301.00
( 1 )
( 1 )
( 1 )
288.00
( 1 )
103.00
155.00
212.00
( 1 )
21.00
( 1 )
( 1 )
( 1 )
88.00
( 1 )
93.00
( 1 )
( 1 )
( 1 )
48.00
( 1 )
32.50
58.00
62.00
( 1 )
29.50
( 1 )
( 1 )
( 1 )
84.50
( 1 )
66.00
( 1 )
( 1 )
( 1 )
64.50
( 1 )
26.00
53.00
53.00
(S)
(S)
(S)
(S)
(S)
(S)
(S)
(S)
(S)
(S)
(S)
(S)
(S)
(S)
(S)
(S)
(S)
(S)
(S)
(S)
(S)
(S)
(S)
(S)
(S)
(S)
(S)
(S)
(S)
(S)
(S)
(S)
(S) Insufficient number of reports to establish an estimate. 1 Represents zero or is included in Other counties. 2 Survey not conducted in 2015.
Cash Rents for Cropland and Pasture, by County — New Hampshire: 2014-2016 2
County
Cropland Pasture
Irrigated Non-irrigated
2014 2016 2014 2016 2014 2016
dollars per acre dollars per acre dollars per acre dollars per acre dollars per acre dollars per acre
Belknap ...................................
Carroll .....................................
Cheshire ..................................
Coos ........................................
Grafton ....................................
Hillsborough ...........................
Merrimack ..............................
Rockingham ............................
Strafford ..................................
Sullivan ...................................
Other counties .........................
New Hampshire Total ...........
(S)
(S)
(S)
(S)
(S)
(S)
(S)
(S)
(S)
(S)
(S)
(S)
(S)
(S)
(S)
(S)
(S)
(S)
(S)
(S)
(S)
(S)
(S)
(S)
( 1 )
( 1 )
( 1 )
( 1 )
42.00
( 1 )
( 1 )
( 1 )
( 1 )
( 1 )
32.50
34.00
( 1 )
( 1 )
( 1 )
( 1 )
43.00
( 1 )
( 1 )
( 1 )
( 1 )
( 1 )
40.00
41.00
(S)
(S)
(S)
(S)
(S)
(S)
(S)
(S)
(S)
(S)
(S)
(S)
(S)
(S)
(S)
(S)
(S)
(S)
(S)
(S)
(S)
(S)
(S)
(S)
(S) Insufficient number of reports to establish an estimate. 1 Represents zero or is included in Other counties. 2 Survey not conducted in 2015.
New England Agricultural Statistics 9 USDA, National Agricultural Statistics Service
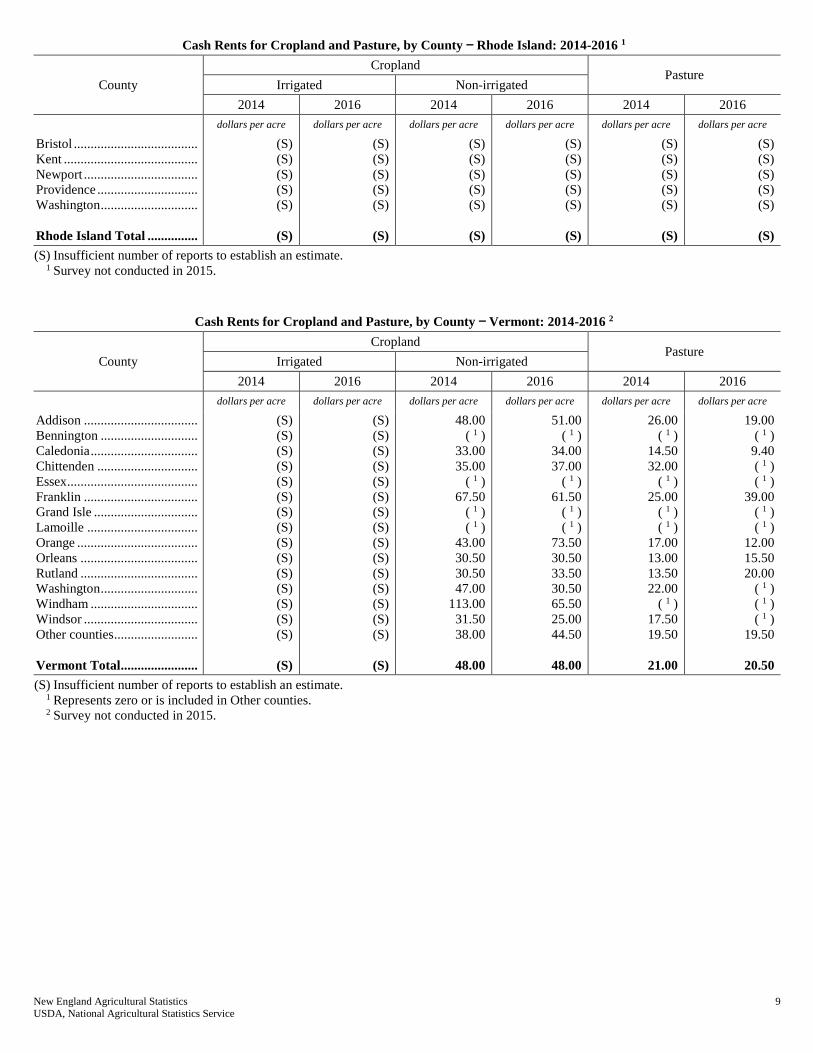
Cash Rents for Cropland and Pasture, by County — Rhode Island: 2014-2016 1
County
Cropland Pasture
Irrigated Non-irrigated
2014 2016 2014 2016 2014 2016
dollars per acre dollars per acre dollars per acre dollars per acre dollars per acre dollars per acre
Bristol .....................................
Kent ........................................
Newport ..................................
Providence ..............................
Washington .............................
Rhode Island Total ...............
(S)
(S)
(S)
(S)
(S)
(S)
(S)
(S)
(S)
(S)
(S)
(S)
(S)
(S)
(S)
(S)
(S)
(S)
(S)
(S)
(S)
(S)
(S)
(S)
(S)
(S)
(S)
(S)
(S)
(S)
(S)
(S)
(S)
(S)
(S)
(S)
(S) Insufficient number of reports to establish an estimate. 1 Survey not conducted in 2015.
Cash Rents for Cropland and Pasture, by County — Vermont: 2014-2016 2
County
Cropland Pasture
Irrigated Non-irrigated
2014 2016 2014 2016 2014 2016
dollars per acre dollars per acre dollars per acre dollars per acre dollars per acre dollars per acre
Addison ..................................
Bennington .............................
Caledonia ................................
Chittenden ..............................
Essex .......................................
Franklin ..................................
Grand Isle ...............................
Lamoille .................................
Orange ....................................
Orleans ...................................
Rutland ...................................
Washington .............................
Windham ................................
Windsor ..................................
Other counties .........................
Vermont Total .......................
(S)
(S)
(S)
(S)
(S)
(S)
(S)
(S)
(S)
(S)
(S)
(S)
(S)
(S)
(S)
(S)
(S)
(S)
(S)
(S)
(S)
(S)
(S)
(S)
(S)
(S)
(S)
(S)
(S)
(S)
(S)
(S)
48.00
( 1 )
33.00
35.00
( 1 )
67.50
( 1 )
( 1 )
43.00
30.50
30.50
47.00
113.00
31.50
38.00
48.00
51.00
( 1 )
34.00
37.00
( 1 )
61.50
( 1 )
( 1 )
73.50
30.50
33.50
30.50
65.50
25.00
44.50
48.00
26.00
( 1 )
14.50
32.00
( 1 )
25.00
( 1 )
( 1 )
17.00
13.00
13.50
22.00
( 1 )
17.50
19.50
21.00
19.00
( 1 )
9.40
( 1 )
( 1 )
39.00
( 1 )
( 1 )
12.00
15.50
20.00
( 1 )
( 1 )
( 1 )
19.50
20.50
(S) Insufficient number of reports to establish an estimate. 1 Represents zero or is included in Other counties. 2 Survey not conducted in 2015.

10 New England Agricultural Statistics USDA, National Agricultural Statistics Service
Farm Production Expenditures, Major Input Items, Average per Farm, and Total — Atlantic Region and United States: 2013-2014
Expenditure Farms Reporting1 Average per Farm2 Total Expenditures
2013 2014 2013 2014 2013 2014
percent percent dollars dollars million
dollars
million
dollars
Atlantic Region3 Livestock, Poultry, and Related Expenses4 ...........................
Feed ......................................................................................
Farm Services5 ......................................................................
Rent6 .....................................................................................
Agricultural Chemicals7 ........................................................
Fertilizer, Lime, and Soil Conditioners7 ...............................
Interest ..................................................................................
Taxes (Real Estate and Property)8 ........................................
Labor .....................................................................................
Fuels9 ....................................................................................
Farm Supplies and Repairs10 .................................................
Farm Improvements and Construction11 ...............................
Tractors and Self-Propelled Farm Machinery .......................
Other Farm Machinery ..........................................................
Seeds and Plants12 .................................................................
Trucks and Autos ..................................................................
Miscellaneous Capital Expenses13 ........................................
Total Farm Production Expenditures14 ............................
United States15 Livestock, Poultry, and Related Expenses4 ...........................
Feed ......................................................................................
Farm Services5 ......................................................................
Rent6 .....................................................................................
Agricultural Chemicals7 ........................................................
Fertilizer, Lime, and Soil Conditioners7 ...............................
Interest ..................................................................................
Taxes (Real Estate and Property)8 ........................................
Labor .....................................................................................
Fuels9 ....................................................................................
Farm Supplies and Repairs10 .................................................
Farm Improvements and Construction11 ...............................
Tractors and Self-Propelled Farm Machinery .......................
Other Farm Machinery ..........................................................
Seeds and Plants12 .................................................................
Trucks and Autos ..................................................................
Miscellaneous Capital Expenses13 ........................................
Total Farm Production Expenditures14 ............................
25.8
57.9
91.0
24.8
34.7
50.3
23.4
100.0
27.0
84.5
81.9
54.3
14.3
18.7
37.9
12.7
1.5
100.0
25.0
54.0
90.0
30.5
39.1
48.3
28.6
99.5
26.8
82.4
78.5
49.3
15.5
17.6
39.4
13.5
1.5
100.0
25.7
59.2
90.6
20.8
35.0
49.5
27.9
99.9
22.4
87.5
84.9
55.3
16.2
17.2
37.8
13.2
1.6
100.0
24.7
53.3
90.1
28.7
39.8
50.1
32.4
99.8
25.7
82.0
78.7
49.7
16.5
17.9
39.9
15.1
1.8
100.0
10,346
26,011
10,587
3,730
3,008
6,280
2,190
3,633
11,213
5,294
6,545
5,919
5,342
2,526
4,788
1,684
192
109,288
16,321
29,779
18,612
14,985
6,967
13,505
4,152
5,584
15,271
7,826
8,924
7,922
8,161
4,200
10,451
2,381
229
175,270
11,123
25,705
12,792
4,377
3,192
6,336
2,708
4,764
10,906
5,296
7,254
6,529
5,126
2,878
5,296
2,080
169
116,530
21,722
30,680
21,818
15,701
7,610
13,486
4,672
6,550
16,472
8,043
9,585
8,766
8,140
4,335
10,644
2,986
289
191,500
4,300
10,810
4,400
1,550
1,250
2,610
910
1,510
4,660
2,200
2,720
2,460
2,220
1,050
1,990
700
80
45,420
34,200
62,400
39,000
31,400
14,600
28,300
8,700
11,700
32,000
16,400
18,700
16,600
17,100
8,800
21,900
4,990
480
367,270
4,600
10,630
5,290
1,810
1,320
2,620
1,120
1,970
4,510
2,190
3,000
2,700
2,120
1,190
2,190
860
70
48,190
45,100
63,700
45,300
32,600
15,800
28,000
9,700
13,600
34,200
16,700
19,900
18,200
16,900
9,000
22,100
6,200
600
397,600 1 Number of farms reporting item divided by total number of farms. 2 Total expenditures divided by total number of farms. Items may not sum to total due to rounding. 3 Atlantic Region consists of CT, DE, KY, ME, MD, MA, NH, NJ, NY, NC, PA, RI, TN, VA, VT, WV. 4 Includes purchases and leasing of livestock and poultry. 5 Includes all crop custom work, veterinary custom services, transportation costs, marketing charges, insurance, leasing of machinery and equipment, general and
miscellaneous business expenses, and utilities. 6 Includes cash rent paid, share rent, plus public and private grazing fees. 7 Includes material and application costs. 8 The sum of real estate taxes and personal property taxes for operator, landlord, and contractor. 9 Includes all other fuels not specifically listed in the questionnaire (natural gas, coal, fuel oil, kerosene, wood, etc.). 10 Includes bedding/litter, marketing containers, power farm shop equipment, oil and lubricants, temporary fencing, miscellaneous non-capital equipment and supplies,
repairs and maintenance of equipment not depreciated, and other small, non-capital equipment. 11 Includes all expenditures related to new construction or repairs of buildings, fences, operator dwelling (if dwelling is owned by operation), and any improvements to
physical structures of land. 12 Includes all purchases of seed, plants, or seed treatments for nursery or farming operation. Excludes bedding plants, nursery stock, and seed purchased for resale. 13 Records any capital expenses not recorded in specific items on the questionnaire. It was estimated for the first time in 2005. Due to the small size of this expense, a zero in
this line-item denotes less than 5 million dollars. Average value derived from expenditure rounding to zero will also be zero. 14 Includes landlord and contractor share of farm production expenses. May not add due to rounding. 15 United States excludes AK and HI.

New England Agricultural Statistics 11 USDA, National Agricultural Statistics Service
Atlantic: CT, DE, KY, ME, MD, MA, NH, NC, NJ, NY, PA, RI, TN, VA, VT, WV
Midwest: IL, IN, IA, MI, MN, MO, OH, WI
Plains: KS, NE, ND, OK, SD, TX
South: AL, AR, FL, GA, LA, MS, SC
West: AZ, CA, CO, ID, MT, NV, NM, OR, UT, WA, WY
Atlantic$48,190
South$40,500
Midwest$124,030
Plains$99,620
West$85,260
2014 UNITED STATES FARM PRODUCTION EXPENDITURES, BY REGION
(MILLION DOLLARS)
0
20
40
60
80
100
120
140
0
10
20
30
40
50
60
2010 2011 2012 2013 2014
Average in
Thousand Dollars
per Farm
Total in
Billion Dollars
Atlantic Region Farm Production ExpendituresTotal and Average per Farm: 2010-2014
Total Avg

12 New England Agricultural Statistics USDA, National Agricultural Statistics Service
Quarterly and Annual Agricultural Labor Wage Rates for Hired Workers, Number of Workers,
and Hours Worked — Northeast: 2011-2015 1
Month
and
Year
Wage Rates by Type of Work Number of
Hired
Workers
Hours Worked
per Week by
Hired
Workers
All
Hired
Workers
Field and
Livestock
Workers
Field
Workers
Livestock
Workers
dollars per hour dollars per hour dollars per hour dollars per hour 1,000 hours
January
2011 .............
2012 .............
2013 .............
2014 .............
2015 .............
April
2011 .............
2012 .............
2013 .............
2014 .............
2015 .............
July
2011 .............
2012 .............
2013 .............
2014 .............
2015 .............
October
2011 .............
2012 .............
2013 .............
2014 .............
2015 .............
Annual
2011 .............
2012 .............
2013 .............
2014 .............
2015 .............
11.25
11.65
12.45
12.38
12.67
( 2 )
11.70
12.40
12.20
12.39
11.00
11.21
11.72
12.04
12.41
11.84
11.38
11.72
12.09
12.97
11.20
11.43
11.97
12.15
12.63
10.45
11.00
11.55
10.95
11.45
( 2 )
11.05
11.40
11.15
11.25
10.35
10.80
11.00
11.30
11.65
11.30
10.90
11.20
11.45
12.25
10.56
10.91
11.22
11.26
11.74
10.75
11.62
11.69
11.46
11.87
( 2 )
11.52
11.41
11.28
11.40
10.63
10.91
11.12
11.60
11.81
11.36
10.99
11.36
11.77
12.25
10.75
11.12
11.32
11.57
11.90
10.28
10.48
11.46
10.62
11.15
( 2 )
10.30
11.38
10.96
11.06
9.83
10.49
10.74
10.73
11.38
11.18
10.66
10.74
10.74
12.24
( 3 )
( 3 )
( 3 )
( 3 )
( 3 )
28.0
21.0
23.0
23.0
23.0
( 2 )
30.0
35.0
36.0
31.0
38.0
50.0
55.0
47.0
50.0
40.0
47.0
54.0
45.0
49.0
35.3
37.0
41.8
37.8
38.3
41.1
41.3
41.0
40.3
40.6
( 2 )
41.9
40.0
41.8
39.8
41.3
40.9
38.2
39.7
40.6
41.8
41.0
41.0
41.0
40.8
41.0
41.2
39.9
40.7
40.5
1 Estimates reflect actual payroll data for the week which includes the 12th of the month. Excludes perquisites. Northeast is New York and
New England combined. 2 Not available due to budget constraints. 3 Insufficient data for this category.

New England Agricultural Statistics 13 USDA, National Agricultural Statistics Service
Quarterly Agricultural Labor Wage Rates by Type of Farm and Economic Class — Northeast: 2011-2015 1
Month
and
Year
Field and Livestock Workers Combined
By Type of Farm
All Hired Workers
By Economic Class of Farm
Field
Crops
Other
Crops
Livestock
and
Poultry
All
Farms
Gross Value of Sales in $1,000's All
Farms <$50 $50-99 $100-249 $250-499
dollars per
hour
dollars per
hour
dollars per
hour
dollars per
hour
dollars per
hour
dollars per
hour
dollars per
hour
dollars per
hour
dollars per
hour
January
2011 .......
2012 .......
2013 .......
2014 .......
2015 .......
April
2011 .......
2012 .......
2013 .......
2014 .......
2015 .......
July
2011 .......
2012 .......
2013 .......
2014 .......
2015 .......
October
2011 .......
2012 .......
2013 .......
2014 .......
2015 .......
9.73
14.94
12.55
12.48
12.13
( 2 )
13.70
10.72
14.10
12.86
9.42
12.12
12.62
11.46
12.15
9.75
12.82
13.49
11.92
12.40
10.92
11.00
11.03
12.11
12.41
( 2 )
10.61
11.05
11.23
11.46
10.38
10.58
10.72
10.91
11.43
10.85
11.08
11.00
11.35
12.11
11.71
10.18
11.52
10.82
11.22
( 2 )
10.05
11.70
11.46
11.20
10.09
11.45
10.74
11.11
11.65
10.92
11.22
10.91
11.37
12.03
10.85
10.72
11.38
11.43
11.64
( 2 )
10.55
11.35
11.43
11.38
10.21
10.88
10.88
11.01
11.57
10.79
11.21
11.14
11.37
12.09
(D)
14.67
15.22
12.22
11.01
( 2 )
13.70
15.49
13.04
10.92
11.11
11.25
12.16
11.41
9.89
(D)
11.56
11.94
11.91
10.50
11.00
7.60
14.62
11.94
11.42
( 2 )
7.76
14.13
10.68
10.34
9.65
9.80
10.38
11.73
10.25
9.62
11.27
10.85
11.87
9.98
10.32
11.46
10.53
12.27
13.37
( 2 )
11.36
10.32
12.34
11.98
8.82
9.67
11.89
11.40
10.72
12.16
10.23
11.99
11.79
11.95
9.58
10.31
13.55
12.42
11.89
( 2 )
9.84
12.15
11.70
11.17
10.06
10.22
12.71
10.68
11.60
11.54
10.34
11.61
10.61
11.84
11.87
11.76
12.53
12.59
12.82
( 2 )
11.41
12.42
12.36
12.36
10.98
11.33
11.59
11.66
12.27
11.53
11.74
11.79
12.00
12.83
(D) Withheld to avoid disclosing data for individual operations. 1 Estimates reflect actual payroll data for the week which includes the 12th of the month. Excludes perquisites. Northeast includes
Connecticut, Delaware, Maryland, Maine, Massachusetts, New Hampshire, New Jersey, New York, Pennsylvania, Rhode Island, and
Vermont. 2 Not available due to budget constraints.
14 New England Agricultural Statistics USDA, National Agricultural Statistics Service
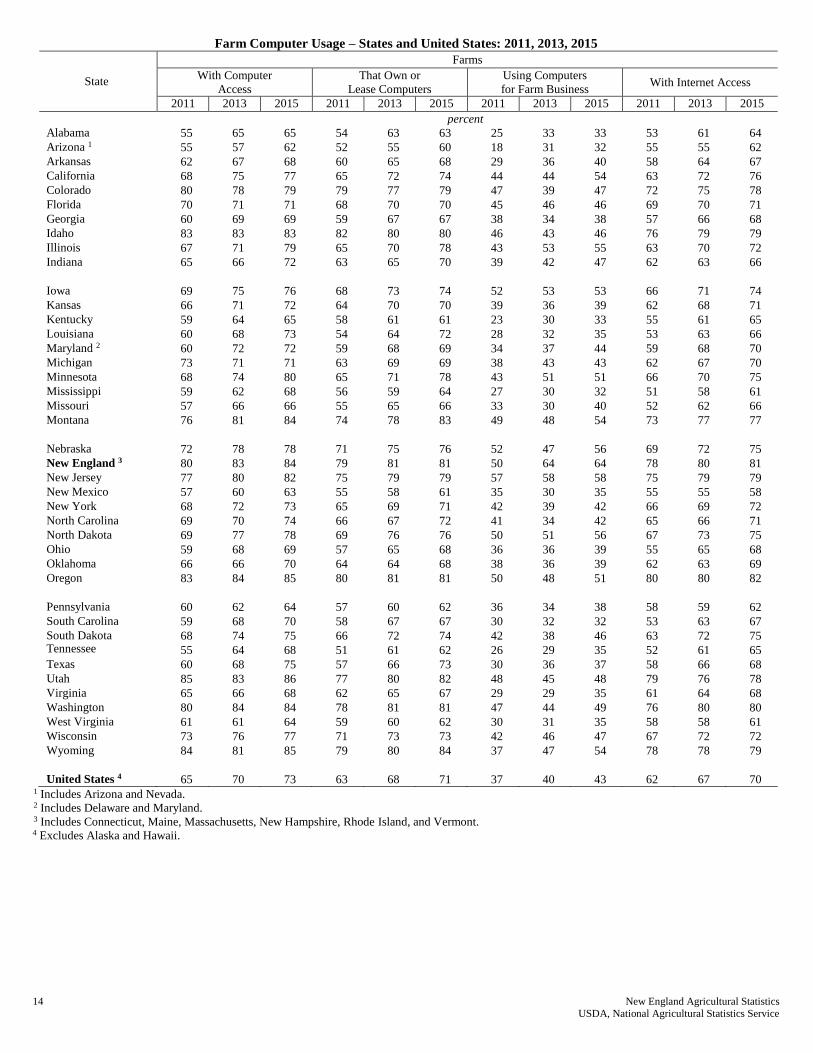
Farm Computer Usage – States and United States: 2011, 2013, 2015
State
Farms
With Computer
Access
That Own or
Lease Computers
Using Computers
for Farm Business With Internet Access
2011 2013 2015 2011 2013 2015 2011 2013 2015 2011 2013 2015
percent
Alabama 55 65 65 54 63 63 25 33 33 53 61 64
Arizona 1 55 57 62 52 55 60 18 31 32 55 55 62
Arkansas 62 67 68 60 65 68 29 36 40 58 64 67
California 68 75 77 65 72 74 44 44 54 63 72 76
Colorado 80 78 79 79 77 79 47 39 47 72 75 78
Florida 70 71 71 68 70 70 45 46 46 69 70 71
Georgia 60 69 69 59 67 67 38 34 38 57 66 68
Idaho 83 83 83 82 80 80 46 43 46 76 79 79
Illinois 67 71 79 65 70 78 43 53 55 63 70 72
Indiana 65 66 72 63 65 70 39 42 47 62 63 66
Iowa 69 75 76 68 73 74 52 53 53 66 71 74
Kansas 66 71 72 64 70 70 39 36 39 62 68 71
Kentucky 59 64 65 58 61 61 23 30 33 55 61 65
Louisiana 60 68 73 54 64 72 28 32 35 53 63 66
Maryland 2 60 72 72 59 68 69 34 37 44 59 68 70
Michigan 73 71 71 63 69 69 38 43 43 62 67 70
Minnesota 68 74 80 65 71 78 43 51 51 66 70 75
Mississippi 59 62 68 56 59 64 27 30 32 51 58 61
Missouri 57 66 66 55 65 66 33 30 40 52 62 66
Montana 76 81 84 74 78 83 49 48 54 73 77 77
Nebraska 72 78 78 71 75 76 52 47 56 69 72 75
New England 3 80 83 84 79 81 81 50 64 64 78 80 81
New Jersey 77 80 82 75 79 79 57 58 58 75 79 79
New Mexico 57 60 63 55 58 61 35 30 35 55 55 58
New York 68 72 73 65 69 71 42 39 42 66 69 72
North Carolina 69 70 74 66 67 72 41 34 42 65 66 71
North Dakota 69 77 78 69 76 76 50 51 56 67 73 75
Ohio 59 68 69 57 65 68 36 36 39 55 65 68
Oklahoma 66 66 70 64 64 68 38 36 39 62 63 69
Oregon 83 84 85 80 81 81 50 48 51 80 80 82
Pennsylvania 60 62 64 57 60 62 36 34 38 58 59 62
South Carolina 59 68 70 58 67 67 30 32 32 53 63 67
South Dakota 68 74 75 66 72 74 42 38 46 63 72 75 Tennessee
55 64 68 51 61 62 26 29 35 52 61 65
Texas 60 68 75 57 66 73 30 36 37 58 66 68
Utah 85 83 86 77 80 82 48 45 48 79 76 78
Virginia 65 66 68 62 65 67 29 29 35 61 64 68
Washington 80 84 84 78 81 81 47 44 49 76 80 80
West Virginia 61 61 64 59 60 62 30 31 35 58 58 61
Wisconsin 73 76 77 71 73 73 42 46 47 67 72 72
Wyoming 84 81 85 79 80 84 37 47 54 78 78 79
United States 4 65 70 73 63 68 71 37 40 43 62 67 70 1 Includes Arizona and Nevada. 2 Includes Delaware and Maryland. 3 Includes Connecticut, Maine, Massachusetts, New Hampshire, Rhode Island, and Vermont. 4 Excludes Alaska and Hawaii.
New England Agricultural Statistics 15 USDA, National Agricultural Statistics Service
Farm Computer Usage by Economic Class and Type of Farm – Regions and United States: 2011, 2013, 2015 [Economic class refers to sales and government payments received during the previous year]
Region
Farms
With Computer Access That Own or
Lease Computers Using Computers for Farm Business
With Internet Access
2011 2013 2015 2011 2013 2015 2011 2013 2015 2011 2013 2015
percent
Northeast 1 68 71 72 65 69 71 42 44 45 66 68 69
$1,000-9,999 68 73 75 64 71 73 36 35 38 65 70 72
$10,000-99,999 69 70 72 67 67 70 45 53 53 67 67 69
$100,000 and Over 69 68 68 65 66 66 58 61 61 62 64 64
$100,000-249,999 60 57 57 56 56 56 42 47 47 49 56 56
$250,000 and Over 80 79 79 76 75 76 75 70 70 75 73 73
Crop Farms 69 72 73 67 69 70 42 44 45 67 68 70
Livestock Farms 68 70 71 64 68 69 42 44 46 63 67 68
North Central 2 66 72 73 64 70 72 41 44 46 62 68 70
$1,000-9,999 62 68 69 59 66 68 25 27 28 58 65 67
$10,000-99,999 62 69 71 61 67 68 41 41 44 56 64 67
$100,000 and Over 78 80 80 77 78 78 64 65 67 74 77 78
$100,000-249,999 71 71 71 70 69 69 53 56 59 67 68 69
$250,000 and Over 82 85 85 81 83 83 71 72 72 79 82 82
Crop Farms 68 72 74 66 70 72 44 48 50 63 68 69
Livestock Farms 64 71 73 61 69 69 36 37 40 59 67 68
South 3 61 67 68 59 65 67 31 34 36 58 64 66
$1,000-9,999 58 66 67 56 64 66 25 26 30 55 63 65
$10,000-99,999 63 66 66 60 63 63 36 42 42 59 63 63
$100,000 and Over 75 77 77 72 75 76 55 60 62 70 75 76
$100,000-249,999 67 70 71 63 69 70 43 52 53 62 69 70
$250,000 and Over 80 81 81 77 78 78 66 67 70 75 78 79
Crop Farms 62 68 69 60 65 66 32 35 37 59 64 66
Livestock Farms 61 67 69 59 65 68 30 33 36 58 64 66
West 4 74 77 77 72 75 75 44 43 48 70 73 74
$1,000-9,999 70 73 73 68 71 71 31 29 37 65 69 69
$10,000-99,999 74 77 79 74 75 77 54 53 57 72 73 76
$100,000 and Over 85 86 88 84 85 85 71 68 72 84 83 85
$100,000-249,999 79 80 82 77 79 79 62 60 60 76 76 78
$250,000 and Over 90 90 91 89 89 91 79 73 82 89 87 88
Crop Farms 74 79 81 72 77 78 49 46 54 70 75 77
Livestock Farms 74 75 76 72 73 73 40 40 44 70 71 72
United States 5 65 70 73 63 68 71 37 40 43 62 67 70
$1,000-9,999 61 67 71 59 66 69 27 28 32 58 65 67
$10,000-99,999 63 68 70 62 66 67 41 45 45 60 65 66
$100,000 and Over 77 80 80 77 78 78 63 66 66 76 77 78
$100,000-249,999 68 73 73 68 71 71 52 56 57 67 69 71
$250,000 and Over 84 84 85 83 83 83 72 72 73 82 82 82
Crop Farms 67 71 73 65 69 71 41 45 47 64 68 70
Livestock Farms 63 70 73 62 67 69 34 36 39 61 66 68 1 Includes Connecticut, Maine, Massachusetts, New Hampshire, New Jersey, New York, Pennsylvania, Rhode Island, and Vermont. 2 Includes Illinois, Indiana, Iowa, Kansas, Michigan, Minnesota, Missouri, Nebraska, North Dakota, Ohio, South Dakota, and Wisconsin. 3 Includes Alabama, Arkansas, Delaware, Florida, Georgia, Kentucky, Louisiana, Maryland, Mississippi, North Carolina, Oklahoma, South Carolina,
Tennessee, Texas, Virginia, and West Virginia. 4 Includes Arizona, California, Colorado, Idaho, Montana, Nevada, New Mexico, Oregon, Utah, Washington, and Wyoming. 5 Excludes Alaska and Hawaii.

16 New England Agricultural Statistics USDA, National Agricultural Statistics Service
Primary Method of Internet Access – States and United States: 2011, 2013, 2015
[Primary method of Internet access for those operators who have access to the Internet]
State
Dialup
DSL
Cable
2011 2013 2015 2011 2013 2015 2011 2013 2015
percent
Alabama
Arizona 1
Arkansas
California
Colorado
Florida
Georgia
Idaho
Illinois
Indiana
Iowa
Kansas
Kentucky
Louisiana
Maryland 2
Michigan
Minnesota
Mississippi
Missouri
Montana
Nebraska
New England 3
New Jersey
New Mexico
New York
North Carolina
North Dakota
Ohio
Oklahoma
Oregon
Pennsylvania
South Carolina
South Dakota
Tennessee
Texas
Utah
Virginia
Washington
West Virginia
Wisconsin
Wyoming
United States 4
24
22
7
2
12
15
11
11
9
20
10
5
16
15
11
24
12
16
16
6
8
6
7
15
15
7
4
15
9
9
8
15
9
13
12
4
16
12
15
12
10
12
6
3
6
1
3
1
4
12
2
7
6
6
1
1
4
7
7
8
6
3
3
1
1
4
7
8
4
11
4
6
7
7
6
4
6
1
19
5
7
3
9
5
5
2
5
1
3
1
4
2
2
4
5
2
2
1
1
7
2
3
4
2
1
1
2
2
6
6
3
5
4
7
3
3
4
2
3
1
2
3
2
3
1
3
49
20
43
43
11
36
61
39
31
25
36
35
50
37
23
26
42
35
37
54
34
37
31
38
51
58
49
26
39
32
52
37
39
38
33
40
32
32
37
51
18
38
36
29
41
27
22
44
54
34
26
33
34
25
50
33
20
24
43
47
35
66
38
36
24
61
30
54
31
24
30
29
43
46
40
34
32
53
20
34
34
43
34
35
21
23
35
20
25
43
48
28
26
24
26
25
52
27
18
21
28
31
29
47
27
34
26
28
22
45
34
20
26
23
43
49
27
33
26
32
37
27
50
34
22
30
10
17
11
9
8
15
8
7
8
6
7
16
10
9
22
13
4
12
5
7
5
29
49
14
15
14
13
25
6
10
24
18
9
17
11
13
9
17
9
8
4
11
9
10
10
24
6
7
7
11
17
5
11
18
13
8
23
17
7
10
5
3
5
38
69
6
34
14
30
17
4
15
23
5
8
20
11
11
3
19
12
5
3
13
19
2
14
10
4
18
4
6
14
7
14
17
4
18
26
17
11
8
11
8
8
33
43
5
25
19
16
20
9
7
23
12
16
14
10
15
6
9
11
7
2
12
1Includes Arizona and Nevada. 2Includes Delaware and Maryland. 3Includes Connecticut, Maine, Massachusetts, New Hampshire, Rhode Island, and Vermont. 4Excludes Alaska and Hawaii.
New England Agricultural Statistics 17 USDA, National Agricultural Statistics Service
Primary Method of Internet Access – States and United States: 2011, 2013, 2015
[Primary method of Internet access for those operators who have access to the Internet]
State
Farms
Satellite
Wireless
Other/
unknown
2011 2013 2015 2011 2013 2015 2011 2013 2015
percent
Alabama
Arizona 1
Arkansas
California
Colorado
Florida
Georgia
Idaho
Illinois
Indiana
Iowa
Kansas
Kentucky
Louisiana
Maryland 2
Michigan
Minnesota
Mississippi
Missouri
Montana
Nebraska
New England 3
New Jersey
New Mexico
New York
North Carolina
North Dakota
Ohio
Oklahoma
Oregon
Pennsylvania
South Carolina
South Dakota
Tennessee
Texas
Utah
Virginia
Washington
West Virginia
Wisconsin
Wyoming
United States 4
7
18
19
11
23
9
5
17
19
16
11
22
11
13
10
8
11
21
17
18
15
12
4
13
5
7
13
7
24
17
4
9
9
11
21
20
24
15
18
10
36
15
28
35
11
20
31
19
7
12
19
16
14
17
16
22
18
7
10
17
23
11
12
6
5
14
12
6
9
15
28
23
9
13
9
11
24
5
12
21
20
13
39
17
28
39
22
34
31
18
20
28
23
22
19
20
17
20
20
17
16
20
23
18
23
7
14
41
18
10
11
19
20
23
6
11
15
19
27
19
19
33
17
22
32
21
6
11
14
26
40
15
14
22
31
26
28
20
7
19
30
25
25
10
22
14
36
10
5
16
10
11
16
25
19
26
9
18
29
15
19
15
15
16
16
17
32
20
19
8
21
19
31
13
24
28
31
34
28
29
12
20
30
34
27
12
29
15
34
11
1
9
13
13
19
30
29
21
13
29
27
26
23
28
33
12
25
32
12
24
25
31
20
28
31
16
22
32
33
38
28
34
17
30
31
34
37
34
32
24
39
19
13
19
24
15
27
30
38
37
21
22
33
27
29
28
32
24
18
32
42
29
4
12
6
9
6
10
1
4
2
7
8
2
6
7
4
4
6
6
3
1
2
6
4
4
4
3
5
2
3
6
3
3
5
6
4
8
4
8
5
2
0
4
2
15
11
9
7
16
4
3
5
5
7
5
8
16
5
11
6
6
2
2
8
8
(Z)
6
4
5
7
3
5
6
5
(Z)
10
5
4
2
13
9
2
4
3
6
2
3
4
7
6
4
2
4
2
5
8
2
8
4
4
4
6
4
1
1
2
6
2
5
5
5
9
6
3
3
4
3
5
5
5
5
4
4
2
2
1
5
(Z) Less than half of the unit shown. 1Includes Arizona and Nevada. 2Includes Delaware and Maryland. 3Includes Connecticut, Maine, Massachusetts, New Hampshire, Rhode Island, and Vermont. 4Excludes Alaska and Hawaii.

18 New England Agricultural Statistics USDA, National Agricultural Statistics Service
Average Precipitation, Monthly and Annual by State – New England: 2011-2015 1
State and
Year Jan Feb Mar Apr May Jun Jul Aug Sep Oct Nov Dec
Annual
Total
Inches
CONNECTICUT
2011 3.36 3.84 4.74 5.52 4.87 6.15 2.17 11.56 7.78 5.60 3.57 4.53 63.69
2012 2.86 1.09 1.30 3.00 3.94 4.30 3.78 3.85 5.41 4.36 0.80 4.70 39.39
2013 1.72 3.62 2.35 1.49 4.47 10.60 3.67 3.92 2.84 1.36 3.70 3.65 43.39
2014 2.80 3.42 4.22 4.38 4.79 2.41 4.84 3.05 1.39 4.67 4.16 4.88 45.01
2015 3.47 2.01 3.05 2.74 1.21 6.35 2.81 2.14 3.62 3.31 2.23 4.14 37.08
MAINE
2011 1.89 2.95 4.93 4.75 5.49 4.06 3.69 7.44 3.89 4.97 2.49 3.49 50.04
2012 3.10 1.76 1.94 4.14 4.68 7.58 1.89 4.29 4.91 6.69 1.29 5.11 47.38
2013 1.42 3.06 2.45 1.98 5.67 6.55 4.89 4.60 5.42 1.70 4.11 3.76 45.61
2014 3.41 2.85 3.80 3.44 3.99 4.58 6.65 3.34 1.61 6.20 3.50 6.08 49.45
2015 3.17 1.74 1.78 3.08 2.80 5.80 3.61 3.91 4.83 4.74 2.43 5.31 43.20
MASSACHUSETTS
2011 3.55 4.18 3.89 5.36 3.67 5.45 2.51 9.48 7.26 7.26 3.76 4.45 60.82
2012 3.22 1.08 1.66 2.90 4.79 4.07 2.67 4.80 5.34 4.66 1.14 5.45 41.78
2013 1.92 4.25 3.11 2.21 5.14 9.59 3.86 3.62 3.45 1.48 3.69 4.07 46.39
2014 3.43 4.18 4.51 3.87 3.75 2.80 6.52 3.07 1.43 6.20 4.71 5.61 50.08
2015 4.03 2.99 2.84 2.55 0.96 6.57 3.15 2.95 4.19 3.86 2.48 4.82 41.39
NEW HAMPSHIRE
2011 2.57 3.44 4.87 5.42 5.09 4.44 2.69 9.09 6.03 6.22 3.41 4.23 57.50
2012 3.21 1.14 1.95 3.24 5.74 5.39 2.95 4.76 5.06 5.51 0.80 5.43 45.18
2013 1.98 3.09 2.29 2.44 5.48 7.04 5.90 3.34 5.07 1.55 3.89 3.68 45.75
2014 3.46 3.69 4.11 3.03 4.56 3.91 7.28 3.58 1.63 5.67 3.27 5.47 49.66
2015 3.35 2.42 1.65 2.80 1.94 7.37 3.77 3.69 5.40 4.14 2.38 5.42 44.33
RHODE ISLAND
2011 4.07 4.56 2.52 5.35 3.40 4.41 2.73 8.18 6.37 7.47 4.52 3.99 57.57
2012 3.30 1.17 1.41 3.22 4.57 4.24 3.78 4.17 4.53 3.93 0.99 5.82 41.13
2013 1.86 4.79 2.49 1.80 3.58 10.20 2.88 3.32 3.18 0.89 3.98 4.21 43.18
2014 3.31 4.23 5.91 4.58 3.26 2.32 4.66 2.55 0.86 4.45 5.14 6.02 47.29
2015 3.71 2.67 4.14 2.51 1.04 5.35 3.12 2.52 3.99 4.02 2.59 5.22 40.88
VERMONT
2011 2.29 3.56 4.70 6.22 6.77 4.96 3.43 10.08 6.11 4.48 2.06 3.56 58.22
2012 2.95 1.22 1.77 3.30 5.56 3.87 3.54 3.29 5.51 5.18 1.13 5.03 42.35
2013 1.87 1.92 2.38 2.62 5.98 7.96 6.33 3.41 4.41 2.37 3.88 3.43 46.56
2014 3.11 3.18 3.38 3.25 4.68 4.57 6.27 3.48 1.85 5.13 2.55 4.63 46.08
2015 2.79 1.79 1.34 2.71 3.06 8.62 4.08 2.96 4.73 3.48 1.81 5.07 42.44 1
Data for Individual stations can be found at http://www.nass.usda.gov/Statistics_by_State/New_England/Publications/Crop_Progress_&_Condition/index.php
SOURCE: United States Department of Commerce, National Oceanic and Atmospheric Administration (NOAA).
New England Agricultural Statistics 19 USDA, National Agricultural Statistics Service
Average Temperatures, Monthly by State – New England: 2011-2015 1
State and Year Jan Feb Mar Apr May Jun Jul Aug Sep Oct Nov Dec
Degrees Fahrenheit
CONNECTICUT
2011 23.2 27.1 37.0 48.9 59.7 66.9 74.1 70.8 66.4 53.4 45.9 36.9
2012 31.7 35.0 45.8 49.7 61.6 66.4 74.1 72.0 63.3 54.7 39.4 35.9
2013 28.8 29.2 36.0 47.3 58.2 67.7 75.9 68.7 61.4 53.4 39.8 31.1
2014 23.6 25.1 30.6 46.7 58.3 66.8 71.9 68.4 63.6 54.1 39.7 35.4
2015 23.3 15.9 31.1 47.0 62.7 65.3 72.2 72.1 67.8 51.5 46.1 43.5
MAINE
2011 15.9 16.2 26.8 39.0 51.9 60.2 67.6 64.9 59.0 47.6 38.8 26.0
2012 18.2 21.4 34.3 42.2 53.8 60.2 67.6 67.4 55.9 48.2 32.7 24.4
2013 15.9 20.1 30.3 39.1 52.3 60.8 68.3 63.7 56.7 47.3 32.3 17.0
2014 14.2 15.7 18.1 38.7 51.7 61.6 67.2 64.4 56.4 48.5 31.8 26.0
2015 11.7 5.2 21.6 37.9 55.7 57.5 64.8 67.1 61.8 43.1 37.0 31.1
MASSACHUSETTS
2011 22.4 25.5 35.4 47.7 58.5 65.2 72.8 69.8 64.9 52.6 45.4 35.8
2012 30.5 33.6 44.1 48.7 60.4 65..0 73.0 71.5 61.9 53.5 39.2 34.8
2013 27.5 28.4 34.9 46.3 57.7 67.0 75.0 68.1 60.9 51.8 38.8 29.4
2014 23.1 24.1 29.1 45.9 57.2 65.9 71.2 67.2 62.3 53.3 38.8 34.7
2015 21.8 14.5 29.3 45.5 61.8 63.7 71.0 71.2 66.2 50.1 44.7 41.8
NEW HAMPSHIRE
2011 16.8 18.7 29.3 42.4 55.8 62.1 69.1 66.2 61.0 48.2 40.2 29.4
2012 22.7 26.9 38.9 44.2 57.0 62.1 68.9 68.2 57.5 49.7 34.3 28.7
2013 20.2 23.1 30.8 42.0 54.9 63.2 70.6 64.8 57.5 48.0 33.2 22.2
2014 16.5 18.1 21.6 41.6 54.0 62.8 67.9 64.0 57.8 49.8 33.8 28.7
2015 14.5 8.1 23.8 40.7 58.9 60.2 67.0 67.7 62.8 45.2 39.6 35.1
RHODE ISLAND
2011 25.2 28.8 38.0 49.1 58.9 66.2 73.8 71.3 66.5 54.9 47.8 39.0
2012 33.5 35.7 45.5 50.1 60.6 65.7 73.6 72.5 63.3 55.4 41.0 37.7
2013 30.5 30.3 37.1 47.7 58.5 68.0 76.4 69.1 62.1 54.0 41.3 33.0
2014 26.0 27.3 32.7 47.1 58.0 66.4 72.3 68.6 64.4 55.3 41.4 37.4
2015 25.5 17.7 31.8 47.1 61.3 64.5 72.3 72.6 67.6 52.4 47.1 45.3
VERMONT
2011 15.7 17.6 27.5 41.7 56.2 62.0 68.5 65.8 60.8 47.7 40.2 27.9
2012 21.4 25.6 38.7 42.7 57.5 62.2 68.0 67.1 57.2 49.3 33.1 27.4
2013 18.6 21.5 29.5 40.8 55.1 62.0 69.7 64.1 56.5 47.8 31.8 21.4
2014 14.6 16.6 18.6 40.5 53.6 62.6 66.5 63.3 57.5 49.3 33.3 27.0
2015 12.2 5.3 22.3 39.6 58.7 59.9 66.3 66.6 62.5 44.3 39.2 35.1 1
Data for Individual stations can be found at http://www.nass.usda.gov/Statistics_by_State/New_England/Publications/Crop_Progress_&_Condition/index.php
SOURCE: United States Department of Commerce, National Oceanic and Atmospheric Administration (NOAA).

20 New England Agricultural Statistics USDA, National Agricultural Statistics Service
Alfalfa Hay Area Harvested, Yield, Production, Price, and Value — New England: 2011-2015
State and
Year
Area
harvested
Yield
per acre Production
Price per
ton1
Value of
Production2
1,000 acres tons 1,000 tons dollars 1,000 dollars
Connecticut 2011 ................................
2012 ................................
2013 ................................
2014 ................................
2015 ................................
5
5
7
8
7
2.10
2.80
2.00
2.00
1.80
11
14
14
16
13
243.00
267.00
270.00
253.00
188.00
2,673
3,738
3,780
4,048
3,380
Maine 2011 ................................
2012 ................................
2013 ................................
2014 ................................
2015 ................................
7
10
10
10
10
2.80
1.50
2.20
2.30
2.30
20
15
22
23
23
209.00
227.00
254.00
191.00
227.00
4,180
3,405
5,588
4,393
5,083
Massachusetts 2011 ................................
2012 ................................
2013 ................................
2014 ................................
2015 ................................
9
9
9
10
9
2.10
2.30
3.10
1.80
2.00
19
21
28
18
18
240.00
254.00
208.00
205.00
197.00
4,560
5,334
5,824
3,690
4,230
New Hampshire 2011 ................................
2012 ................................
2013 ................................
2014 ................................
2015 ................................
4
5
5
4
3
1.70
2.00
1.60
2.30
2.50
7
10
8
9
8
228.00
254.00
194.00
171.00
215.00
1,596
2,540
1,552
1,539
1,648
Rhode Island 2011 ................................
2012 ................................
2013 ................................
2014 ................................
2015 ................................
1
1
1
1
1
2.40
1.50
2.00
2.50
2.00
2
2
2
3
2
242.00
262.00
262.00
206.00
190.00
484
524
524
618
394
Vermont 2011 ................................
2012 ................................
2013 ................................
2014 ................................
2015 ................................
30
30
35
35
35
1.90
2.10
1.80
1.60
3.00
57
63
63
56
105
197.00
208.00
180.00
208.00
208.00
11,229
13,104
11,340
11,648
25,200
New England 2011 ................................
2012 ................................
2013 ................................
2014 ................................
2015 ................................
56
60
67
68
65
2.07
2.08
2.04
1.84
2.60
116
125
137
125
169
213.00
229.00
209.00
207.00
236.00
24,722
28,645
28,608
25,936
39,935
1 Marketing year average price. 2 Based on final State marketing year average price for years prior to 2015; for 2015, based on preliminary State marketing year average
price.
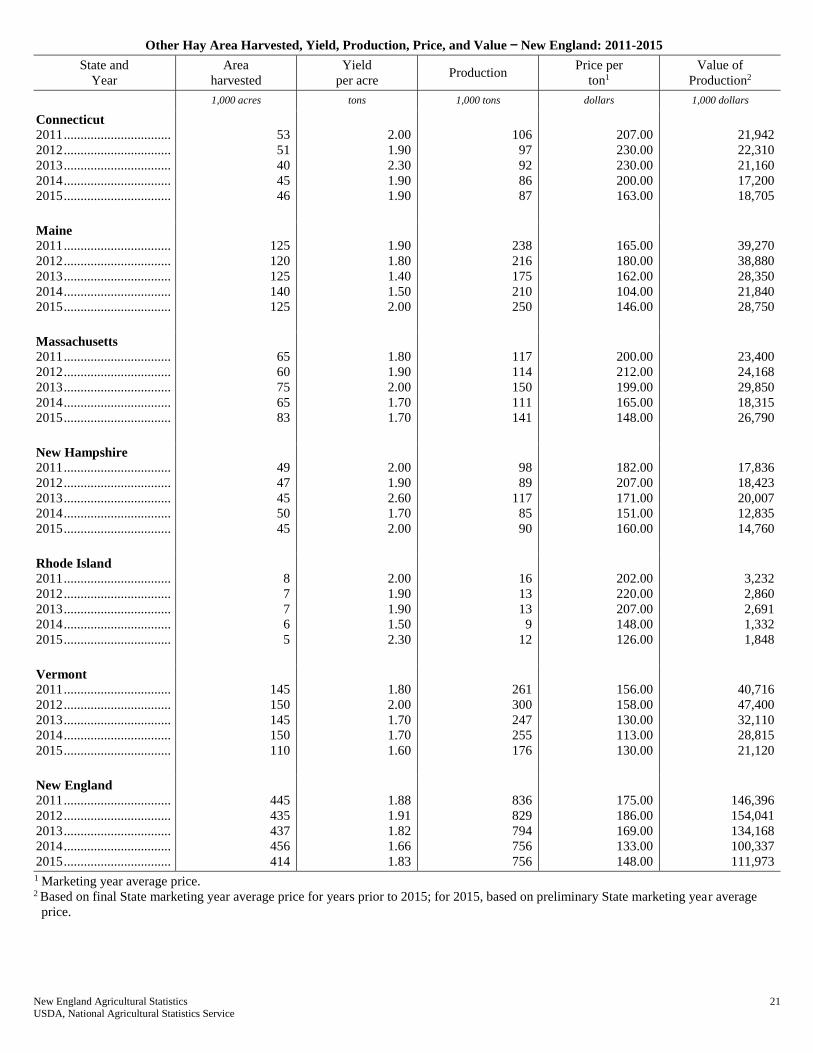
New England Agricultural Statistics 21 USDA, National Agricultural Statistics Service
Other Hay Area Harvested, Yield, Production, Price, and Value — New England: 2011-2015
State and
Year
Area
harvested
Yield
per acre Production
Price per
ton1
Value of
Production2
1,000 acres tons 1,000 tons dollars 1,000 dollars
Connecticut 2011 ................................
2012 ................................
2013 ................................
2014 ................................
2015 ................................
53
51
40
45
46
2.00
1.90
2.30
1.90
1.90
106
97
92
86
87
207.00
230.00
230.00
200.00
163.00
21,942
22,310
21,160
17,200
18,705
Maine 2011 ................................
2012 ................................
2013 ................................
2014 ................................
2015 ................................
125
120
125
140
125
1.90
1.80
1.40
1.50
2.00
238
216
175
210
250
165.00
180.00
162.00
104.00
146.00
39,270
38,880
28,350
21,840
28,750
Massachusetts 2011 ................................
2012 ................................
2013 ................................
2014 ................................
2015 ................................
65
60
75
65
83
1.80
1.90
2.00
1.70
1.70
117
114
150
111
141
200.00
212.00
199.00
165.00
148.00
23,400
24,168
29,850
18,315
26,790
New Hampshire 2011 ................................
2012 ................................
2013 ................................
2014 ................................
2015 ................................
49
47
45
50
45
2.00
1.90
2.60
1.70
2.00
98
89
117
85
90
182.00
207.00
171.00
151.00
160.00
17,836
18,423
20,007
12,835
14,760
Rhode Island 2011 ................................
2012 ................................
2013 ................................
2014 ................................
2015 ................................
8
7
7
6
5
2.00
1.90
1.90
1.50
2.30
16
13
13
9
12
202.00
220.00
207.00
148.00
126.00
3,232
2,860
2,691
1,332
1,848
Vermont 2011 ................................
2012 ................................
2013 ................................
2014 ................................
2015 ................................
145
150
145
150
110
1.80
2.00
1.70
1.70
1.60
261
300
247
255
176
156.00
158.00
130.00
113.00
130.00
40,716
47,400
32,110
28,815
21,120
New England 2011 ................................
2012 ................................
2013 ................................
2014 ................................
2015 ................................
445
435
437
456
414
1.88
1.91
1.82
1.66
1.83
836
829
794
756
756
175.00
186.00
169.00
133.00
148.00
146,396
154,041
134,168
100,337
111,973
1 Marketing year average price. 2 Based on final State marketing year average price for years prior to 2015; for 2015, based on preliminary State marketing year average
price.
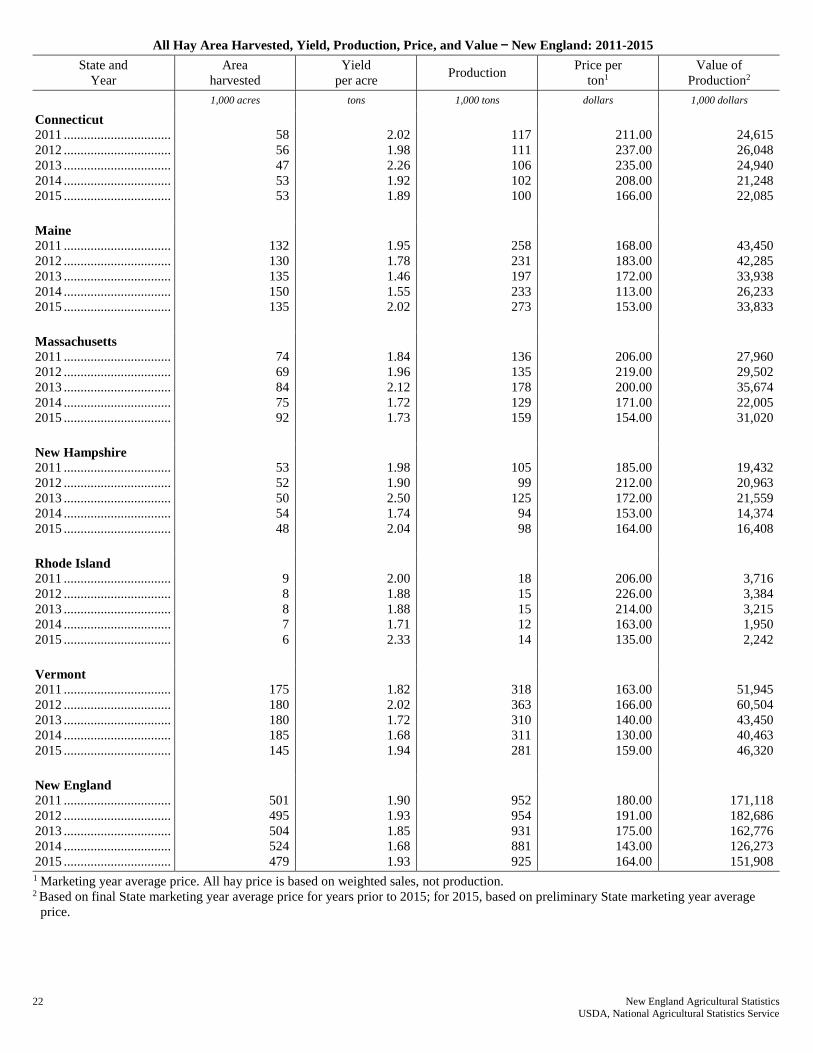
22 New England Agricultural Statistics USDA, National Agricultural Statistics Service
All Hay Area Harvested, Yield, Production, Price, and Value — New England: 2011-2015
State and
Year
Area
harvested
Yield
per acre Production
Price per
ton1
Value of
Production2
1,000 acres tons 1,000 tons dollars 1,000 dollars
Connecticut 2011 ................................
2012 ................................
2013 ................................
2014 ................................
2015 ................................
58
56
47
53
53
2.02
1.98
2.26
1.92
1.89
117
111
106
102
100
211.00
237.00
235.00
208.00
166.00
24,615
26,048
24,940
21,248
22,085
Maine 2011 ................................
2012 ................................
2013 ................................
2014 ................................
2015 ................................
132
130
135
150
135
1.95
1.78
1.46
1.55
2.02
258
231
197
233
273
168.00
183.00
172.00
113.00
153.00
43,450
42,285
33,938
26,233
33,833
Massachusetts 2011 ................................
2012 ................................
2013 ................................
2014 ................................
2015 ................................
74
69
84
75
92
1.84
1.96
2.12
1.72
1.73
136
135
178
129
159
206.00
219.00
200.00
171.00
154.00
27,960
29,502
35,674
22,005
31,020
New Hampshire 2011 ................................
2012 ................................
2013 ................................
2014 ................................
2015 ................................
53
52
50
54
48
1.98
1.90
2.50
1.74
2.04
105
99
125
94
98
185.00
212.00
172.00
153.00
164.00
19,432
20,963
21,559
14,374
16,408
Rhode Island 2011 ................................
2012 ................................
2013 ................................
2014 ................................
2015 ................................
9
8
8
7
6
2.00
1.88
1.88
1.71
2.33
18
15
15
12
14
206.00
226.00
214.00
163.00
135.00
3,716
3,384
3,215
1,950
2,242
Vermont 2011 ................................
2012 ................................
2013 ................................
2014 ................................
2015 ................................
175
180
180
185
145
1.82
2.02
1.72
1.68
1.94
318
363
310
311
281
163.00
166.00
140.00
130.00
159.00
51,945
60,504
43,450
40,463
46,320
New England 2011 ................................
2012 ................................
2013 ................................
2014 ................................
2015 ................................
501
495
504
524
479
1.90
1.93
1.85
1.68
1.93
952
954
931
881
925
180.00
191.00
175.00
143.00
164.00
171,118
182,686
162,776
126,273
151,908
1 Marketing year average price. All hay price is based on weighted sales, not production. 2 Based on final State marketing year average price for years prior to 2015; for 2015, based on preliminary State marketing year average
price.

New England Agricultural Statistics 23 USDA, National Agricultural Statistics Service
Hay Stocks on Farm by Position and Month — New England: 2011-2015
State
and
Crop Year
Total
production
Stocks Following Harvest
December 1 May 1 1
Stocks Percent of
production Stocks
Percent of
production
1,000 tons 1,000 tons percent 1,000 tons percent
Connecticut 2011 ...........................
2012 ...........................
2013 ...........................
2014 ...........................
2015 ...........................
Maine 2011 ...........................
2012 ...........................
2013 ...........................
2014 ...........................
2015 ...........................
Massachusetts 2011 ...........................
2012 ...........................
2013 ...........................
2014 ...........................
2015 ...........................
New Hampshire 2011 ...........................
2012 ...........................
2013 ...........................
2014 ...........................
2015 ...........................
Rhode Island 2011 ...........................
2012 ...........................
2013 ...........................
2014 ...........................
2015 ...........................
Vermont 2011 ...........................
2012 ...........................
2013 ...........................
2014 ...........................
2015 ...........................
New England 2011 ...........................
2012 ...........................
2013 ...........................
2014 ...........................
2015 ...........................
117
111
106
102
100
258
231
197
233
273
136
135
178
129
159
105
99
125
94
98
18
15
15
12
14
318
363
310
311
281
952
954
931
881
925
53
49
50
48
45
133
142
120
130
139
71
77
69
50
56
49
49
21
43
42
8
7
7
7
6
215
220
205
182
150
529
544
472
460
438
45
44
47
47
45
52
61
61
56
51
52
57
39
39
35
47
49
17
46
43
44
47
47
58
43
68
61
66
59
53
56
57
51
52
47
12
7
8
7
4
35
22
18
26
26
15
12
19
7
14
13
10
6
7
6
1
1
1
1
1
45
36
45
35
35
121
88
97
83
86
10
6
8
7
4
14
10
9
11
10
11
9
11
5
9
12
10
5
7
6
6
7
7
8
7
14
10
15
11
12
13
9
10
9
9
1 May of the following year.
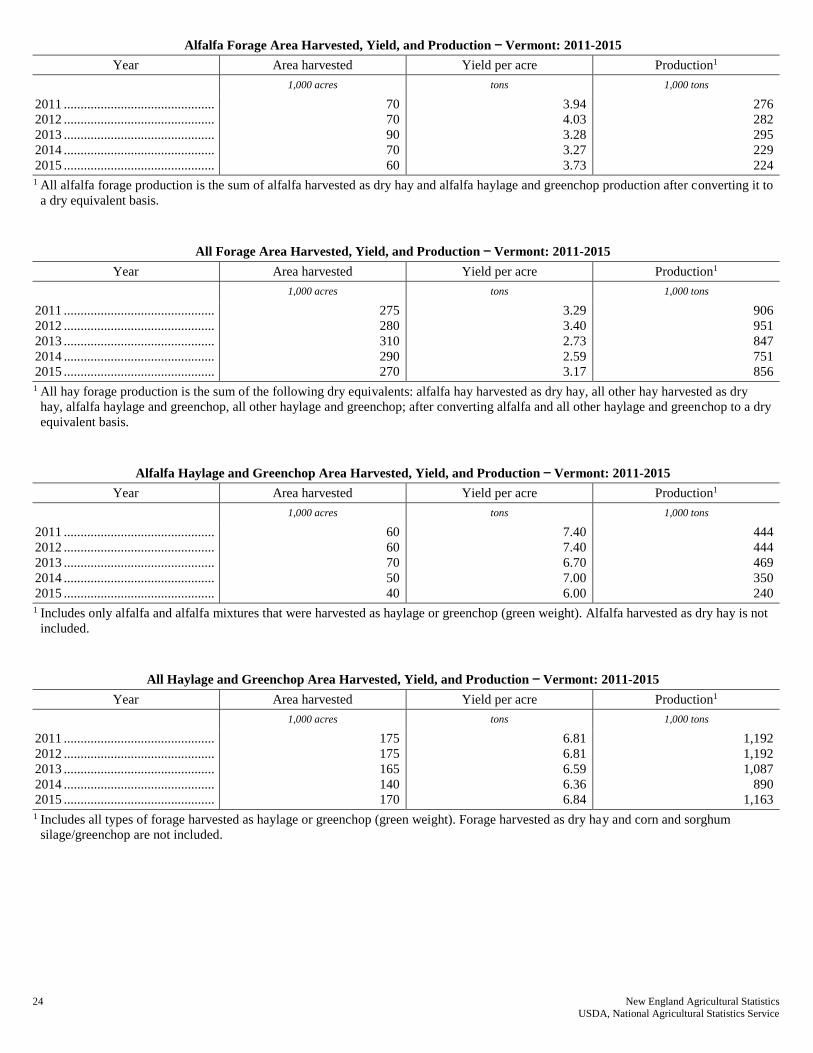
24 New England Agricultural Statistics USDA, National Agricultural Statistics Service
Alfalfa Forage Area Harvested, Yield, and Production — Vermont: 2011-2015
Year Area harvested Yield per acre Production1
1,000 acres tons 1,000 tons
2011 .............................................
2012 .............................................
2013 .............................................
2014 .............................................
2015 .............................................
70
70
90
70
60
3.94
4.03
3.28
3.27
3.73
276
282
295
229
224
1 All alfalfa forage production is the sum of alfalfa harvested as dry hay and alfalfa haylage and greenchop production after converting it to
a dry equivalent basis.
All Forage Area Harvested, Yield, and Production — Vermont: 2011-2015
Year Area harvested Yield per acre Production1
1,000 acres tons 1,000 tons
2011 .............................................
2012 .............................................
2013 .............................................
2014 .............................................
2015 .............................................
275
280
310
290
270
3.29
3.40
2.73
2.59
3.17
906
951
847
751
856
1 All hay forage production is the sum of the following dry equivalents: alfalfa hay harvested as dry hay, all other hay harvested as dry
hay, alfalfa haylage and greenchop, all other haylage and greenchop; after converting alfalfa and all other haylage and greenchop to a dry
equivalent basis.
Alfalfa Haylage and Greenchop Area Harvested, Yield, and Production — Vermont: 2011-2015
Year Area harvested Yield per acre Production1
1,000 acres tons 1,000 tons
2011 .............................................
2012 .............................................
2013 .............................................
2014 .............................................
2015 .............................................
60
60
70
50
40
7.40
7.40
6.70
7.00
6.00
444
444
469
350
240
1 Includes only alfalfa and alfalfa mixtures that were harvested as haylage or greenchop (green weight). Alfalfa harvested as dry hay is not
included.
All Haylage and Greenchop Area Harvested, Yield, and Production — Vermont: 2011-2015
Year Area harvested Yield per acre Production1
1,000 acres tons 1,000 tons
2011 .............................................
2012 .............................................
2013 .............................................
2014 .............................................
2015 .............................................
175
175
165
140
170
6.81
6.81
6.59
6.36
6.84
1,192
1,192
1,087
890
1,163
1 Includes all types of forage harvested as haylage or greenchop (green weight). Forage harvested as dry hay and corn and sorghum
silage/greenchop are not included.
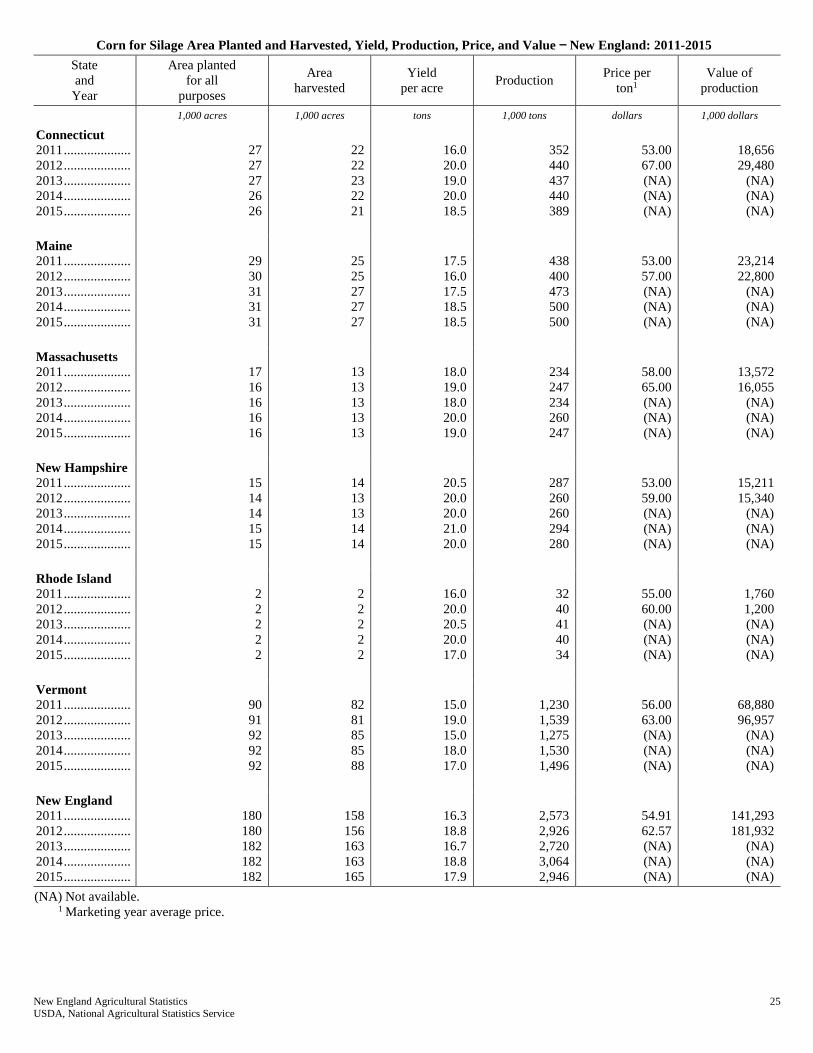
New England Agricultural Statistics 25 USDA, National Agricultural Statistics Service
Corn for Silage Area Planted and Harvested, Yield, Production, Price, and Value — New England: 2011-2015
State
and
Year
Area planted
for all
purposes
Area
harvested
Yield
per acre Production
Price per
ton1
Value of
production
1,000 acres 1,000 acres tons 1,000 tons dollars 1,000 dollars
Connecticut 2011 ....................
2012 ....................
2013 ....................
2014 ....................
2015 ....................
27
27
27
26
26
22
22
23
22
21
16.0
20.0
19.0
20.0
18.5
352
440
437
440
389
53.00
67.00
(NA)
(NA)
(NA)
18,656
29,480
(NA)
(NA)
(NA)
Maine 2011 ....................
2012 ....................
2013 ....................
2014 ....................
2015 ....................
29
30
31
31
31
25
25
27
27
27
17.5
16.0
17.5
18.5
18.5
438
400
473
500
500
53.00
57.00
(NA)
(NA)
(NA)
23,214
22,800
(NA)
(NA)
(NA)
Massachusetts 2011 ....................
2012 ....................
2013 ....................
2014 ....................
2015 ....................
17
16
16
16
16
13
13
13
13
13
18.0
19.0
18.0
20.0
19.0
234
247
234
260
247
58.00
65.00
(NA)
(NA)
(NA)
13,572
16,055
(NA)
(NA)
(NA)
New Hampshire 2011 ....................
2012 ....................
2013 ....................
2014 ....................
2015 ....................
15
14
14
15
15
14
13
13
14
14
20.5
20.0
20.0
21.0
20.0
287
260
260
294
280
53.00
59.00
(NA)
(NA)
(NA)
15,211
15,340
(NA)
(NA)
(NA)
Rhode Island 2011 ....................
2012 ....................
2013 ....................
2014 ....................
2015 ....................
2
2
2
2
2
2
2
2
2
2
16.0
20.0
20.5
20.0
17.0
32
40
41
40
34
55.00
60.00
(NA)
(NA)
(NA)
1,760
1,200
(NA)
(NA)
(NA)
Vermont 2011 ....................
2012 ....................
2013 ....................
2014 ....................
2015 ....................
90
91
92
92
92
82
81
85
85
88
15.0
19.0
15.0
18.0
17.0
1,230
1,539
1,275
1,530
1,496
56.00
63.00
(NA)
(NA)
(NA)
68,880
96,957
(NA)
(NA)
(NA)
New England 2011 ....................
2012 ....................
2013 ....................
2014 ....................
2015 ....................
180
180
182
182
182
158
156
163
163
165
16.3
18.8
16.7
18.8
17.9
2,573
2,926
2,720
3,064
2,946
54.91
62.57
(NA)
(NA)
(NA)
141,293
181,932
(NA)
(NA)
(NA)
(NA) Not available. 1 Marketing year average price.

26 New England Agricultural Statistics USDA, National Agricultural Statistics Service
Barley Area Planted and Harvested, Yield, Production, Price, and Value — Maine: 2011-2015
Year Area
planted
Area
harvested
Yield
per acre Production
Price per
bushel1
Value of
Production2
1,000 acres 1,000 acres bushels 1,000 bushels dollars 1,000 dollars
2011 ..........................
2012 ..........................
2013 ..........................
2014 ..........................
2015 ..........................
16
17
20
13
13
14
16
17
12
12
35.0
60.0
53.0
68.0
85.0
490
960
901
816
1,020
3.70
4.25
4.15
3.55
3.90
1,813
4,080
3,739
2,897
3,825
1 Marketing year average price. Standard weight for one bushel of barley is 48 pounds. 2 Based on final State marketing year average price for years prior to 2015; for 2015, based on preliminary State marketing year average
price.
Oats Area Planted and Harvested, Yield, Production, Price, and Value — Maine: 2011-2015
Year Area
planted
Area
harvested
Yield
per acre Production
Price per
bushel1
Value of
Production2
1,000 acres 1,000 acres bushels 1,000 bushels dollars 1,000 dollars
2011 ..........................
2012 ..........................
2013 ..........................
2014 ..........................
2015 ..........................
28
29
28
32
30
26
28
26
31
29
45.0
65.0
67.0
70.0
80.0
1,170
1,820
1,742
2,170
2,320
2.40
3.00
2.45
2.35
2.00
2,808
5,460
4,432
5,100
3,712
1 Marketing year average price. Standard weight for one bushel of oats is 32 pounds. 2 Based on final State marketing year average price for years prior to 2015; for 2015, based on preliminary State marketing year average
price.
Broadleaf Tobacco (Type 51) Area Harvested, Yield, Production, Price, and Value — New England: 2011-2015
State and
Year
Area
harvested
Yield
per acre Production1
Price per
pound2
Value of
production
acres pounds 1,000 pounds dollars 1,000 dollars
Connecticut 2011 ................................
2012 ................................
2013 ................................
2014 ................................
2015 ................................
Massachusetts 2011 ................................
2012 ................................
2013 ................................
2014 ................................
2015 ................................
New England3 2011 ................................
2012 ................................
2013 ................................
2014 ................................
2015 ................................
1,350
(D)
(D)
(D)
(D)
440
(D)
(D)
(D)
(D)
1,790
(D)
(D)
(D)
(D)
1,600
(D)
(D)
(D)
(D)
1,680
(D)
(D)
(D)
(D)
1,620
(D)
(D)
(D)
(D)
2,160
(D)
(D)
(D)
(D)
739
(D)
(D)
(D)
(D)
2,899
(D)
(D)
(D)
(D)
6.20
6.60
(D)
(D)
(D)
6.20
6.20
(D)
(D)
(D)
6.20
(D)
(D)
(D)
(D)
13,392
(D)
(D)
(D)
(D)
4,582
(D)
(D)
(D)
(D)
17,974
(D)
(D)
(D)
(D)
(D) Withheld to avoid disclosing data for individual operations. 1 Any leaf that is not harvested, or harvested and destroyed for any reason, is excluded from production. 2 Marketing year average price. 3 New England includes Connecticut and Massachusetts.

New England Agricultural Statistics 27 USDA, National Agricultural Statistics Service
Shade Tobacco (Type 61) Area Harvested, Yield, Production, Price, and Value — New England: 2011-2015
State and
Year
Area
harvested
Yield
per acre Production1
Price per
pound2
Value of
production
acres pounds 1,000 pounds dollars 1,000 dollars
Connecticut 2011 ................................
2012 ................................
2013 ................................
2014 ................................
2015 ................................
Massachusetts 2011 ................................
2012 ................................
2013 ................................
2014 ................................
2015 ................................
New England3 2011 ................................
2012 ................................
2013 ................................
2014 ................................
2015 ................................
720
(D)
(D)
(D)
(D)
130
(D)
(D)
(D)
(D)
850
(D)
(D)
(D)
(D)
1,200
(D)
(D)
(D)
(D)
1,200
(D)
(D)
(D)
(D)
1,200
(D)
(D)
(D)
(D)
864
(D)
(D)
(D)
(D)
156
(D)
(D)
(D)
(D)
1,020
(D)
(D)
(D)
(D)
(D)
(D)
(D)
(D)
(D)
(D)
(D)
(D)
(D)
(D)
(D)
(D)
(D)
(D)
(D)
(D)
(D)
(D)
(D)
(D)
(D)
(D)
(D)
(D)
(D)
(D)
(D)
(D)
(D)
(D)
(D) Withheld to avoid disclosing data for individual operations. 1 Any leaf that is not harvested, or harvested and destroyed for any reason, is excluded from production. 2 Marketing year average price. 3 New England includes Connecticut and Massachusetts.
All Tobacco Area Harvested, Yield, Production, Price, and Value — New England: 2011-2015
State and
Year
Area
harvested
Yield
per acre Production1
Price per
pound2
Value of
production
acres pounds 1,000 pounds dollars 1,000 dollars
Connecticut 2011 ................................
2012 ................................
2013 ................................
2014 ................................
2015 ................................
Massachusetts 2011 ................................
2012 ................................
2013 ................................
2014 ................................
2015 ................................
New England3 2011 ................................
2012 ................................
2013 ................................
2014 ................................
2015 ................................
2,070
(D)
(D)
(D)
(D)
570
(D)
(D)
(D)
(D)
2,640
(D)
(D)
(D)
(D)
1,461
(D)
(D)
(D)
(D)
1,570
(D)
(D)
(D)
(D)
1,484
(D)
(D)
(D)
(D)
3,024
(D)
(D)
(D)
(D)
895
(D)
(D)
(D)
(D)
3,919
(D)
(D)
(D)
(D)
(D)
(D)
(D)
(D)
(D)
(D)
(D)
(D)
(D)
(D)
(D)
(D)
(D)
(D)
(D)
(D)
(D)
(D)
(D)
(D)
(D)
(D)
(D)
(D)
(D)
(D)
(D)
(D)
(D)
(D)
(D) Withheld to avoid disclosing data for individual operations. 1 Any leaf that is not harvested, or harvested and destroyed for any reason, is excluded from production. 2 Marketing year average price. 3 New England includes Connecticut and Massachusetts.
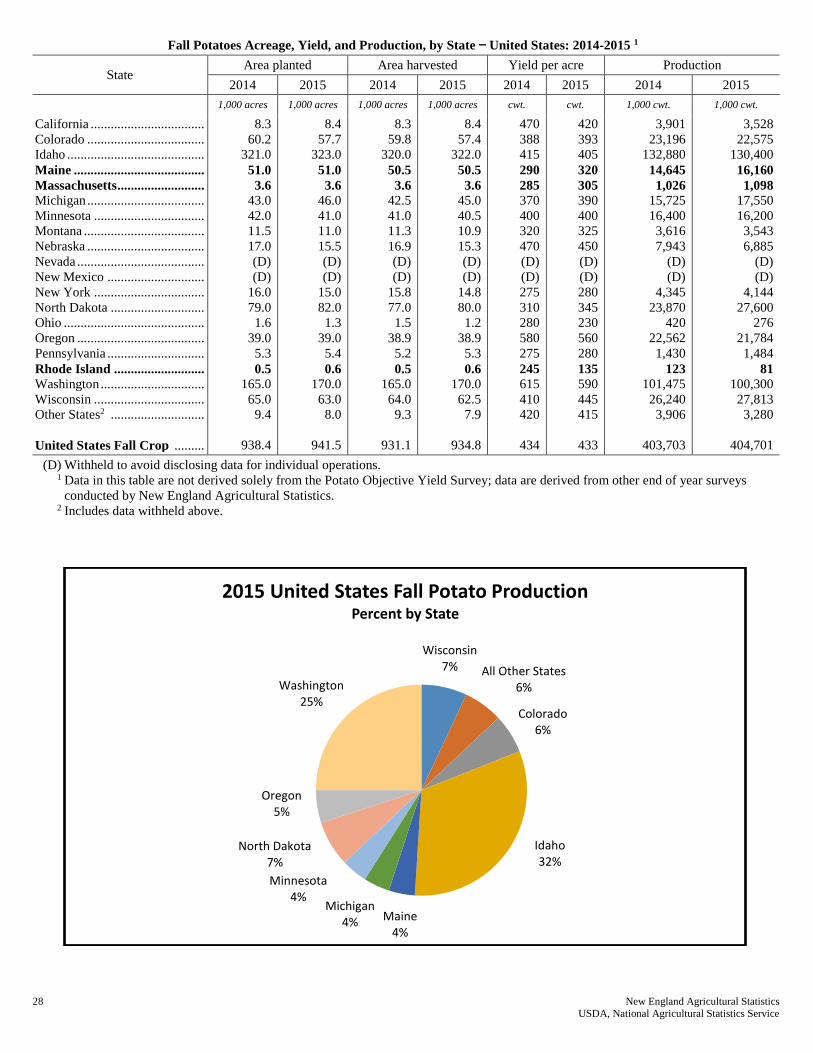
28 New England Agricultural Statistics USDA, National Agricultural Statistics Service
Fall Potatoes Acreage, Yield, and Production, by State — United States: 2014-2015 1
State Area planted Area harvested Yield per acre Production
2014 2015 2014 2015 2014 2015 2014 2015
1,000 acres 1,000 acres 1,000 acres 1,000 acres cwt. cwt. 1,000 cwt. 1,000 cwt.
California ..................................
Colorado ...................................
Idaho .........................................
Maine .......................................
Massachusetts .......................... Michigan ...................................
Minnesota .................................
Montana ....................................
Nebraska ...................................
Nevada ......................................
New Mexico .............................
New York .................................
North Dakota ............................
Ohio ..........................................
Oregon ......................................
Pennsylvania .............................
Rhode Island ........................... Washington ...............................
Wisconsin .................................
Other States2 ............................
United States Fall Crop .........
8.3
60.2
321.0
51.0
3.6 43.0
42.0
11.5
17.0
(D)
(D)
16.0
79.0
1.6
39.0
5.3
0.5 165.0
65.0
9.4
938.4
8.4
57.7
323.0
51.0
3.6 46.0
41.0
11.0
15.5
(D)
(D)
15.0
82.0
1.3
39.0
5.4
0.6 170.0
63.0
8.0
941.5
8.3
59.8
320.0
50.5
3.6 42.5
41.0
11.3
16.9
(D)
(D)
15.8
77.0
1.5
38.9
5.2
0.5 165.0
64.0
9.3
931.1
8.4
57.4
322.0
50.5
3.6 45.0
40.5
10.9
15.3
(D)
(D)
14.8
80.0
1.2
38.9
5.3
0.6 170.0
62.5
7.9
934.8
470
388
415
290
285 370
400
320
470
(D)
(D)
275
310
280
580
275
245 615
410
420
434
420
393
405
320
305 390
400
325
450
(D)
(D)
280
345
230
560
280
135 590
445
415
433
3,901
23,196
132,880
14,645
1,026 15,725
16,400
3,616
7,943
(D)
(D)
4,345
23,870
420
22,562
1,430
123 101,475
26,240
3,906
403,703
3,528
22,575
130,400
16,160
1,098 17,550
16,200
3,543
6,885
(D)
(D)
4,144
27,600
276
21,784
1,484
81 100,300
27,813
3,280
404,701
(D) Withheld to avoid disclosing data for individual operations. 1 Data in this table are not derived solely from the Potato Objective Yield Survey; data are derived from other end of year surveys
conducted by New England Agricultural Statistics. 2 Includes data withheld above.
Wisconsin7% All Other States
6%
Colorado6%
Idaho32%
Maine4%
Michigan4%
Minnesota4%
North Dakota7%
Oregon5%
Washington25%
2015 United States Fall Potato ProductionPercent by State
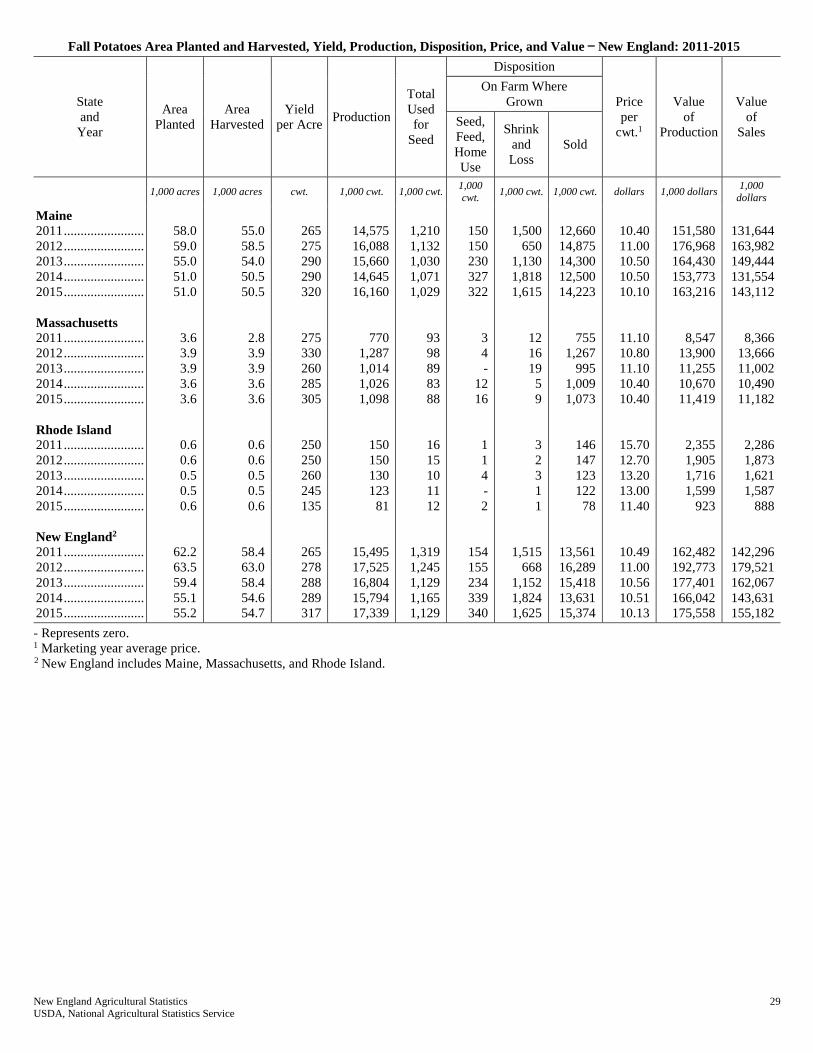
New England Agricultural Statistics 29 USDA, National Agricultural Statistics Service
Fall Potatoes Area Planted and Harvested, Yield, Production, Disposition, Price, and Value — New England: 2011-2015
State
and
Year
Area
Planted
Area
Harvested
Yield
per Acre Production
Total
Used
for
Seed
Disposition
Price
per
cwt.1
Value
of
Production
Value
of
Sales
On Farm Where
Grown
Seed,
Feed,
Home
Use
Shrink
and
Loss
Sold
1,000 acres 1,000 acres cwt. 1,000 cwt. 1,000 cwt. 1,000 cwt.
1,000 cwt. 1,000 cwt. dollars 1,000 dollars 1,000
dollars
Maine 2011 ........................
2012 ........................
2013 ........................
2014 ........................
2015 ........................
Massachusetts 2011 ........................
2012 ........................
2013 ........................
2014 ........................
2015 ........................
Rhode Island 2011 ........................
2012 ........................
2013 ........................
2014 ........................
2015 ........................
New England2 2011 ........................
2012 ........................
2013 ........................
2014 ........................
2015 ........................
58.0
59.0
55.0
51.0
51.0
3.6
3.9
3.9
3.6
3.6
0.6
0.6
0.5
0.5
0.6
62.2
63.5
59.4
55.1
55.2
55.0
58.5
54.0
50.5
50.5
2.8
3.9
3.9
3.6
3.6
0.6
0.6
0.5
0.5
0.6
58.4
63.0
58.4
54.6
54.7
265
275
290
290
320
275
330
260
285
305
250
250
260
245
135
265
278
288
289
317
14,575
16,088
15,660
14,645
16,160
770
1,287
1,014
1,026
1,098
150
150
130
123
81
15,495
17,525
16,804
15,794
17,339
1,210
1,132
1,030
1,071
1,029
93
98
89
83
88
16
15
10
11
12
1,319
1,245
1,129
1,165
1,129
150
150
230
327
322
3
4
-
12
16
1
1
4
-
2
154
155
234
339
340
1,500
650
1,130
1,818
1,615
12
16
19
5
9
3
2
3
1
1
1,515
668
1,152
1,824
1,625
12,660
14,875
14,300
12,500
14,223
755
1,267
995
1,009
1,073
146
147
123
122
78
13,561
16,289
15,418
13,631
15,374
10.40
11.00
10.50
10.50
10.10
11.10
10.80
11.10
10.40
10.40
15.70
12.70
13.20
13.00
11.40
10.49
11.00
10.56
10.51
10.13
151,580
176,968
164,430
153,773
163,216
8,547
13,900
11,255
10,670
11,419
2,355
1,905
1,716
1,599
923
162,482
192,773
177,401
166,042
175,558
131,644
163,982
149,444
131,554
143,112
8,366
13,666
11,002
10,490
11,182
2,286
1,873
1,621
1,587
888
142,296
179,521
162,067
143,631
155,182
- Represents zero.
1 Marketing year average price. 2 New England includes Maine, Massachusetts, and Rhode Island.

30 New England Agricultural Statistics USDA, National Agricultural Statistics Service
Potatoes Percent of Acres Planted, by Variety and Type – Maine: 2010-2015
Variety and Type 2010 2011 2012 2013 2014 2015
percent
By Variety:
Russet Burbank 38 43.1 42.7 39.5 33.6 39.4
Frito-Lay 15.6 12.5 11.5 15.2 10.7 8.7
R Norkotah 3.5 4.9 5.9 2.3 10.0 6.8
Innovator 2.0 2.0 2.9 4.7 3.4 5.6
Snowden 5.8 5.5 4.7 5.9 7.1 4.3
Norland 1.6 3.9 3.4 3.2 4.3 4.1
Gold Rush * * * 1.3 5.6 3.6
Superior 3.8 4.1 5.1 4.0 2.4 3.5
Keuka Gold 1.3 * 1.0 1.1 2.9 2.7
Norwis (NA) (NA) (NA) (NA) 4.0 2.2
Atlantic 2.8 1.3 1.4 3.1 2.0 2.1
Reba 2.1 2.7 * 1.1 * 1.6
Blazer R * 1.9 3.0 2.5 2.4 1.4
Ontario * 1.1 1.7 2.0 1.1 1.4
Katahdin 1.6 1.1 1.0 1.0 * 1.1
Shepody 5.2 4.1 1.4 * * 1.1
Prospect * * * 1.5 * *
Yukon Gold 2.8 2.2 1.3 1.5 * *
Marcy 1.3 * * * * *
Monona * 1.1 * * * *
Other Varieties 9.5 5.9 8.1 9.5 10.5 10.4
Total 100.0 100.0 100.0 100.0 100.0 100.0 * Included with other varieties.
(NA) Not available.
Potatoes Number of Hills per Acre, by Type – Maine: 2011-2015 1
Year
Reds Whites Yellow Russets
Samples
Average
Number
of Hills
per Acre
Samples
Average
Number
of Hills
per Acre
Samples
Average
Number
of Hills
per Acre
Samples
Average
Number
of Hills
per Acre
number
2011 9 13,687 46 13,015 3 14,268 73 9,809
2012 4 12,589 41 11,810 6 11,471 82 9,669
2013 8 13,306 56 13,468 9 12,427 41 10,005
2014 7 13,315 35 12,190 11 13,643 65 10,627
2015 8 13,183 43 13,106 9 11,434 85 10,029 1 Tubers 1½ inches and over.
Potatoes (Round Whites) Percent of Net Yield, by Size Group – Maine: 2010-2015 1
Size Round Whites
2010 2011 2012 2013 2014 2015
percent
1 ½" – under 1 ⅞" 4.2 1.2 4.4 4.8 2.7 2.5
1 ⅞" – under 2" 5.7 2.2 3.4 4.5 2.9 3.2
2" – under 2 ¼" 13.2 10.2 12.2 13.8 13.1 12.1
2 ¼" – under 2 ½" 20.1 16.6 20.8 21.0 15.8 21.8
2 ½" – under 3 ½" 52.5 63.0 51.5 53.2 60.2 58.7
3 ½" – under 4" 3.0 6.5 6.7 2.7 5.2 1.7
4" and over 1.3 0.3 1.0 * 0.1 * * Less than 1 percent. 1 Percent of net yield adjusted for field loss.
Long Potatoes (Russet and Shepody) Size Categories – Maine: 2011-2015 1
Year
Under 2 inches 2 Inches and Over
1 1/2 - Under
1 7/8 Inch
1 7/8 - Under
2 Inches
4 oz – Under
6 oz
6 oz - Under
8 oz
8 oz - Under
10 oz
10 oz - Under
12 oz
12 oz - Under
14 oz
14 oz and
Over
percent
2011 3.4 5.7 34.2 21.7 16.3 7.8 4.0 6.9
2012 — 4.8 38.1 20.9 13.8 9.2 6.0 7.2
2013 6.9 6.4 32.5 20.9 14.6 12.0 4.4 2.3
2014 4.7 4.5 32.9 20.9 14.5 9.2 6.4 6.9
2015 3.3 3.0 25.1 20.2 16.8 12.4 7.9 11.3 - Represents zero.
1 Percent of net yield - adjusted for field loss.

New England Agricultural Statistics 31 USDA, National Agricultural Statistics Service
Potatoes (Round Whites and All Long Potatoes) Percent of Net Yield, by Grade and Type – Maine: 2010-2015 1
Grade Round Whites All Long Potatoes
2010 2011 2012 2013 2014 2015 2010 2011 2012 2013 2014 2015 percent
No. 1
(2 Inch Minimum ) 2 70.2 80.7 83.5 75.8 88.5 82.6 66.2 66.9 80.6 77.9 85.9 90.8
No. 2 or Processing
Usable
(1 ½ Inch Minimum) 3
15.3 5.4 7.6 18.3 7.8 7.0 22.5 15.2 9.7 16.4 9.8 7.0
Cull 4 14.5 13.9 8.9 5.9 3.7 10.4 11.6 17.9 9.7 5.7 4.3 2.2
1 Percent of net yield – adjusted for field loss. Reflects condition before harvest or handling damage. 2 Potatoes which meet the requirements for US #1, as stated in U.S. Standards for Grades of Potatoes, USDA, Agriculture Marketing Service. 3 Potatoes which meet the requirements for US #2, as stated in U.S. Standards for Grades of Potatoes, USDA, Agriculture Marketing Service. 4 Potatoes not meeting the requirements for US #1 or US #2, as stated in U.S. Standards for Grades of Potatoes, USDA, Agriculture Marketing Service.
Fall Potatoes Harvest Loss, by Type – Maine: 2011-2015 Year Reds Whites Yellows Russets All Types
cwt per acre
2011 (D) 30 (D) 30 29
2012 (D) 31 (D) 24 26
2013 13 (D) (D) (D) 15
2014 28 15 (D) 19 18
2015 (D) 17 (D) 24 20 (D) Data withheld to prevent disclosure of individual operations.
Potato Prices Received by Farmers, by Month and Marketing Year Average — Maine: 2011-2015
Year Aug. Sept. Oct. Nov. Dec. Jan. Feb. Mar. Apr. May June July Marketing
Yr. Avg.1
dollars
per cwt.
dollars
per cwt.
dollars
per cwt.
dollars
per cwt.
dollars
per cwt.
dollars
per cwt.
dollars
per cwt.
dollars
per cwt.
dollars
per cwt.
dollars
per cwt.
dollars
per cwt.
dollars
per cwt.
dollars per
cwt.
2011 .....
2012 .....
2013 .....
2014 .....
2015 .....
(D)
(D)
(D)
(D)
(D)
(D)
(D)
(D)
(D)
(D)
8.65
9.95
8.80
(D)
(D)
9.70
10.30
9.75
(D)
(D)
10.20
11.00
10.70
(D)
(D)
10.00
10.20
10.90
9.90
(D)
10.40
11.10
11.00
10.90
(D)
11.30
11.20
11.60
11.20
(D)
11.00
12.00
12.10
11.30
(D)
10.50
11.40
11.90
11.60
(D)
10.30
(D)
(D)
12.00
(D)
(D)
(D)
(D)
(D)
(D)
10.40
11.00
10.50
10.50
10.10
(D) Withheld to avoid disclosing data for individual operations. 1 Average price of potatoes sold for all uses, including table stock, processing, seed and livestock feed.
Fall Potato Production and Stocks, by Selected Months — Maine: 2011-2015
Crop
Year Production
Stocks Held by Growers, Local Dealers, and Processors1
Year Following Year
December 1 January 1 February 1 March 1 April 1 May 1 June 1
1,000 cwt 1,000 cwt 1,000 cwt 1,000 cwt 1,000 cwt 1,000 cwt 1,000 cwt 1,000 cwt
2011 ............
2012 ............
2013 ............
2014 ............
2015 ............
14,575
16,088
15,660
14,645
16,160
10,600
12,200
(NA)
11,600
12,500
(NA)
(NA)
(NA)
(NA)
(NA)
7,400
9,400
(NA)
8,500
8,900
(NA)
(NA)
(NA)
(NA)
(NA)
4,400
(NA)
4,400
5,500
5,800
(NA)
(NA)
(NA)
(NA)
(NA)
1,600
(NA)
(D)
2,200
2,300
(D) Withheld to avoid disclosing data for individual operations.
(NA) Not available. 1 Total stocks consist of production less total disappearance to date. Disappearance includes all sales for all purposes, all potatoes eaten or fed on
farms where produced and all losses to date through shrinkage, decay, dumping, etc.

32 New England Agricultural Statistics USDA, National Agricultural Statistics Service
Sweet Corn Area Planted and Harvested, Yield, Production, Price, and Value — New England: 2011-2015
State and
Year
Area
planted
Area
harvested
Yield
per acre Production
Price per
cwt1
Value of
production
Yield
per acre Production
Price per
dozen1
acres acres cwt 1,000 cwt dollars 1,000 dollars dozen2 1,000 dozen dollars
Connecticut 2011 .......................
2012 .......................
2013 .......................
2014 .......................
2015 .......................
4,300
4,300
4,100
4,200
3,900
3,100
3,900
3,600
4,000
3,600
50
65
65
65
58
155
254
234
260
209
43.00
44.00
39.00
37.00
50.00
6,665
11,176
9,126
9,620
10,450
588
766
765
765
683
1,824
2,988
2,753
3,059
2,459
3.65
3.74
3.31
3.14
4.25
Maine 2011 .......................
2012 .......................
2013 .......................
2014 .......................
2015 .......................
1,800
1,900
1,600
1,700
1,500
1,600
1,700
1,500
1,600
1,400
60
60
55
70
61
96
102
83
112
85
50.00
51.00
51.00
45.00
45.00
4,800
5,202
4,233
5,040
3,825
706
706
651
824
714
1,129
1,200
976
1,318
1,000
4.25
4.34
4.34
3.82
3.83
Massachusetts 2011 .......................
2012 .......................
2013 .......................
2014 .......................
2015 .......................
5,300
5,400
5,100
4,600
3,400
4,600
5,000
4,700
4,300
3,300
70
65
62
66
76
322
325
291
284
251
55.00
50.00
52.00
50.00
40.00
17,710
16,250
15,132
14,200
10,040
824
765
728
777
895
3,788
3,824
3,424
3,341
2,953
4.68
4.25
4.42
4.25
3.40
New Hampshire 2011 .......................
2012 .......................
2013 .......................
2014 .......................
2015 .......................
1,500
1,700
1,500
1,500
1,400
1,300
1,500
1,400
1,400
1,300
65
60
69
65
68
85
90
97
91
88
61.00
62.00
59.00
55.00
55.00
5,185
5,580
5,723
5,005
4,840
769
706
815
765
796
1,000
1,059
1,141
1,071
1,035
5.19
5.27
5.02
4.67
4.68
Rhode Island 2011 .......................
2012 .......................
2013 .......................
2014 .......................
2015 .......................
800
950
(D)
720
(D)
650
850
(D)
690
(D)
70
75
(D)
66
(D)
46
64
(D)
46
(D)
50.00
55.00
(D)
53.00
(D)
2,300
3,520
(D)
2,438
(D)
833
886
(D)
784
(D)
541
753
(D)
541
(D)
4.25
4.67
(D)
4.51
(D)
Vermont 2011 .......................
2012 .......................
2013 .......................
2014 .......................
2015 .......................
1,000
1,100
(D)
970
(D)
700
1,000
(D)
910
(D)
40
50
(D)
51
(D)
28
50
(D)
46
(D)
53.00
52.00
(D)
68.00
(D)
1,484
2,600
(D)
3,128
(D)
471
588
(D)
595
(D)
329
588
(D)
541
(D)
4.51
4.42
(D)
5.78
(D)
New England 2011 .......................
2012 .......................
2013 .......................
2014 .......................
2015 .......................
14,700
15,350
13,900
13,690
11,590
11,950
13,950
12,680
12,900
10,890
61
63
62
65
64
732
885
787
839
693
52.11
50.09
49.73
47.00
48.00
38,144
44,328
39,134
39,431
33,035
721
746
730
765
749
8,612
10,412
9,260
9,871
8,153
4.43
4.26
4.23
3.99
4.05
(D) Withheld to avoid disclosing data for individual operations. 1 Marketing year average price. 2 Standard weight used for 1 dozen ears is 8.5 pounds.

New England Agricultural Statistics 33 USDA, National Agricultural Statistics Service
0
10
20
30
40
50
02468
1012141618
2006 2007 2008 2009 2010 2011 2012 2013 2014 2015
MillionDollars
Million Dozen
Year
Sweet Corn Production and Value —New England: 2006-2015
For Fresh Market
Production Value
Georgia13%
Colorado2%
New England3%
California20%
Florida19%
All Others15%
Oregon4%
Michigan3%
New York5%
Ohio4%
Washington12%
Sweet Corn Production — United States: 2015For Fresh Market, Percent by State

34 New England Agricultural Statistics USDA, National Agricultural Statistics Service
FRESH MARKET PRICE AND YIELD DATA
VEGETABLES AND FRUIT
USDA’s National Agricultural Statistics Service (NASS), New
England Field Office collects, analyzes, and estimates fruit and
vegetable prices and yields at the request of USDA Farm Service
Agency (FSA). Funding was provided by the State Departments
of Agriculture in Connecticut, Maine, Massachusetts, New
Hampshire, Rhode Island, and Vermont. The data provide a
valuable tool for growers to use in making production and
marketing decisions and for FSA to administer farm programs
based on State yield and price data. It is also used by Cooperative
Extension to provide outreach and education and it is used by the
State Departments of Agriculture to assist growers.
Garlic and Kale for Fresh Market Yield and Price – New England: 2015
Garlic Year
Yield
per Acre 2
All Price
per Pound 4 Kale Year
Yield
per Acre 2
All Price
per Pound 4
pounds dollars pounds dollars
Connecticut 2015 2,400 7.10 Connecticut 2015 3,600 1.40
Maine 2015 2,200 9.00 Maine 2015 3,500 2.50
Massachusetts 2015 1,600 8.70 Massachusetts 2015 19,430 0.55
New Hampshire 2015 1,500 8.65 New Hampshire 2015 4,400 2.55
Rhode Island 2015 (D) (D) Rhode Island 2015 (D) (D)
Vermont 2015 2,700 8.80 Vermont 2015 14,950 1.40
New England 5 2015 2,000 8.40 New England 5 2015 17,030 0.75
See footnotes at end of table on page 42.
Asparagus for Fresh Market Yield and Price – New England: 2011-2015
Asparagus Reports 1 Yield
per Acre 2 Reports 3
All Price
per Pound 4 Asparagus Reports 1
Yield
per Acre 2 Reports 3
All Price
per Pound 4
number pounds number dollars number pounds number dollars
Connecticut New Hampshire
2011 (NA) (NA) (NA) (NA) 2011 4 1,500 7 2.95 2012 10 1,000 14 3.65 2012 8 1,100 9 3.90
2013 (D) (D) 15 4.70 2013 (D) (D) 8 4.05
2014 1,300 4.40 2014 1,800 3.80
2015 (D) (D) 2015 1,900 3.10
Maine Rhode Island
2011 7 800 14 3.80 2011 (D) (D) (D) (D)
2012 (D) (D) 10 3.65 2012 (D) (D) (D) (D) 2013 9 1,200 14 4.00 2013 (D) (D) (D) (D)
2014 1,200 4.90 2014 (D) (D)
2015 1,200 5.80 2015 (D) (D)
Massachusetts Vermont
2011 10 1,700 29 3.20 2011 (D) (D) 13 4.15
2012 20 1,200 25 3.60 2012 17 900 17 4.45
2013 21 1,700 33 4.05 2013 (D) (D) 12 4.30
2014 1,500 4.35 2014 1,300 3.80 2015 1,400 3.10 2015 1,800 4.70
New England 5
2011 29 1,600 (D) 3.35
2012 (D) 1,100 (D) 3.75
2013 51 1,500 (D) 4.25
2014 1,400 4.35
2015 1,500 3.80
See footnotes at end of table on page 42.

New England Agricultural Statistics 35 USDA, National Agricultural Statistics Service
Snap Beans, Beets, and Broccoli for Fresh Market Yield and Price – New England: 2011-2015 Beans, Snap
(Bush and Pole) Reports 1
Yield
per Acre 2 Reports 3
All Price
per Pound 4
Beans, Snap
(Bush and Pole) Reports 1
Yield
per Acre 2 Reports 3
All Price
per Pound 4
number pounds number dollars number pounds number dollars
Connecticut New Hampshire
2011 (NA) (NA) (NA) (NA) 2011 (D) (D) 44 2.10
2012 31 3,000 49 2.05 2012 26 5.100 40 1.70
2013 27 5,400 50 1.20 2013 23 3,200 35 1.80
2014 3,500 1.25 2014 3,300 1.50
2015 3,500 1.20 2015 3,400 1.75
Maine Rhode Island
2011 36 3,700 80 1.65 2011 (D) (D) 11 1.35
2012 39 3,000 67 1.45 2012 (D) (D) 7 2.15
2013 44 3,500 66 1.55 2013 (D) (D) (D) (D)
2014 3,400 1.40 2014 (D) (D)
2015 3,100 1.15 2015 (D) (D)
Massachusetts Vermont
2011 26 3,100 76 1.65 2011 19 4,000 39 2.35
2012 50 2,500 77 1.75 2012 23 3,900 33 2.40
2013 47 2,700 78 1.80 2013 19 3,000 31 2.80
2014 3,300 1.60 2014 3,000 2.90
2015 3,300 1.60 2015 3,000 2.90
New England 5
2011 98 3,300 250 1.75
2012 (D) 3,100 273 1.90
2013 (D) 3,800 (D) 1.65
2014 3,400 1.50
2015 3,300 1.40
Beets Reports 1 Yield
per Acre 2 Reports 3
All Price
per Pound 4 Beets Reports 1
Yield
per Acre 2 Reports 3
All Price
per Pound 4
Connecticut New Hampshire
2011 (NA) (NA) (NA) (NA) 2011 (D) (D) 14 2.10
2012 (D) (D) 18 1.80 2012 (D) (D) 24 1.75
2013 (D) (D) 25 1.75 2013 (D) (D) 22 2.05
2014 5,900 1.75 2014 (D) 2.00
2015 5,000 1.50 2015 5,000 1.60
Maine Rhode Island
2011 10 9,400 34 1.35 2011 (D) (D) (D) (D)
2012 18 7,000 38 1.65 2012 (D) (D) (D) (D)
2013 32 4,900 47 1.40 2013 (D) (D) (D) (D)
2014 6,900 1.25 2014 (D) (D)
2015 5,300 1.50 2015 (D) (D)
Massachusetts Vermont
2011 11 9,000 27 1.55 2011 (D) (D) 19 1.30
2012 16 9,300 30 1.85 2012 26 9,300 29 1.05
2013 31 7,700 51 1.55 2013 22 8,200 33 1.30
2014 7,300 1.65 2014 8,300 1.15
2015 5,200 1.65 2015 9,000 1.25
New England 5
2011 31 7,700 (D) 1.50
2012 85 8,200 (D) 1.60
2013 108 6,300 (D) 1.55
2014 7,200 1.45
2015 5,900 1.50
Broccoli Reports 1 Yield
per Acre 2 Reports 3
All Price
per Pound 4 Broccoli Reports 1
Yield
per Acre 2 Reports 3
All Price
per Pound 4
Connecticut New Hampshire
2011 (NA) (NA) (NA) (NA) 2011 (D) (D) 14 2.35
2012 (D) (D) 26 2.10 2012 (D) (D) 24 1.90
2013 (D) (D) 27 1.50 2013 (D) (D) (D) (D)
2014 4,100 1.90 2014 4,200 1.90
2015 3,400 2.00 2015 6,800 1.05
Maine Rhode Island
2011 (D) (D) (D) (D) 2011 (D) (D) (D) (D)
2012 (D) (D) (D) (D) 2012 (D) (D) (D) (D)
2013 (D) (D) (D) (D) 2013 (D) (D) (D) (D)
2014 (D) (D) 2014 (D) (D)
2015 (D) (D) 2015 (D) (D)
Massachusetts Vermont
2011 6 3,200 30 1.55 2011 (D) (D) 16 2.15
2012 (D) (D) 29 2.10 2012 17 4,300 20 1.75
2013 31 5,400 52 1.75 2013 17 5,000 27 1.80
2014 3,700 1.90 2014 3,700 1.65
2015 2,700 1.80 2015 3,900 1.80
New England 5
2011 (D) (D) (D) (D)
2012 (D) (D) (D) (D)
2013 (D) (D) (D) (D)
2014 (D) (D)
2015 (D) (D)
See footnotes at end of table on page 42.
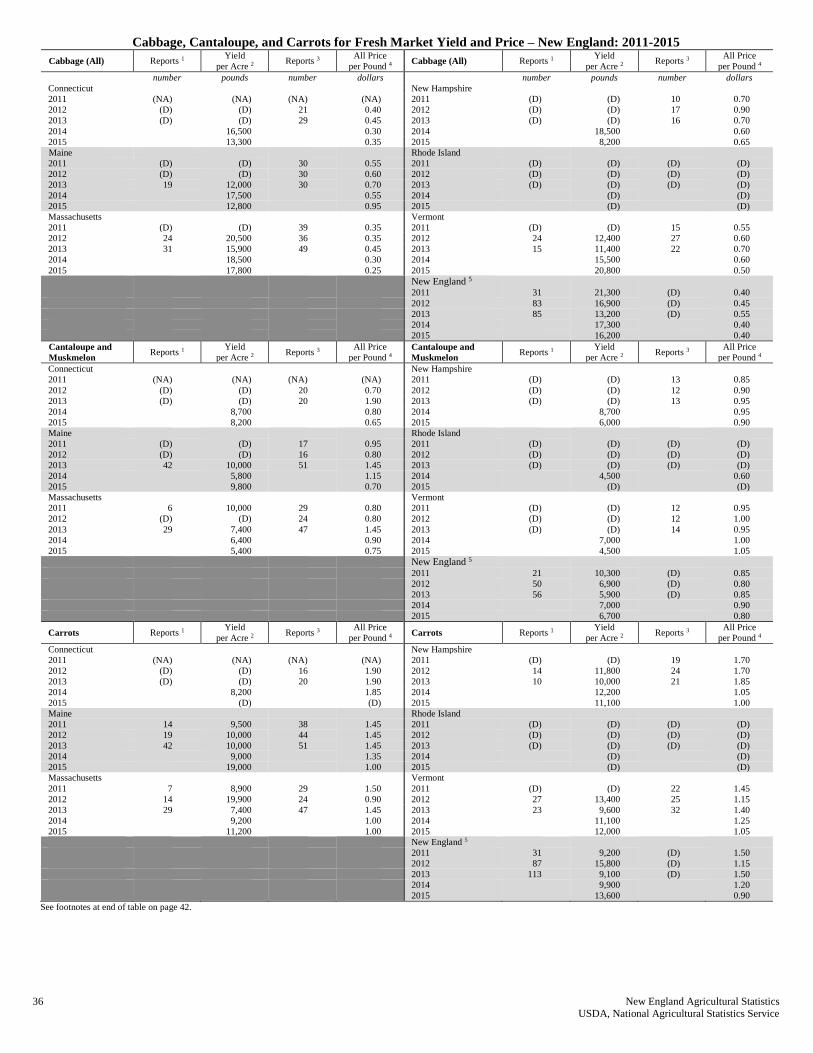
36 New England Agricultural Statistics USDA, National Agricultural Statistics Service
Cabbage, Cantaloupe, and Carrots for Fresh Market Yield and Price – New England: 2011-2015
Cabbage (All) Reports 1 Yield
per Acre 2 Reports 3
All Price
per Pound 4 Cabbage (All) Reports 1
Yield
per Acre 2 Reports 3
All Price
per Pound 4
number pounds number dollars number pounds number dollars
Connecticut New Hampshire
2011 (NA) (NA) (NA) (NA) 2011 (D) (D) 10 0.70
2012 (D) (D) 21 0.40 2012 (D) (D) 17 0.90
2013 (D) (D) 29 0.45 2013 (D) (D) 16 0.70
2014 16,500 0.30 2014 18,500 0.60
2015 13,300 0.35 2015 8,200 0.65
Maine Rhode Island
2011 (D) (D) 30 0.55 2011 (D) (D) (D) (D)
2012 (D) (D) 30 0.60 2012 (D) (D) (D) (D)
2013 19 12,000 30 0.70 2013 (D) (D) (D) (D)
2014 17,500 0.55 2014 (D) (D)
2015 12,800 0.95 2015 (D) (D)
Massachusetts Vermont
2011 (D) (D) 39 0.35 2011 (D) (D) 15 0.55
2012 24 20,500 36 0.35 2012 24 12,400 27 0.60
2013 31 15,900 49 0.45 2013 15 11,400 22 0.70
2014 18,500 0.30 2014 15,500 0.60
2015 17,800 0.25 2015 20,800 0.50
New England 5
2011 31 21,300 (D) 0.40
2012 83 16,900 (D) 0.45
2013 85 13,200 (D) 0.55
2014 17,300 0.40
2015 16,200 0.40
Cantaloupe and
Muskmelon Reports 1
Yield
per Acre 2 Reports 3
All Price
per Pound 4
Cantaloupe and
Muskmelon Reports 1
Yield
per Acre 2 Reports 3
All Price
per Pound 4
Connecticut New Hampshire
2011 (NA) (NA) (NA) (NA) 2011 (D) (D) 13 0.85
2012 (D) (D) 20 0.70 2012 (D) (D) 12 0.90
2013 (D) (D) 20 1.90 2013 (D) (D) 13 0.95
2014 8,700 0.80 2014 8,700 0.95
2015 8,200 0.65 2015 6,000 0.90
Maine Rhode Island
2011 (D) (D) 17 0.95 2011 (D) (D) (D) (D)
2012 (D) (D) 16 0.80 2012 (D) (D) (D) (D)
2013 42 10,000 51 1.45 2013 (D) (D) (D) (D)
2014 5,800 1.15 2014 4,500 0.60
2015 9,800 0.70 2015 (D) (D)
Massachusetts Vermont
2011 6 10,000 29 0.80 2011 (D) (D) 12 0.95
2012 (D) (D) 24 0.80 2012 (D) (D) 12 1.00
2013 29 7,400 47 1.45 2013 (D) (D) 14 0.95
2014 6,400 0.90 2014 7,000 1.00
2015 5,400 0.75 2015 4,500 1.05
New England 5
2011 21 10,300 (D) 0.85
2012 50 6,900 (D) 0.80
2013 56 5,900 (D) 0.85
2014 7,000 0.90
2015 6,700 0.80
Carrots Reports 1 Yield
per Acre 2 Reports 3
All Price
per Pound 4 Carrots Reports 1
Yield
per Acre 2 Reports 3
All Price
per Pound 4
Connecticut New Hampshire
2011 (NA) (NA) (NA) (NA) 2011 (D) (D) 19 1.70
2012 (D) (D) 16 1.90 2012 14 11,800 24 1.70
2013 (D) (D) 20 1.90 2013 10 10,000 21 1.85
2014 8,200 1.85 2014 12,200 1.05
2015 (D) (D) 2015 11,100 1.00
Maine Rhode Island
2011 14 9,500 38 1.45 2011 (D) (D) (D) (D)
2012 19 10,000 44 1.45 2012 (D) (D) (D) (D)
2013 42 10,000 51 1.45 2013 (D) (D) (D) (D)
2014 9,000 1.35 2014 (D) (D)
2015 19,000 1.00 2015 (D) (D)
Massachusetts Vermont
2011 7 8,900 29 1.50 2011 (D) (D) 22 1.45
2012 14 19,900 24 0.90 2012 27 13,400 25 1.15
2013 29 7,400 47 1.45 2013 23 9,600 32 1.40
2014 9,200 1.00 2014 11,100 1.25
2015 11,200 1.00 2015 12,000 1.05
New England 5
2011 31 9,200 (D) 1.50
2012 87 15,800 (D) 1.15
2013 113 9,100 (D) 1.50
2014 9,900 1.20
2015 13,600 0.90
See footnotes at end of table on page 42.
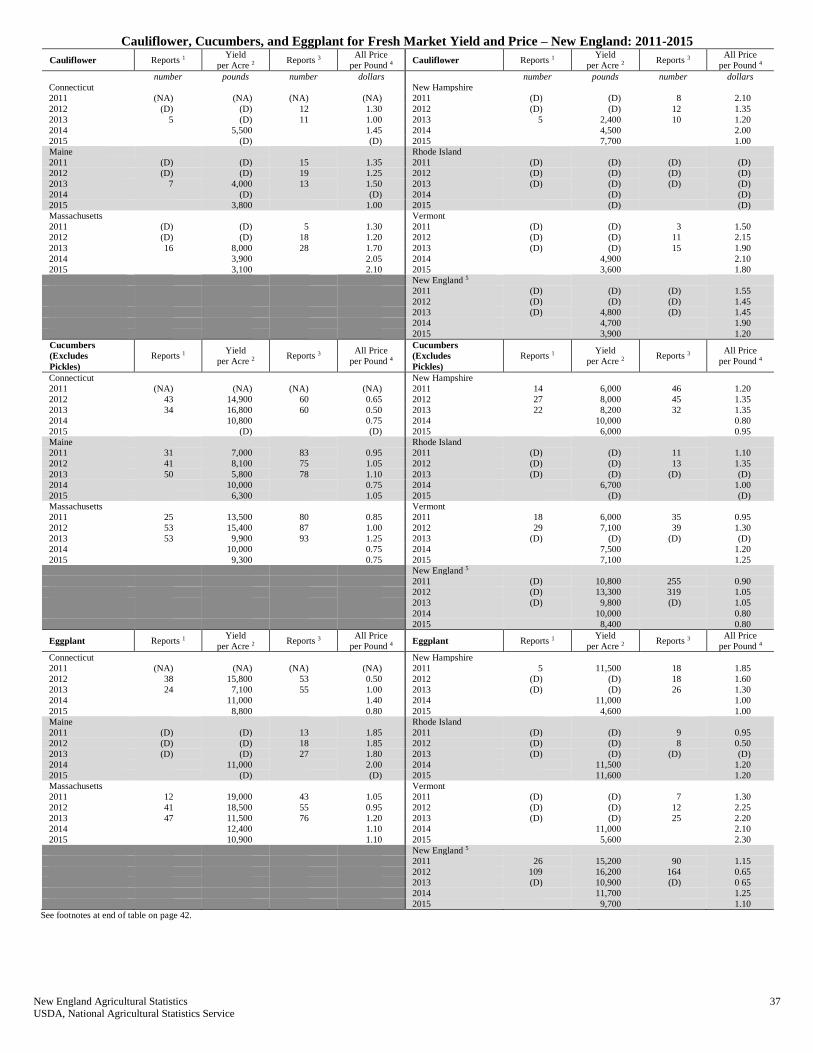
New England Agricultural Statistics 37 USDA, National Agricultural Statistics Service
Cauliflower, Cucumbers, and Eggplant for Fresh Market Yield and Price – New England: 2011-2015
Cauliflower Reports 1 Yield
per Acre 2 Reports 3
All Price
per Pound 4 Cauliflower Reports 1
Yield
per Acre 2 Reports 3
All Price
per Pound 4
number pounds number dollars number pounds number dollars
Connecticut New Hampshire
2011 (NA) (NA) (NA) (NA) 2011 (D) (D) 8 2.10
2012 (D) (D) 12 1.30 2012 (D) (D) 12 1.35
2013 5 (D) 11 1.00 2013 5 2,400 10 1.20
2014 5,500 1.45 2014 4,500 2.00
2015 (D) (D) 2015 7,700 1.00
Maine Rhode Island
2011 (D) (D) 15 1.35 2011 (D) (D) (D) (D)
2012 (D) (D) 19 1.25 2012 (D) (D) (D) (D)
2013 7 4,000 13 1.50 2013 (D) (D) (D) (D)
2014 (D) (D) 2014 (D) (D)
2015 3,800 1.00 2015 (D) (D)
Massachusetts Vermont
2011 (D) (D) 5 1.30 2011 (D) (D) 3 1.50
2012 (D) (D) 18 1.20 2012 (D) (D) 11 2.15
2013 16 8,000 28 1.70 2013 (D) (D) 15 1.90
2014 3,900 2.05 2014 4,900 2.10
2015 3,100 2.10 2015 3,600 1.80
New England 5
2011 (D) (D) (D) 1.55
2012 (D) (D) (D) 1.45
2013 (D) 4,800 (D) 1.45
2014 4,700 1.90
2015 3,900 1.20
Cucumbers
(Excludes
Pickles)
Reports 1 Yield
per Acre 2 Reports 3
All Price
per Pound 4
Cucumbers
(Excludes
Pickles)
Reports 1 Yield
per Acre 2 Reports 3
All Price
per Pound 4
Connecticut New Hampshire
2011 (NA) (NA) (NA) (NA) 2011 14 6,000 46 1.20
2012 43 14,900 60 0.65 2012 27 8,000 45 1.35
2013 34 16,800 60 0.50 2013 22 8,200 32 1.35
2014 10,800 0.75 2014 10,000 0.80
2015 (D) (D) 2015 6,000 0.95
Maine Rhode Island
2011 31 7,000 83 0.95 2011 (D) (D) 11 1.10
2012 41 8,100 75 1.05 2012 (D) (D) 13 1.35
2013 50 5,800 78 1.10 2013 (D) (D) (D) (D)
2014 10,000 0.75 2014 6,700 1.00
2015 6,300 1.05 2015 (D) (D)
Massachusetts Vermont
2011 25 13,500 80 0.85 2011 18 6,000 35 0.95
2012 53 15,400 87 1.00 2012 29 7,100 39 1.30
2013 53 9,900 93 1.25 2013 (D) (D) (D) (D)
2014 10,000 0.75 2014 7,500 1.20
2015 9,300 0.75 2015 7,100 1.25
New England 5
2011 (D) 10,800 255 0.90
2012 (D) 13,300 319 1.05
2013 (D) 9,800 (D) 1.05
2014 10,000 0.80
2015 8,400 0.80
Eggplant Reports 1 Yield
per Acre 2 Reports 3
All Price
per Pound 4 Eggplant Reports 1
Yield
per Acre 2 Reports 3
All Price
per Pound 4
Connecticut New Hampshire
2011 (NA) (NA) (NA) (NA) 2011 5 11,500 18 1.85
2012 38 15,800 53 0.50 2012 (D) (D) 18 1.60
2013 24 7,100 55 1.00 2013 (D) (D) 26 1.30
2014 11,000 1.40 2014 11,000 1.00
2015 8,800 0.80 2015 4,600 1.00
Maine Rhode Island
2011 (D) (D) 13 1.85 2011 (D) (D) 9 0.95
2012 (D) (D) 18 1.85 2012 (D) (D) 8 0.50
2013 (D) (D) 27 1.80 2013 (D) (D) (D) (D)
2014 11,000 2.00 2014 11,500 1.20
2015 (D) (D) 2015 11,600 1.20
Massachusetts Vermont
2011 12 19,000 43 1.05 2011 (D) (D) 7 1.30
2012 41 18,500 55 0.95 2012 (D) (D) 12 2.25
2013 47 11,500 76 1.20 2013 (D) (D) 25 2.20
2014 12,400 1.10 2014 11,000 2.10
2015 10,900 1.10 2015 5,600 2.30
New England 5
2011 26 15,200 90 1.15
2012 109 16,200 164 0.65
2013 (D) 10,900 (D) 0 65
2014 11,700 1.25
2015 9,700 1.10
See footnotes at end of table on page 42.

38 New England Agricultural Statistics USDA, National Agricultural Statistics Service
Lettuce, by Type for Fresh Market Yield and Price – New England: 2011-2015
Lettuce, Head Reports 1 Yield
per Acre 2 Reports 3
All Price
per Pound 4 Lettuce, Head Reports 1
Yield
per Acre 2 Reports 3
All Price
per Pound 4
number pounds number dollars number pounds number dollars
Connecticut New Hampshire
2011 (NA) (NA) (NA) (NA) 2011 (D) (D) 10 2.10
2012 (D) (D) 12 2.35 2012 10 9,600 18 1.55
2013 (D) (D) 11 2.35 2013 (D) (D) 10 1.60
2014 6,100 2.95 2014 9,000 1.70
2015 (D) (D) 2015 7,600 2.00
Maine Rhode Island
2011 (D) (D) 11 1.95 2011 (D) (D) (D) (D)
2012 (D) (D) 13 2.20 2012 (D) (D) (D) (D)
2013 (D) (D) 18 2.00 2013 (D) (D) (D) (D)
2014 6,300 2.30 2014 (D) (D)
2015 (D) (D) 2015 (D) (D)
Massachusetts Vermont
2011 (D) (D) 10 1.80 2011 (D) (D) 9 2.30
2012 10 12,800 19 1.55 2012 14 11,900 14 2.15
2013 20 10,500 28 1.55 2013 (D) (D) 18 2.15
2014 9,200 1.80 2014 7,600 2.25
2015 7,100 2.50 2015 7,600 2.20
New England 5
2011 (D) (D) (D) 1.85
2012 45 11,900 (D) 1.70
2013 (D) 9,300 (D) 1.60
2014 7,600 2.05
2015 8,140 2.10
Lettuce, Leaf Reports 1 Yield
per Acre 2 Reports 3
All Price
per Pound 4 Lettuce, Leaf Reports 1
Yield
per Acre 2 Reports 3
All Price
per Pound 4
Connecticut New Hampshire
2011 (NA) (NA) (NA) (NA) 2011 (D) (D) 20 2.75
2012 (D) (D) 20 3.40 2012 12 5,500 22 3.00
2013 (D) (D) 25 3.00 2013 11 3,000 16 (D)
2014 3,900 3.30 2014 5,900 2.20
2015 5,800 (D) 2015 5,000 3.20
Maine Rhode Island
2011 (D) (D) 14 3.15 2011 (D) (D) (D) (D)
2012 (D) (D) 28 3.30 2012 (D) (D) (D) (D)
2013 (D) (D) 26 3.30 2013 (D) (D) (D) (D)
2014 4,400 4.10 2014 (D) (D)
2015 3,400 5.00 2015 (D) (D)
Massachusetts Vermont
2011 10 4,600 31 2.20 2011 (D) (D) 11 1.30
2012 19 4,700 33 2.40 2012 19 6,900 20 2.30
2013 34 5,500 46 1.00 2013 12 10,000 16 3.00
2014 7,100 2.85 2014 6,700 2.60
2015 4,800 2.50 2015 6,650 1.70
New England 5
2011 20 4,400 (D) 2.20
2012 80 4,800 (D) 2.70
2013 (D) 8,000 (D) 3.00
2014 6,400 2.75
2015 5,550 2.20
Lettuce,
Romaine Reports 1
Yield
per Acre 2 Reports 3
All Price
per Pound 4
Lettuce,
Romaine Reports 1
Yield
per Acre 2 Reports 3
All Price
per Pound 4
Connecticut New Hampshire
2011 (NA) (NA) (NA) (NA) 2011 (D) (D) 10 2.10
2012 (D) (D) 6 1.75 2012 (D) (D) 8 2.85
2013 (D) (D) (D) 2.30 2013 (D) (D) 10 2.60
2014 6,900 1.70 2014 5,900 1.30
2015 (D) (D) 2015 (D) (D)
Maine Rhode Island
2011 (D) (D) 5 1.95 2011 (D) (D) (D) (D)
2012 (D) (D) 11 2.35 2012 (D) (D) (D) (D)
2013 (D) (D) (D) 2.35 2013 (D) (D) (D) (D)
2014 5,000 2.20 2014 (D) (D)
2015 (D) (D) 2015 (D) (D)
Massachusetts Vermont
2011 (D) (D) 15 2.10 2011 (D) (D) 12 1.20
2012 (D) (D) 13 2.00 2012 (D) (D) 12 1.75
2013 20 6,000 32 2.00 2013 (D) 5,000 (D) (D)
2014 7,100 1.30 2014 5,800 2.00
2015 (D) (D) 2015 (D) (D)
New England 5
2011 (D) (D) (D) 1.95
2012 26 5,400 (D) 2.05
2013 (D) 5,400 (D) 2.00
2014 6,600 1.50
2015 6,150 2.00
See footnotes at end of table on page 42.

New England Agricultural Statistics 39 USDA, National Agricultural Statistics Service
Onions, by Type and Green Peas for Fresh Market Yield and Price – New England: 2011-2015
Onions, Dry Reports 1 Yield
per Acre 2 Reports 3
All Price
per Pound 4 Onions, Dry Reports 1
Yield
per Acre 2 Reports 3
All Price
per Pound 4
number pounds number dollars number pounds number dollars
Connecticut New Hampshire
2011 (NA) (NA) (NA) (NA) 2011 10 9,500 21 1.55
2012 (D) (D) 23 1.95 2012 13 9,400 19 1.40
2013 10 (D) 16 1.70 2013 9 10,000 16 1.55
2014 6,500 1.90 2014 9,500 1.35
2015 6,500 2.10 2015 6,000 1.65
Maine Rhode Island
2011 13 6,300 30 1.30 2011 (D) (D) (D) (D)
2012 18 6,200 27 1.55 2012 (D) (D) (D) (D)
2013 26 10,500 31 1.60 2013 (D) (D) (D) (D)
2014 10,000 (D) 2014 (D) (D)
2015 9,500 1.70 2015 (D) (D)
Massachusetts Vermont
2011 11 11,500 19 0.50 2011 6 12,300 22 1.60
2012 20 11,500 25 0.90 2012 15 11,700 16 1.35
2013 28 12,000 40 1.20 2013 19 14,800 23 1.60
2014 11,100 1.90 2014 8,900 1.35
2015 9,500 0.60 2015 10,700 1.20
New England 5
2011 (D) 11,000 (D) 0.80
2012 86 10,700 (D) 1.10
2013 (D) 12,000 (D) 1.35
2014 9,300 1.95
2015 8,900 1.15
Onions, Green Reports 1 Yield
per Acre 2 Reports 3
All Price
per Pound 4 Onions, Green Reports 1
Yield
per Acre 2 Reports 3
All Price
per Pound 4
Connecticut New Hampshire
2011 (NA) (NA) (NA) (NA) 2011 (D) (D) 5 2.20
2012 (D) (D) 13 2.00 2012 (D) (D) 9 1.80
2013 (D) (D) 16 2.75 2013 (D) (D) 11 3.25
2014 4,200 1.80 2014 5,200 2.25
2015 (D) (D) 2015 5,900 1.40
Maine Rhode Island
2011 (D) (D) 9 2.40 2011 (D) (D) (D) (D)
2012 (D) (D) 22 2.00 2012 (D) (D) (D) (D)
2013 (D) (D) 20 3.20 2013 (D) (D) (D) (D)
2014 5,200 1.85 2014 4,700 (D)
2015 4,100 1.75 2015 (D) (D)
Massachusetts Vermont
2011 (D) (D) 9 2.15 2011 (D) (D) 3 1.55
2012 (D) (D) 16 1.85 2012 (D) (D) 8 1.95
2013 19 6,100 30 3.10 2013 11 4,800 15 3.35
2014 7,000 1.30 2014 4,500 1.80
2015 5,700 2.20 2015 6,100 1.30
New England 5
2011 (D) (D) (D) 2.10
2012 (D) (D) (D) 1.90
2013 57 5,600 (D) 3.20
2014 6,000 1.55
2015 1.90
Peas, Green
(Fresh Only) Reports 1
Yield
per Acre 2 Reports 3
All Price
per Pound 4
Peas, Green
(Fresh Only) Reports 1
Yield
per Acre 2 Reports 3
All Price
per Pound 4
Connecticut New Hampshire
2011 (NA) (NA) (NA) (NA) 2011 (D) (D) 20 2.65
2012 (D) (D) 19 2.55 2012 10 1,600 23 2.65
2013 13 1,800 24 1.65 2013 14 2,900 19 2.75
2014 2,000 2.75 2014 1,800 2.50
2015 2,000 (D) 2015 2,200 2.90
Maine Rhode Island
2011 (D) (D) 47 2.25 2011 (D) (D) (D) (D)
2012 (D) (D) 43 2.50 2012 (D) (D) (D) (D)
2013 30 2,700 44 2.60 2013 (D) (D) (D) (D)
2014 1,900 3.85 2014 (D) (D)
2015 2,600 2.50 2015 (D) (D)
Massachusetts Vermont
2011 9 1,300 32 2.25 2011 (D) (D) 19 3.05
2012 16 3,400 26 2.90 2012 (D) (D) 17 3.15
2013 29 2,500 47 2.65 2013 9 1,700 17 3.75
2014 2,200 3.85 2014 1,800 3.75
2015 2,300 2.50 2015 2,100 3.05
New England 5
2011 28 1,500 (D) 2.40
2012 71 2,300 (D) 2.65
2013 (D) 2,400 (D) 2.80
2014 2,000 3.35
2015 2,300 2.65
See footnotes at end of table on page 42.

40 New England Agricultural Statistics USDA, National Agricultural Statistics Service
Peppers, by Type and Pumpkins for Fresh Market Yield and Price – New England: 2011-2015
Peppers, Bell Reports 1 Yield
per Acre 2 Reports 3
All Price
per Pound 4 Peppers, Bell Reports 1
Yield
per Acre 2 Reports 3
All Price
per Pound 4
number pounds number dollars number pounds number dollars
Connecticut New Hampshire
2011 (NA) (NA) (NA) (NA) 2011 10 13,000 34 1.70
2012 48 8,700 68 0.65 2012 20 9,500 34 1.75
2013 28 13,900 50 0.75 2013 20 12,900 33 1.40
2014 10,900 0.80 2014 11,100 1.50
2015 8,500 0.95 2015 9,500 1.70
Maine Rhode Island
2011 (D) (D) 31 1.70 2011 (D) (D) 10 0.70
2012 (D) (D) 41 1.65 2012 (D) (D) 8 0.60
2013 29 6,400 51 2.00 2013 (D) (D) (D) (D)
2014 10,900 1.15 2014 10,800 0.90
2015 8,000 1.10 2015 (D) (D)
Massachusetts Vermont
2011 21 13,700 78 0.95 2011 (D) (D) 23 1.15
2012 54 13,400 78 1.00 2012 (D) (D) 19 1.75
2013 58 11,200 88 1.10 2013 17 6,700 26 2.15
2014 11,700 0.95 2014 9,500 2.15
2015 12,200 0.90 2015 7,500 1.95
New England 5
2011 48 11,500 176 1.05
2012 165 10,400 248 0.90
2013 (D) 11,900 (D) 1.15
2014 11,200 1.05
2015 9,500 1.10
Peppers, Other
(Excludes Bell) Reports 1
Yield
per Acre 2 Reports 3
All Price
per Pound 4
Peppers, Other
(Excludes Bell) Reports 1
Yield
per Acre 2 Reports 3
All Price
per Pound 4
Connecticut New Hampshire
2011 (NA) (NA) (NA) (NA) 2011 (D) (D) 7 2.45
2012 (D) (D) 35 0.95 2012 (D) (D) 14 3.10
2013 16 2,800 32 1.15 2013 11 7,000 15 2.90
2014 2,700 1.30 2014 6,900 (D)
2015 4,100 1.45 2015 4,000 3.15
Maine Rhode Island
2011 (D) (D) 9 2.70 2011 (D) (D) (D) (D)
2012 (D) (D) 16 2.35 2012 (D) (D) (D) (D)
2013 (D) (D) 15 2.45 2013 (D) (D) (D) (D)
2014 3,900 (D) 2014 7,000 (D)
2015 (D) 2015 (D) (D)
Massachusetts Vermont
2011 (D) (D) 23 1.70 2011 (D) (D) 5 3.10
2012 (D) (D) 26 1.15 2012 (D) (D) 9 3.65
2013 24 4,000 41 1.50 2013 8 14,000 10 3.25
2014 7,500 0.95 2014 6,600 3.50
2015 (D) 2015 (D) (D)
New England 5
2011 (D) (D) (D) 2.05
2012 65 7,400 (D) 1.30
2013 66 4,500 (D) 1.70
2014 5,700 1.35
2015 5,500 1.50
Pumpkins Reports 1 Yield
per Acre 2 Reports 3
All Price
per Pound 4 Pumpkins Reports 1
Yield
per Acre 2 Reports 3
All Price
per Pound 4
Connecticut New Hampshire
2011 (NA) (NA) (NA) (NA) 2011 29 9,100 64 0.35
2012 53 9,600 74 0.45 2012 46 11,200 62 0.40
2013 42 8,000 52 0.40 2013 30 9,700 45 0.45
2014 6,300 0.25 2014 12,000 0.40
2015 7,600 0.40 2015 10,300 0.35
Maine Rhode Island
2011 50 9,100 104 0.35 2011 4 8,700 14 0.40
2012 58 9,100 94 0.40 2012 8 11,300 12 0.45
2013 52 8,400 73 0.40 2013 4 5,000 8 0.55
2014 7,500 0.35 2014 9,300 0.50
2015 12,400 0.35 2015 9,500 (D)
Massachusetts Vermont
2011 54 9,600 131 0.40 2011 19 8,200 51 0.30
2012 88 9,500 119 0.40 2012 38 7,100 46 0.35
2013 71 11,200 101 0.45 2013 27 7,300 37 0.70
2014 8,300 (D) 2014 8,200 0.45
2015 9,100 0.25 2015 17,200 0.25
New England 5
2011 156 9,200 364 0.35
2012 291 9,600 407 0.40
2013 226 9,200 316 0.45
2014 8,100 0.45
2015 12,500 0.25
See footnotes at end of table on page 42.
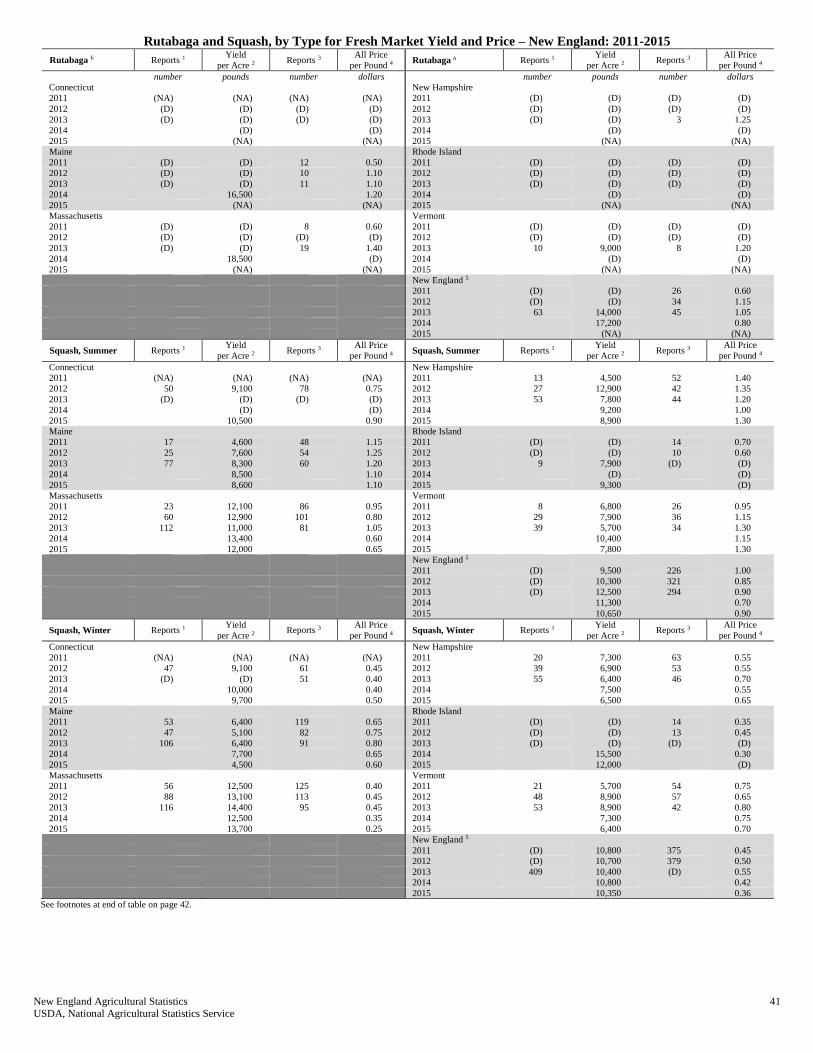
New England Agricultural Statistics 41 USDA, National Agricultural Statistics Service
Rutabaga and Squash, by Type for Fresh Market Yield and Price – New England: 2011-2015
Rutabaga 6 Reports 1 Yield
per Acre 2 Reports 3
All Price
per Pound 4 Rutabaga 6 Reports 1
Yield
per Acre 2 Reports 3
All Price
per Pound 4
number pounds number dollars number pounds number dollars
Connecticut New Hampshire
2011 (NA) (NA) (NA) (NA) 2011 (D) (D) (D) (D)
2012 (D) (D) (D) (D) 2012 (D) (D) (D) (D)
2013 (D) (D) (D) (D) 2013 (D) (D) 3 1.25
2014 (D) (D) 2014 (D) (D)
2015 (NA) (NA) 2015 (NA) (NA)
Maine Rhode Island
2011 (D) (D) 12 0.50 2011 (D) (D) (D) (D)
2012 (D) (D) 10 1.10 2012 (D) (D) (D) (D)
2013 (D) (D) 11 1.10 2013 (D) (D) (D) (D)
2014 16,500 1.20 2014 (D) (D)
2015 (NA) (NA) 2015 (NA) (NA)
Massachusetts Vermont
2011 (D) (D) 8 0.60 2011 (D) (D) (D) (D)
2012 (D) (D) (D) (D) 2012 (D) (D) (D) (D)
2013 (D) (D) 19 1.40 2013 10 9,000 8 1.20
2014 18,500 (D) 2014 (D) (D)
2015 (NA) (NA) 2015 (NA) (NA)
New England 5
2011 (D) (D) 26 0.60
2012 (D) (D) 34 1.15
2013 63 14,000 45 1.05
2014 17,200 0.80
2015 (NA) (NA)
Squash, Summer Reports 1 Yield
per Acre 2 Reports 3
All Price
per Pound 4 Squash, Summer Reports 1
Yield
per Acre 2 Reports 3
All Price
per Pound 4
Connecticut New Hampshire
2011 (NA) (NA) (NA) (NA) 2011 13 4,500 52 1.40
2012 50 9,100 78 0.75 2012 27 12,900 42 1.35
2013 (D) (D) (D) (D) 2013 53 7,800 44 1.20
2014 (D) (D) 2014 9,200 1.00
2015 10,500 0.90 2015 8,900 1.30
Maine Rhode Island
2011 17 4,600 48 1.15 2011 (D) (D) 14 0.70
2012 25 7,600 54 1.25 2012 (D) (D) 10 0.60
2013 77 8,300 60 1.20 2013 9 7,900 (D) (D)
2014 8,500 1.10 2014 (D) (D)
2015 8,600 1.10 2015 9,300 (D)
Massachusetts Vermont
2011 23 12,100 86 0.95 2011 8 6,800 26 0.95
2012 60 12,900 101 0.80 2012 29 7,900 36 1.15
2013 112 11,000 81 1.05 2013 39 5,700 34 1.30
2014 13,400 0.60 2014 10,400 1.15
2015 12,000 0.65 2015 7,800 1.30
New England 5
2011 (D) 9,500 226 1.00
2012 (D) 10,300 321 0.85
2013 (D) 12,500 294 0.90
2014 11,300 0.70
2015 10,650 0.90
Squash, Winter Reports 1 Yield
per Acre 2 Reports 3
All Price
per Pound 4 Squash, Winter Reports 1
Yield
per Acre 2 Reports 3
All Price
per Pound 4
Connecticut New Hampshire
2011 (NA) (NA) (NA) (NA) 2011 20 7,300 63 0.55
2012 47 9,100 61 0.45 2012 39 6,900 53 0.55
2013 (D) (D) 51 0.40 2013 55 6,400 46 0.70
2014 10,000 0.40 2014 7,500 0.55
2015 9,700 0.50 2015 6,500 0.65
Maine Rhode Island
2011 53 6,400 119 0.65 2011 (D) (D) 14 0.35
2012 47 5,100 82 0.75 2012 (D) (D) 13 0.45
2013 106 6,400 91 0.80 2013 (D) (D) (D) (D)
2014 7,700 0.65 2014 15,500 0.30
2015 4,500 0.60 2015 12,000 (D)
Massachusetts Vermont
2011 56 12,500 125 0.40 2011 21 5,700 54 0.75
2012 88 13,100 113 0.45 2012 48 8,900 57 0.65
2013 116 14,400 95 0.45 2013 53 8,900 42 0.80
2014 12,500 0.35 2014 7,300 0.75
2015 13,700 0.25 2015 6,400 0.70
New England 5
2011 (D) 10,800 375 0.45
2012 (D) 10,700 379 0.50
2013 409 10,400 (D) 0.55
2014 10,800 0.42
2015 10,350 0.36
See footnotes at end of table on page 42.
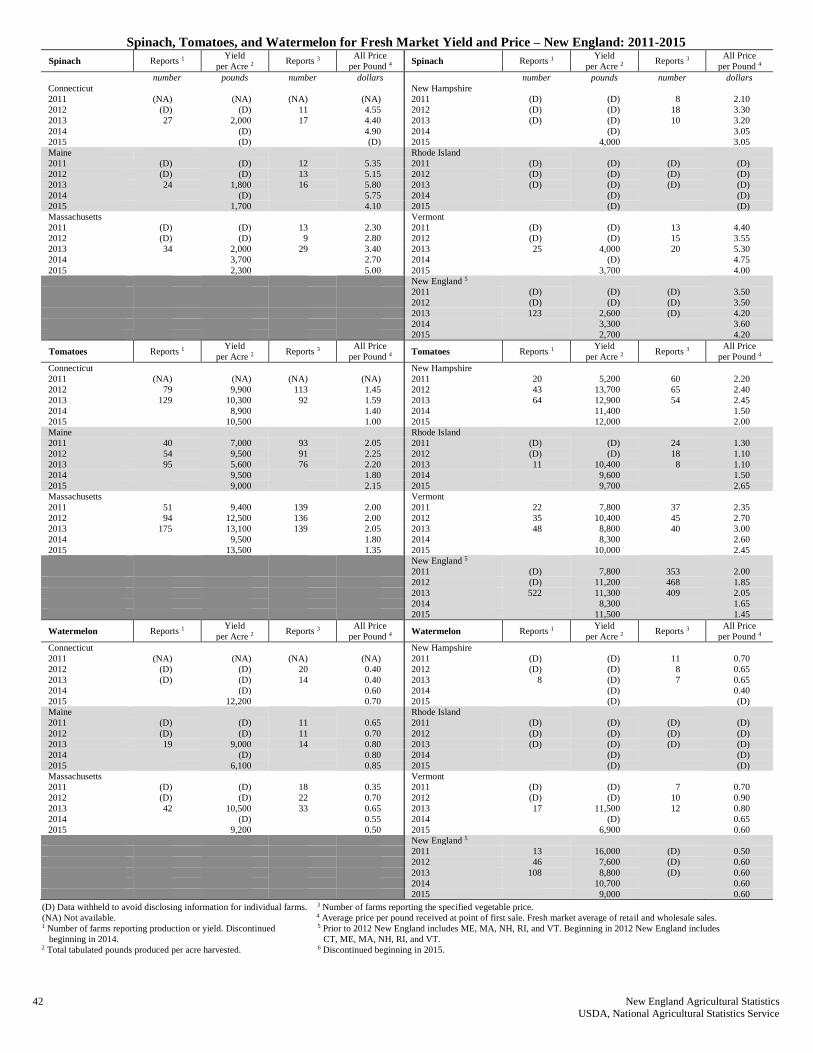
42 New England Agricultural Statistics USDA, National Agricultural Statistics Service
Spinach, Tomatoes, and Watermelon for Fresh Market Yield and Price – New England: 2011-2015
Spinach Reports 1 Yield
per Acre 2 Reports 3
All Price
per Pound 4 Spinach Reports 1
Yield
per Acre 2 Reports 3
All Price
per Pound 4
number pounds number dollars number pounds number dollars
Connecticut New Hampshire
2011 (NA) (NA) (NA) (NA) 2011 (D) (D) 8 2.10
2012 (D) (D) 11 4.55 2012 (D) (D) 18 3.30
2013 27 2,000 17 4.40 2013 (D) (D) 10 3.20
2014 (D) 4.90 2014 (D) 3.05
2015 (D) (D) 2015 4,000 3.05
Maine Rhode Island
2011 (D) (D) 12 5.35 2011 (D) (D) (D) (D)
2012 (D) (D) 13 5.15 2012 (D) (D) (D) (D)
2013 24 1,800 16 5.80 2013 (D) (D) (D) (D)
2014 (D) 5.75 2014 (D) (D)
2015 1,700 4.10 2015 (D) (D)
Massachusetts Vermont
2011 (D) (D) 13 2.30 2011 (D) (D) 13 4.40
2012 (D) (D) 9 2.80 2012 (D) (D) 15 3.55
2013 34 2,000 29 3.40 2013 25 4,000 20 5.30
2014 3,700 2.70 2014 (D) 4.75
2015 2,300 5.00 2015 3,700 4.00
New England 5
2011 (D) (D) (D) 3.50
2012 (D) (D) (D) 3.50
2013 123 2,600 (D) 4.20
2014 3,300 3.60
2015 2,700 4.20
Tomatoes Reports 1 Yield
per Acre 2 Reports 3
All Price
per Pound 4 Tomatoes Reports 1
Yield
per Acre 2 Reports 3
All Price
per Pound 4
Connecticut New Hampshire
2011 (NA) (NA) (NA) (NA) 2011 20 5,200 60 2.20
2012 79 9,900 113 1.45 2012 43 13,700 65 2.40
2013 129 10,300 92 1.59 2013 64 12,900 54 2.45
2014 8,900 1.40 2014 11,400 1.50
2015 10,500 1.00 2015 12,000 2.00
Maine Rhode Island
2011 40 7,000 93 2.05 2011 (D) (D) 24 1.30
2012 54 9,500 91 2.25 2012 (D) (D) 18 1.10
2013 95 5,600 76 2.20 2013 11 10,400 8 1.10
2014 9,500 1.80 2014 9,600 1.50
2015 9,000 2.15 2015 9,700 2.65
Massachusetts Vermont
2011 51 9,400 139 2.00 2011 22 7,800 37 2.35
2012 94 12,500 136 2.00 2012 35 10,400 45 2.70
2013 175 13,100 139 2.05 2013 48 8,800 40 3.00
2014 9,500 1.80 2014 8,300 2.60
2015 13,500 1.35 2015 10,000 2.45
New England 5
2011 (D) 7,800 353 2.00
2012 (D) 11,200 468 1.85
2013 522 11,300 409 2.05
2014 8,300 1.65
2015 11,500 1.45
Watermelon Reports 1 Yield
per Acre 2 Reports 3
All Price
per Pound 4 Watermelon Reports 1
Yield
per Acre 2 Reports 3
All Price
per Pound 4
Connecticut New Hampshire
2011 (NA) (NA) (NA) (NA) 2011 (D) (D) 11 0.70
2012 (D) (D) 20 0.40 2012 (D) (D) 8 0.65
2013 (D) (D) 14 0.40 2013 8 (D) 7 0.65
2014 (D) 0.60 2014 (D) 0.40
2015 12,200 0.70 2015 (D) (D)
Maine Rhode Island
2011 (D) (D) 11 0.65 2011 (D) (D) (D) (D)
2012 (D) (D) 11 0.70 2012 (D) (D) (D) (D)
2013 19 9,000 14 0.80 2013 (D) (D) (D) (D)
2014 (D) 0.80 2014 (D) (D)
2015 6,100 0.85 2015 (D) (D)
Massachusetts Vermont
2011 (D) (D) 18 0.35 2011 (D) (D) 7 0.70
2012 (D) (D) 22 0.70 2012 (D) (D) 10 0.90
2013 42 10,500 33 0.65 2013 17 11,500 12 0.80
2014 (D) 0.55 2014 (D) 0.65
2015 9,200 0.50 2015 6,900 0.60
New England 5
2011 13 16,000 (D) 0.50
2012 46 7,600 (D) 0.60
2013 108 8,800 (D) 0.60
2014 10,700 0.60
2015 9,000 0.60
(D) Data withheld to avoid disclosing information for individual farms. 3 Number of farms reporting the specified vegetable price.
(NA) Not available. 4 Average price per pound received at point of first sale. Fresh market average of retail and wholesale sales. 1 Number of farms reporting production or yield. Discontinued 5 Prior to 2012 New England includes ME, MA, NH, RI, and VT. Beginning in 2012 New England includes
beginning in 2014. CT, ME, MA, NH, RI, and VT. 2 Total tabulated pounds produced per acre harvested. 6 Discontinued beginning in 2015.

New England Agricultural Statistics 43 USDA, National Agricultural Statistics Service
Blueberries, Raspberries, and Strawberries for Fresh Market Yield and Price – New England: 2011-2015 Blueberries, Cultivated
(Highbush) Reports 1
Yield per
Acre 2 Reports 3
All Price per
Pound 4
Blueberries, Cultivated
(Highbush) Reports 1
Yield per
Acre 2 Reports 3 All Price per
Pound 4
number pounds number dollars number pounds number dollars
Connecticut New Hampshire
2011 (NA) (NA) (NA) (NA) 2011 37 3,400 65 2.85
2012 26 2,900 64 2.65 2012 48 2,900 64 2.85
2013 32 2,100 48 2.65 2013 38 2,600 49 3.20
2014 1,900 2.80 2014 2,100 2.95
2015 1,800 2.80 2015 2,600 3.30
Maine Rhode Island
2011 33 2,500 62 2.40 2011 9 1,800 14 2.90
2012 40 3,000 66 2.70 2012 8 2,700 14 3.20
2013 39 2,300 53 2.55 2013 8 2,800 12 2.90
2014 1,900 2.45 2014 1,300 3.60
2015 2,800 1.90 2015 1,600 2.80
Massachusetts Vermont
2011 63 2.200 110 2.95 2011 16 3,400 38 2.80
2012 56 2,700 102 2.90 2012 16 2,500 40 3.00
2013 75 2,600 104 3.25 2013 21 2,300 32 2.95
2014 1,600 3.15 2014 1,600 3.30
2015 2,000 3.40 2015 1,200 3.40
New England 5
2011 158 2,600 289 2.80
2012 194 2,800 350 2.85
2013 213 2,400 298 2.95
2014 1,800 2.80
2015 2,200 2.90
Raspberries, All Reports 1Yield per
Acre 2 Reports 3
All Price per
Pound 4 Raspberries, All Reports 1
Yield per
Acre 2 Reports 3
All Price per
Pound 4
Connecticut New Hampshire
2011 (NA) (NA) (NA) (NA) 2011 13 3,100 39 6.00
2012 11 900 40 6.95 2012 11 2,300 34 6.10
2013 8 1,100 17 6.00 2013 12 2,600 29 6.05
2014 1,200 4.65 2014 1,300 6.15
2015 2,000 (D) 2015 1,600 4.40
Maine Rhode Island
2011 27 1,000 54 4.80 2011 (D) (D) 6 6.35
2012 14 1,100 41 4.90 2012 (D) (D) 6 6.00
2013 21 1,700 39 4.90 2013 (D) (D) 6 6.00
2014 2,800 5.20 2014 (D) (D)
2015 2,100 4.80 2015 (D) (D)
Massachusetts Vermont
2011 20 1,400 64 5.85 2011 12 1,100 34 5,40
2012 20 1,500 57 5.90 2012 11 700 26 5.90
2013 28 2,500 48 6.10 2013 14 2,100 21 5.90
2014 2,100 6.00 2014 1,300 6.05
2015 2,600 7.10 2015 1,100 4.90
New England 5
2011 (D) 1,500 197 5.55
2012 (D) 1,300 204 6.00
2013 (D) 2,000 160 5.75
2014 1,850 5.60
2015 1,900 5.85
Strawberries Reports 1Yield per
Acre 2 Reports 3
All Price per
Pound 4 Strawberries Reports 1
Yield per
Acre 2 Reports 3
All Price per
Pound 4
Connecticut New Hampshire
2011 (NA) (NA) (NA) (NA) 2011 8 6,300 29 3.10
2012 15 4,600 28 3.00 2012 14 5,900 23 2.95
2013 9 2,800 25 2.45 2013 12 4,000 21 3.05
2014 4,400 2.40 2014 5,100 2.45
2015 3,500 2.80 2015 6,000 2.65
Maine Rhode Island
2011 25 4,400 56 2.25 2011 (D) (D) 5 3.00
2012 24 5,300 49 2.45 2012 (D) (D) 6 3.15
2013 27 3,700 38 2.20 2013 (D) (D) 6 3.40
2014 4,200 2.60 2014 (D) (D)
2015 6,000 2.65 2015 (D) (D)
Massachusetts Vermont
2011 23 6,600 64 2.65 2011 16 3,300 38 2.75
2012 22 4,900 48 2.45 2012 19 4,200 34 3.00
2013 31 5,100 53 2.90 2013 14 3,000 23 3.15
2014 3,900 3.05 2014 4,700 3.10
2015 3,000 3.10 2015 5,500 3.20
New England 5
2011 (D) 5,100 192 2.55
2012 (D) 5,000 188 2.80
2013 (D) 3,800 166 2.70
2014 4,300 2.80
2015 4,600 2.90
(D) Data withheld to avoid disclosing information for individual farms or insufficient
number of reports to set estimate.
(NA) Not available. 1 Number of farms reporting production or yield. Discontinued beginning in 2014. 2 Total tabulated pounds produced per bearing acre harvested.
3 Number of farms reporting a berry price. 4 Average price per pound received at point of first sale. Fresh market average of retail
and wholesale sales. 5 Prior to 2012 New England includes ME, MA, NH, RI, and VT. Beginning in 2012
New England includes CT, ME, MA, NH, RI, and VT.
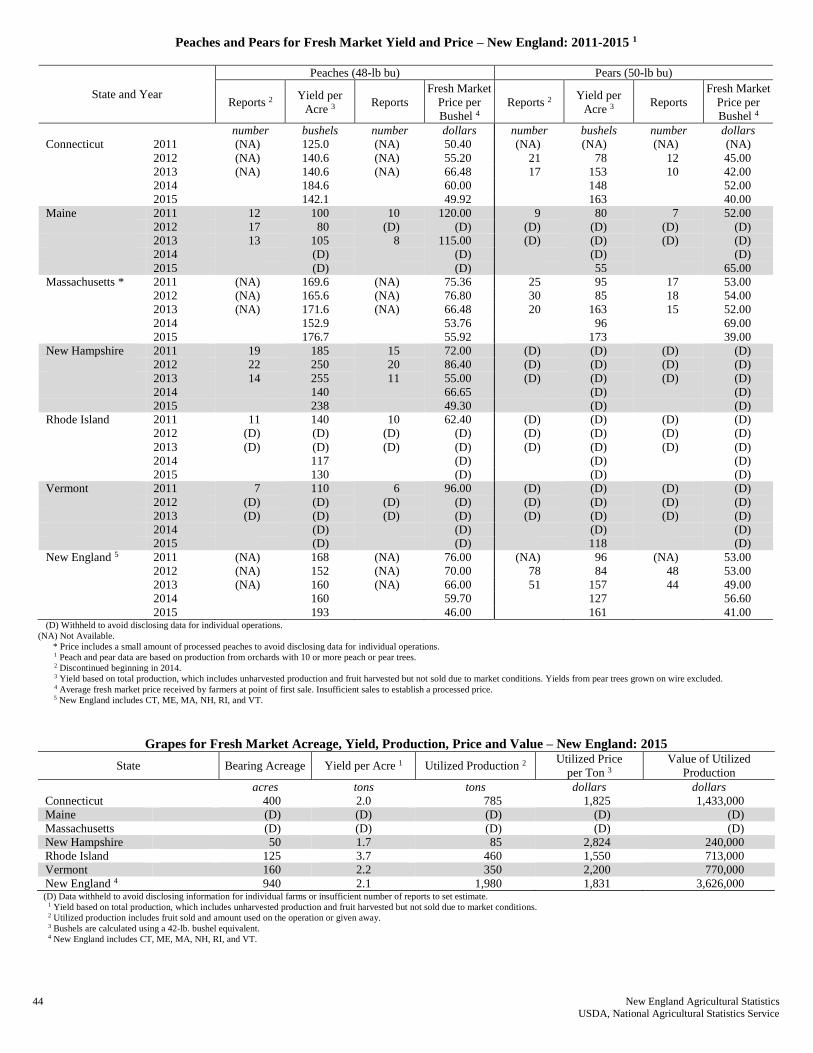
44 New England Agricultural Statistics USDA, National Agricultural Statistics Service
Peaches and Pears for Fresh Market Yield and Price – New England: 2011-2015 1
State and Year
Peaches (48-lb bu) Pears (50-lb bu)
Reports 2 Yield per
Acre 3 Reports
Fresh Market
Price per
Bushel 4
Reports 2 Yield per
Acre 3 Reports
Fresh Market
Price per
Bushel 4
number bushels number dollars number bushels number dollars
Connecticut 2011 (NA) 125.0 (NA) 50.40 (NA) (NA) (NA) (NA)
2012 (NA) 140.6 (NA) 55.20 21 78 12 45.00
2013 (NA) 140.6 (NA) 66.48 17 153 10 42.00
2014 184.6 60.00 148 52.00
2015 142.1 49.92 163 40.00
Maine 2011 12 100 10 120.00 9 80 7 52.00
2012 17 80 (D) (D) (D) (D) (D) (D)
2013 13 105 8 115.00 (D) (D) (D) (D)
2014 (D) (D) (D) (D)
2015 (D) (D) 55 65.00
Massachusetts * 2011 (NA) 169.6 (NA) 75.36 25 95 17 53.00
2012 (NA) 165.6 (NA) 76.80 30 85 18 54.00
2013 (NA) 171.6 (NA) 66.48 20 163 15 52.00
2014 152.9 53.76 96 69.00
2015 176.7 55.92 173 39.00
New Hampshire 2011 19 185 15 72.00 (D) (D) (D) (D)
2012 22 250 20 86.40 (D) (D) (D) (D)
2013 14 255 11 55.00 (D) (D) (D) (D)
2014 140 66.65 (D) (D)
2015 238 49.30 (D) (D)
Rhode Island 2011 11 140 10 62.40 (D) (D) (D) (D)
2012 (D) (D) (D) (D) (D) (D) (D) (D)
2013 (D) (D) (D) (D) (D) (D) (D) (D)
2014 117 (D) (D) (D)
2015 130 (D) (D) (D)
Vermont 2011 7 110 6 96.00 (D) (D) (D) (D)
2012 (D) (D) (D) (D) (D) (D) (D) (D)
2013 (D) (D) (D) (D) (D) (D) (D) (D)
2014 (D) (D) (D) (D)
2015 (D) (D) 118 (D)
New England 5 2011 (NA) 168 (NA) 76.00 (NA) 96 (NA) 53.00
2012 (NA) 152 (NA) 70.00 78 84 48 53.00
2013 (NA) 160 (NA) 66.00 51 157 44 49.00
2014 160 59.70 127 56.60
2015 193 46.00 161 41.00 (D) Withheld to avoid disclosing data for individual operations.
(NA) Not Available.
* Price includes a small amount of processed peaches to avoid disclosing data for individual operations.1 Peach and pear data are based on production from orchards with 10 or more peach or pear trees. 2 Discontinued beginning in 2014. 3 Yield based on total production, which includes unharvested production and fruit harvested but not sold due to market conditions. Yields from pear trees grown on wire excluded. 4 Average fresh market price received by farmers at point of first sale. Insufficient sales to establish a processed price. 5 New England includes CT, ME, MA, NH, RI, and VT.
Grapes for Fresh Market Acreage, Yield, Production, Price and Value – New England: 2015
State Bearing Acreage Yield per Acre 1 Utilized Production 2 Utilized Price
per Ton 3
Value of Utilized
Production
acres tons tons dollars dollars
Connecticut 400 2.0 785 1,825 1,433,000
Maine (D) (D) (D) (D) (D)
Massachusetts (D) (D) (D) (D) (D)
New Hampshire 50 1.7 85 2,824 240,000
Rhode Island 125 3.7 460 1,550 713,000
Vermont 160 2.2 350 2,200 770,000
New England 4 940 2.1 1,980 1,831 3,626,000 (D) Data withheld to avoid disclosing information for individual farms or insufficient number of reports to set estimate.
1 Yield based on total production, which includes unharvested production and fruit harvested but not sold due to market conditions. 2 Utilized production includes fruit sold and amount used on the operation or given away. 3 Bushels are calculated using a 42-lb. bushel equivalent. 4 New England includes CT, ME, MA, NH, RI, and VT.

New England Agricultural Statistics 45 USDA, National Agricultural Statistics Service
Apple Acreage, Yield, Production, Price, and Value — New England: 2011-2015 1
State
and
Year
Bearing
acreage
Yield
per
acre2
Production Price
per
pound
Value of
utilized
production
42-Pound Bushel Equivalents
Total3 Utilized4
Yield
per
acre2
Production Price
per
bushel Total3 Utilized4
acres pounds million pounds
million pounds
dollars 1,000 dollars bushels 1,000 bushels 1,000 bushels dollars
Connecticut 2011 ........................
2012 ........................
2013 ........................
2014 ........................
2015 ........................
Maine 2011 ........................
2012 ........................
2013 ........................
2014 ........................
2015 ........................
Massachusetts 2011 ........................
2012 ........................
2013 ........................
2014 ........................
2015 ........................
New Hampshire 2011 ........................
2012 ........................
2013 ........................
2014 ........................
2015 ........................
Rhode Island 2011 ........................
2012 ........................
2013 ........................
2014 ........................
2015 ........................
Vermont 2011 ........................
2012 ........................
2013 ........................
2014 ........................
2015 ........................
New England 2011 ........................
2012 ........................
2013 ........................
2014 ........................
2015 ........................
2,000
1,900
2,000
1,800
1,800
3,000
2,900
2,900
2,700
2,700
3,200
3,000
3,000
3,100
3,000
1,500
1,400
1,400
1,300
1,300
300
300
220
230
230
1,900
1,700
1,600
1,700
1,700
11,900
11,200
11,120
10,830
10,730
11,000
8,680
13,500
11,100
13,900
9,670
10,300
9,310
14,100
13,200
12,000
9,330
14,500
14,000
14,400
12,000
11,100
18,200
13,000
15,500
8,330
5,670
11,400
7,830
10,400
17,600
15,000
21,300
17,300
21,300
12,059
10,464
14,344
13,786
15,154
22.0
16.5
27.0
19.9
25.1
29.0
30.0
27.0
38.0
35.6
38.5
28.0
43.5
43.3
43.1
18.0
15.5
25.5
16.9
20.2
2.5
1.7
2.5
1.8
2.4
33.5
25.5
34.0
29.4
36.2
143.5
117.2
159.5
149.3
162.6
19.5
15.5
26.5
19.6
24.3
22.5
27.5
25.5
36.8
35.1
36.0
27.5
40.5
40.3
42.4
17.0
13.5
24.5
16.5
20.0
2.2
1.6
2.3
1.7
2.2
26.5
24.0
31.0
28.2
35.9
123.7
109.6
150.3
143.1
159.9
0.539
0.654
0.741
0.632
0.585
0.474
0.560
0.516
0.421
0.504
0.603
0.623
0.520
0.492
0.530
0.505
0.581
0.429
0.616
0.638
0.793
0.851
0.863
0.740
0.831
0.304
0.434
0.451
0.407
0.432
0.495
0.568
0.534
0.493
0.528
10,507
10,130
19,630
12,378
14,212
10,676
15,388
13,155
15,476
17,683
21,690
17,123
21,044
19,832
22,484
8,588
7,845
10,506
10,157
12,758
1,745
1,362
1,984
1,258
1,828
8,044
10,405
13,970
11,470
15,517
61,250
62,253
80,289
70,571
84,482
262
207
321
264
331
230
245
222
336
314
286
222
345
333
343
286
264
433
310
369
198
135
271
186
248
419
357
507
412
507
287
249
342
328
361
524
393
643
474
598
690
714
643
905
848
917
667
1,036
1,031
1,026
429
369
607
402
481
60
40
60
43
57
798
607
810
700
862
3,417
2,790
3,798
3,555
3,871
464
369
631
467
579
536
655
607
876
836
857
655
964
960
1,010
405
321
583
393
476
52
38
55
40
52
631
571
738
671
855
2,945
2,610
3,579
3,407
3,807
22.64
27.47
31.12
26.54
24.57
19.91
23.52
21.67
17.68
21.17
25.33
26.17
21.84
20.66
22.26
21.21
24.40
18.02
25.87
26.80
33.31
35.74
36.25
31.08
34.90
12.77
18.23
18.94
17.09
18.14
20.80
23.86
22.44
20.71
22.19
1 Apple production from commercial orchards with 100 or more bearing age trees. 2 Yield is based on total production, which includes unharvested production and fruit harvested but not sold due to market conditions. 3 Total production is the quantity actually harvested plus quantities of mature fruit not harvested because of economic or natural reasons. 4 Utilized production is the amount sold plus quantities used at home, given away, or held in storage.
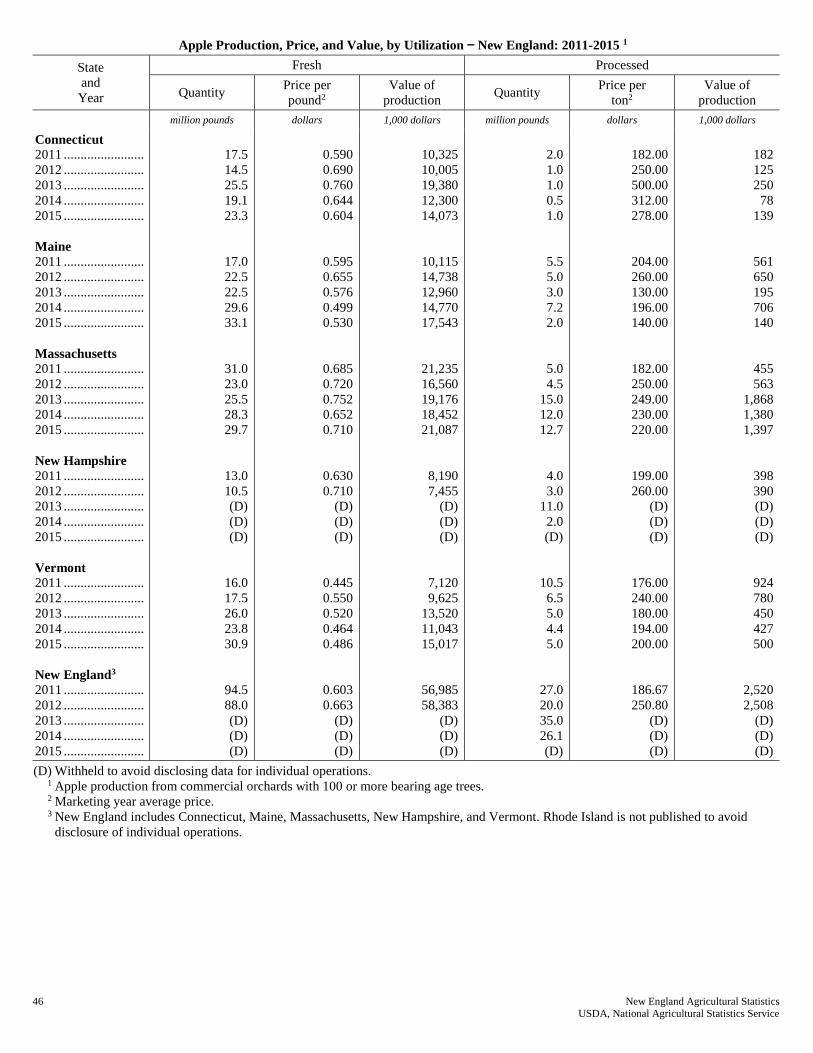
46 New England Agricultural Statistics USDA, National Agricultural Statistics Service
Apple Production, Price, and Value, by Utilization — New England: 2011-2015 1
State
and
Year
Fresh Processed
Quantity Price per
pound2
Value of
production Quantity
Price per
ton2
Value of
production
million pounds dollars 1,000 dollars million pounds dollars 1,000 dollars
Connecticut 2011 ........................
2012 ........................
2013 ........................
2014 ........................
2015 ........................
Maine 2011 ........................
2012 ........................
2013 ........................
2014 ........................
2015 ........................
Massachusetts 2011 ........................
2012 ........................
2013 ........................
2014 ........................
2015 ........................
New Hampshire 2011 ........................
2012 ........................
2013 ........................
2014 ........................
2015 ........................
Vermont 2011 ........................
2012 ........................
2013 ........................
2014 ........................
2015 ........................
New England3 2011 ........................
2012 ........................
2013 ........................
2014 ........................
2015 ........................
17.5
14.5
25.5
19.1
23.3
17.0
22.5
22.5
29.6
33.1
31.0
23.0
25.5
28.3
29.7
13.0
10.5
(D)
(D)
(D)
16.0
17.5
26.0
23.8
30.9
94.5
88.0
(D)
(D)
(D)
0.590
0.690
0.760
0.644
0.604
0.595
0.655
0.576
0.499
0.530
0.685
0.720
0.752
0.652
0.710
0.630
0.710
(D)
(D)
(D)
0.445
0.550
0.520
0.464
0.486
0.603
0.663
(D)
(D)
(D)
10,325
10,005
19,380
12,300
14,073
10,115
14,738
12,960
14,770
17,543
21,235
16,560
19,176
18,452
21,087
8,190
7,455
(D)
(D)
(D)
7,120
9,625
13,520
11,043
15,017
56,985
58,383
(D)
(D)
(D)
2.0
1.0
1.0
0.5
1.0
5.5
5.0
3.0
7.2
2.0
5.0
4.5
15.0
12.0
12.7
4.0
3.0
11.0
2.0
(D)
10.5
6.5
5.0
4.4
5.0
27.0
20.0
35.0
26.1
(D)
182.00
250.00
500.00
312.00
278.00
204.00
260.00
130.00
196.00
140.00
182.00
250.00
249.00
230.00
220.00
199.00
260.00
(D)
(D)
(D)
176.00
240.00
180.00
194.00
200.00
186.67
250.80
(D)
(D)
(D)
182
125
250
78
139
561
650
195
706
140
455
563
1,868
1,380
1,397
398
390
(D)
(D)
(D)
924
780
450
427
500
2,520
2,508
(D)
(D)
(D)
(D) Withheld to avoid disclosing data for individual operations. 1 Apple production from commercial orchards with 100 or more bearing age trees. 2 Marketing year average price. 3 New England includes Connecticut, Maine, Massachusetts, New Hampshire, and Vermont. Rhode Island is not published to avoid
disclosure of individual operations.

New England Agricultural Statistics 47 USDA, National Agricultural Statistics Service
Peach Acreage, Yield, Production, Price, and Value — New England: 2011-2015
State
and
Year
Bearing
acreage
Yield
per
acre1
Production Price
per
ton2
Value of
utilized
production
48-Pound Bushel Equivalents
Total Utilized
Yield
per
acre1
Production Price
per
bushel Total Utilized
acres tons tons tons dollars 1,000 dollars bushels 1,000 bushels 1,000 bushels dollars
Connecticut 2011 ........................
2012 ........................
2013 ........................
2014 ........................
2015 ........................
Massachusetts 2011 ........................
2012 ........................
2013 ........................
2014 ........................
2015 ........................
New England3 2011 ........................
2012 ........................
2013 ........................
2014 ........................
2015 ........................
400
400
400
400
400
430
390
340
340
350
830
790
740
740
750
3.00
3.38
3.38
4.43
3.41
4.07
3.97
4.12
3.67
4.24
3.55
3.67
3.72
4.08
3.80
1,200
1,350
1,350
1,770
1,365
1,750
1,550
1,400
1,249
1,485
2,950
2,900
2,750
3,019
2,850
1,100
1,300
1,330
1,750
1,360
1,750
1,500
1,300
1,187
1,455
2,850
2,800
2,630
2,937
2,815
2,100
2,300
2,770
2,500
2,080
3,140
3,200
2,770
2,240
2,330
2,739
2,782
2,770
2,396
2,210
2,310
2,990
3,684
4,375
2,829
5,495
4,800
3,601
2,662
3,391
7,805
7,790
7,285
7,037
6,220
125.0
140.8
140.8
184.6
142.1
169.6
165.4
171.7
152.9
176.7
148.1
153.0
154.8
170.0
158.3
50
56
56
74
57
73
65
58
52
62
123
121
115
126
119
46
54
55
73
57
73
63
54
49
61
119
117
110
122
117
50.40
55.20
66.48
60.00
49.92
75.36
76.80
66.48
53.82
55.93
65.73
66.77
66.48
57.50
53.03
1 Yield is based on total production, which includes unharvested production and fruit harvested but not sold due to market conditions. 2 Marketing year average price. 3 New England includes Connecticut and Massachusetts.
Cranberry Acreage, Yield, Production, Utilization, Price, and Value — Massachusetts: 2011-2015
Year Area
Harvested
Yield
per
Acre1
Production Utilization Price per Barrel2 3 Value of
Utilized
Production Total Utilized Fresh Processed Fresh Processed All
acres barrels 1,000 barrels 1,000 barrels 1,000 barrels 1,000 barrels dollars dollars dollars 1,000 dollars
2011 .......
2012 .......
2013 .......
2014 .......
2015 .......
13,000
13,000
13,200
12,400
13,200
178.2
163.3
138.5
164.3
177.3
2,317
2,123
1,852
2,070
2,352
2,317
2,123
1,829
2,037
2,340
110.0
83.0
88.8
48.0
186.0
2,207
2,040
1,740
1,989
2,154
64.80
69.90
50.60
56.80
59.60
43.70
46.10
30.60
36.60
30.50
44.70
47.00
31.60
37.10
32.80
103,574
99,846
57,737
75,523
76,783
1 Yield is based on utilized production. 2 Weighted average of co-op and independent sales. Co-op prices represent pool proceeds less returns for processing non-cranberry
products, capital stock dividends, capital stock retains and other retains. 3 One barrel weighs 100 pounds.
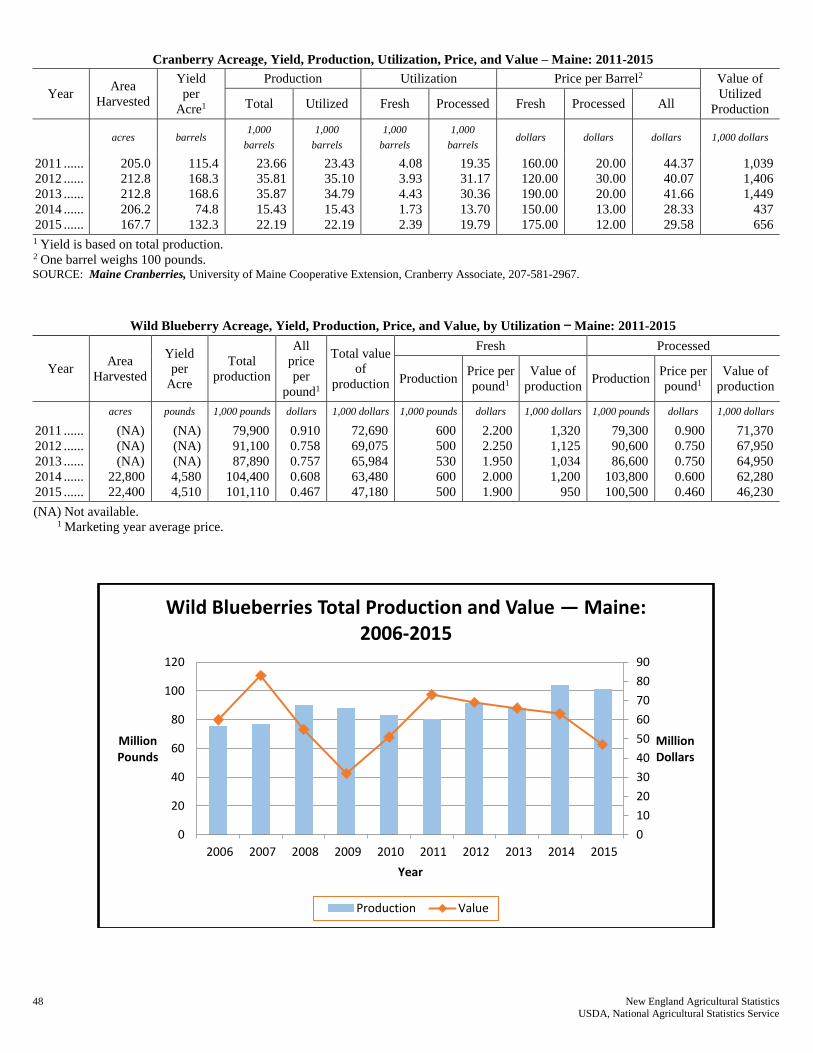
48 New England Agricultural Statistics USDA, National Agricultural Statistics Service
Cranberry Acreage, Yield, Production, Utilization, Price, and Value – Maine: 2011-2015
Year Area
Harvested
Yield
per
Acre1
Production Utilization Price per Barrel2 Value of
Utilized
Production Total Utilized Fresh Processed Fresh Processed All
acres barrels 1,000
barrels
1,000
barrels
1,000
barrels
1,000
barrels dollars dollars dollars 1,000 dollars
2011 ......
2012 ......
2013 ......
2014 ......
2015 ......
205.0
212.8
212.8
206.2
167.7
115.4
168.3
168.6
74.8
132.3
23.66
35.81
35.87
15.43
22.19
23.43
35.10
34.79
15.43
22.19
4.08
3.93
4.43
1.73
2.39
19.35
31.17
30.36
13.70
19.79
160.00
120.00
190.00
150.00
175.00
20.00
30.00
20.00
13.00
12.00
44.37
40.07
41.66
28.33
29.58
1,039
1,406
1,449
437
656
1 Yield is based on total production. 2 One barrel weighs 100 pounds. SOURCE: Maine Cranberries, University of Maine Cooperative Extension, Cranberry Associate, 207-581-2967.
Wild Blueberry Acreage, Yield, Production, Price, and Value, by Utilization — Maine: 2011-2015
Year Area
Harvested
Yield
per
Acre
Total
production
All
price
per
pound1
Total value
of
production
Fresh Processed
Production Price per
pound1
Value of
production Production
Price per
pound1
Value of
production
acres pounds 1,000 pounds dollars 1,000 dollars 1,000 pounds dollars 1,000 dollars 1,000 pounds dollars 1,000 dollars
2011 ......
2012 ......
2013 ......
2014 ......
2015 ......
(NA)
(NA)
(NA)
22,800
22,400
(NA)
(NA)
(NA)
4,580
4,510
79,900
91,100
87,890
104,400
101,110
0.910
0.758
0.757
0.608
0.467
72,690
69,075
65,984
63,480
47,180
600
500
530
600
500
2.200
2.250
1.950
2.000
1.900
1,320
1,125
1,034
1,200
950
79,300
90,600
86,600
103,800
100,500
0.900
0.750
0.750
0.600
0.460
71,370
67,950
64,950
62,280
46,230
(NA) Not available. 1 Marketing year average price.
0
10
20
30
40
50
60
70
80
90
0
20
40
60
80
100
120
2006 2007 2008 2009 2010 2011 2012 2013 2014 2015
Million Dollars
MillionPounds
Year
Wild Blueberries Total Production and Value — Maine:2006-2015
Production Value

New England Agricultural Statistics 49 USDA, National Agricultural Statistics Service
Cattle and Calves Number on Farms, January 1, Inventory Value and Value per Head — New England: 2012-2016
State
and
Year
Cows and Heifers
that have calved
Heifers
500 lbs. and over Bulls Steers Calves All Cattle and Calves
Kept
for
milk
Kept
for
beef
For milk
replace-
ment
For beef
replace-
ment
Other
heifers
500 lbs.
and
over
500 lbs.
and
over
500 lbs.
and
less
Number Value
per head
Total
value
1,000 head 1,000 head 1,000 head 1,000 head 1,000 head
1,000 head 1,000 head 1,000 head 1,000 head
dollars 1,000 dollars
Connecticut 2012 ........................
2013 ........................
2014 ........................
2015 ........................
2016 ........................
Maine 2012 ........................
2013 ........................
2014 ........................
2015 ........................
2016 ........................
Massachusetts 2012 ........................
2013 ........................
2014 ........................
2015 ........................
2016 ........................
New Hampshire 2012 ........................
2013 ........................
2014 ........................
2015 ........................
2016 ........................
Rhode Island 2012 ........................
2013 ........................
2014 ........................
2015 ........................
2016 ........................
Vermont 2012 ........................
2013 ........................
2014 ........................
2015 ........................
2016 ........................
New England1 2012 ........................
2013 ........................
2014 ........................
2015 ........................
2016 ........................
18.5
18.0
19.0
19.0
19.0
32.0
32.0
30.0
30.0
30.0
12.0
12.5
12.0
12.5
12.0
14.0
13.5
13.5
14.0
14.0
1.1
1.1
0.9
0.9
0.9
133.0
134.0
132.0
132.0
131.0
210.6
211.1
207.4
208.4
206.9
6.5
8.0
4.0
5.0
6.0
12.0
11.0
11.0
11.0
10.0
7.0
6.5
6.0
5.5
6.0
4.0
3.5
3.0
3.0
4.5
1.5
1.5
1.5
1.5
1.5
10.0
12.0
12.0
12.0
13.0
41.0
42.5
37.5
38.0
41.0
9.5
9.0
9.0
8.0
8.5
16.0
15.5
17.0
16.0
15.0
6.0
6.0
7.5
7.0
7.0
6.5
6.5
7.0
5.5
6.0
0.5
0.5
0.5
0.5
0.5
54.0
59.0
56.0
56.0
55.0
92.5
96.5
97.0
93.0
92.0
2.5
2.0
1.5
2.5
2.5
3.0
2.5
3.0
4.5
3.0
3.0
2.0
2.0
2.0
2.0
1.5
1.2
1.0
1.0
1.0
0.3
0.3
0.5
0.5
0.5
4.0
4.5
4.5
4.0
5.0
14.3
12.5
12.5
14.5
14.0
0.5
0.5
0.5
0.5
1.0
3.0
2.0
2.0
2.5
3.0
1.0
1.0
0.5
1.0
1.0
0.5
0.8
0.5
0.5
1.0
0.1
0.1
0.2
0.2
0.2
5.0
6.5
5.5
5.0
5.0
10.1
10.9
9.2
9.7
11.2
0.6
0.5
0.5
0.5
0.5
1.5
1.5
1.5
1.5
1.5
1.0
1.0
1.0
1.0
1.0
0.5
0.5
0.5
0.5
0.5
0.1
0.1
0.1
0.1
0.1
3.0
3.0
3.0
3.0
3.0
6.7
6.6
6.6
6.6
6.6
2.4
2.0
2.0
2.0
2.0
5.5
6.0
5.0
4.5
3.5
2.0
2.0
2.0
2.0
2.0
1.5
1.0
1.0
1.0
1.5
0.3
0.3
0.5
0.5
0.5
4.0
4.0
4.0
4.0
4.0
15.7
15.3
14.5
14.0
13.5
8.5
8.0
10.5
9.5
9.5
15.0
15.5
15.5
15.0
15.0
9.0
8.0
8.0
7.0
7.0
6.5
6.0
5.5
4.5
6.5
0.8
0.8
0.8
0.8
0.8
47.0
47.0
43.0
44.0
44.0
86.8
85.3
83.3
80.8
82.8
49.0
48.0
47.0
47.0
49.0
88.0
86.0
85.0
85.0
81.0
41.0
39.0
39.0
38.0
38.0
35.0
33.0
32.0
30.0
35.0
4.7
4.7
5.0
5.0
5.0
260.0
270.0
260.0
260.0
260.0
477.7
480.7
468.0
465.0
468.0
1,030
1,110
1,110
1,430
1,400
1,050
1,080
1,110
1,300
1,340
960
1,020
1,050
1,300
1,300
1,060
1,140
1,150
1,390
1,380
1,000
1,020
1,040
1,380
1,360
1,170
1,210
1,210
1,510
1,440
1,106
1,155
1,163
1,437
1,402
50,470
53,280
52,170
67,210
68,600
92,400
92,880
94,350
110,500
108,540
39,360
39,780
40,950
49,400
49,400
37,100
37,620
36,800
41,700
48,300
4,700
4,794
5,200
6,900
6,800
304,200
326,700
314,600
392,600
374,400
528,230
555,054
544,070
668,310
656,040
1 New England value per head derived: total value of inventory divided by all cattle and calves.
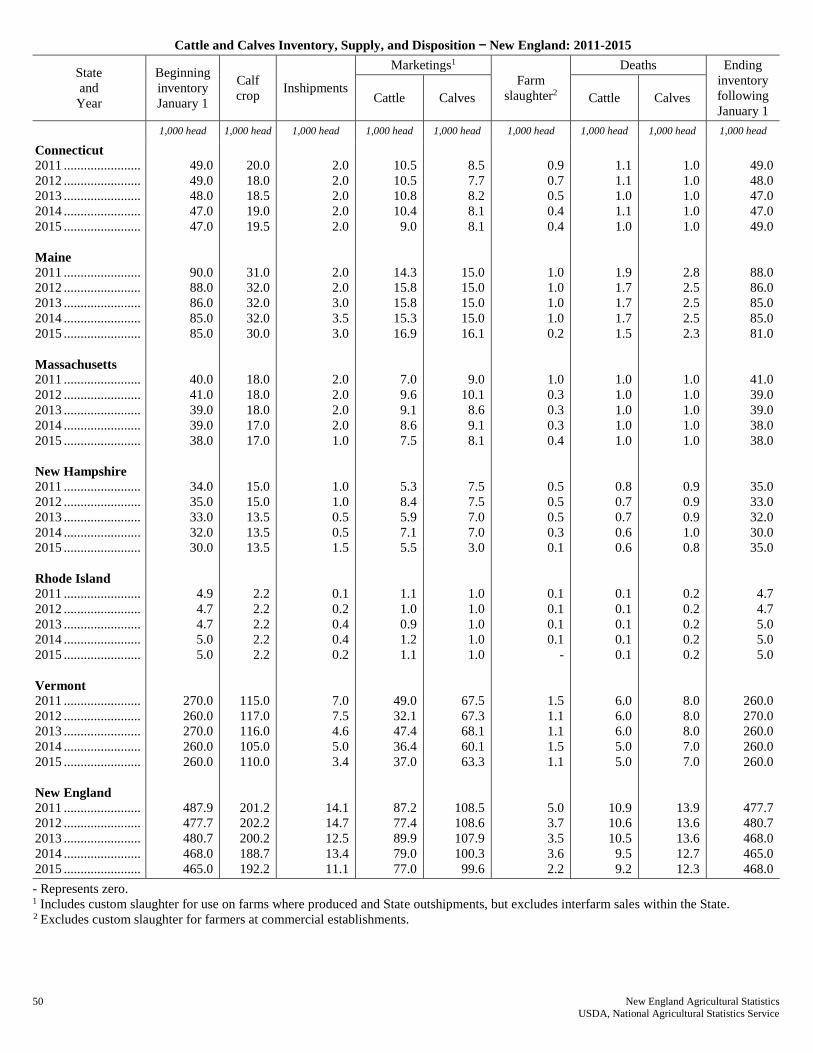
50 New England Agricultural Statistics USDA, National Agricultural Statistics Service
Cattle and Calves Inventory, Supply, and Disposition — New England: 2011-2015
State
and
Year
Beginning
inventory
January 1
Calf
crop Inshipments
Marketings1
Farm
slaughter2
Deaths Ending
inventory
following
January 1 Cattle Calves Cattle Calves
1,000 head 1,000 head 1,000 head 1,000 head 1,000 head 1,000 head 1,000 head 1,000 head 1,000 head
Connecticut 2011 .......................
2012 .......................
2013 .......................
2014 .......................
2015 .......................
Maine 2011 .......................
2012 .......................
2013 .......................
2014 .......................
2015 .......................
Massachusetts 2011 .......................
2012 .......................
2013 .......................
2014 .......................
2015 .......................
New Hampshire 2011 .......................
2012 .......................
2013 .......................
2014 .......................
2015 .......................
Rhode Island 2011 .......................
2012 .......................
2013 .......................
2014 .......................
2015 .......................
Vermont 2011 .......................
2012 .......................
2013 .......................
2014 .......................
2015 .......................
New England 2011 .......................
2012 .......................
2013 .......................
2014 .......................
2015 .......................
49.0
49.0
48.0
47.0
47.0
90.0
88.0
86.0
85.0
85.0
40.0
41.0
39.0
39.0
38.0
34.0
35.0
33.0
32.0
30.0
4.9
4.7
4.7
5.0
5.0
270.0
260.0
270.0
260.0
260.0
487.9
477.7
480.7
468.0
465.0
20.0
18.0
18.5
19.0
19.5
31.0
32.0
32.0
32.0
30.0
18.0
18.0
18.0
17.0
17.0
15.0
15.0
13.5
13.5
13.5
2.2
2.2
2.2
2.2
2.2
115.0
117.0
116.0
105.0
110.0
201.2
202.2
200.2
188.7
192.2
2.0
2.0
2.0
2.0
2.0
2.0
2.0
3.0
3.5
3.0
2.0
2.0
2.0
2.0
1.0
1.0
1.0
0.5
0.5
1.5
0.1
0.2
0.4
0.4
0.2
7.0
7.5
4.6
5.0
3.4
14.1
14.7
12.5
13.4
11.1
10.5
10.5
10.8
10.4
9.0
14.3
15.8
15.8
15.3
16.9
7.0
9.6
9.1
8.6
7.5
5.3
8.4
5.9
7.1
5.5
1.1
1.0
0.9
1.2
1.1
49.0
32.1
47.4
36.4
37.0
87.2
77.4
89.9
79.0
77.0
8.5
7.7
8.2
8.1
8.1
15.0
15.0
15.0
15.0
16.1
9.0
10.1
8.6
9.1
8.1
7.5
7.5
7.0
7.0
3.0
1.0
1.0
1.0
1.0
1.0
67.5
67.3
68.1
60.1
63.3
108.5
108.6
107.9
100.3
99.6
0.9
0.7
0.5
0.4
0.4
1.0
1.0
1.0
1.0
0.2
1.0
0.3
0.3
0.3
0.4
0.5
0.5
0.5
0.3
0.1
0.1
0.1
0.1
0.1
-
1.5
1.1
1.1
1.5
1.1
5.0
3.7
3.5
3.6
2.2
1.1
1.1
1.0
1.1
1.0
1.9
1.7
1.7
1.7
1.5
1.0
1.0
1.0
1.0
1.0
0.8
0.7
0.7
0.6
0.6
0.1
0.1
0.1
0.1
0.1
6.0
6.0
6.0
5.0
5.0
10.9
10.6
10.5
9.5
9.2
1.0
1.0
1.0
1.0
1.0
2.8
2.5
2.5
2.5
2.3
1.0
1.0
1.0
1.0
1.0
0.9
0.9
0.9
1.0
0.8
0.2
0.2
0.2
0.2
0.2
8.0
8.0
8.0
7.0
7.0
13.9
13.6
13.6
12.7
12.3
49.0
48.0
47.0
47.0
49.0
88.0
86.0
85.0
85.0
81.0
41.0
39.0
39.0
38.0
38.0
35.0
33.0
32.0
30.0
35.0
4.7
4.7
5.0
5.0
5.0
260.0
270.0
260.0
260.0
260.0
477.7
480.7
468.0
465.0
468.0
- Represents zero.1 Includes custom slaughter for use on farms where produced and State outshipments, but excludes interfarm sales within the State. 2 Excludes custom slaughter for farmers at commercial establishments.

New England Agricultural Statistics 51 USDA, National Agricultural Statistics Service
All Cattle and Calves Production and Income — New England: 2011-2015
State
and
Year
Production1 Marketings2 Value of
Production Cash Receipts3
Value of Home
Consumption Gross Income
1,000 pounds 1,000 pounds 1,000 dollars 1,000 dollars 1,000 dollars 1,000 dollars
Connecticut 2011 ............................
2012 ............................
2013 ............................
2014 ............................
2015 ............................
Maine 2011 ............................
2012 ............................
2013 ............................
2014 ............................
2015 ............................
Massachusetts 2011 ............................
2012 ............................
2013 ............................
2014 ............................
2015 ............................
New Hampshire 2011 ............................
2012 ............................
2013 ............................
2014 ............................
2015 ............................
Rhode Island 2011 ............................
2012 ............................
2013 ............................
2014 ............................
2015 ............................
Vermont 2011 ............................
2012 ............................
2013 ............................
2014 ............................
2015 ............................
New England 2011 ............................
2012 ............................
2013 ............................
2014 ............................
2015 ............................
13,867
11,953
10,386
13,434
15,341
14,073
17,553
15,852
17,018
15,251
7,368
8,727
9,137
7,862
9,720
8,222
8,962
8,110
8,379
9,301
993
1,210
1,223
1,262
1,241
52,096
55,108
54,579
56,002
55,010
96,619
103,513
99,287
103,957
105,864
12,383
13,200
14,268
13,640
12,410
15,410
16,780
17,650
17,300
20,960
6,840
10,230
9,860
9,160
8,810
6,370
10,200
7,750
9,180
5,989
1,200
1,048
942
1,280
1,184
66,090
51,720
63,700
49,925
52,570
108,293
103,178
114,170
100,485
101,923
14,205
14,451
13,008
21,129
24,175
15,121
21,564
19,579
26,778
24,806
7,792
10,692
11,174
12,449
15,186
8,974
11,065
10,063
13,799
14,727
1,029
1,452
1,512
1,929
1,850
57,745
72,300
68,087
90,964
92,141
104,866
131,524
123,423
167,048
172,885
13,018
15,828
17,135
21,749
20,036
16,297
20,022
21,192
27,544
33,205
7,075
12,286
11,818
14,629
13,870
7,026
12,461
9,668
15,240
9,292
1,220
1,242
1,130
1,958
1,784
71,052
67,258
78,167
81,848
88,725
115,688
129,097
139,110
162,968
166,912
1,923
1,398
942
1,247
1,436
1,765
2,539
2,271
3,629
1,766
2,025
1,707
1,145
1,497
1,462
1,804
1,484
1,625
1,421
1,369
202
380
389
489
330
2,215
2,250
2,644
3,988
4,845
9,934
9,758
9,016
12,271
11,208
14,941
17,226
18,077
22,996
21,472
18,062
22,561
23,463
31,173
34,971
9,100
13,993
12,963
16,126
15,332
8,830
13,945
11,293
16,661
10,661
1,422
1,622
1,519
2,447
2,114
73,267
69,508
80,811
85,836
93,570
125,622
138,855
148,126
175,239
178,120
1 Adjustments made for changes in inventory and inshipments. 2 Excludes custom slaughter for use on farms where produced and inter-farm sales within the State. 3 Receipts from marketings and sale of farm slaughter.

52 New England Agricultural Statistics USDA, National Agricultural Statistics Service
Licensed Dairy Herds — New England: 2011-2015 1
Year Connecticut Maine Massachusetts New Hampshire Rhode Island Vermont New England
number number number number number number number
2011 ................
2012 ................
2013 ................
2014 ................
2015 ................
140
130
130
130
120
310
310
300
280
250
160
155
155
150
150
120
120
120
120
120
15
15
15
15
15
1,000
970
930
880
850
1,745
1,700
1,650
1,575
1,505
1 Average number of dairy farms licensed to sell milk, based on counts collected from State and other regulatory agencies.
All Cattle and Calves Number on Farms, January 1, by County — Vermont: 2012-2016
County 2012 2013 2014 2015 2016
head head head head head
Addison ........................................
Bennington ...................................
Caledonia .....................................
Chittenden ....................................
Essex ............................................
Franklin ........................................
Grand Isle ....................................
Lamoille .......................................
Orange .........................................
Orleans .........................................
Rutland.........................................
Washington ..................................
Windham .....................................
Windsor .......................................
Vermont Total ............................
61,000
3,400
13,200
10,200
5,400
62,000
5,700
6,200
17,800
37,500
15,300
7,000
6,300
9,000
260,000
63,000
3,500
13,800
10,700
5,600
64,000
6,000
6,500
18,600
39,000
16,000
7,300
6,600
9,400
270,000
60,000
3,400
13,300
10,300
5,400
62,000
5,800
6,300
18,000
37,500
15,500
7,000
6,400
9,100
260,000
60,000
3,400
13,300
10,300
5,400
62,000
5,800
6,300
18,000
37,500
15,500
7,000
6,400
9,100
260,000
60,000
3,400
13,300
10,300
5,400
62,000
5,800
6,300
18,000
37,500
15,500
7,000
6,400
9,100
260,000
Milk Cows Number on Farms, January 1, by County — Vermont: 2012-2016
County 2012 2013 2014 2015 2016
head head head head head
Addison ........................................
Bennington ...................................
Caledonia .....................................
Chittenden ....................................
Essex ............................................
Franklin ........................................
Grand Isle ....................................
Lamoille .......................................
Orange .........................................
Orleans .........................................
Rutland.........................................
Washington ..................................
Windham .....................................
Windsor .......................................
Vermont Total ............................
30,500
1,700
6,500
4,600
3,200
36,000
2,900
3,400
8,600
19,700
6,500
3,100
3,300
3,000
133,000
31,000
1,700
6,500
4,600
3,200
36,000
2,900
3,500
8,700
19,900
6,500
3,100
3,400
3,000
134,000
30,500
1,700
6,500
4,600
3,100
35,500
2,800
3,400
8,600
19,600
6,500
3,000
3,300
2,900
132,000
30,500
1,700
6,500
4,600
3,100
35,500
2,800
3,400
8,600
19,600
6,500
3,000
3,300
2,900
132,000
30,000
1,600
6,400
4,600
3,100
35,500
2,800
3,400
8,500
19,500
6,400
3,000
3,300
2,900
131,000

New England Agricultural Statistics 53 USDA, National Agricultural Statistics Service
Annual Milk Production and Value — New England: 2011-2015
State
and
Year
Average
Number of
Milk Cows
Production of Milk and Milkfat
Per Milk Cow Percentage of
Fat in All Milk
Produced
Total Value of Milk
Produced1 Milk Milkfat Milk Milkfat
1,000 head pounds pounds percent million pounds million pounds 1,000 dollars
Connecticut 2011 ........................
2012 ........................
2013 ........................
2014 ........................
2015 ........................
Maine 2011 ........................
2012 ........................
2013 ........................
2014 ........................
2015 ........................
Massachusetts 2011 ........................
2012 ........................
2013 ........................
2014 ........................
2015 ........................
New Hampshire 2011 ........................
2012 ........................
2013 ........................
2014 ........................
2015 ........................
Rhode Island 2011 ........................
2012 ........................
2013 ........................
2014 ........................
2015 ........................
Vermont 2011 ........................
2012 ........................
2013 ........................
2014 ........................
2015 ........................
New England 2011 ........................
2012 ........................
2013 ........................
2014 ........................
2015 ........................
19.0
18.0
18.0
19.0
19.0
32.0
33.0
31.0
30.0
30.0
13.0
12.0
13.0
13.0
12.0
14.0
14.0
13.0
14.0
14.0
1.1
1.1
0.9
0.9
0.9
134.0
133.0
134.0
132.0
132.0
213.1
211.1
209.9
208.9
207.9
19,000
19,889
20,556
20,158
20,842
18,688
18,576
19,548
19,967
19,800
16,923
18,250
17,692
17,923
18,083
20,429
19,643
20,923
20,143
20,143
17,909
16,636
19,000
19,000
17,667
18,940
19,316
19,448
20,197
20,197
18,877
19,196
19,538
20,010
20,062
720
770
785
782
823
705
713
733
753
748
660
715
679
686
702
776
762
789
776
767
693
650
760
766
728
718
757
739
767
774
717
749
741
763
770
3.79
3.87
3.82
3.88
3.95
3.77
3.84
3.75
3.77
3.78
3.90
3.92
3.84
3.83
3.88
3.80
3.88
3.77
3.85
3.81
3.87
3.91
4.00
4.03
4.12
3.79
3.92
3.80
3.80
3.83
3.80
3.90
3.79
3.81
3.84
361.0
358.0
370.0
383.0
396.0
598.0
613.0
606.0
599.0
594.0
220.0
219.0
230.0
233.0
217.0
286.0
275.0
272.0
282.0
282.0
19.7
18.3
17.1
17.1
15.9
2,538.0
2,569.0
2,606.0
2,666.0
2,666.0
4,022.7
4,052.3
4,101.1
4,180.1
4,170.9
13.7
13.9
14.1
14.9
15.6
22.5
23.5
22.7
22.6
22.5
8.6
8.6
8.8
8.9
8.4
10.9
10.7
10.3
10.9
10.7
0.8
0.7
0.7
0.7
0.7
96.2
100.7
99.0
101.3
102.1
152.7
158.1
155.6
159.3
160.0
79,059
70,526
79,920
99,963
73,656
134,550
125,052
135,138
160,532
118,800
48,400
43,800
50,140
60,813
40,362
62,062
53,900
58,480
73,038
52,170
4,314
3,623
3,728
4,514
3,005
548,208
503,524
555,078
679,830
495,876
876,593
800,425
882,484
1,078,690
783,869
1 Valued at averaged returns per 100 pounds of milk in combined marketings of milk and cream. Value equals cash receipts from
marketings of milk and cream plus value of milk used for home consumption plus value of milk fed to calves.
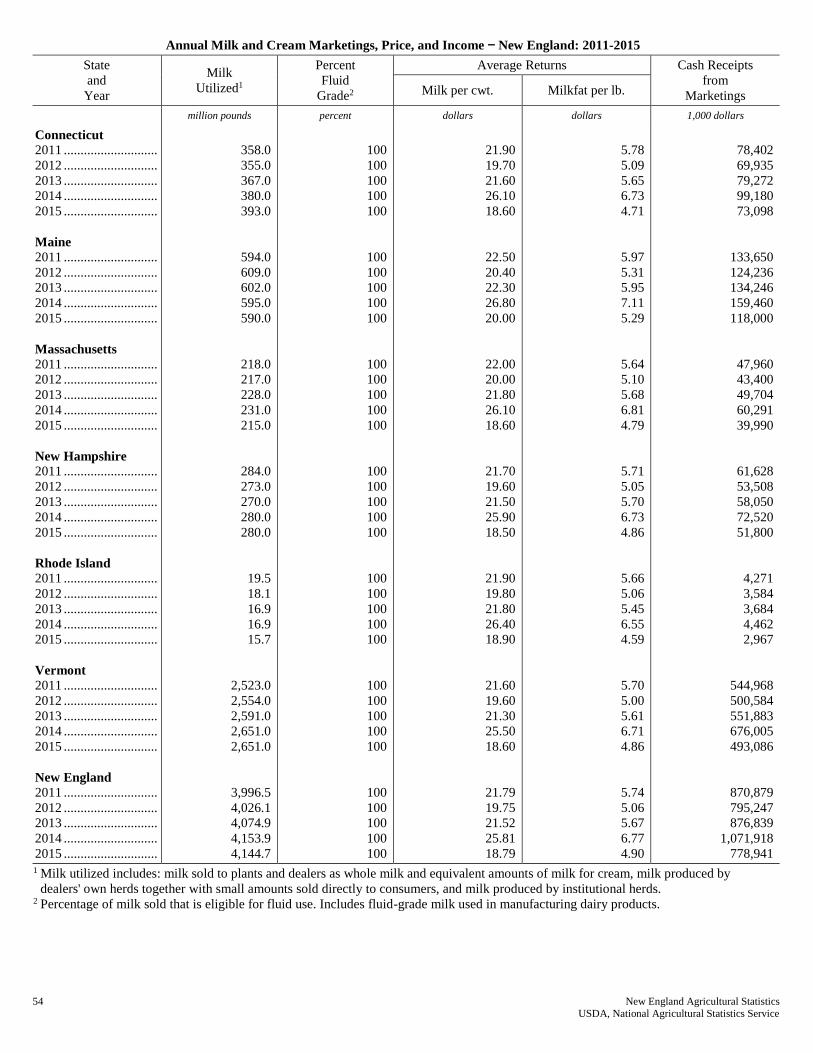
54 New England Agricultural Statistics USDA, National Agricultural Statistics Service
Annual Milk and Cream Marketings, Price, and Income — New England: 2011-2015
State
and
Year
Milk
Utilized1
Percent
Fluid
Grade2
Average Returns Cash Receipts
from
Marketings Milk per cwt. Milkfat per lb.
million pounds percent dollars dollars 1,000 dollars
Connecticut 2011 ............................
2012 ............................
2013 ............................
2014 ............................
2015 ............................
Maine 2011 ............................
2012 ............................
2013 ............................
2014 ............................
2015 ............................
Massachusetts 2011 ............................
2012 ............................
2013 ............................
2014 ............................
2015 ............................
New Hampshire 2011 ............................
2012 ............................
2013 ............................
2014 ............................
2015 ............................
Rhode Island 2011 ............................
2012 ............................
2013 ............................
2014 ............................
2015 ............................
Vermont 2011 ............................
2012 ............................
2013 ............................
2014 ............................
2015 ............................
New England 2011 ............................
2012 ............................
2013 ............................
2014 ............................
2015 ............................
358.0
355.0
367.0
380.0
393.0
594.0
609.0
602.0
595.0
590.0
218.0
217.0
228.0
231.0
215.0
284.0
273.0
270.0
280.0
280.0
19.5
18.1
16.9
16.9
15.7
2,523.0
2,554.0
2,591.0
2,651.0
2,651.0
3,996.5
4,026.1
4,074.9
4,153.9
4,144.7
100
100
100
100
100
100
100
100
100
100
100
100
100
100
100
100
100
100
100
100
100
100
100
100
100
100
100
100
100
100
100
100
100
100
100
21.90
19.70
21.60
26.10
18.60
22.50
20.40
22.30
26.80
20.00
22.00
20.00
21.80
26.10
18.60
21.70
19.60
21.50
25.90
18.50
21.90
19.80
21.80
26.40
18.90
21.60
19.60
21.30
25.50
18.60
21.79
19.75
21.52
25.81
18.79
5.78
5.09
5.65
6.73
4.71
5.97
5.31
5.95
7.11
5.29
5.64
5.10
5.68
6.81
4.79
5.71
5.05
5.70
6.73
4.86
5.66
5.06
5.45
6.55
4.59
5.70
5.00
5.61
6.71
4.86
5.74
5.06
5.67
6.77
4.90
78,402
69,935
79,272
99,180
73,098
133,650
124,236
134,246
159,460
118,000
47,960
43,400
49,704
60,291
39,990
61,628
53,508
58,050
72,520
51,800
4,271
3,584
3,684
4,462
2,967
544,968
500,584
551,883
676,005
493,086
870,879
795,247
876,839
1,071,918
778,941
1 Milk utilized includes: milk sold to plants and dealers as whole milk and equivalent amounts of milk for cream, milk produced by
dealers' own herds together with small amounts sold directly to consumers, and milk produced by institutional herds. 2 Percentage of milk sold that is eligible for fluid use. Includes fluid-grade milk used in manufacturing dairy products.

New England Agricultural Statistics 55 USDA, National Agricultural Statistics Service
Annual Milk Used Where Produced and Gross Producer Income — New England: 2011-2015
State
and
Year
Milk Used Where Produced Gross
Producer
Income3 Total Fed to Calves1
Used for Milk, Cream, and Butter
(Home Consumption)
Milk Utilized Value2
million pounds million pounds million pounds 1,000 dollars 1,000 dollars
Connecticut 2011 ...........................
2012 ...........................
2013 ...........................
2014 ...........................
2015 ...........................
Maine 2011 ...........................
2012 ...........................
2013 ...........................
2014 ...........................
2015 ...........................
Massachusetts 2011 ...........................
2012 ...........................
2013 ...........................
2014 ...........................
2015 ...........................
New Hampshire 2011 ...........................
2012 ...........................
2013 ...........................
2014 ...........................
2015 ...........................
Rhode Island 2011 ...........................
2012 ...........................
2013 ...........................
2014 ...........................
2015 ...........................
Vermont 2011 ...........................
2012 ...........................
2013 ...........................
2014 ...........................
2015 ...........................
New England 2011 ...........................
2012 ...........................
2013 ...........................
2014 ...........................
2015 ...........................
3.0
3.0
3.0
3.0
3.0
4.0
4.0
4.0
4.0
4.0
2.0
2.0
2.0
2.0
2.0
2.0
2.0
2.0
2.0
2.0
0.2
0.2
0.2
0.2
0.2
15.0
15.0
15.0
15.0
15.0
26.2
26.2
26.2
26.2
26.2
2.5
2.5
2.5
2.5
2.5
3.0
3.0
3.0
3.0
3.0
1.5
1.5
1.5
1.5
1.5
1.5
1.5
1.5
1.5
1.5
0.2
0.2
0.2
0.2
0.2
13.0
13.0
13.0
13.0
13.0
21.7
21.7
21.7
21.7
21.7
0.5
0.5
0.5
0.5
0.5
1.0
1.0
1.0
1.0
1.0
0.5
0.5
0.5
0.5
0.5
0.5
0.5
0.5
0.5
0.5
-
-
-
-
-
2.0
2.0
2.0
2.0
2.0
4.5
4.5
4.5
4.5
4.5
110
99
108
131
93
225
204
223
268
200
110
100
109
131
93
109
98
108
130
93
-
-
-
-
-
432
392
426
510
372
986
893
974
1,170
851
78,512
70,034
79,380
99,311
73,191
133,875
124,440
134,469
159,728
118,200
48,070
43,500
49,813
60,422
40,083
61,737
53,606
58,158
72,650
51,893
4,271
3,584
3,684
4,462
2,967
545,400
500,976
552,309
676,515
493,458
871,865
796,140
877,813
1,073,088
779,792
- Represents zero. 1 Excludes milk sucked by calves. 2 Value at average returns per 100 pounds of milk in combined marketings of milk and cream. 3 Cash receipts from marketings of milk and cream plus value of milk used for home consumption.

56 New England Agricultural Statistics USDA, National Agricultural Statistics Service
Milk Cows and Production, by Quarter — New England: 2011-2015
State
and
Year
Milk Cows1 Production per Cow2 Milk Production2
Jan-
Mar
Apr-
Jun
Jul-
Sep
Oct-
Dec
Jan-
Mar
Apr-
Jun
Jul-
Sep
Oct-
Dec
Jan-
Mar
Apr-
Jun
Jul-
Sep
Oct-
Dec
1,000 head
1,000 head
1,000 head
1,000 head
pounds pounds pounds pounds million pounds
million pounds
million pounds
million pounds
Connecticut 2011 .......................
2012 .......................
2013 .......................
2014 .......................
2015 .......................
Maine 2011 .......................
2012 .......................
2013 .......................
2014 .......................
2015 .......................
Massachusetts 2011 .......................
2012 .......................
2013 .......................
2014 .......................
2015 .......................
New Hampshire 2011 .......................
2012 .......................
2013 .......................
2014 .......................
2015 .......................
Rhode Island 2011 .......................
2012 .......................
2013 .......................
2014 .......................
2015 .......................
Vermont 2011 .......................
2012 .......................
2013 .......................
2014 .......................
2015 .......................
New England 2011 .......................
2012 .......................
2013 .......................
2014 .......................
2015 .......................
18.5
18.5
( 3 )
19.0
19.0
32.0
33.0
( 3 )
30.0
30.0
13.5
12.0
( 3 )
12.5
12.0
15.0
14.0
( 3 )
14.0
14.0
1.1
1.1
( 3 )
0.9
0.9
135.0
133.0
( 3 )
132.0
132.0
215.1
211.6
( 3 )
208.4
207.9
18.5
18.5
( 3 )
19.0
19.5
32.0
33.0
( 3 )
30.0
30.0
13.0
12.0
( 3 )
12.5
12.0
14.5
14.0
( 3 )
14.0
14.0
1.1
1.1
( 3 )
0.9
0.9
135.0
133.0
( 3 )
131.0
132.0
214.1
211.6
( 3 )
207.4
208.4
18.5
18.0
18.0
19.0
19.5
32.0
32.0
31.0
30.0
30.0
12.0
12.0
12.5
12.5
12.0
14.0
13.5
13.0
14.0
14.0
1.1
1.1
0.9
0.9
0.9
134.0
133.0
134.0
132.0
132.0
211.6
209.6
209.4
208.4
208.4
18.5
18.0
18.0
19.0
19.0
32.0
32.0
30.0
30.0
30.0
12.0
12.5
12.0
12.5
12.0
14.0
13.5
13.5
14.0
14.0
1.1
1.1
0.9
0.9
0.9
134.0
134.0
132.0
132.0
131.0
211.6
211.1
206.4
208.4
206.9
4,973
5,027
( 3 )
5,053
5,158
4,594
4,636
( 3 )
4,833
4,800
4,222
4,583
( 3 )
4,720
4,500
5,000
5,071
( 3 )
5,071
5,000
4,364
4,455
( 3 )
4,667
4,556
4,711
4,820
( 3 )
4,955
4,977
4,704
4,810
( 3 )
4,939
4,940
5,027
5,027
( 3 )
5,105
5,231
4,750
4,788
( 3 )
5,067
5,000
4,462
4,667
( 3 )
4,880
4,667
5,103
5,143
( 3 )
5,143
5,143
4,727
4,545
( 3 )
5,000
4,444
4,815
4,910
( 3 )
5,168
5,167
4,821
4,901
( 3 )
5,128
5,115
4,757
4,778
4,944
5,000
5,026
4,688
4,750
4,903
5,133
5,033
4,417
4,417
4,480
4,640
4,500
4,929
4,963
5,231
5,000
5,000
4,455
3,909
4,667
4,778
4,444
4,694
4,797
4,821
5,098
5,053
4,697
4,772
4,848
5,059
5,010
4,757
4,778
5,000
5,000
5,158
4,656
4,688
4,867
4,933
4,967
4,333
4,400
4,500
4,400
4,417
4,857
4,815
4,963
4,929
5,000
4,364
3,727
4,444
4,556
4,222
4,649
4,754
4,841
5,015
5,038
4,654
4,723
4,845
4,957
4,997
92.0
93.0
92.0
96.0
98.0
147.0
153.0
151.0
145.0
144.0
57.0
55.0
59.0
59.0
54.0
75.0
71.0
69.0
71.0
70.0
4.8
4.9
4.2
4.2
4.1
636.0
641.0
649.0
654.0
657.0
1,011.8
1,017.9
1,024.2
1,029.2
1,027.1
93.0
93.0
99.0
97.0
102.0
152.0
158.0
157.0
152.0
150.0
58.0
56.0
61.0
61.0
56.0
74.0
72.0
68.0
72.0
72.0
5.2
5.0
4.7
4.5
4.0
650.0
653.0
672.0
677.0
682.0
1,032.2
1,037.0
1,061.7
1,063.5
1,066.0
88.0
86.0
89.0
95.0
98.0
150.0
152.0
152.0
154.0
151.0
53.0
53.0
56.0
58.0
54.0
69.0
67.0
68.0
70.0
70.0
4.9
4.3
4.2
4.3
4.0
629.0
638.0
646.0
673.0
667.0
993.9
1,000.3
1,015.2
1,054.3
1,044.0
88.0
86.0
90.0
95.0
98.0
149.0
150.0
146.0
148.0
149.0
52.0
55.0
54.0
55.0
53.0
68.0
65.0
67.0
69.0
70.0
4.8
4.1
4.0
4.1
3.8
623.0
637.0
639.0
662.0
660.0
984.8
997.1
1,000.0
1,033.1
1,033.8
1 Includes dry cows. Excludes heifers not yet fresh. 2 Excludes milk sucked by calves. 3 Survey was not conducted in April and July, resulting in no milk cow and milk per cow data for March through June 2013. 2013 annual
totals include modeled data.

New England Agricultural Statistics 57 USDA, National Agricultural Statistics Service
Milk Cows and Production, by Month — Vermont: 2011-2015
Year and month Milk
cows1
Milk
per cow2
Milk
production2 Year and month
Milk
cows1
Milk
per cow2
Milk
production2
1,000 head pounds million pounds 1,000 head pounds million pounds
2011 January..........
February........
March............
April .............
May ...............
June ...............
July ...............
August ..........
September .....
October .........
November .....
December ......
Annual Total .......
2012 January..........
February........
March............
April .............
May ...............
June ...............
July ...............
August ..........
September .....
October .........
November .....
December ......
Annual Total .......
2013 January..........
February........
March............
April .............
May ...............
June ...............
July ...............
August ..........
September .....
October .........
November .....
December ......
Annual Total .......
135
135
135
135
135
134
134
134
134
134
134
133
134
133
133
133
133
133
133
133
133
133
133
134
134
133
134
134
( 3 )
( 3 )
( 3 )
( 3 )
135
135
133
132
132
132
134
1,605
1,465
1,635
1,595
1,655
1,580
1,600
1,580
1,515
1,560
1,510
1,595
18,940
1,625
1,535
1,660
1,625
1,675
1,610
1,640
1,610
1,550
1,595
1,545
1,630
19,316
1,650
1,505
( 3 )
( 3 )
( 3 )
( 3 )
1,620
1,630
1,560
1,620
1,570
1,650
19,448
217
198
221
215
223
212
214
212
203
209
202
212
2,538
216
204
221
216
223
214
218
214
206
212
207
218
2,569
221
202
226
220
231
221
219
220
207
214
207
218
2,606
2014 January ........
February ......
March ..........
April ............
May .............
June .............
July .............
August.........
September ...
October .......
November ...
December ....
Annual Total .....
2015
January ........
February ......
March ..........
April ............
May .............
June .............
July .............
August.........
September ...
October .......
November ...
December ....
Annual Total .....
132
132
131
131
131
131
132
132
132
132
132
132
132
132
132
132
131
132
132
132
132
131
131
131
131
132
1,690
1,545
1,730
1,695
1,755
1,720
1,730
1,725
1,645
1,680
1,630
1,705
20,197
1,710
1,545
1,720
1,695
1,775
1,710
1,740
1,700
1,625
1,670
1,640
1,725
20,197
223
204
227
222
230
225
228
228
217
222
215
225
2,666
226
204
227
222
234
226
230
224
213
219
215
226
2,666
1 Includes dry cows. Excludes heifers not yet fresh. 2 Excludes milk sucked by calves. 3 Survey was not conducted in April and July, resulting in no milk cow and milk per cow data for March through June 2013. 2013 annual
totals include modeled data.

58 New England Agricultural Statistics USDA, National Agricultural Statistics Service
Annual Average Milk Price — New England: 2011-2015 1
Year Connecticut Maine Massachusetts New Hampshire Rhode Island Vermont New England
dollars per cwt. dollars per cwt. dollars per cwt. dollars per cwt. dollars per cwt. dollars per cwt. dollars per cwt.
2011 ..........
2012 ..........
2013 ..........
2014 ..........
2015 ..........
21.90
19.70
21.60
26.10
18.60
22.50
20.40
22.30
26.80
20.00
22.00
20.00
21.80
26.10
18.60
21.70
19.60
21.50
25.90
18.50
21.90
19.80
21.80
26.40
18.90
21.60
19.60
21.30
25.50
18.60
21.79
19.75
21.52
25.81
18.79
1 Cash receipts divided by milk utilized.
Milk, Wholesale Prices Received by Farmers, by Month and Marketing Year Average — Vermont: 2011-2015
Year Jan. Feb. Mar. Apr. May June July Aug. Sept. Oct. Nov. Dec. Marketing
Yr. Avg.1
dollars per
cwt.
dollars per
cwt.
dollars per
cwt.
dollars per
cwt.
dollars per
cwt.
dollars per
cwt.
dollars per
cwt.
dollars per
cwt.
dollars per
cwt.
dollars per
cwt.
dollars per
cwt.
dollars per
cwt.
dollars per
cwt.
2011 ....
2012 ....
2013 ....
2014 ....
2015 ....
18.20
20.60
21.20
24.60
19.20
20.10
19.20
20.80
25.90
18.30
21.60
18.50
20.50
26.30
18.00
21.40
18.10
20.70
26.50
17.90
21.40
17.50
20.70
26.10
18.00
22.70
17.10
20.80
25.10
18.20
23.10
17.60
20.50
25.30
17.90
23.70
18.80
20.90
26.10
17.80
23.00
20.40
21.60
27.20
19.00
21.50
22.30
22.20
25.80
19.50
21.60
23.10
23.00
24.10
20.30
21.20
22.20
23.40
22.80
19.10
21.60
19.60
21.30
25.50
18.60
1 Marketing year is from January 1 to December 31 of the year shown.
Dairy Plants Manufacturing One or More Dairy Products — New England: 2011-2015
Year Connecticut Maine Massachusetts New Hampshire Rhode Island Vermont New England
number number number number number number number
2011 ...............
2012 ...............
2013 ...............
2014 ...............
2015 ...............
22
22
26
27
26
20
20
21
21
22
24
25
32
34
36
8
9
9
10
10
4
4
4
4
4
28
34
34
35
34
106
114
126
131
132
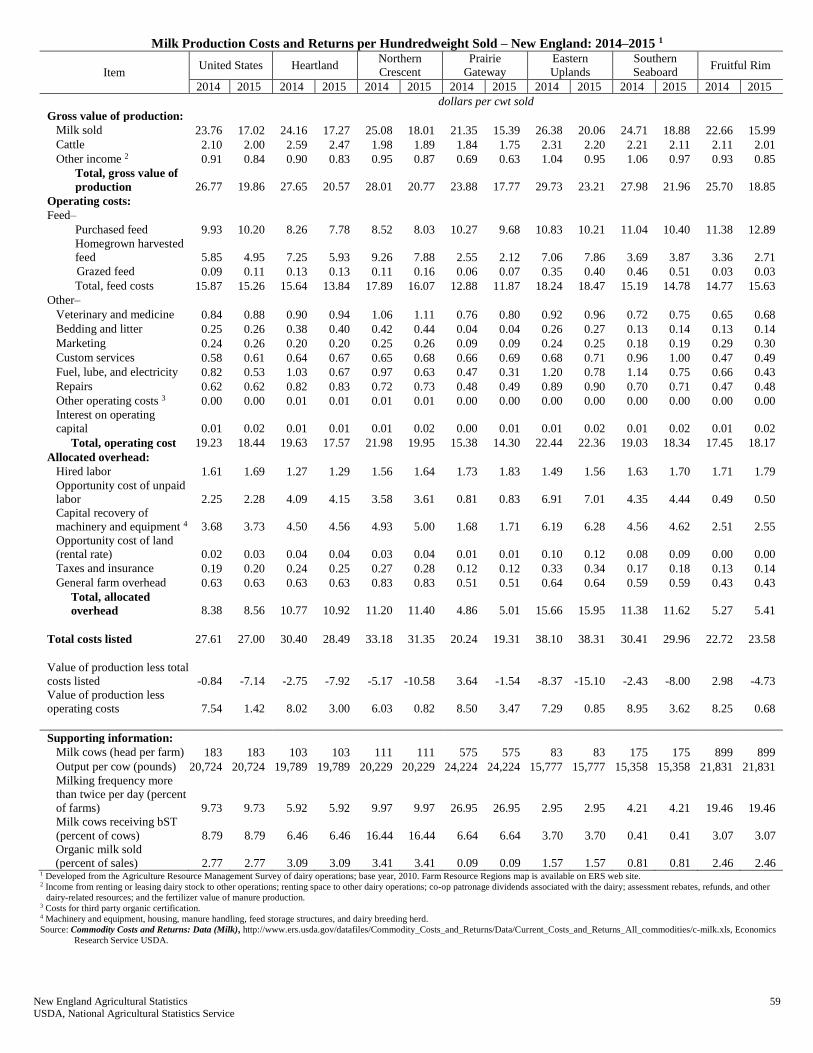
New England Agricultural Statistics 59 USDA, National Agricultural Statistics Service
Milk Production Costs and Returns per Hundredweight Sold – New England: 2014–2015 1
Item United States Heartland
Northern
Crescent
Prairie
Gateway
Eastern
Uplands
Southern
Seaboard Fruitful Rim
2014 2015 2014 2015 2014 2015 2014 2015 2014 2015 2014 2015 2014 2015
dollars per cwt sold
Gross value of production:
Milk sold 23.76 17.02 24.16 17.27 25.08 18.01 21.35 15.39 26.38 20.06 24.71 18.88 22.66 15.99
Cattle 2.10 2.00 2.59 2.47 1.98 1.89 1.84 1.75 2.31 2.20 2.21 2.11 2.11 2.01
Other income 2 0.91 0.84 0.90 0.83 0.95 0.87 0.69 0.63 1.04 0.95 1.06 0.97 0.93 0.85
Total, gross value of
production 26.77 19.86 27.65 20.57 28.01 20.77 23.88 17.77 29.73 23.21 27.98 21.96 25.70 18.85
Operating costs:
Feed–
Purchased feed 9.93 10.20 8.26 7.78 8.52 8.03 10.27 9.68 10.83 10.21 11.04 10.40 11.38 12.89
Homegrown harvested
feed 5.85 4.95 7.25 5.93 9.26 7.88 2.55 2.12 7.06 7.86 3.69 3.87 3.36 2.71
Grazed feed 0.09 0.11 0.13 0.13 0.11 0.16 0.06 0.07 0.35 0.40 0.46 0.51 0.03 0.03
Total, feed costs 15.87 15.26 15.64 13.84 17.89 16.07 12.88 11.87 18.24 18.47 15.19 14.78 14.77 15.63
Other–
Veterinary and medicine 0.84 0.88 0.90 0.94 1.06 1.11 0.76 0.80 0.92 0.96 0.72 0.75 0.65 0.68
Bedding and litter 0.25 0.26 0.38 0.40 0.42 0.44 0.04 0.04 0.26 0.27 0.13 0.14 0.13 0.14
Marketing 0.24 0.26 0.20 0.20 0.25 0.26 0.09 0.09 0.24 0.25 0.18 0.19 0.29 0.30
Custom services 0.58 0.61 0.64 0.67 0.65 0.68 0.66 0.69 0.68 0.71 0.96 1.00 0.47 0.49
Fuel, lube, and electricity 0.82 0.53 1.03 0.67 0.97 0.63 0.47 0.31 1.20 0.78 1.14 0.75 0.66 0.43
Repairs 0.62 0.62 0.82 0.83 0.72 0.73 0.48 0.49 0.89 0.90 0.70 0.71 0.47 0.48
Other operating costs 3 0.00 0.00 0.01 0.01 0.01 0.01 0.00 0.00 0.00 0.00 0.00 0.00 0.00 0.00
Interest on operating
capital 0.01 0.02 0.01 0.01 0.01 0.02 0.00 0.01 0.01 0.02 0.01 0.02 0.01 0.02
Total, operating cost 19.23 18.44 19.63 17.57 21.98 19.95 15.38 14.30 22.44 22.36 19.03 18.34 17.45 18.17
Allocated overhead:
Hired labor 1.61 1.69 1.27 1.29 1.56 1.64 1.73 1.83 1.49 1.56 1.63 1.70 1.71 1.79
Opportunity cost of unpaid
labor 2.25 2.28 4.09 4.15 3.58 3.61 0.81 0.83 6.91 7.01 4.35 4.44 0.49 0.50
Capital recovery of
machinery and equipment 4 3.68 3.73 4.50 4.56 4.93 5.00 1.68 1.71 6.19 6.28 4.56 4.62 2.51 2.55
Opportunity cost of land
(rental rate) 0.02 0.03 0.04 0.04 0.03 0.04 0.01 0.01 0.10 0.12 0.08 0.09 0.00 0.00
Taxes and insurance 0.19 0.20 0.24 0.25 0.27 0.28 0.12 0.12 0.33 0.34 0.17 0.18 0.13 0.14
General farm overhead 0.63 0.63 0.63 0.63 0.83 0.83 0.51 0.51 0.64 0.64 0.59 0.59 0.43 0.43
Total, allocated
overhead 8.38 8.56 10.77 10.92 11.20 11.40 4.86 5.01 15.66 15.95 11.38 11.62 5.27 5.41
Total costs listed 27.61 27.00 30.40 28.49 33.18 31.35 20.24 19.31 38.10 38.31 30.41 29.96 22.72 23.58
Value of production less total
costs listed -0.84 -7.14 -2.75 -7.92 -5.17 -10.58 3.64 -1.54 -8.37 -15.10 -2.43 -8.00 2.98 -4.73
Value of production less
operating costs 7.54 1.42 8.02 3.00 6.03 0.82 8.50 3.47 7.29 0.85 8.95 3.62 8.25 0.68
Supporting information:
Milk cows (head per farm) 183 183 103 103 111 111 575 575 83 83 175 175 899 899
Output per cow (pounds) 20,724 20,724 19,789 19,789 20,229 20,229 24,224 24,224 15,777 15,777 15,358 15,358 21,831 21,831
Milking frequency more
than twice per day (percent
of farms) 9.73 9.73 5.92 5.92 9.97 9.97 26.95 26.95 2.95 2.95 4.21 4.21 19.46 19.46
Milk cows receiving bST
(percent of cows) 8.79 8.79 6.46 6.46 16.44 16.44 6.64 6.64 3.70 3.70 0.41 0.41 3.07 3.07
Organic milk sold
(percent of sales) 2.77 2.77 3.09 3.09 3.41 3.41 0.09 0.09 1.57 1.57 0.81 0.81 2.46 2.46 1 Developed from the Agriculture Resource Management Survey of dairy operations; base year, 2010. Farm Resource Regions map is available on ERS web site. 2 Income from renting or leasing dairy stock to other operations; renting space to other dairy operations; co-op patronage dividends associated with the dairy; assessment rebates, refunds, and other
dairy-related resources; and the fertilizer value of manure production. 3 Costs for third party organic certification. 4 Machinery and equipment, housing, manure handling, feed storage structures, and dairy breeding herd.
Source: Commodity Costs and Returns: Data (Milk), http://www.ers.usda.gov/datafiles/Commodity_Costs_and_Returns/Data/Current_Costs_and_Returns_All_commodities/c-milk.xls, Economics
Research Service USDA.
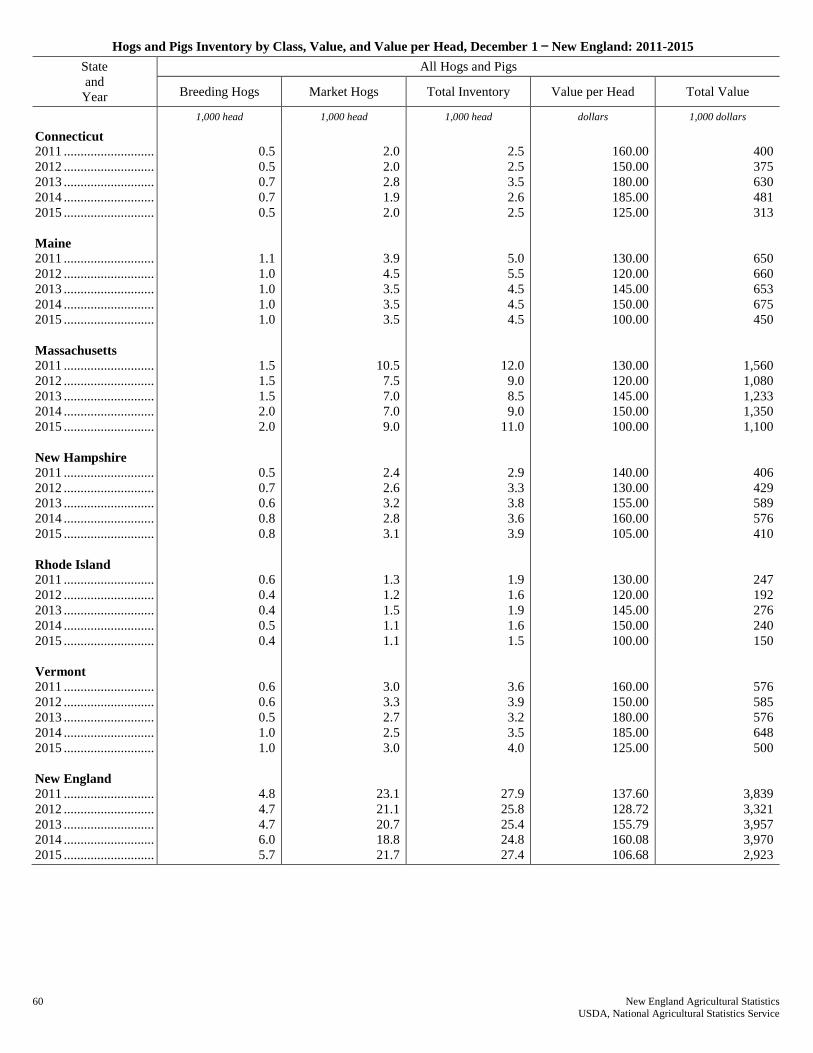
60 New England Agricultural Statistics USDA, National Agricultural Statistics Service
Hogs and Pigs Inventory by Class, Value, and Value per Head, December 1 — New England: 2011-2015
State
and
Year
All Hogs and Pigs
Breeding Hogs Market Hogs Total Inventory Value per Head Total Value
1,000 head 1,000 head 1,000 head dollars 1,000 dollars
Connecticut 2011 ...........................
2012 ...........................
2013 ...........................
2014 ...........................
2015 ...........................
Maine 2011 ...........................
2012 ...........................
2013 ...........................
2014 ...........................
2015 ...........................
Massachusetts 2011 ...........................
2012 ...........................
2013 ...........................
2014 ...........................
2015 ...........................
New Hampshire 2011 ...........................
2012 ...........................
2013 ...........................
2014 ...........................
2015 ...........................
Rhode Island 2011 ...........................
2012 ...........................
2013 ...........................
2014 ...........................
2015 ...........................
Vermont 2011 ...........................
2012 ...........................
2013 ...........................
2014 ...........................
2015 ...........................
New England 2011 ...........................
2012 ...........................
2013 ...........................
2014 ...........................
2015 ...........................
0.5
0.5
0.7
0.7
0.5
1.1
1.0
1.0
1.0
1.0
1.5
1.5
1.5
2.0
2.0
0.5
0.7
0.6
0.8
0.8
0.6
0.4
0.4
0.5
0.4
0.6
0.6
0.5
1.0
1.0
4.8
4.7
4.7
6.0
5.7
2.0
2.0
2.8
1.9
2.0
3.9
4.5
3.5
3.5
3.5
10.5
7.5
7.0
7.0
9.0
2.4
2.6
3.2
2.8
3.1
1.3
1.2
1.5
1.1
1.1
3.0
3.3
2.7
2.5
3.0
23.1
21.1
20.7
18.8
21.7
2.5
2.5
3.5
2.6
2.5
5.0
5.5
4.5
4.5
4.5
12.0
9.0
8.5
9.0
11.0
2.9
3.3
3.8
3.6
3.9
1.9
1.6
1.9
1.6
1.5
3.6
3.9
3.2
3.5
4.0
27.9
25.8
25.4
24.8
27.4
160.00
150.00
180.00
185.00
125.00
130.00
120.00
145.00
150.00
100.00
130.00
120.00
145.00
150.00
100.00
140.00
130.00
155.00
160.00
105.00
130.00
120.00
145.00
150.00
100.00
160.00
150.00
180.00
185.00
125.00
137.60
128.72
155.79
160.08
106.68
400
375
630
481
313
650
660
653
675
450
1,560
1,080
1,233
1,350
1,100
406
429
589
576
410
247
192
276
240
150
576
585
576
648
500
3,839
3,321
3,957
3,970
2,923
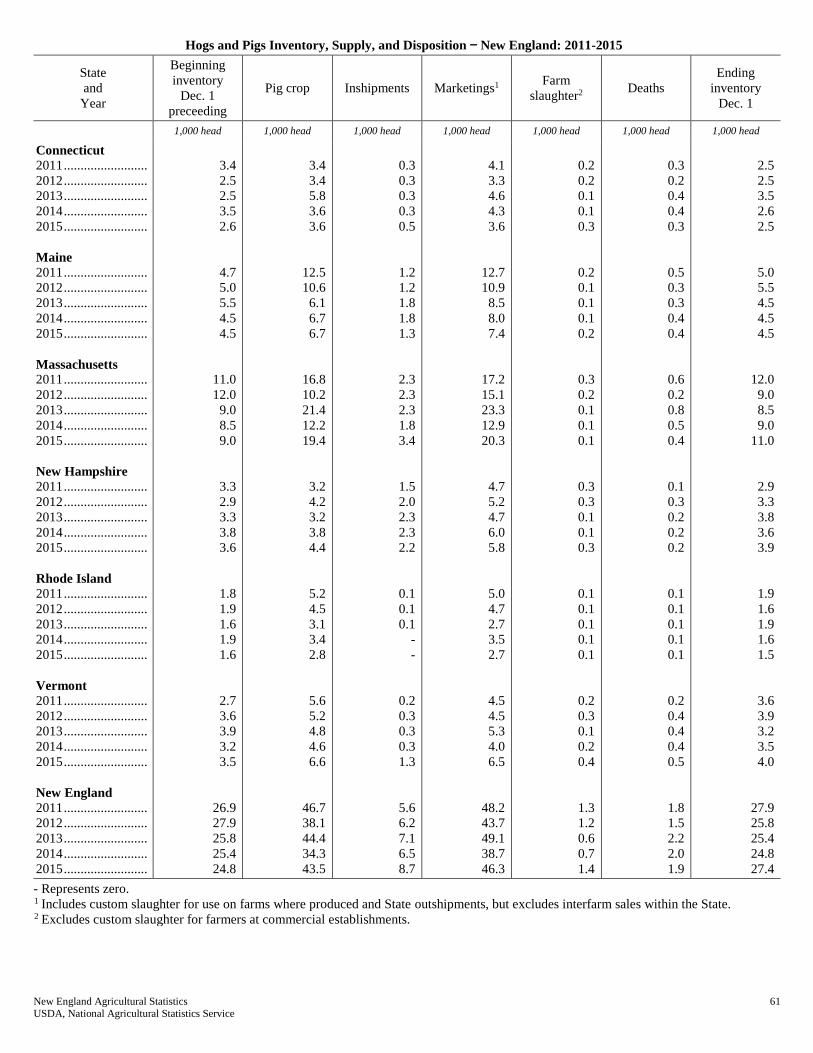
New England Agricultural Statistics 61 USDA, National Agricultural Statistics Service
Hogs and Pigs Inventory, Supply, and Disposition — New England: 2011-2015
State
and
Year
Beginning
inventory
Dec. 1
preceeding
Pig crop Inshipments Marketings1 Farm
slaughter2 Deaths
Ending
inventory
Dec. 1
1,000 head 1,000 head 1,000 head 1,000 head 1,000 head 1,000 head 1,000 head
Connecticut 2011 .........................
2012 .........................
2013 .........................
2014 .........................
2015 .........................
Maine 2011 .........................
2012 .........................
2013 .........................
2014 .........................
2015 .........................
Massachusetts 2011 .........................
2012 .........................
2013 .........................
2014 .........................
2015 .........................
New Hampshire 2011 .........................
2012 .........................
2013 .........................
2014 .........................
2015 .........................
Rhode Island 2011 .........................
2012 .........................
2013 .........................
2014 .........................
2015 .........................
Vermont 2011 .........................
2012 .........................
2013 .........................
2014 .........................
2015 .........................
New England 2011 .........................
2012 .........................
2013 .........................
2014 .........................
2015 .........................
3.4
2.5
2.5
3.5
2.6
4.7
5.0
5.5
4.5
4.5
11.0
12.0
9.0
8.5
9.0
3.3
2.9
3.3
3.8
3.6
1.8
1.9
1.6
1.9
1.6
2.7
3.6
3.9
3.2
3.5
26.9
27.9
25.8
25.4
24.8
3.4
3.4
5.8
3.6
3.6
12.5
10.6
6.1
6.7
6.7
16.8
10.2
21.4
12.2
19.4
3.2
4.2
3.2
3.8
4.4
5.2
4.5
3.1
3.4
2.8
5.6
5.2
4.8
4.6
6.6
46.7
38.1
44.4
34.3
43.5
0.3
0.3
0.3
0.3
0.5
1.2
1.2
1.8
1.8
1.3
2.3
2.3
2.3
1.8
3.4
1.5
2.0
2.3
2.3
2.2
0.1
0.1
0.1
-
-
0.2
0.3
0.3
0.3
1.3
5.6
6.2
7.1
6.5
8.7
4.1
3.3
4.6
4.3
3.6
12.7
10.9
8.5
8.0
7.4
17.2
15.1
23.3
12.9
20.3
4.7
5.2
4.7
6.0
5.8
5.0
4.7
2.7
3.5
2.7
4.5
4.5
5.3
4.0
6.5
48.2
43.7
49.1
38.7
46.3
0.2
0.2
0.1
0.1
0.3
0.2
0.1
0.1
0.1
0.2
0.3
0.2
0.1
0.1
0.1
0.3
0.3
0.1
0.1
0.3
0.1
0.1
0.1
0.1
0.1
0.2
0.3
0.1
0.2
0.4
1.3
1.2
0.6
0.7
1.4
0.3
0.2
0.4
0.4
0.3
0.5
0.3
0.3
0.4
0.4
0.6
0.2
0.8
0.5
0.4
0.1
0.3
0.2
0.2
0.2
0.1
0.1
0.1
0.1
0.1
0.2
0.4
0.4
0.4
0.5
1.8
1.5
2.2
2.0
1.9
2.5
2.5
3.5
2.6
2.5
5.0
5.5
4.5
4.5
4.5
12.0
9.0
8.5
9.0
11.0
2.9
3.3
3.8
3.6
3.9
1.9
1.6
1.9
1.6
1.5
3.6
3.9
3.2
3.5
4.0
27.9
25.8
25.4
24.8
27.4
- Represents zero. 1 Includes custom slaughter for use on farms where produced and State outshipments, but excludes interfarm sales within the State. 2 Excludes custom slaughter for farmers at commercial establishments.
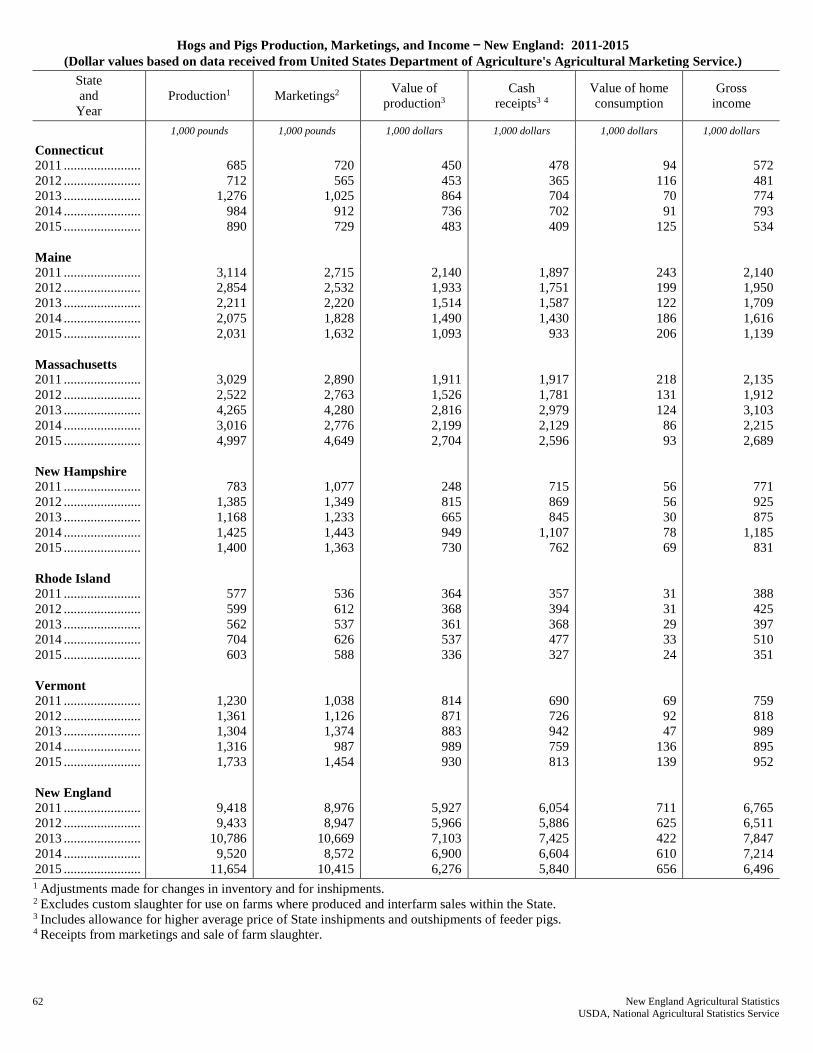
62 New England Agricultural Statistics USDA, National Agricultural Statistics Service
Hogs and Pigs Production, Marketings, and Income — New England: 2011-2015
(Dollar values based on data received from United States Department of Agriculture's Agricultural Marketing Service.)
State
and
Year
Production1 Marketings2 Value of
production3
Cash
receipts3 4
Value of home
consumption
Gross
income
1,000 pounds 1,000 pounds 1,000 dollars 1,000 dollars 1,000 dollars 1,000 dollars
Connecticut 2011 .......................
2012 .......................
2013 .......................
2014 .......................
2015 .......................
Maine 2011 .......................
2012 .......................
2013 .......................
2014 .......................
2015 .......................
Massachusetts 2011 .......................
2012 .......................
2013 .......................
2014 .......................
2015 .......................
New Hampshire 2011 .......................
2012 .......................
2013 .......................
2014 .......................
2015 .......................
Rhode Island 2011 .......................
2012 .......................
2013 .......................
2014 .......................
2015 .......................
Vermont 2011 .......................
2012 .......................
2013 .......................
2014 .......................
2015 .......................
New England 2011 .......................
2012 .......................
2013 .......................
2014 .......................
2015 .......................
685
712
1,276
984
890
3,114
2,854
2,211
2,075
2,031
3,029
2,522
4,265
3,016
4,997
783
1,385
1,168
1,425
1,400
577
599
562
704
603
1,230
1,361
1,304
1,316
1,733
9,418
9,433
10,786
9,520
11,654
720
565
1,025
912
729
2,715
2,532
2,220
1,828
1,632
2,890
2,763
4,280
2,776
4,649
1,077
1,349
1,233
1,443
1,363
536
612
537
626
588
1,038
1,126
1,374
987
1,454
8,976
8,947
10,669
8,572
10,415
450
453
864
736
483
2,140
1,933
1,514
1,490
1,093
1,911
1,526
2,816
2,199
2,704
248
815
665
949
730
364
368
361
537
336
814
871
883
989
930
5,927
5,966
7,103
6,900
6,276
478
365
704
702
409
1,897
1,751
1,587
1,430
933
1,917
1,781
2,979
2,129
2,596
715
869
845
1,107
762
357
394
368
477
327
690
726
942
759
813
6,054
5,886
7,425
6,604
5,840
94
116
70
91
125
243
199
122
186
206
218
131
124
86
93
56
56
30
78
69
31
31
29
33
24
69
92
47
136
139
711
625
422
610
656
572
481
774
793
534
2,140
1,950
1,709
1,616
1,139
2,135
1,912
3,103
2,215
2,689
771
925
875
1,185
831
388
425
397
510
351
759
818
989
895
952
6,765
6,511
7,847
7,214
6,496
1 Adjustments made for changes in inventory and for inshipments. 2 Excludes custom slaughter for use on farms where produced and interfarm sales within the State. 3 Includes allowance for higher average price of State inshipments and outshipments of feeder pigs. 4 Receipts from marketings and sale of farm slaughter.
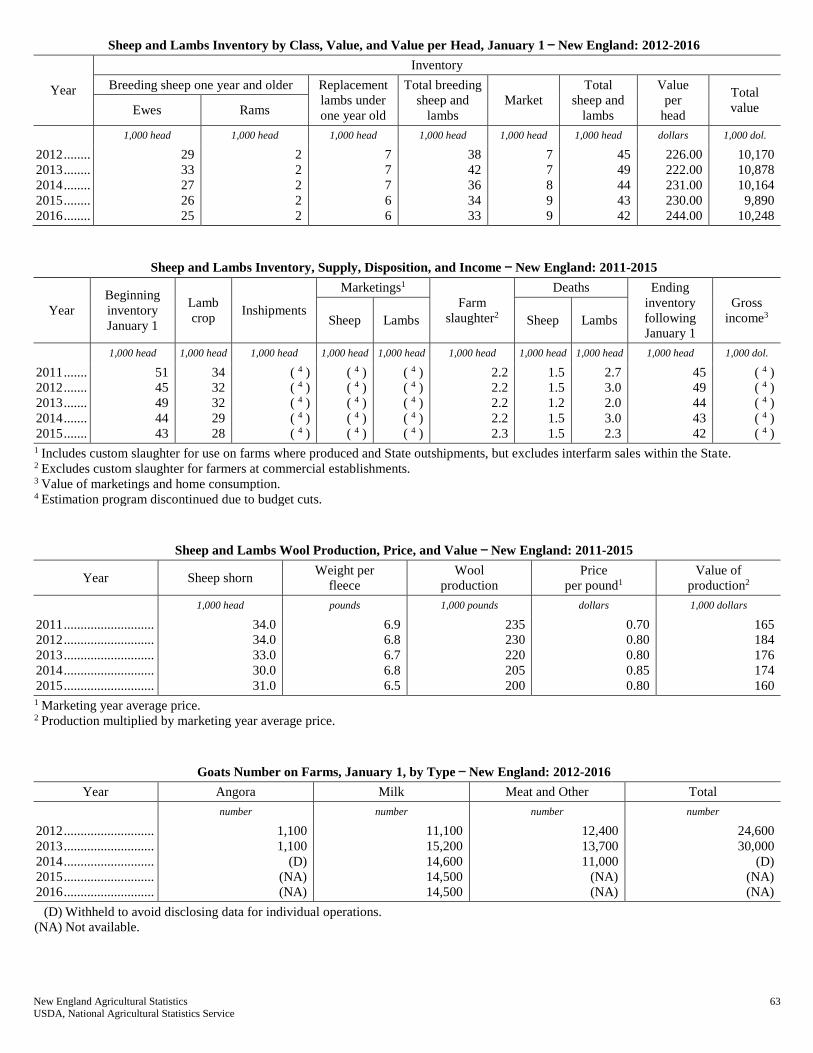
New England Agricultural Statistics 63 USDA, National Agricultural Statistics Service
Sheep and Lambs Inventory by Class, Value, and Value per Head, January 1 — New England: 2012-2016
Year
Inventory
Breeding sheep one year and older Replacement
lambs under
one year old
Total breeding
sheep and
lambs
Market
Total
sheep and
lambs
Value
per
head
Total
value Ewes Rams
1,000 head 1,000 head 1,000 head 1,000 head 1,000 head 1,000 head dollars 1,000 dol.
2012 ........
2013 ........
2014 ........
2015 ........
2016 ........
29
33
27
26
25
2
2
2
2
2
7
7
7
6
6
38
42
36
34
33
7
7
8
9
9
45
49
44
43
42
226.00
222.00
231.00
230.00
244.00
10,170
10,878
10,164
9,890
10,248
Sheep and Lambs Inventory, Supply, Disposition, and Income — New England: 2011-2015
Year
Beginning
inventory
January 1
Lamb
crop Inshipments
Marketings1
Farm
slaughter2
Deaths Ending
inventory
following
January 1
Gross
income3 Sheep Lambs Sheep Lambs
1,000 head 1,000 head 1,000 head 1,000 head 1,000 head 1,000 head 1,000 head 1,000 head 1,000 head 1,000 dol.
2011 .......
2012 .......
2013 .......
2014 .......
2015 .......
51
45
49
44
43
34
32
32
29
28
( 4 )
( 4 )
( 4 )
( 4 )
( 4 )
( 4 )
( 4 )
( 4 )
( 4 )
( 4 )
( 4 )
( 4 )
( 4 )
( 4 )
( 4 )
2.2
2.2
2.2
2.2
2.3
1.5
1.5
1.2
1.5
1.5
2.7
3.0
2.0
3.0
2.3
45
49
44
43
42
( 4 )
( 4 )
( 4 )
( 4 )
( 4 )
1 Includes custom slaughter for use on farms where produced and State outshipments, but excludes interfarm sales within the State. 2 Excludes custom slaughter for farmers at commercial establishments. 3 Value of marketings and home consumption. 4 Estimation program discontinued due to budget cuts.
Sheep and Lambs Wool Production, Price, and Value — New England: 2011-2015
Year Sheep shorn Weight per
fleece
Wool
production
Price
per pound1
Value of
production2
1,000 head pounds 1,000 pounds dollars 1,000 dollars
2011 ...........................
2012 ...........................
2013 ...........................
2014 ...........................
2015 ...........................
34.0
34.0
33.0
30.0
31.0
6.9
6.8
6.7
6.8
6.5
235
230
220
205
200
0.70
0.80
0.80
0.85
0.80
165
184
176
174
160
1 Marketing year average price. 2 Production multiplied by marketing year average price.
Goats Number on Farms, January 1, by Type — New England: 2012-2016
Year Angora Milk Meat and Other Total
number number number number
2012 ...........................
2013 ...........................
2014 ...........................
2015 ...........................
2016 ...........................
1,100
1,100
(D)
(NA)
(NA)
11,100
15,200
14,600
14,500
14,500
12,400
13,700
11,000
(NA)
(NA)
24,600
30,000
(D)
(NA)
(NA)
(D) Withheld to avoid disclosing data for individual operations.
(NA) Not available.

64 New England Agricultural Statistics USDA, National Agricultural Statistics Service
Chickens Number on Farms, Inventory Value, and Value per Head, December 1 — New England: 2011-2015
State
and
Year
Total
Layers
Total
Pullets
Other
Chickens
All Chickens (excl. meat chickens)
Number Value per Head Total Value
1,000 head 1,000 head 1,000 head 1,000 head dollars 1,000 dollars
Connecticut 2011 ........................
2012 ........................
2013 ........................
2014 ........................
2015 ........................
Maine 2011 ........................
2012 ........................
2013 ........................
2014 ........................
2015 ........................
Massachusetts 2011 ........................
2012 ........................
2013 ........................
2014 ........................
2015 ........................
Vermont 2011 ........................
2012 ........................
2013 ........................
2014 ........................
2015 ........................
New England1 2011 ........................
2012 ........................
2013 ........................
2014 ........................
2015 ........................
2,340
2,427
2,419
(D)
(D)
3,570
3,539
3,535
(D)
(D)
131
155
139
144
146
212
217
143
141
122
6,253
6,338
6,236
(NA)
(NA)
615
566
559
(D)
(D)
61
61
61
(D)
(D)
11
8
8
8
14
9
12
12
11
4
696
647
640
(NA)
(NA)
9
7
7
(D)
(D)
0
0
0
(D)
(D)
0
0
0
0
0
2
2
3
1
1
11
9
10
(NA)
(NA)
2,964
3,000
2,985
(D)
(D)
3,631
3,600
3,596
(D)
(D)
142
163
147
152
160
223
231
158
153
127
6,960
6,994
6,886
(NA)
(NA)
2.70
2.90
2.90
(D)
(D)
2.50
2.70
2.70
(D)
(D)
5.00
5.00
6.30
6.80
6.60
3.70
3.50
5.90
4.00
3.70
2.67
2.87
2.94
(NA)
(NA)
8,003
8,700
8,657
(D)
(D)
9,078
9,720
9,709
(D)
(D)
710
815
926
1,034
1,056
825
809
932
612
470
18,616
20,044
20,224
(NA)
(NA)
(D) Withheld to avoid disclosing data for individual operations.
(NA) Not available.1 New England includes Connecticut, Maine, Massachusetts, and Vermont.

New England Agricultural Statistics 65 USDA, National Agricultural Statistics Service
Chickens Sold and Value of Sales — New England: 2011-2015 1
State and
Year
Number
Lost2
Number Sold
for Slaughter
Pounds Sold
(Live)
Price per lb.
(Live)
Value
of Sales
1,000 head 1,000 head 1,000 head cents 1,000 dollars
Connecticut 2011 ...........................
2012 ...........................
2013 ...........................
2014 ...........................
2015 ...........................
Maine 2011 ...........................
2012 ...........................
2013 ...........................
2014 ...........................
2015 ...........................
Massachusetts 2011 ...........................
2012 ...........................
2013 ...........................
2014 ...........................
2015 ...........................
Vermont 2011 ...........................
2012 ...........................
2013 ...........................
2014 ...........................
2015 ...........................
New England3 2011 ...........................
2012 ...........................
2013 ...........................
2014 ...........................
2015 ...........................
1,826
1,807
1,805
(D)
(D)
509
511
507
(D)
(D)
7
5
9
7
8
19
26
12
18
17
2,361
2,349
2,333
(NA)
(NA)
66
64
34
(D)
(D)
1,010
1,280
1,225
(D)
(D)
85
92
83
97
95
181
126
159
92
108
1,342
1,562
1,501
(NA)
(NA)
304
288
194
(D)
(D)
3,232
4,096
3,920
(D)
(D)
272
294
266
310
304
652
491
588
405
486
4,460
5,169
4,968
(NA)
(NA)
6.9
6.9
11.9
(D)
(D)
0.1
0.1
0.1
(D)
(D)
(NA)
(NA)
(NA)
(NA)
(NA)
2.6
4.5
3.2
7.7
8.0
1.0
0.9
1.0
(NA)
(NA)
21
20
23
(D)
(D)
3
4
4
(D)
(D)
(Z)
(Z)
(Z)
(Z)
(Z)
17
22
19
31
39
41
46
46
(NA)
(NA)
(D) Withheld to avoid disclosing data for individual operations.(NA) Not available. (Z) Less than half of the unit shown. 1 Excludes commercial broilers. 2 Includes rendered, died, composted, destroyed, or disappeared for any reason except sold during the 12-month period. 3 New England includes Connecticut, Maine, Massachusetts, and Vermont.

66 USDA, National Agricultural Statistics Service
Egg Production and Value of Sales — New England: 2011-2015
State
and
Year
Average Layers
on Hand
During Year1
Eggs per
Layer2
Eggs
Produced1
Price per
Dozen3
Value of
Production1
1,000 head number millions dollars 1,000 dollars
Connecticut 2011 ...........................
2012 ...........................
2013 ...........................
2014 ...........................
2015 ...........................
Maine 2011 ...........................
2012 ...........................
2013 ...........................
2014 ...........................
2015 ...........................
Massachusetts 2011 ...........................
2012 ...........................
2013 ...........................
2014 ...........................
2015 ...........................
Vermont 2011 ...........................
2012 ...........................
2013 ...........................
2014 ...........................
2015 ...........................
New England4 2011 ...........................
2012 ...........................
2013 ...........................
2014 ...........................
2015 ...........................
2,271
2,306
2,369
(D)
(D)
3,585
3,552
3,524
(D)
(D)
130
132
152
140
144
224
206
162
143
139
6,210
6,196
6,207
(NA)
(NA)
281
282
282
(D)
(D)
280
281
281
(D)
(D)
277
280
317
315
326
269
291
260
252
260
280
282
281
(NA)
(NA)
638
651
668
(D)
(D)
1,003
998
989
(D)
(D)
36
37
48
44
47
60
60
42
36
36
1,737
1,746
1,747
(NA)
(NA)
0.789
0.859
0.935
(D)
(D)
0.772
0.830
0.876
(D)
(D)
0.774
0.838
0.874
1.048
1.512
0.877
0.971
1.057
1.425
1.753
0.782
0.846
0.903
(NA)
(NA)
41,948
46,588
52,024
(D)
(D)
64,544
69,041
72,208
(D)
(D)
2,321
2,583
3,496
3,842
5,921
4,384
4,855
3,701
4,274
5,258
113,197
123,067
131,429
(NA)
(NA)
(D) Withheld to avoid disclosing data for individual operations.
(NA) Not available.
1 Marketing year is from December 1 of the previous year to November 30 of the year shown. 2 Eggs produced divided by the average number of layers on hand. 3 Handling, shipping, and marketing charges are excluded. 4 New England includes Connecticut, Maine, Massachusetts, and Vermont.
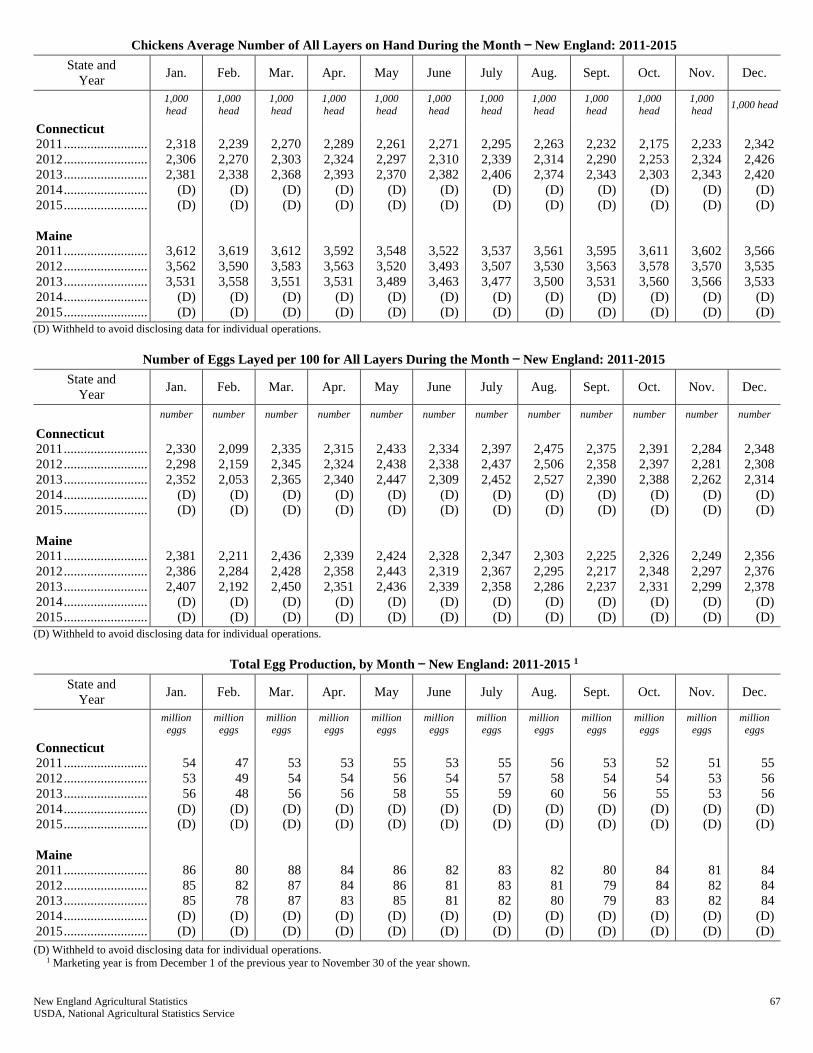
New England Agricultural Statistics 67 USDA, National Agricultural Statistics Service
Chickens Average Number of All Layers on Hand During the Month — New England: 2011-2015
State and
Year Jan. Feb. Mar. Apr. May June July Aug. Sept. Oct. Nov. Dec.
1,000
head
1,000
head
1,000
head
1,000
head
1,000
head
1,000
head
1,000
head
1,000
head
1,000
head
1,000
head
1,000
head 1,000 head
Connecticut 2011 .........................
2012 .........................
2013 .........................
2014 .........................
2015 .........................
Maine 2011 .........................
2012 .........................
2013 .........................
2014 .........................
2015 .........................
2,318
2,306
2,381
(D)
(D)
3,612
3,562
3,531
(D)
(D)
2,239
2,270
2,338
(D)
(D)
3,619
3,590
3,558
(D)
(D)
2,270
2,303
2,368
(D)
(D)
3,612
3,583
3,551
(D)
(D)
2,289
2,324
2,393
(D)
(D)
3,592
3,563
3,531
(D)
(D)
2,261
2,297
2,370
(D)
(D)
3,548
3,520
3,489
(D)
(D)
2,271
2,310
2,382
(D)
(D)
3,522
3,493
3,463
(D)
(D)
2,295
2,339
2,406
(D)
(D)
3,537
3,507
3,477
(D)
(D)
2,263
2,314
2,374
(D)
(D)
3,561
3,530
3,500
(D)
(D)
2,232
2,290
2,343
(D)
(D)
3,595
3,563
3,531
(D)
(D)
2,175
2,253
2,303
(D)
(D)
3,611
3,578
3,560
(D)
(D)
2,233
2,324
2,343
(D)
(D)
3,602
3,570
3,566
(D)
(D)
2,342
2,426
2,420
(D)
(D)
3,566
3,535
3,533
(D)
(D)
(D) Withheld to avoid disclosing data for individual operations.
Number of Eggs Layed per 100 for All Layers During the Month — New England: 2011-2015
State and
Year Jan. Feb. Mar. Apr. May June July Aug. Sept. Oct. Nov. Dec.
number number number number number number number number number number number number
Connecticut 2011 .........................
2012 .........................
2013 .........................
2014 .........................
2015 .........................
Maine 2011 .........................
2012 .........................
2013 .........................
2014 .........................
2015 .........................
2,330
2,298
2,352
(D)
(D)
2,381
2,386
2,407
(D)
(D)
2,099
2,159
2,053
(D)
(D)
2,211
2,284
2,192
(D)
(D)
2,335
2,345
2,365
(D)
(D)
2,436
2,428
2,450
(D)
(D)
2,315
2,324
2,340
(D)
(D)
2,339
2,358
2,351
(D)
(D)
2,433
2,438
2,447
(D)
(D)
2,424
2,443
2,436
(D)
(D)
2,334
2,338
2,309
(D)
(D)
2,328
2,319
2,339
(D)
(D)
2,397
2,437
2,452
(D)
(D)
2,347
2,367
2,358
(D)
(D)
2,475
2,506
2,527
(D)
(D)
2,303
2,295
2,286
(D)
(D)
2,375
2,358
2,390
(D)
(D)
2,225
2,217
2,237
(D)
(D)
2,391
2,397
2,388
(D)
(D)
2,326
2,348
2,331
(D)
(D)
2,284
2,281
2,262
(D)
(D)
2,249
2,297
2,299
(D)
(D)
2,348
2,308
2,314
(D)
(D)
2,356
2,376
2,378
(D)
(D)
(D) Withheld to avoid disclosing data for individual operations.
Total Egg Production, by Month — New England: 2011-2015 1
State and
Year Jan. Feb. Mar. Apr. May June July Aug. Sept. Oct. Nov. Dec.
million
eggs million
eggs million
eggs million
eggs million
eggs million
eggs million
eggs million
eggs million
eggs million
eggs million
eggs million
eggs
Connecticut 2011 .........................
2012 .........................
2013 .........................
2014 .........................
2015 .........................
Maine 2011 .........................
2012 .........................
2013 .........................
2014 .........................
2015 .........................
54
53
56
(D)
(D)
86
85
85
(D)
(D)
47
49
48
(D)
(D)
80
82
78
(D)
(D)
53
54
56
(D)
(D)
88
87
87
(D)
(D)
53
54
56
(D)
(D)
84
84
83
(D)
(D)
55
56
58
(D)
(D)
86
86
85
(D)
(D)
53
54
55
(D)
(D)
82
81
81
(D)
(D)
55
57
59
(D)
(D)
83
83
82
(D)
(D)
56
58
60
(D)
(D)
82
81
80
(D)
(D)
53
54
56
(D)
(D)
80
79
79
(D)
(D)
52
54
55
(D)
(D)
84
84
83
(D)
(D)
51
53
53
(D)
(D)
81
82
82
(D)
(D)
55
56
56
(D)
(D)
84
84
84
(D)
(D)
(D) Withheld to avoid disclosing data for individual operations. 1 Marketing year is from December 1 of the previous year to November 30 of the year shown.

68 New England Agricultural Statistics USDA, National Agricultural Statistics Service
Maple Syrup Taps, Yield, Price, and Production — New England: 2011-2015
State and
Year Taps
Yield
per Tap Production
Average Price
per Gallon1
Value of
Production
1,000 taps gallons 1,000 gallons dollars 1,000 dollars
Connecticut 2011 ........................
2012 ........................
2013 ........................
2014 ........................
2015 ........................
Maine 2011 ........................
2012 ........................
2013 ........................
2014 ........................
2015 ........................
Massachusetts 2011 ........................
2012 ........................
2013 ........................
2014 ........................
2015 ........................
New Hampshire 2011 ........................
2012 ........................
2013 ........................
2014 ........................
2015 ........................
Vermont 2011 ........................
2012 ........................
2013 ........................
2014 ........................
2015 ........................
New England2 2011 ........................
2012 ........................
2013 ........................
2014 ........................
2015 ........................
71
64
78
83
85
1,670
1,880
1,880
1,850
1,850
245
229
280
290
310
440
495
470
490
560
3,550
4,350
4,200
4,350
4,550
5,976
7,018
6,908
7,063
7,355
0.239
0.156
0.256
0.193
0.224
0.246
0.237
0.298
0.295
0.299
0.253
0.183
0.225
0.210
0.242
0.286
0.190
0.264
0.229
0.275
0.346
0.230
0.352
0.310
0.310
0.309
0.227
0.325
0.295
0.301
17
10
20
16
19
410
445
560
545
553
62
42
63
61
75
126
94
124
112
154
1,230
999
1,480
1,350
1,410
1,845
1,590
2,247
2,084
2,211
73.00
63.40
71.00
70.90
87.20
34.00
33.00
32.00
31.50
28.00
57.00
51.50
59.10
56.30
50.50
49.00
52.50
53.40
57.80
59.40
35.00
35.50
33.40
33.00
33.00
36.82
36.40
35.21
34.91
34.65
1,241
634
1,420
1,134
1,657
13,940
14,685
17,920
17,168
15,484
3,534
2,163
3,723
3,434
3,788
6,174
4,935
6,622
6,474
9,148
43,050
35,465
49,432
44,550
46,530
67,939
57,882
79,117
72,760
76,607
1 Average price per gallon is a weighted average of retail, wholesale, and bulk sales. This price is lower for states, such as Maine and
Vermont, with more wholesale and bulk sales. The average price per gallon is not the average retail price paid for a gallon of syrup. 2 New England includes Connecticut, Maine, Massachusetts, New Hampshire, and Vermont.
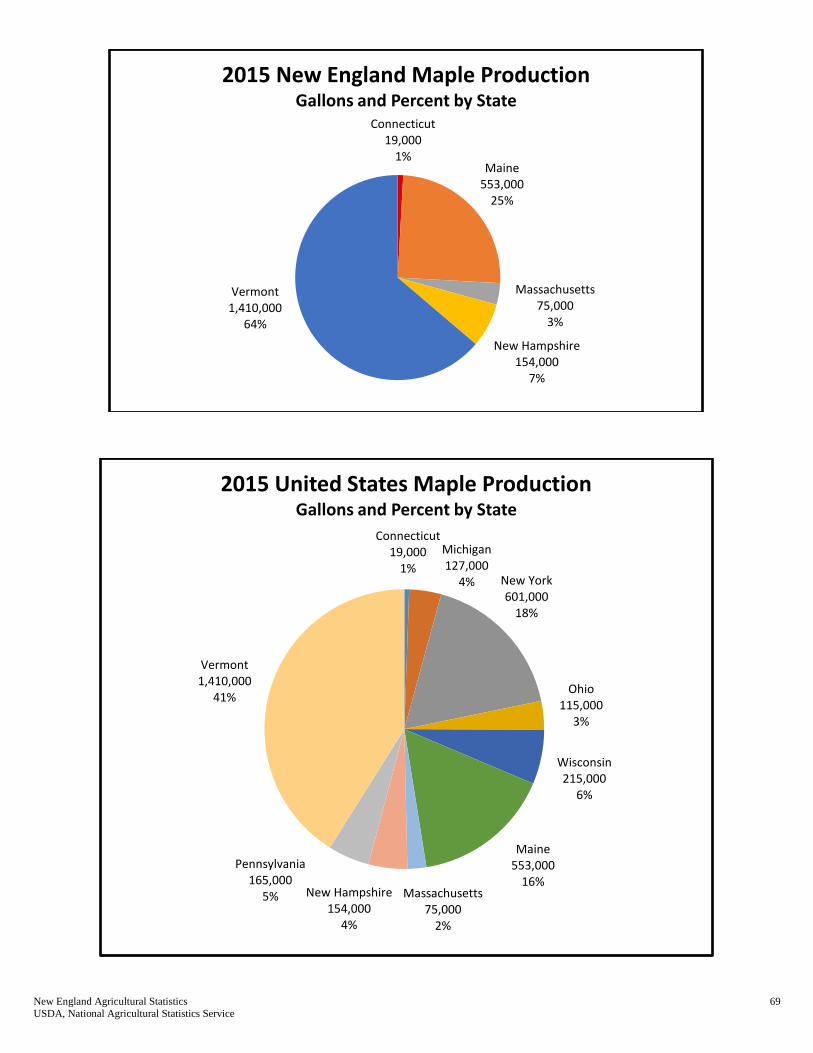
New England Agricultural Statistics 69 USDA, National Agricultural Statistics Service
Connecticut19,000
1%Maine
553,00025%
Massachusetts75,000
3%
New Hampshire154,000
7%
Vermont1,410,000
64%
2015 New England Maple ProductionGallons and Percent by State
Connecticut19,000
1%
Michigan127,000
4% New York601,000
18%
Ohio115,000
3%
Wisconsin215,000
6%
Maine553,000
16%Massachusetts
75,0002%
New Hampshire154,000
4%
Pennsylvania165,000
5%
Vermont1,410,000
41%
2015 United States Maple ProductionGallons and Percent by State

70 New England Agricultural Statistics USDA, National Agricultural Statistics Service
0
10
20
30
40
50
60
70
80
90
0
500
1,000
1,500
2,000
2,500
2006 2007 2008 2009 2010 2011 2012 2013 2014 2015
MillionDollars
ThousandGallons
Year
Maple Syrup Production and Value —New England: 2006-2015
Production Value
0
0.05
0.1
0.15
0.2
0.25
0.3
0.35
0.4
CT ME MA NH VT
Yie
ld p
er
Tap
(G
allo
ns)
State
Maple Syrup Yield per Tap —New England by State: 2013-2015
2013 2014 2015

New England Agricultural Statistics 71 USDA, National Agricultural Statistics Service
Maple Syrup Price by Type of Sales and Size of Container – Selected States: 2014-2015
Type
and
State
Gallons ½ Gallons Quarts Pints ½ Pints
2014 2015 2014 2015 2014 2015 2014 2015 2014 2015
dollars dollars dollars dollars dollars dollars dollars dollars dollars dollars
Retail
Connecticut ................
Maine .........................
Massachusetts ............
Michigan ....................
New Hampshire .........
New York ..................
Ohio ...........................
Pennsylvania ..............
Vermont .....................
Wisconsin ..................
Wholesale
Connecticut ................
Maine .........................
Massachusetts ............
Michigan ....................
New Hampshire .........
New York ..................
Ohio ...........................
Pennsylvania ..............
Vermont .....................
Wisconsin ..................
63.50
56.60
53.40
50.00
53.10
45.30
40.90
40.30
47.00
44.40
49.40
46.40
43.60
37.40
42.40
41.50
43.00
31.50
39.30
35.70
65.00
55.50
57.40
47.30
56.40
45.10
40.90
41.60
66.60
45.00
64.40
39.20
43.60
37.00
41.80
38.50
37.00
40.20
42.00
36.40
35.00
30.90
30.80
28.00
31.10
25.70
25.00
23.70
27.00
25.00
26.60
23.90
23.20
24.50
28.20
23.30
20.30
23.10
24.30
24.10
36.90
30.70
30.70
28.30
31.50
25.80
24.70
25.00
27.30
26.10
32.40
22.10
26.70
25.90
24.00
22.30
21.40
21.30
27.00
23.60
19.70
16.90
19.00
15.30
18.40
16.50
15.70
14.20
16.00
12.90
14.40
13.20
13.60
12.80
15.70
12.00
12.50
15.10
13.90
12.50
20.70
16.70
19.10
15.50
19.50
15.90
15.00
15.40
17.30
13.00
19.80
12.40
15.30
13.30
13.30
14.00
12.00
13.10
14.50
13.50
11.90
10.00
11.40
9.50
11.20
10.50
9.70
8.70
9.80
8.40
7.75
7.20
7.35
7.60
8.40
7.16
7.60
8.35
8.20
7.00
13.30
10.20
11.80
9.80
10.90
9.50
9.50
9.30
9.80
7.90
11.80
7.10
8.95
8.00
8.25
8.45
7.50
7.60
8.10
7.80
6.95
6.40
7.55
6.90
6.55
7.45
7.00
5.00
6.10
6.00
5.40
4.90
4.50
4.80
5.45
4.05
5.40
6.85
5.20
4.20
8.70
6.10
7.55
6.30
6.95
6.20
6.10
5.45
6.50
5.20
7.30
4.80
4.90
5.00
4.60
4.50
4.20
5.55
4.80
4.60
Maple Syrup Bulk Price – Selected States: 2014-2015
State Bulk, All Grades
2014 2015 2014 2015
dollars per pound dollars per pound dollars per gallon dollars per gallon
Connecticut ................
Maine .........................
Massachusetts ............
Michigan ....................
New Hampshire .........
New York ..................
Ohio ...........................
Pennsylvania ..............
Vermont .....................
Wisconsin ..................
2.65
2.72
2.95
2.40
2.55
2.54
2.60
2.49
2.59
2.40
(D)
2.40
2.70
2.70
2.40
2.40
2.40
2.24
2.45
2.30
29.40
30.00
32.30
26.30
28.30
28.00
29.00
27.50
28.50
26.20
24.10
26.40
29.50
29.30
26.40
26.30
26.40
24.70
27.00
25.20
(D) Withheld to avoid disclosing data from individual operations.

72 New England Agricultural Statistics USDA, National Agricultural Statistics Service
Maple Syrup Percent of Sales by Type – Selected States: 2014-2015
State Retail Wholesale Bulk
2014 2015 2014 2015 2014 2015
percent percent percent percent percent percent
Connecticut ..........
Maine ...................
Massachusetts ......
Michigan ..............
New Hampshire ...
New York ............
Ohio .....................
Pennsylvania ........
Vermont ...............
Wisconsin ............
64
3
40
54
57
31
38
35
11
18
51
2
20
62
64
43
44
19
10
19
29
2
28
18
17
15
16
9
6
19
48
2
62
15
12
16
24
5
9
12
7
95
32
28
26
54
46
56
83
63
1
96
18
23
24
41
32
76
81
69
Honey Number of Colonies, Yield, Production, Stocks, Price, and Value — New England: 2011-2015
(Producers with 5 or more colonies.)
State
and
Year
Honey
Producing
Colonies1
Yield
per
Colony
Production Stocks on
December 15 2
Average
Price per
Pound3
Value
of
Production4
1,000 pounds 1,000 pounds 1,000 pounds cents 1,000 dollars
Maine
2011 ..............................
2012 ..............................
2013 ..............................
2014 ..............................
2015 ..............................
Vermont
2011 ..............................
2012 ..............................
2013 ..............................
2014 ..............................
2015 ..............................
Other States5 6
2011 ..............................
2012 ..............................
2013 ..............................
2014 ..............................
2015 ..............................
United States6
2011 ..............................
2012 ..............................
2013 ..............................
2014 ..............................
2015 ..............................
4
4
7
8
10
4
4
3
3
5
25
30
33
31
30
2,491
2,539
2,640
2,740
2,660
30
34
43
47
47
43
60
51
58
52
46
46
39
45
39
59.6
56.0
56.6
65.1
58.9
120
136
301
376
470
172
240
153
174
260
1,156
1,389
1,295
1,404
1,168
148,357
142,296
149,499
178,270
156,544
17
24
27
41
47
43
53
46
61
62
211
167
186
202
371
36,761
31,829
38,160
41,192
42,203
198.00
239.00
314.00
499.00
551.00
231.00
239.00
389.00
489.00
423.00
299.00
311.00
383.00
367.00
503.00
176.50
199.20
214.10
217.30
209.00
238
325
945
1,876
2,590
397
574
595
851
1,100
3,456
4,320
4,960
5,153
5,875
261,850
283,454
320,077
387,381
327,177
1 Honey producing colonies are the maximum number of colonies from which honey was taken during the year. It is possible to take honey
from colonies which did not survive the entire year. 2 Stocks held by producers. 3 Average price per pound based on expanded sales. 4 Value of production is equal to production multiplied by average price per pound. 5 Alaska, Connecticut, Delaware, Maryland, Massachusetts, Nevada, New Hampshire, New Mexico, Oklahoma, Rhode Island, and South
Carolina not published separately to avoid disclosing data for individual operations. 6 Due to rounding, total colonies multiplied by total yield may not exactly equal production.

New England Agricultural Statistics 73 USDA, National Agricultural Statistics Service
Honey Bee Number of Colonies, Maximum, Lost, Percent Lost, Added, Renovated, and Percent Renovated —
Northeast and United States: January 1, 2016 and January-March 2016
(Producers with 5 or more colonies.)
State 1
January 1
number of
colonies
January - March
Maximum
colonies 2
Lost
colonies
Percent
lost 3
Added
colonies
Renovated
colonies 4
Percent
renovated 5
number number number percent number number percent
Connecticut .................
Maine ..........................
Maryland ....................
Massachusetts .............
New Jersey .................
New York ...................
Pennsylvania ...............
Vermont ......................
United States .............
2,700
2,200
6,500
3,000
8,500
31,000
12,500
5,500
2,594,590
2,700
3,700
6,500
3,000
8,500
31,000
12,500
5,500
(X)
270
170
1,400
370
1,000
4,000
2,900
410
428,800
10
5
22
12
12
13
23
8
17
70
-
40
120
80
140
220
-
378,160
10
-
20
330
40
1,400
340
-
158,050
(Z)
-
(Z)
11
1
5
3
-
6
- Represents zero.
(X) Not applicable.
(Z) Less than half of the unit shown. 1 Delaware, New Hampshire, and Rhode Island are not published to avoid disclosing data for individual operations. 2 January 1 number of colonies plus all colonies moved into the state during the quarter. 3 Number of colonies lost divided by maximum number of colonies, except for United States, where percentage lost is the number of lost colonies divided by
January 1 number of colonies. 4 Surviving colonies that were requeened or received new honey bees through nucs or packages. 5 Number of renovated colonies divided by maximum number of colonies, except for United States, where percent renovated is the number of renovated
colonies divided by January 1 number of colonies.
0
1,000
2,000
3,000
4,000
5,000
6,000
Connecticut Maine Massachusetts Vermont
Nu
mb
er
Honey Bee Colonies Maximum, Lost, Added, and Renovated — New England
January-March 2016
Maximum Lost Added Renovated

74 New England Agricultural Statistics USDA, National Agricultural Statistics Service
Stocks in Cold Storage, by Month – New England: 2011-2015 1
Commodity and
Year Jan Feb Mar Apr May Jun Jul Aug Sep Oct Nov Dec
1,000 pounds
American Cheese
2011 39,844 38,775 38,904 38,544 38,472 39,185 41,120 39,959 40,642 42,431 42,737 42,697
2012 41,434 41,150 41,013 40,270 38,655 39,402 38,913 37,351 36,826 36,310 35,013 37,134
2013 40,125 44,104 46,213 47,197 47,758 47,866 47,385 47,373 48,700 50,453 50,948 50,494
2014 53,156 54,600 57,951 57,695 58,946 59,852 61,092 62,866 63,593 62,938 62,082 61,196
2015 61,803 62,090 62,236 59,879 60,225 62,818 63,369 63,827 63,275 64,321 62,198 61,581
Frozen Blueberries, All
2011 17,302 14,465 11,141 8,411 4,954 3,611 3,728 11,619 18,007 20,041 13,879 13,855
2012 14,189 11,974 8,589 6,510 5,154 5,131 5,175 23,773 23,536 21,877 19,415 18,236
2013 19,021 17,575 13,663 10,696 6,825 5,040 4,368 17,415 18,928 16,850 16,702 15,740
2014 14,494 13,219 10,777 8,676 6,289 5,749 7,995 19,300 26,337 25,403 29,588 25,709
2015 22,988 20,482 18,293 16,017 15,054 16,382 23,795 31,357 41,719 36,143 34,980 34,232
All Other Frozen Fruit 2
2011 22,775 19,267 31,276 17,463 14,502 11,151 9,591 7,874 13,256 28,284 28,977 26,248
2012 24,388 21,113 16,027 11,363 14,406 7,965 6,103 4,036 5,694 28,226 20,313 18,885
2013 16,690 14,444 14,346 13,761 11,006 9,056 7,814 7,782 6,906 14,814 11,934 11,796
2014 6,906 5,308 5,215 5,255 5,374 7,066 6,194 3,977 4,928 25,850 29,291 28,344
2015 24,944 22,819 20,010 17,889 13,328 12,623 11,830 11,503 56,130 97,285 103,097 92,214
French Fries
2011 30,132 28,402 30,205 26,910 26,632 24,189 21,794 20,677 26,047 22,841 23,241 23,400
2012 25,994 23,466 26,314 35,395 32,616 37,609 33,408 20,491 30,115 31,934 23,707 21,515
2013 27,549 20,995 20,014 19,469 18,781 20,398 18,108 17,524 18,501 19,715 19,606 18,928
2014 19,269 19,632 17,928 18,538 17,928 18,554 16,664 16,934 19,057 20,282 20,785 19,363
2015 20,604 32,914 32,204 30,261 30,391 33,706 33,542 34,037 33,078 31,210 28,778 30,689
Other Potatoes
2011 5,309 5,339 5,190 5,573 4,763 5,052 5,100 4,257 3,705 4,077 4,739 3,481
2012 3,756 4,348 4,226 5,457 5,233 6,404 5,574 3,498 4,823 4,874 4,520 3,977
2013 5,389 5,218 5,197 5,284 5,494 5,605 5,279 4,569 4,949 5,487 5,471 5,183
2014 5,396 5,855 5,681 5,601 5,356 5,093 5,137 3,946 4,001 3,913 3,874 4,023
2015 4,050 1,287 1,540 1,855 1,784 1,729 1,712 1,009 1,151 1,441 1,536 1,689
1 New England includes Connecticut, Maine, Massachusetts, New Hampshire, Rhode Island, and Vermont.
2 All other frozen fruit equals frozen apple + sweet cherries + tart cherries + peaches + raspberries + strawberries + other. 2012 through 2014 revised.
Butter in Cold Storage, by Month – United States: 2011-2015
Commodity and
Year Jan Feb Mar Apr May Jun Jul Aug Sep Oct Nov Dec
1,000 pounds
Butter
2011 118,784 138,672 144,244 141,728 170,095 190,310 187,796 165,698 150,979 130,684 93,523 106,856
2012 170,348 205,172 208,253 254,184 261,586 243,235 234,352 201,135 195,819 145,098 127,282 153,027
2013 207,075 238,342 254,991 309,719 321,954 318,893 295,751 263,928 233,031 181,799 121,627 112,467
2014 143,890 171,773 191,755 186,914 209,430 199,248 180,834 172,789 152,361 147,956 107,566 104,728
2015 148,885 179,003 184,373 232,372 265,198 256,000 254,347 212,189 187,528 178,834 132,740 155,082
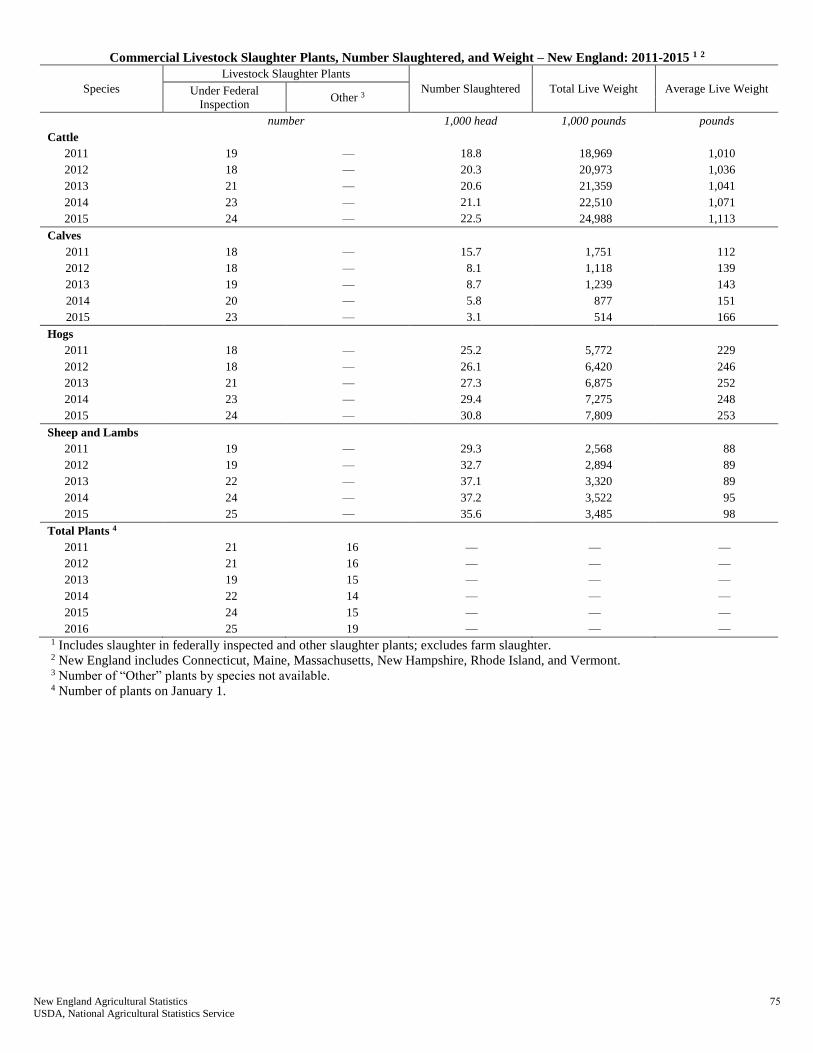
New England Agricultural Statistics 75USDA, National Agricultural Statistics Service
Commercial Livestock Slaughter Plants, Number Slaughtered, and Weight – New England: 2011-2015 1 2
Species
Livestock Slaughter Plants
Number Slaughtered Total Live Weight Average Live Weight Under Federal
Inspection Other 3
number 1,000 head 1,000 pounds pounds
Cattle
2011 19 — 18.8 18,969 1,010
2012 18 — 20.3 20,973 1,036
2013 21 — 20.6 21,359 1,041
2014 23 — 21.1 22,510 1,071
2015 24 — 22.5 24,988 1,113
Calves
2011 18 — 15.7 1,751 112
2012 18 — 8.1 1,118 139
2013 19 — 8.7 1,239 143
2014 20 — 5.8 877 151
2015 23 — 3.1 514 166
Hogs
2011 18 — 25.2 5,772 229
2012 18 — 26.1 6,420 246
2013 21 — 27.3 6,875 252
2014 23 — 29.4 7,275 248
2015 24 — 30.8 7,809 253
Sheep and Lambs
2011 19 — 29.3 2,568 88
2012 19 — 32.7 2,894 89
2013 22 — 37.1 3,320 89
2014 24 — 37.2 3,522 95
2015 25 — 35.6 3,485 98
Total Plants 4
2011 21 16 — — —
2012 21 16 — — —
2013 19 15 — — —
2014 22 14 — — —
2015 24 15 — — —
2016 25 19 — — — 1 Includes slaughter in federally inspected and other slaughter plants; excludes farm slaughter. 2 New England includes Connecticut, Maine, Massachusetts, New Hampshire, Rhode Island, and Vermont. 3 Number of “Other” plants by species not available. 4 Number of plants on January 1.

76 New England Agricultural Statistics USDA, National Agricultural Statistics Service
DIRECTORY OF NEW ENGLAND AGRICULTURAL AGENCIES
NEW ENGLAND
Northeast Marketing Area Federal Milk Order No 1 Correspondence Dept 89 South Street, Suite 301 PO Box 51478 Boston, MA 02205-1478
617-737-7199 Fax: 617-737-8002 [email protected]
New England Agricultural Statistics Service, USDA Gary R. Keough, State Statistician 53 Pleasant Street Concord, NH 03301
603-224-9639, ext. 3129 Fax: 603-225-1434 [email protected]
Risk Management Agency, USDA Jay Gallons 4405 Bland Road, Suite 160 Raleigh, NC 27609
919-875-4880 Fax: 919-875-4915 [email protected]
New England Farmers Union 176 Avenue A, Suite 2 Turners Falls, MA 01376
413.863.5199 Fax: 413.863.5287 newenglandfarmersunion.org
USDA/APHIS/VS Thomas S. McKenna Assistant Director 160 Worcester-Providence Road Sutton Square Plaza, Suite 20 Sutton, MA 01590-9998
508-363-2290 Fax: 508-363-2272 [email protected]
CONNECTICUT
Department of Agriculture CT Steven K. Reviczky Commissioner 165 Capitol Avenue Hartford, CT 06106
860-713-2500 Fax: 860-713-2514 [email protected]
Dr. Mary Lis State Veterinarian Bureau of Regulation and Inspection 165 Capitol Avenue, Room G-8A Hartford, CT 06106
860-713-2505 Fax: 860-713-2515 [email protected]
University of Connecticut Cooperative Extension, CT
State Office Gregory Weidemann Dean & Director W. B. Young Building, Room 218 1376 Storrs Road, Unit 4066 Storrs, CT 06269-4066
860-486-2917 Fax: 860-486-5113 [email protected]
Roger Adams, Jr. Associate Director W. B. Young Building, Room 232 1376 Storrs Road, Unit 4036 Storrs, CT 06269-4036
860-486-3581 Fax: 860-486-4128 [email protected]
Home and Garden Education Center Ratcliffe Hicks Building, Room 4 1380 Storrs Road, Unit 4115 Storrs, CT 06269-4115
860-486-6271 Fax: 860-486-6338 [email protected]
University of Connecticut Cooperative Extension, CT County Offices
Fairfield County Extension Center 67 Stony Hill Road Bethel, CT 06801-3056
203-207-8440 Fax: 203-207-3273 [email protected]
Hartford County Extension Center 1800 Asylum Avenue West Hartford, CT 06117-2600
203-207-8440 Fax: 203-207-3273 [email protected]
Litchfield County Extension Center 843 University Drive Torrington, CT 06790-2635
860-570-9010 Fax: 860-570-9008 [email protected]
Middlesex County Extension Center 1066 Saybrook Road, PO Box 70 Haddam, CT 06438-0070
860-626-6240 Fax: 860-626-6897 [email protected]
New Haven County Extension Center 305 Skiff Street North Haven, CT 06473-4451
203-407-3161 Fax: 203-407-3176 [email protected]
New London County Extension 562 New London Turnpike Norwich, CT 06360-6599
860-887-1608 Fax: 860-886-1164 [email protected]
Tolland County Extension Center 24 Hyde Avenue Vernon, CT 06066-4599
860-875-3331 Fax: 860-875-0220 [email protected]
Windham County Extension Center 139 Wolf Den Road Brooklyn, CT 06234-1729
860-774-9600 Fax: 860-774-9480 [email protected]
Farm Bureau Association CT Don Tuller President 775 Bloomfield Avenue Windsor, CT 06095-2322
860-768-1100 Fax: 860-768-1108 [email protected]
Henry Talmage Executive Director 775 Bloomfield Avenue Windsor, CT 06095-2322
860-768-1101 Fax: 860-768-1108 [email protected]
Farm Service Agency (FSA), CT State Office
Connecticut FSA State Office Bryan Hurlburt State Executive Director 344 Merrow Road, Suite B Tolland, CT 06084-3917
860-817-4090 Fax: 860-871-4184 [email protected]
Farm Service Agency (FSA), CT
County Offices Fairfield County FSA Aimee Fusco County Executive Director 1185 New Litchfield Street Torrington, CT 06790-6017
860-626-8852 Fax: 860-626-8250 [email protected]
Hartford County FSA Martha Dorsey County Executive Director 100 Northfield Drive, 4th Floor Windsor, CT 06095-4730
860-688-7725 Fax: 860-688-0083 [email protected]
Litchfield County FSA Aimee Fusco County Executive Director 1185 New Litchfield Street Torrington, CT 06790-6017
860-626-8852 Fax: 860-626-8250 [email protected]
Middlesex County FSA Debora G. Castle County Executive Director 97 Barnes Road Wallingford, CT 06492-1885
203-269-6665 Fax: 203-294-9741 [email protected]
New Haven County FSA Debora G. Castle County Executive Director 97 Barnes Road Wallingford, CT 06492-1885
203-269-6665 Fax: 203-294-9741 [email protected]
New London County FSA Sarah Woodward County Executive Director 238 West Town Street Norwich, CT 06360-2111
860-887-9941 Fax: 860-887-4082 [email protected]
Tolland County FSA Martha Dorsey County Executive Director 100 Northfield Drive, 4th Floor Windsor, CT 06095-4730
860-688-7725 Fax: 860-688-0083 [email protected]
Windham County FSA Dawn Pindell County Executive Director 139 Wolf Den Road Brooklyn, CT 06234-1729
860-774-8397 Fax: 860-779-0148 [email protected]
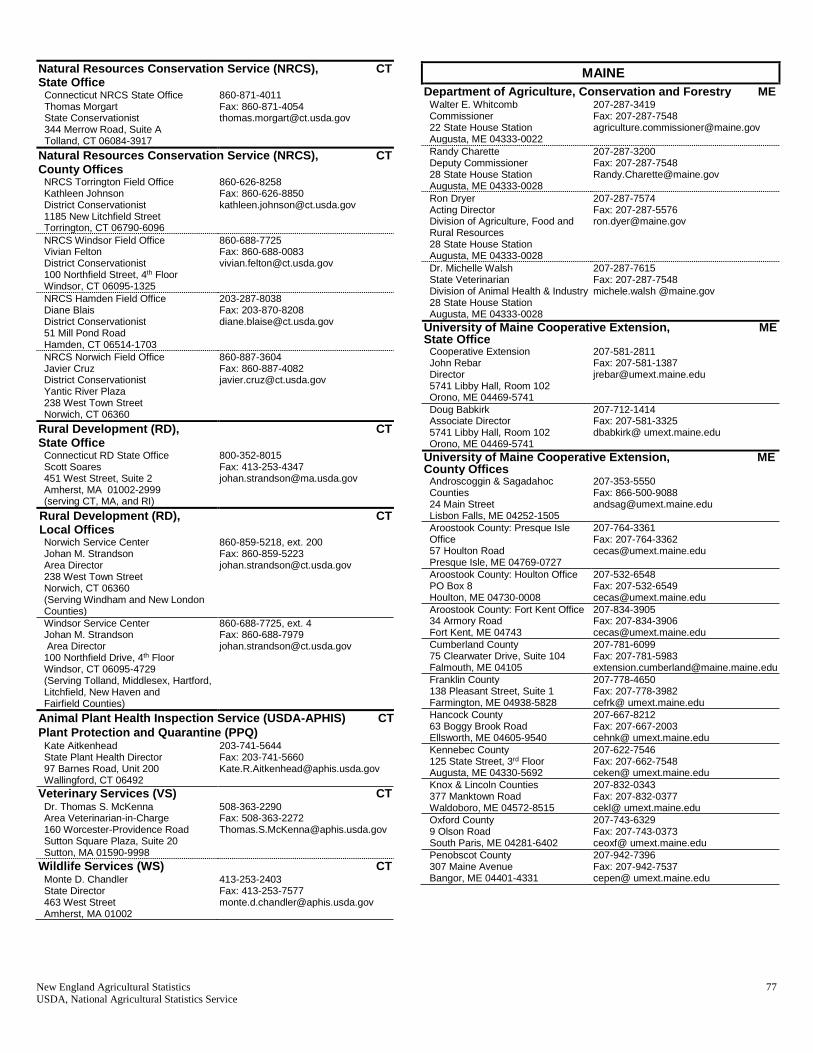
New England Agricultural Statistics 77 USDA, National Agricultural Statistics Service
Natural Resources Conservation Service (NRCS), CT
State Office Connecticut NRCS State Office Thomas Morgart State Conservationist 344 Merrow Road, Suite A Tolland, CT 06084-3917
860-871-4011 Fax: 860-871-4054 [email protected]
Natural Resources Conservation Service (NRCS), CT County Offices
NRCS Torrington Field Office Kathleen Johnson District Conservationist 1185 New Litchfield Street Torrington, CT 06790-6096
860-626-8258 Fax: 860-626-8850 [email protected]
NRCS Windsor Field Office Vivian Felton District Conservationist 100 Northfield Street, 4th Floor Windsor, CT 06095-1325
860-688-7725 Fax: 860-688-0083 [email protected]
NRCS Hamden Field Office Diane Blais District Conservationist 51 Mill Pond Road Hamden, CT 06514-1703
203-287-8038 Fax: 203-870-8208 [email protected]
NRCS Norwich Field Office Javier Cruz District Conservationist Yantic River Plaza 238 West Town Street Norwich, CT 06360
860-887-3604 Fax: 860-887-4082 [email protected]
Rural Development (RD), State Office
CT
Connecticut RD State Office Scott Soares 451 West Street, Suite 2 Amherst, MA 01002-2999 (serving CT, MA, and RI)
800-352-8015 Fax: 413-253-4347 [email protected]
Rural Development (RD), Local Offices
CT
Norwich Service Center Johan M. Strandson Area Director 238 West Town Street Norwich, CT 06360 (Serving Windham and New London Counties)
860-859-5218, ext. 200 Fax: 860-859-5223 [email protected]
Windsor Service Center Johan M. Strandson Area Director 100 Northfield Drive, 4th Floor Windsor, CT 06095-4729 (Serving Tolland, Middlesex, Hartford, Litchfield, New Haven and Fairfield Counties)
860-688-7725, ext. 4 Fax: 860-688-7979 [email protected]
Animal Plant Health Inspection Service (USDA-APHIS) CT
Plant Protection and Quarantine (PPQ) Kate Aitkenhead State Plant Health Director 97 Barnes Road, Unit 200 Wallingford, CT 06492
203-741-5644 Fax: 203-741-5660 [email protected]
Veterinary Services (VS) CT
Dr. Thomas S. McKenna Area Veterinarian-in-Charge 160 Worcester-Providence Road Sutton Square Plaza, Suite 20 Sutton, MA 01590-9998
508-363-2290 Fax: 508-363-2272 [email protected]
Wildlife Services (WS) CT
Monte D. Chandler State Director 463 West Street Amherst, MA 01002
413-253-2403 Fax: 413-253-7577 [email protected]
MAINE
Department of Agriculture, Conservation and Forestry ME
Walter E. Whitcomb Commissioner 22 State House Station Augusta, ME 04333-0022
207-287-3419 Fax: 207-287-7548 [email protected]
Randy Charette Deputy Commissioner 28 State House Station Augusta, ME 04333-0028
207-287-3200 Fax: 207-287-7548 [email protected]
Ron Dryer Acting Director Division of Agriculture, Food and Rural Resources 28 State House Station Augusta, ME 04333-0028
207-287-7574 Fax: 207-287-5576 [email protected]
Dr. Michelle Walsh State Veterinarian Division of Animal Health & Industry 28 State House Station Augusta, ME 04333-0028
207-287-7615 Fax: 207-287-7548 michele.walsh @maine.gov
University of Maine Cooperative Extension, ME State Office
Cooperative Extension John Rebar Director 5741 Libby Hall, Room 102 Orono, ME 04469-5741
207-581-2811 Fax: 207-581-1387 [email protected]
Doug Babkirk Associate Director 5741 Libby Hall, Room 102 Orono, ME 04469-5741
207-712-1414 Fax: 207-581-3325 dbabkirk@ umext.maine.edu
University of Maine Cooperative Extension, ME County Offices
Androscoggin & Sagadahoc Counties 24 Main Street Lisbon Falls, ME 04252-1505
207-353-5550 Fax: 866-500-9088 [email protected]
Aroostook County: Presque Isle Office 57 Houlton Road Presque Isle, ME 04769-0727
207-764-3361 Fax: 207-764-3362 [email protected]
Aroostook County: Houlton Office PO Box 8 Houlton, ME 04730-0008
207-532-6548 Fax: 207-532-6549 [email protected]
Aroostook County: Fort Kent Office 34 Armory Road Fort Kent, ME 04743
207-834-3905 Fax: 207-834-3906 [email protected]
Cumberland County 75 Clearwater Drive, Suite 104 Falmouth, ME 04105
207-781-6099 Fax: 207-781-5983 [email protected]
Franklin County 138 Pleasant Street, Suite 1 Farmington, ME 04938-5828
207-778-4650 Fax: 207-778-3982 cefrk@ umext.maine.edu
Hancock County 63 Boggy Brook Road Ellsworth, ME 04605-9540
207-667-8212 Fax: 207-667-2003 cehnk@ umext.maine.edu
Kennebec County 125 State Street, 3rd Floor Augusta, ME 04330-5692
207-622-7546 Fax: 207-662-7548 ceken@ umext.maine.edu
Knox & Lincoln Counties 377 Manktown Road Waldoboro, ME 04572-8515
207-832-0343 Fax: 207-832-0377 cekl@ umext.maine.edu
Oxford County 9 Olson Road South Paris, ME 04281-6402
207-743-6329 Fax: 207-743-0373 ceoxf@ umext.maine.edu
Penobscot County 307 Maine Avenue Bangor, ME 04401-4331
207-942-7396 Fax: 207-942-7537 cepen@ umext.maine.edu

78 New England Agricultural Statistics USDA, National Agricultural Statistics Service
Piscataquis County Court House Complex 165 East Main Street Dover-Foxcroft, ME 04426-1396
207-564-3301 Fax: 207-564-3302 cepsq@ umext.maine.edu
Somerset County 7 County Drive Skowhegan, ME 04976-4209
207-474-9622 Fax: 207-474-0374 cesom@ umext.maine.edu
Waldo County 992 Waterville Road Waldo, ME 04915-3117
207-342-5971 Fax: 207-342-4229 cewal@ umext.maine.edu
Washington County 28 Center Street Machias, ME 04654
207-255-3345 Fax: 207-255-6118 cewsh@ umext.maine.edu
York County 21 Bradeen Street, Suite 302 Springvale, ME 04083
207-324-2814 Fax: 207-324-0817 ceyrk@ umext.maine.edu
Farm Bureau ME David Doak President PO Box 665 Monroe, ME 04951-0665
207-525-4431 Fax: 207-483-2876 [email protected]
Alicyn Smart Executive Director 4 Gabriel Drive, Suite 1 Augusta, ME 04330
207-622-4111 Cell: 207-530-7052 Fax: 207-623-3371 [email protected]
Farm Service Agency (FSA), State Office
ME
Maine FSA State Office Donovan E. Todd, III State Executive Director 967 Illinois Avenue, Suite 2 Bangor, ME 04401-2700
207-990-9100, ext. 2 Fax: 207-990-9169 [email protected]
Farm Service Agency (FSA), County Offices
ME
Androscoggin/Sagadahoc County FSA Marcia Hall County Executive Director 254 Goddard Road PO Box 1938 Lewiston, ME 04240-1002
207-753-9400, ext. 2 Fax: 207-783-4101 [email protected]
Aroostook County FSA Doreen Conlogue County Executive Director 139 Market Street, Suite 104 Fort Kent, ME 04743-1425
207-834-3831, ext. 2 Fax: 207-834-6435 [email protected]
Aroostook County FSA Doreen Conlogue County Executive Director 304 North Street Houlton, ME 04730-9527
207-532-9407, ext. 2 Fax: 207-532-4379 [email protected]
Aroostook County FSA Doreen Conlogue County Executive Director 735 Main Street Presque Isle, ME 04769-2253
207-764-4151, ext. 2 Fax: 207-764-5289 [email protected]
Cumberland/York County FSA Sandy Truslow County Executive Director 306 U.S. Route 1, Suite A2 Scarborough, ME 04074-9774
207-883-0159, ext. 2 Fax: 207-883-1139 [email protected]
Franklin County FSA Gary Raymond County Executive Director 107 Park Street Farmington, ME 04938-5831
207-778-2788, ext. 2 Fax: 207-778-5785 [email protected]
Hancock County FSA Valerie Porter County Executive Director 1423 Broadway, Suite 1 Bangor, ME 04401-3550
207-947-3555, ext. 2 Fax: 207-990-0819 [email protected]
Kennebec/Knox/Lincoln County Maria Granger County Executive Director 21 Enterprise Drive Augusta, ME 04330-6397
207-622-7847, ext. 2 Fax: 207-622-8196 [email protected]
Oxford County FSA Marcia Hall County Executive Director 17 Olson Road South Paris, ME 04281
207-743-5789, ext. 2 Fax: 207-743-6256 [email protected]
Penobscot County FSA Valerie Porter County Executive Director 1423 Broadway, Suite 1 Bangor, ME 04401-3550
207-947-3555, ext. 2 Fax: 207-990-0819 [email protected]
Piscataquis County FSA Scott Speck County Executive Director 42 Engdahl Drive Dover-Foxcroft, ME 04426
207-564-2151, ext. 2 Fax: 207-564-2570 [email protected]
Somerset County FSA Scott Speck County Executive Director 12 High Street Skowhegan, ME 04976-1898
207-474-8323, ext. 2 Fax: 207-474-0638 [email protected]
Waldo County FSA Maria Granger County Executive Director 266 Waterville Road Belfast, ME 04915-9804
207-338-1964, ext. 2 Fax: 207-338-4972 [email protected]
Washington County FSA Valerie Porter County Executive Director 89 Court Street Machias, ME 04654-1144
207-255-3612, ext. 2 Fax: 207-255-6817 [email protected]
Natural Resources Conservation Service (NRCS), ME State Office
Maine NRCS State Office Juan Hernandez State Conservationist 967 Illinois Avenue, Suite # 3 Bangor, ME 04401
207-990-9100, ext. 3 Fax: 207-990-9599 [email protected]
Natural Resources Conservation Service (NRCS), ME County Offices
Androscoggin/Sagadahoc Cnty NRCS Jim Johnson District Conservationist 254 Goddard Road Lewiston, ME 04240
207-753-9400 Fax: 207-783-4101 [email protected]
Aroostook County NRCS - Central Darol Wilson District Conservationist 735 Main Street, Suite 3 Presque Isle, ME 04769
207-764-4153 Fax: 207-768-340 [email protected]
Aroostook County NRCS - Northern
Eugene “Skip” Babineau District Conservationist 139 Market Street, Suite 106 Fort Kent, ME 04743-1425
207-834-3311 Fax: 207-834-6435 [email protected]
Aroostook County NRCS - Southern Helena Swiatek District Conservationist 304 North Street Houlton, ME 04730-9527
207-532-2087 Fax: 207-532-4379 [email protected]
Cumberland/York County NRCS Wayne Munroe District Conservationist 306 U.S. Route 1, Suite A1 Scarborough, ME 04074-9774
207-883-0159 Fax: 207-883-1139 [email protected]
Franklin County NRCS Paul Hersey District Conservationist 107 Park Street Farmington, ME 04938-1915
207-778-4767 Fax: 207-778-5785 [email protected]

New England Agricultural Statistics 79 USDA, National Agricultural Statistics Service
Hancock County NRCS Roland Dupuis District Conservationist 1423 Broadway Suite 4 Bangor, ME 04401
207-947-6622 ext. 5 Fax: 207-942-0574 [email protected]
Kennebec/Lincoln County NRCS Autumn Birt Supervisory District Conservationist 21 Enterprise Drive, Suite 1 Augusta, ME 04330-6397
207-622-7847, ext. 3 Fax: 207-626-8196 [email protected]
Oxford County NRCS Anna Donahue Supervisory District Conservationist 17 Olson Road, Suite 2 Oxford, ME 04270-3390
207-743-5789 Fax: 207-743-6256 [email protected]
Penobscot County NRCS Daniel Schmidt District Conservationist 1423 Broadway, Suite 2 Bangor, ME 04401
207-947-6622 Fax: 207-942-1782 [email protected]
Piscataquis County NRCS David Power District Conservationist 42 Engdahl Drive Dover-Foxcroft, ME 04426-3717
207-564-2321 Fax: 207-564-2570 [email protected]
Somerset County NRCS Kevin White District Conservationist 12 High Street, Suite 3 Skowhegan, ME 04976-1998
207-474-8324 Fax: 207-474-0638 [email protected]
Waldo County NRCS Maria Granger Supervisory District Conservationist 266 Waterville Road Belfast, ME 04915-1224
207-338-1964 ext. 2 Fax: 207-338-4972 [email protected]
Washington County NRCS David Garcelon District Conservationist 8 M & M Place, Suite 5B Machias, ME 04654-0121
207-255-3995 Fax: 207-255-0936 [email protected]
Rural Development (RD), State Office
ME
Maine RD State Office Virginia A. Manuel State Director 967 Illinois Avenue, Suite 4 Bangor, ME 04402-0405
207-990-9160 Fax: 207-990-9165 [email protected]
Rural Development (RD), Local Offices
ME
Bangor Area Office Raymond S. Roberts, III Area Director 1423 Broadway, Suite 3 Bangor, ME 04401
207-990-3676 Fax: 207-990-5092 [email protected]
Lewiston Area Office Orman Whitcomb Area Director 254 Goddard Road Lewiston, ME 04240
207-753-9400 Fax: 207-784-1335 [email protected]
Presque Isle Area Office Thomas R. Stevens Area Director 735 Main Street, Suite 1 Presque Isle, ME 04769-2285
207-764-4157 Fax: 207-762-2246 [email protected]
Scarborough Area Office William F. Bailey, Jr. Area Director 306 U.S. Route 1, Suite B1 Scarborough, ME 04074-9774
207-883-0159 Fax: 207-883-2740 [email protected]
Animal Plant Health Inspection Service (USDA-APHIS) ME
Plant Protection Quarantine (PPQ) Terry L. Bourgoin State Plant Health Director 15 Iron Road, Suite 1 Hermon, ME 04401
207-848-5199 Fax: 207-848-2537 [email protected]
Houlton (Customs) Dr. Patrick K. Coville 27 Customs Loop Houlton, ME 04730
207-532-6099 Fax: 207-532-7859 [email protected]
Veterinary Services (VS) ME
Dr. Thomas S. McKenna Area Veterinarian-in-Charge 160 Worcester-Providence Road Sutton Square Plaza, Suite 20 Sutton, MA 01590-9998
508-363-2290 Fax: 508-363-2272 [email protected]
Wildlife Services (WS) ME John Forbes, State Director Capital West Business Center 79 Leighton Road, Suite 12 Augusta, ME 04330
207-622-8263 Fax: 207-622-5760 [email protected]
MASSACHUSETTS
Department of Agricultural Resources MA
John Lebeaux Commissioner 251 Causeway Street, Suite 500 Boston, MA 02114-2151
617-626-1701 Fax: 617-626-1850 [email protected]
Dorrie Pizzella Chief of Staff 251 Causeway Street, Suite 500 Boston, MA 02114-2151
617-626-1703 Fax: 617-626-1850 [email protected]
Dr. Lorraine O'Connor State Veterinarian 251 Causeway Street, Suite 500 Boston, MA 02114-2151
617-626-1791 Fax: 617-626-1850 [email protected]
University of Massachusetts Cooperative Extension, MA State Office
Patricia J. Vittum Interim Director 319 Stockbridge Hall University of Massachusetts 80 Campus Center Amherst, MA 01003-9246
413-545-4800 Fax: 413-545-6555 [email protected]
Robert Schrader Associate Director 316 Stockbridge Hall University of Massachusetts 80 Campus Center Amherst, MA 01003-9246
413-545-0143 Fax: 413-545-6555 [email protected]
Joseph Shoenfield Associate Director 322 Stockbridge Hall University of Massachusetts 80 Campus Center Amherst, MA 01003-9246
413-545-5309 Fax: 413-545-6555 [email protected]
Kathleen Carroll Agricultural Outreach Director Stockbridge School of Agriculture 104 French Hall 230 Stockbridge Road Amherst, MA 01033-9316
413-545-0895 Fax: 413-577-1620 [email protected]
University of Massachusetts Cooperative Extension, MA County Offices
Cape Cod Cooperative Extension William F. Clark, Director Agriculture & Landscape Program PO Box 367 Barnstable, MA 02630-0367
508-375-6690 Fax: 508-362-4518 [email protected]
Cranberry Station Carolyn DeMoranville, Director PO Box 569 One State Bog Road East Wareham, MA 02538-0569
508-295-2212 Fax: 508-295-6387 [email protected]
Plymouth County Cooperative Extension Deborah Swanson Box 658, High Street Hanson, MA 02341-0658
781-293-3541 Fax: 781-293-3916 [email protected]
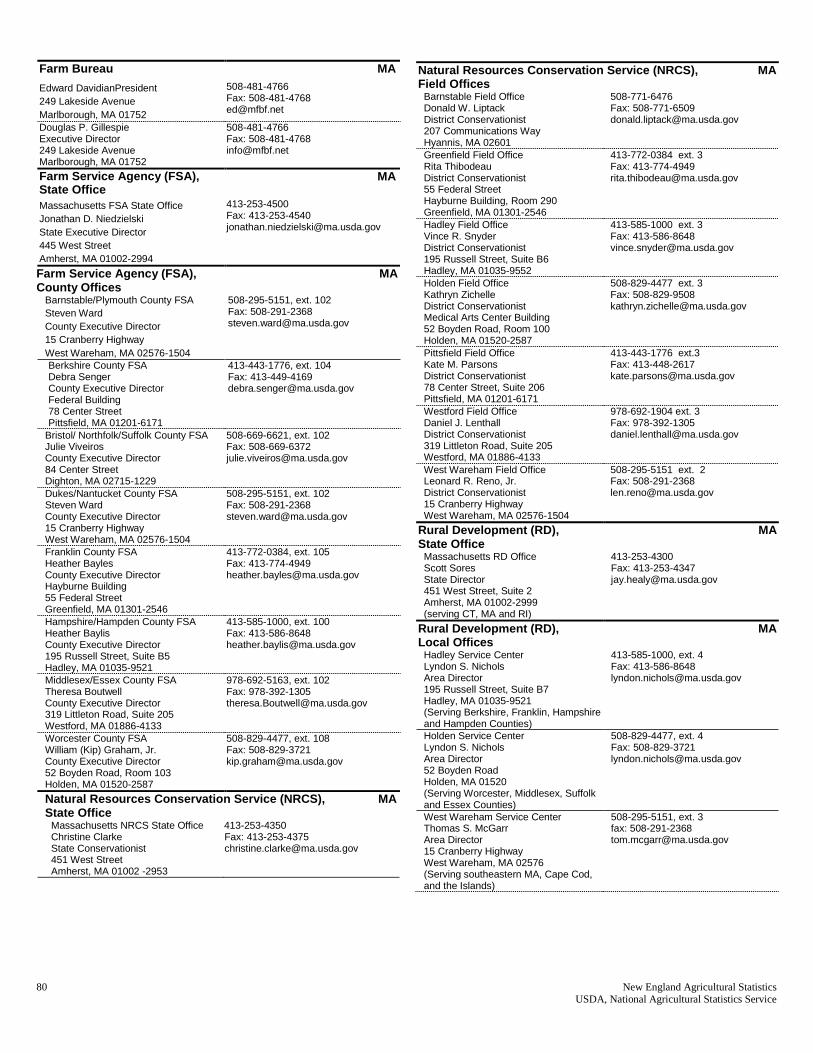
80 New England Agricultural Statistics USDA, National Agricultural Statistics Service
Farm Bureau MA
Edward DavidianPresident
249 Lakeside Avenue
Marlborough, MA 01752
508-481-4766 Fax: 508-481-4768 [email protected]
Douglas P. Gillespie Executive Director 249 Lakeside Avenue Marlborough, MA 01752
508-481-4766 Fax: 508-481-4768 [email protected]
Farm Service Agency (FSA), State Office
MA
Massachusetts FSA State Office
Jonathan D. Niedzielski
State Executive Director
445 West Street
Amherst, MA 01002-2994
413-253-4500 Fax: 413-253-4540 [email protected]
Farm Service Agency (FSA), County Offices
MA
Barnstable/Plymouth County FSA
Steven Ward
County Executive Director
15 Cranberry Highway
West Wareham, MA 02576-1504
508-295-5151, ext. 102 Fax: 508-291-2368 [email protected]
Berkshire County FSA Debra Senger County Executive Director Federal Building 78 Center Street Pittsfield, MA 01201-6171
413-443-1776, ext. 104 Fax: 413-449-4169 [email protected]
Bristol/ Northfolk/Suffolk County FSA Julie Viveiros County Executive Director 84 Center Street Dighton, MA 02715-1229
508-669-6621, ext. 102 Fax: 508-669-6372 [email protected]
Dukes/Nantucket County FSA Steven Ward County Executive Director 15 Cranberry Highway West Wareham, MA 02576-1504
508-295-5151, ext. 102 Fax: 508-291-2368 [email protected]
Franklin County FSA Heather Bayles County Executive Director Hayburne Building 55 Federal Street Greenfield, MA 01301-2546
413-772-0384, ext. 105 Fax: 413-774-4949 [email protected]
Hampshire/Hampden County FSA Heather Baylis County Executive Director 195 Russell Street, Suite B5 Hadley, MA 01035-9521
413-585-1000, ext. 100 Fax: 413-586-8648 [email protected]
Middlesex/Essex County FSA Theresa Boutwell County Executive Director 319 Littleton Road, Suite 205 Westford, MA 01886-4133
978-692-5163, ext. 102 Fax: 978-392-1305 [email protected]
Worcester County FSA William (Kip) Graham, Jr. County Executive Director 52 Boyden Road, Room 103 Holden, MA 01520-2587
508-829-4477, ext. 108 Fax: 508-829-3721 [email protected]
Natural Resources Conservation Service (NRCS), MA State Office
Massachusetts NRCS State Office Christine Clarke State Conservationist 451 West Street Amherst, MA 01002 -2953
4413-253-4350 Fax: 413-253-4375 [email protected]
Natural Resources Conservation Service (NRCS), MA Field Offices
Barnstable Field Office Donald W. Liptack District Conservationist 207 Communications Way Hyannis, MA 02601
508-771-6476 Fax: 508-771-6509 [email protected]
Greenfield Field Office Rita Thibodeau District Conservationist 55 Federal Street Hayburne Building, Room 290 Greenfield, MA 01301-2546
413-772-0384 ext. 3 Fax: 413-774-4949 [email protected]
Hadley Field Office Vince R. Snyder District Conservationist 195 Russell Street, Suite B6 Hadley, MA 01035-9552
413-585-1000 ext. 3 Fax: 413-586-8648 [email protected]
Holden Field Office Kathryn Zichelle District Conservationist Medical Arts Center Building 52 Boyden Road, Room 100 Holden, MA 01520-2587
508-829-4477 ext. 3 Fax: 508-829-9508 [email protected]
Pittsfield Field Office Kate M. Parsons District Conservationist 78 Center Street, Suite 206 Pittsfield, MA 01201-6171
413-443-1776 ext.3 Fax: 413-448-2617 [email protected]
Westford Field Office Daniel J. Lenthall District Conservationist 319 Littleton Road, Suite 205 Westford, MA 01886-4133
978-692-1904 ext. 3 Fax: 978-392-1305 [email protected]
West Wareham Field Office Leonard R. Reno, Jr. District Conservationist 15 Cranberry Highway West Wareham, MA 02576-1504
508-295-5151 ext. 2 Fax: 508-291-2368 [email protected]
Rural Development (RD), State Office
MA
Massachusetts RD Office Scott Sores State Director 451 West Street, Suite 2 Amherst, MA 01002-2999 (serving CT, MA and RI)
413-253-4300 Fax: 413-253-4347 [email protected]
Rural Development (RD), Local Offices
MA
Hadley Service Center Lyndon S. Nichols Area Director 195 Russell Street, Suite B7 Hadley, MA 01035-9521 (Serving Berkshire, Franklin, Hampshire and Hampden Counties)
413-585-1000, ext. 4 Fax: 413-586-8648 [email protected]
Holden Service Center Lyndon S. Nichols Area Director 52 Boyden Road Holden, MA 01520 (Serving Worcester, Middlesex, Suffolk and Essex Counties)
508-829-4477, ext. 4 Fax: 508-829-3721 [email protected]
West Wareham Service Center Thomas S. McGarr Area Director 15 Cranberry Highway West Wareham, MA 02576 (Serving southeastern MA, Cape Cod, and the Islands)
508-295-5151, ext. 3 fax: 508-291-2368 [email protected]

New England Agricultural Statistics 81 USDA, National Agricultural Statistics Service
Animal Plant Health Inspection Service (USDA-APHIS) MA
Plant Protection and Quarantine (PPQ) Kate Aitkenhead State Plant Health Director 10 Causeway Street Thomas P. O’Neill Building, Suite 518 Boston, MA 02222-1088
203-741-5644 Fax: 617-565-6933 [email protected]
Veterinary Services (VS) MA Dr. William G. Smith Area Veterinarian-in-Charge 160 Worcester-Providence Road Sutton Square Plaza, Suite 20 Sutton, MA 01590-9998
508-363-2290 Fax: 508-363-2272 [email protected]
Wildlife Services (WS) MA Monte D. Chandler State Director 463 West Street Amherst, MA 01002
413-253-2403 Fax: 413-253-7577 [email protected]
NEW HAMPSHIRE
Department of Agriculture, Markets and Food NH
Lorraine S. Merrill Commissioner PO Box 2042 25 Capitol Street, 2nd Floor, Room 220 Concord, NH 03302-2042
603-271-3551 Fax: 603-271-1109 [email protected]
Gail McWilliam Jellie Director of Agricultural Development PO Box 2042 25 Capitol Street, 2nd Floor, Room 220 Concord, NH 03302-2042
603-271-3788 Fax: 603-271-1109 [email protected]
Dr. Stephen K. Crawford State Veterinarian Division of Animal Industry PO Box 2042 25 Capitol Street, 2nd Floor, Room 220 Concord, NH 03302-2042
603-271-2404 Fax: 603-271-1109 [email protected]
University of New Hampshire Cooperative Extension, NH State Office
Kenneth J. La Valley Dean and Director 103A Taylor Hall 59 College Road Durham, NH 03824-3587
603-862-1520 Fax: 603-862-1585 [email protected]
Darrel Covell Assistant to the Dean & Director 103 Taylor Hall 59 College Road Durham, NH 03824-3587
603-862-3397 Fax: 603-862-1585 [email protected]
University of New Hampshire Cooperative Extension, NH County Offices
Belknap County Extension 36 County Drive Laconia, NH 03246-2900
603-527-5475 Fax: 603-527-5477 [email protected]
Carroll County Extension 73 Main Street PO Box 1480 Conway, NH 03818-1480
603-447-3834 Fax: 603-447-5192 [email protected]
Cheshire County Extension 800 Park Avenue Keene, NH 03431-1513
603-352-4550 Fax: 603-358-0494 [email protected]
Coos County Extension 629A Main Street Lancaster, NH 03584-3612
603-788-4961 Fax: 603-788-3629 [email protected]
Grafton County Extension 3855 Dartmouth College Hwy, Box 5 North Haverhill, NH 03774-4909
603-787-6944 Fax: 603-787-2009 [email protected]
Hillsborough County Extension 329 Mast Road, Suite 101 Goffstown, NH 03045-2422
603-641-6060 Fax: 603-645-5252 [email protected]
Merrimack County Extension 315 Daniel Webster Highway Boscawen, NH 03303-2410
603-796-2151 Fax: 603-796-2271 [email protected]
Rockingham County Extension 113 North Road Brentwood, NH 03833-6623
603-679-5616 Fax: 603-679-8070 [email protected]
Strafford County Extension 268 County Farm Road Dover, NH 03820-6003
603-749-4445 Fax: 603-743-3431 [email protected]
Sullivan County Extension 24 Main Street Newport, NH 03773-1515
603-863-9200 Fax: 603-863-4730 [email protected]
Farm Bureau NH Dennis Ward President 295 Sheep Davis Road Concord, NH 03301
603-224-1934 Fax: 603-228-8432 [email protected]
Robert Johnson Executive Director 295 Sheep Davis Road Concord, NH 03301
603-224-1934 Fax: 603-228-8432 [email protected]
Farm Service Agency (FSA), State Office
NH
New Hampshire FSA State Office Bruce R. Cilley, Sr. State Executive Director 53 Pleasant Street, Room 1601 Concord, NH 03301-4987
603-224-7941 Fax: 603-225-1410 [email protected]
Farm Service Agency (FSA), County Offices
NH
Belknap County FSA Donna Juneau County Executive Director 10 Ferry Street, Unit 22 Concord, NH 03301-5081
603-223-6003 Fax: 603-223-6030 [email protected]
Carroll County FSA Patty Matte County Executive Director 4 Mayberry Lane Lancaster, NH 03584-3616
603-788-4602, ext. 2 Fax: 603-788-2538 [email protected]
Cheshire County FSA Jennifer Gehly County Executive Director 11 Industrial Park Drive Walpole, NH 03608-9744
603-756-2970, ext. 112 Fax: 603-756-2978 [email protected]
Coos County FSA Patty Matte County Executive Director 4 Mayberry Lane Lancaster, NH 03584-3616
603-788-4602, ext. 2 Fax: 603-788-2538 [email protected]
Grafton County FSA Steven Schmidt County Executive Director 19 Archertown Road, Suite 1 Orford, NH 03777
603-353-4650, ext. 2 Fax: 603-353-4674 [email protected]
Hillsborough County FSA Donna Juneau County Executive Director 10 Ferry Street, Unit 22 Concord, NH 03301-5081
603-223-6003 Fax: 603-223-6030 [email protected]
Merrimack County FSA Donna Juneau County Executive Director 10 Ferry Street, Unit 22 Concord, NH 03301-5081
603-223-6003 Fax: 603-223-6030 [email protected]
Rockingham\Strafford County FSA Carol Sargent County Executive Director Knightly Plaza 629 Calef Highway, Suite 203 Epping, NH 03042-2326
603-679-4656 Fax: 603-679-4658 [email protected]
Sullivan County FSA Jennifer Gehly County Executive Director 11 Industrial Park Drive Walpole, NH 03608-9744
603-756-2970, ext. 112 Fax: 603-756-2978 [email protected]

82 New England Agricultural Statistics USDA, National Agricultural Statistics Service
Natural Resources Conservation Service (NRCS), NH State Office
New Hampshire NRCS State Office Richard P. Ellsmore State Conservationist Federal Building 2 Madbury Road Durham, NH 03824-2043
603-868-7581 Fax: 603-868-5301 [email protected]
Natural Resources Conservation Service (NRCS), NH Field Service Centers
Conway Field Service Center Nels Liljedahl District Conservationist 73 Main Street PO Box 533 Conway, NH 03818-0533
603-447-2771 Fax: 603-447-8945 [email protected]
Concord Field Service Center Chad Cochrane District Conservationist 10 Ferry Street, Box 312, Box 211 Concord, NH 03301-5081
603-223-6021 Fax: 603-223-6030
Epping Field Service Center Keri Neal District Conservationist Knightly Plaza 629 Calef Highway, Suite 203 Epping, NH 03042-2326
603-679-1587 ext. 110 Fax: 603-679-4658 [email protected]
Lancaster Field Service Center Michael Harrington District Conservationist 4 Mayberry Lane Lancaster, NH 03584-3616
603-788-4651 Fax: 603-788-2538 [email protected]
Milford Field Service Center Chad Cochrane District Conservationist Chappel Professional Center #468, Route 13, South Milford NH 03055-3476
603-673-2409 Fax: 603-673-0597 [email protected]
Orford Field Service Center Beth Ann Finlay District Conservationist 19 Archertown Road, Suite 1 Orford, NH 03777
603-353-4651 Fax: 603-353-4647
Walpole Field Service Center Steven Pytlik District Conservationist 11 Industrial Park Drive Walpole, NH 03608-9744
603-756-2988 Fax: 603-756-2978 [email protected]
Rural Development (RD), State Office
NH
Ted Brady State Director City Center, 3rd Floor 89 Main Street Montpelier, VT 05602 (Serving NH and VT)
802-828-6080 Fax: 802-828-6076 [email protected]
Rural Development (RD), Local Offices
NH
Concord Service Center Gregg MacPherson Area Director 10 Ferry Street, Box 317, Suite 218 Concord, NH 03301-5081 (Serving Belknap, Cheshire, Hillsborough, Merrimack, Rockingham, Strafford, & Sullivan Counties)
603-223-6035 Fax: 603-223-6061 [email protected]
Berlin Service Center Janice Gingrass 15 Mount Forist PO Box 330 Berlin NH, 03570
603-752-1328 Fax: 603-752-1354 [email protected]
Conway Service Center 73 Main Street PO Box 1020 Conway, NH 03818-1020
603-447-3318 Fax: 603-447-3304 [email protected]
Animal Plant Health Inspection Service (USDA-APHIS) NH
Plant Protection Quarantine (PPQ) Mark J. Michaelis State Plant Health Director 617 Comstock Road, Suite 3 Berlin, VT 05602-8927
802-828-4490 Fax: 802-828-4591 [email protected]
Wildlife Services (WS) NH
Michael Medeiros 59 Chenell Drive, Suite 7 Concord, NH 03301
603-223-6832 Fax: 603-229-1951 [email protected]
Dennis Slate National Rabies Coordinator - NH/VT 59 Chenell Drive, Suite 7 Concord, NH 03301
603-223-9623 Fax: 603-229-1951 [email protected]
Veterinary Services (VS) NH
Dr. Thomas McKenna Area Veterinarian-in-Charge 160 Worcester-Providence Road Sutton Square Plaza, Suite 20 Sutton, MA 01590-0787
508-363-2290 Fax: 508-363-2272 [email protected]
RHODE ISLAND
Department of Environmental Mgt., Division of Agriculture RI Kenneth D. Ayars Chief 235 Promenade Street , Room 370 Providence, RI 02908-5767
401-222-2781 ext. 4500 Fax: 401-222-6047 [email protected]
Dr. Scott Marshall State Veterinarian 235 Promenade Street Providence, RI 02908-5767
401-222-2781 Fax: 401-222-6047 [email protected]
University of Rhode Island Cooperative Extension, RI State Office
John D. Kirby Dean and Director 423 CBLS Building Kingston, RI 02881
401-874-5493 Fax: 401-874-2957 [email protected]
Richard C. Rhodes, III Associate Dean and Director 414 CBLS Building Kingston, RI 02881
401-874-2468 Fax: 401-874-2468 [email protected]
Farm Bureau RI Henry B. Wright, III President One Stamp Place South County Trail Exeter, RI 02822
401-647-3570 Fax: 401-647-0410 [email protected]
Lyn Sinella Executive Director 16 B Nooseneck Hill Rd West Greenwich, RI 02817
401-385-3339 Fax: 401-385-3394 [email protected]
Farm Service Agency (FSA), State Office
RI
Rhode Island FSA State Office George Goulard Jr. State Executive Director 60 Quaker Lane, Suite 62 Warwick, RI 02886-0114
401-828-8232 Fax: 401-528-5206 [email protected]
Farm Service Agency (FSA), County Office
RI
Ingrid Frantantauno County Executive Director 60 Quaker Lane, Suite 49 Warwick, RI 02886-0114
401-828-3120 Fax: 401-821-0780 [email protected]
Natural Resources Conservation Service (NRCS), RI State Office
Rhode Island NRCS State Office Phoukham Vongkhamdy State Conservationist 60 Quaker Lane, Suite 46 Warwick, RI 02886-0111
401-828-1300 Fax: 401-828-0433 [email protected].

New England Agricultural Statistics 83 USDA, National Agricultural Statistics Service
Natural Resources Conservation Service (NRCS), RI County Office
Warwick Service Center District Conservationist 60 Quaker Lane, Suite 46 Warwick, RI 02886-0181
401-828-1300 Fax: 401-828-0433
Rural Development (RD), RI State Office
Rhode Island RD State Office Scott Sores State Director 451 West Street Amherst, MA 01002-2999 (serving CT, MA and RI)
401-826-0842 Fax: 401-828-6042 [email protected]
Rural Development (RD), RI Local Office
Warwick Service Center J. Thomas S. Mcgarr Area Director 60 Quaker Lane, Suite 44 Warwick, RI 02886-0181
401-826-0842 Fax: 401-828-6042 [email protected]
Animal Plant Health Inspection Service (USDA-APHIS) RI
Plant Protection and Quarantine (PPQ) Kate Aitkenhead State Plant Health Director 97 Barnes Road, Unit 200 Wallingford, CT 06492
203-741-5644 Fax: 203-741-5660 [email protected]
Veterinary Services (VS) RI
Dr. Thomas McKenna Area Veterinarian-in-Charge 160 Worcester-Providence Road Sutton Square Plaza, Suite 20 Sutton, MA 01590-0787
508-363-2290 Fax: 508-363-2272 [email protected]
Wildlife Services (WS) RI Monte D. Chandler State Director 463 West Street Amherst, MA 01002
413-253-2403 Fax: 413-253-7577 [email protected]
VERMONT
Agency of Agriculture, Food, and Markets VT
Chuck Ross Secretary of Agriculture 116 State Street Montpelier, VT 05620-2901
802-828-1619 Fax: 802-828-2361 [email protected]
Diane Bothfeld Deputy Secretary 116 State Street Montpelier, VT 05620-2901
802-828-3835 Fax: 802-828-2361 [email protected]
Jolinda LaClair Deputy Secretary 116 State Street Montpelier, VT 05620-2901
802-828-1619 Fax: 802-828-2361 [email protected]
Dr. Kristin Haas Director/State Veterinarian Div. of Food Safety and Consumer Prot. 116 State Street Montpelier, VT 05620-2901
802-828-2426 Fax: 802-828-5983 [email protected]
University of Vermont Cooperative Extension, VT State Office
Doug Lantagne Dean and Director 23 Mansfield Ave. Burlington, VT 05401-3323
802-656-2900 Fax: 802-656-8642 doug.lantagne @uvm.edu
University of Vermont Cooperative Extension System, VT Local Offices
Bennington Office PO Box 559 310 Main Street Bennington, VT 05201-0559
802-447-7582 Fax: 802-447-8076 betsy.miller @uvm.edu
Berlin Office 617 Comstock Road, Suite 5 Berlin, VT 05602-9194
802-223-2389 Fax: 802-223-6500 [email protected]
Brattleboro Office 11 University Way Road, Suite 4 Brattleboro, VT 05301-4423
802-257-7967 Fax: 802-257-0112 [email protected]
Middlebury Office 23 Pond Lane, Suite 300 Middlebury, VT 05753-1292
802-388-4969 Fax: 802-388-0511 [email protected]
Morrisville Office 29 Sunset Drive, Suite 2 Morrisville, VT 05661-8313
802-888-4972 Fax: 802-888-2432 [email protected]
Newport Office 316 Main St. Suite 301 Newport, VT 05855-4896
802-334-7325 Fax: 802-334-5208 [email protected]
Rutland Office Howe Center Business Park 1 Scale Avenue, Suite 55 Rutland, VT 05701-4457
802-773-3349 Fax: 802-775-4840 [email protected]
St. Albans Office 278 South Main Street, Suite 2 St. Albans, VT 05478-1866
802-524-6501 Fax: 802-524-6062 [email protected]
St. Johnsbury Office 374 Emerson Falls Rd. Suite 1 St. Johnsbury, VT 05819-1740
802-751-8307 Fax: 802-751-8800 [email protected]
Springfield Office Howard Dean Education Center 307 South Street Springfield, VT 05156
800-278-5471 Fax: 802-885-8389 [email protected]
State 4-H Office 655 Spear Street University of Vermont Burlington, VT 05405-0107
802-656-5433 Fax: 802-656-5422 [email protected]
Farm Bureau VT Joe Tisbert President 117 West Main Street Richmond, VT 05477
802-434-5646 Fax: 802-434-6309 [email protected]
Chris O’Keefe Administrator 117 West Main Street Richmond, VT 05477-9605
802-434-5646 Fax: 802-434-6309 [email protected]
Farm Service Agency (FSA), State Office
VT
Vermont FSA State Office Robert G. Paquin State Executive Director 356 Mountain View Drive, Suite 104 Colchester, VT 05446-5986
802-658-2803 Fax: 802-660-0953 [email protected]
Farm Service Agency (FSA), County Offices
VT
Addison County FSA Pamela Smith County Executive Director 68 Catamount Park, Suite A Middlebury, VT 05753-1292
802-388-6748 Fax: 802-388-3709 [email protected]
Bennington County FSA Tina Williams County Executive Director 170 South Main Street Rutland, VT 05701-4559
802-775-8034 Fax: 802-773-4177 [email protected]
Caledonia County FSA Patricia Passut County Executive Director 481 Summer Street St. Johnsbury, VT 05819-2734
802-748-2641 Fax: 802-748-1621 [email protected]
Chittenden County FSA Lawrence Parker County Executive Director 1193 South Brownell Road, Suite 35 Williston, VT 05495-7416
802-865-7895 or Fax: 802-865-7947 [email protected]
84 New England Agricultural Statistics USDA, National Agricultural Statistics Service
Essex County FSA Patricia Passut County Executive Director 481 Summer Street St. Johnsbury, VT 05819-2734
802-748-2641 Fax: 802-748-1621 [email protected]
Franklin County FSA Paul Remillard County Executive Director-Acting 27 Fisher Pond Road, Suite 2 St Albans, VT 05478-6274
802-527-1296, ext. 106 Fax: 802-524-4575 [email protected]
Grand Isle County FSA Paul Remillard County Executive Director-Acting 27 Fisher Pond Road, Suite 2 St Albans, VT 05478-6274
802-527-1296, ext. 106 Fax: 802-524-4575 [email protected]
Lamoille County FSA Heather Mateja County Executive Director 109 Professional Drive, Suite 2 Morrisville, VT 05661-8524
802-888-4935 Fax: 802-888-8901 [email protected]
Orange County FSA Christine Lary County Executive Director 28 Farmvu Drive White River Jct, VT 05001-6001
Phone 802-295-7942 Fax: 802-296-3654 [email protected]
Orleans County FSA Heather Mateja County Executive Director 59 Waterfront Plaza, Suite 11 Newport, VT 05855-4877
802-334-6090 Fax: 802-334-1365 [email protected]
Rutland County FSA Tina Williams County Executive Director 170 South Main Street Rutland, VT 05701-4559
802-775-8034 Fax: 802-773-4177 [email protected]
Washington County FSA Lawrence Parker County Executive Director 1193 South Brownell Road, Suite 35 Williston, VT 05495-7416
802-865-7895 Fax: 802-865-7947 [email protected]
Windham County FSA Christine Lary County Executive Director-Acting 28 Vernon Street Brattleboro, VT 05301-8605
802-254-9766 Fax: 802-254-3307 [email protected]
Windsor County FSA Christine Lary County Executive Director 28 Farmvu Drive White River Jct., VT 05001-6001
Phone 802-295-7942 Fax: 802-296-3654 [email protected]
Natural Resources Conservation Service (NRCS), VT State Office
Vermont NRCS State Office Vicky M. Drew State Conservationist 356 Mountain View Drive, Suite 105 Colchester, VT 05446
802-951-6796, ext. 242 Fax: 802-951-6327 [email protected]
Natural Resources Conservation Service (NRCS), VT Field Offices, By Zone
Berlin Field Office Soil Conservationist 617 Comstock Road, Suite 1 Berlin, VT 05602-8927
802-828-4493 Fax: 802-223-6163 [email protected]
Brattleboro Field Office Charles Armstrong Soil Conservationist 28 Vernon Street, Suite 332 Brattleboro, VT 05301-8605
802-254-9766 Fax: 802-254-3307 [email protected]
Middlebury Field Office Natural Resource Specialist 68 Catamount Park, Suite B Middlebury, VT 05753-8997
802-388-6748 Fax: 802-388-3709 [email protected]
Morrisville Field Office Nancy Allen Soil Conservationist 109 Professional Drive, Suite 2 Morrisville, VT 05661
802-888-4935 Fax: 802-888-8901 [email protected]
Newport Field Office David Blodgett Zone District Conservationist 59 Waterfront Plaza, Suite 12 Newport, VT 05855-4877
802-334-6090, ext. 25 Fax: 802-334-1365 [email protected]
Rutland Field Office Jennifer Varin Zone District Conservationist 170 South Main Street, Suite 4 Rutland, VT 05701
802-775-8034 Fax: 802-773-4177 [email protected]
St. Albans Field Office Corey Brink Zone District Conservationist 27 Fisher Pond Road, Suite 1 St Albans, VT 05478
802-527-1296 Fax: 802-524-4575 [email protected]
St. Johnsbury Field Office Nicholas Comerci Soil Conservationist 481 Summer Street, Suite 202 St. Johnsbury, VT 05819
802-748-2641 Fax: 802-748-1621 [email protected]
White River Junction Field Office Jason Fleury Soil Conservationist 28 Farmvu Drive White River Junction, VT 05001
802-295-7942 Fax: 802-296-3654 [email protected]
Williston Field Office John Thurgood Zone District Conservationist 1193 South Brownell Road, Suite 35 Williston, VT 05495-7529
802-865-7895 Fax: 802-865-7947 [email protected]
Rural Development (RD), State Office
VT
Ted Brady State Director 87 State Street Suite 324 PO Box 249 Montpelier, VT 05601
802-828-6000 Fax: 802-828-6018 [email protected]
Rural Development (RD), Local Offices
VT
Brattleboro Office Jon-Michael Muise Area Director 28 Vernon Street, Suite 333 Brattleboro, VT 05301 (Serving Bennington, Rutland, Windham and Windsor Counties)
802-257-7878 Fax: 802-254-3307 [email protected]
Montpelier Office Michael Bard Area Director 89 Main Street Montpelier, VT 05602-2948 (Serving Addison, Chittenden, Franklin, Grand Isle, Lamoille, Orange, and Washington Counties)
802-828-6031 Fax: 802-828-6076 [email protected]
St. Johnsbury Office Steven Campbell Area Director 481 Summer Street, Suite 203 St. Johnsbury, VT 05819-2734 (Serving Caledonia, Essex, and Orleans Counties)
802-748-8746 Fax: 802-748-1621 [email protected]
Animal Plant Health Inspection Service(USDA-APHIS) VT Plant Protection Quarantine (PPQ)
Mark J. Michaelis State Plant Health Director 617 Comstock Road, Suite 3 Berlin, VT 05602-8927
802-828-1402 Fax: 802-828-4591 [email protected]
Veterinary Services (VS) VT
Dr. Thomas McKenna Area Veterinarian-in-Charge 160 Worcester-Providence Road Sutton Square Plaza, Suite 20 Sutton, MA 01590-0787
508-363-2290 Fax: 508-363-2272 [email protected]
Wildlife Services (WS) VT Michael Medeiros 59 Chenell Drive, Suite 7 Concord, NH 03301
603-223-6832 Fax: 603-229-1951 [email protected]
Dennis Slate National Rabies Coordinator - NH/VT 59 Chenell Drive, Suite 7 Concord, NH 03301
603-223-9623 Fax: 603-229-1951 [email protected]

New England Agricultural Statistics 85 USDA, National Agricultural Statistics Service
Need More Information? www.nass.usda.gov
Where can I get more statistics or economic analysis? National Agricultural Statistics Service (NASS) publications include weekly, monthly, quarterly, and annual estimates of production,
stocks, inventories, disposition, utilization and prices of agricultural commodities, and other items. The Census of Agriculture is published
every five years covering all commodities by state, county, and zip code. Other census reports include the Agricultural Atlas; Congressional
District Tabulations; Farm and Ranch Irrigation; Aquaculture; Horticulture Specialties; Watershed; On-Farm Energy Production; Organic
Production; Tenure, Ownership, and Transition of Agricultural Land; Local Food Marketing Practices; and Specialty Crops.
Economic Research Service (ERS) Situation and Outlook Reports and periodicals analyze the current situation and forecast market
conditions. ERS monographs offer economic analysis in the area of trade, production, rural development, farm inputs, and other topics.
The World Agricultural Outlook Board (WAOB) issues regular forecasts of United States and world supply and demand prospects for
major agricultural commodities.
How can I get National publications from NASS and ERS for all states? For Free E-mail Subscriptions go to http://usda.mannlib.cornell.edu/MannUsda/aboutEmailService.do
You will be directed to a sign-on page for your email information. Through this service, you will receive the reports of your
choice within one hour of their publication via email. Please note that delivery time may take longer depending on factors such as
network speed and congestion.
For a Free Catalog of Products and Services call 1-800-999-6779.
The NASS and ERS catalogs list all products and services available from each agency. The NASS catalog includes a calendar of
publication dates for agricultural statistics reports throughout the year.
How can I get State publications from NASS field offices? For Free E-mail Subscriptions go to http://www.nass.usda.gov/Statistics_by_State/New_England/index.asp. There is a link on
the right “Subscribe to New England Reports”. (New England includes CT, ME, MA, NH, RI and VT.)
For Paper Subscriptions use the order form in this book; see ‘New England Reports’ for details. For States outside of New
England, call 1-800-727-9540.
Sources of Agricultural Information in USDA
USDA – NASS USDA – ERS USDA – WAOB
Customer
Service
800-727-9540 202-694-5050 202-720-5447
Address Room 5805 South Building
1400 Independence Ave., S.W.
Washington, D.C. 20250-2000
1400 Independence Avenue, S.W.
Mail Stop 1800
Washington, D.C. 20250
Room 5143 South Building
1400 Independence Ave., S.W.
Washington, D.C. 20250-3800
FAX 202-690-2090
Fax to retrieve data: 202-720-2000
202-694-5689
Fax to retrieve data: 202-694-5700
202-690-1805
E-mail [email protected] (Washington, DC)
[email protected] (New England)
(xx is the state abbreviation)
[email protected] [email protected]
(202) 720-5447
Internet www.nass.usda.gov www.ers.usda.gov www.usda.gov/oce/index.htm
National specialists are available to answer your questions by phone or e-mail. See these internet sites for telephone numbers and E-mail
addresses:
Statistics from USDA, NASS www.nass.usda.gov
Economists in USDA, ERS www.ers.usda.gov/AboutERS/specialists
Small Farm Program: USDA-NIFA, Stop 2215 800-583-3071 Fax: 202-690-3162
1400 Independence Ave., S.W. E-mail: [email protected]
Washington, D.C. 20250-2215 Internet: www.csrees.usda.gov/smallfarm.cfm
Farmer Direct Marketing Initiative: USDA - Agricultural Marketing Service
1400 Independence Ave., SW, Room 2642-S, Stop 0269
Washington, D.C. 20250-0269
Phone: 202-720-8317 Fax: 202-690-0031
E-mail: [email protected] Internet: www.ams.usda.gov
Canadian Ag Statistics: For Customer Service at the Agriculture Division of Statistics Canada,
Phone: 800-465-1991 E-mail: [email protected] Internet: www.statcan.ca

86 New England Agricultural Statistics
USDA, National Agricultural Statistics Service
United States Department of Agriculture
National Agricultural Statistics Service provides timely, accurate, and useful statistics in service to United States agriculture.
NASS Reports Arranged by Title 1
Acreage
Adult Agricultural Related Injuries
Agricultural Cash rents
Agricultural Chemical Usage
Agricultural Land Values and Cash Rents
Agricultural Prices
Broiler Hatchery
Capacity of Refrigerated Warehouses
Catfish Feed Deliveries
Catfish Losses to Wildlife
Catfish Processing
Catfish Production
Cattle
Cattle on Feed
Cattle Death Loss
Census of Agriculture
Cherry Production
Chickens and Eggs
Childhood Agricultural Injuries
Citrus Fruits
Cold Storage
Cotton Ginnings
Cranberries
Crop Production
Crop Progress
Crop Values
Dairy Products
Dairy Products Prices
Egg Products
Equine
Ethanol Co-Products Used
for Livestock Feed
Farm Computer Usage and Ownership
Farm Labor
Farm Production Expenditures
Farms, Land in Farms, and Livestock
Operations
Floriculture Crops
Fruit and Tree Nuts: Blooming, Harvesting,
and Marketing Dates
Fruit and Wildlife Damage
Grain Stocks
Hatchery Production
Hogs and Pigs
Honey
Hop Stocks
Layers and Egg Production
Licensed Dairy Herds
Livestock Slaughter
Meat Animals Production, Disposition,
and Income
Milk Production
Milk Production, Disposition and Income
Milkfat Prices
Mink
Mushrooms
NASS Agricultural Newsletter
National Hop Report
Non-Ambulatory Cattle and Calves
Non-Ambulatory Sheep and Goats
Noncitrus Fruits and Nuts Preliminary
Noncitrus Fruits and Nuts
Nursery Crops
Peanut Prices
Peanut Stocks and Processing
Pest Management Practices
Potato Stocks
Potatoes
Poultry – Production and Value
Poultry Slaughter
Price Reactions after USDA
Crop Reports
Price Reactions after USDA
Livestock Reports
Prospective Plantings
Rice Stocks
Sheep and Goats
Sheep and Goats Death Loss
Small Grains
Trout Production
Turkey Hatchery
Turkeys Raised
US Broiler and Egg Production Cycles
US Broiler Industry Structure
US Hog Breeding Herd Structure
US Wildlife Damage
US and Canadian Cattle
US and Canadian Hogs and Pigs
Usual Planting and Harvesting Dates
for US Field Crops
Usual Planting & Harvesting Dates for US
Fresh Market & Processing Vegetables
Vegetables
Weekly Weather and Crop Bulletin
Winter Wheat Seeding
Wool and Mohair
1 See website for report descriptions and release dates at http://www.nass.usda.gov/Publications/catalog.pdf.
These reports include all States. Although National reports are available through e-mail and the internet at no charge, paper reports are still available for a fee. For details, see USDA Agricultural
Publications/Customer Service on previous page.

THIS PAGE INTENTIONALLY LEFT BLANK

U.S. Department of AgricultureNational Agricultural Statistics Servicewww.nass.usda.gov
LEARN MORE • www.nass.usda.gov – Browse the NASS website for information on surveys, the census, and more.• Quick Stats – Use this easy online tool to find data by agricultural product, geography, and date. • CropScape – Use this Web portal to get crop-specific geospatial land cover information. • Sign up for free customized national reports, state reports, or news releases via email. • Follow NASS on Twitter – @usda_nass.• Customer Service – For assistance finding data online or to request hard copies, including CDs and
DVDs, call toll free: (800) 727-9540 (7:30 a.m. to 4 p.m. ET Mon-Fri) or write to [email protected].• View our pledge to keep data confidential and secure.


