2020-21 Undergraduate Factbook Prepared by the Office of Institutional Research, Planning, and Assessment Data presented in this Factbook represent static snapshots of institutional data taken during the Office of Institutional Research, Planning, and Assessment’s Fall Census. As such, the data presented here should be used for official reporting purposes as they have been validated and can be replicated at any time using the data warehouse (a storage of all Census snapshots). While the Fall Census captures static data snapshots into the data warehouse, institutional data continue to be dynamic in the College’s data systems beyond the Fall Census. This means that system data may be updated after the Census snapshot. The Office of Institutional Research, Planning, and Assessment encourages any individual wishing to use institutional data for research purposes to contact the Director, Richard Barry, for discussion of the most accurate approach. Factbook Contents In the table below, click on any subsection to be taken directly to that portion of the Factbook. Admissions Incoming Cohort First-Time, First-Year Students Transfer/McBride Students Academics Demographics Financial Aid Students Geography Demographics Enrollment Financial Aid Geography Majors Declared Minors Declared Concentrations Declared Retention Rates Graduating Class Demographics Majors Completed Minors Completed Concentrations Completed Graduation Rates Office of Institutional Research, Planning, and Assessment Richard Barry, Director | [email protected]; x6532
Transcript
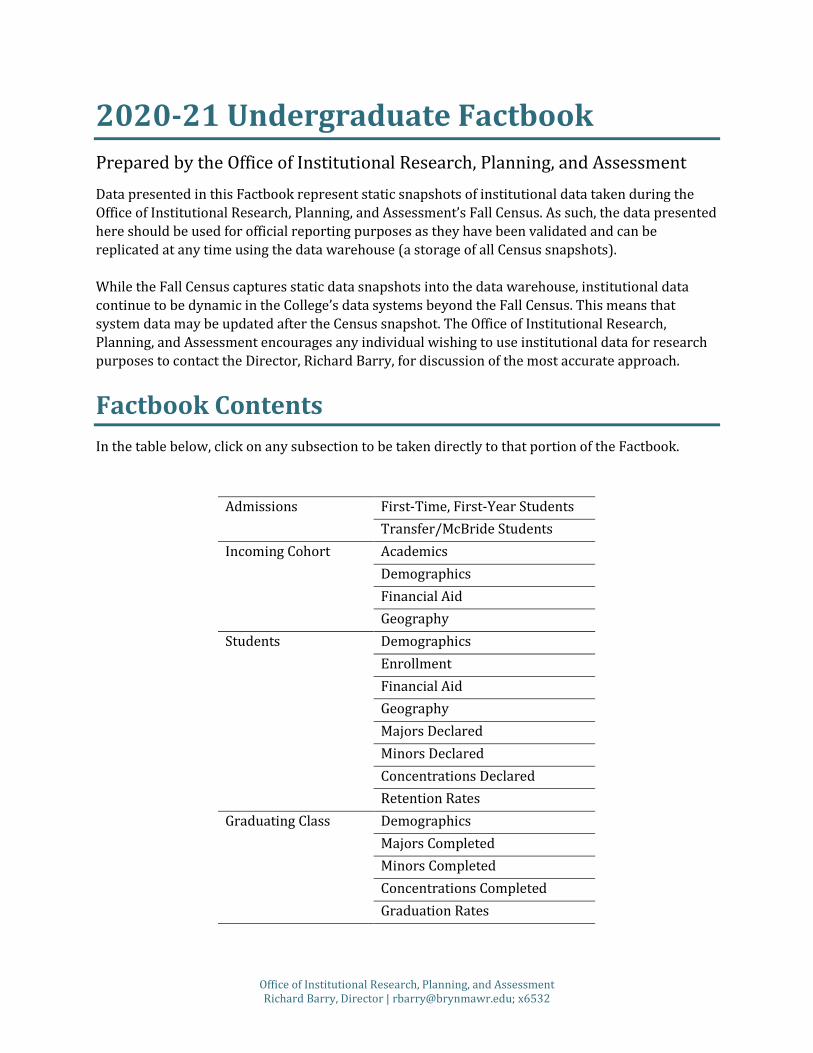
2020-21 Undergraduate Factbook Prepared by the Office of Institutional Research, Planning, and Assessment Data presented in this Factbook represent static snapshots of institutional data taken during the Office of Institutional Research, Planning, and Assessment’s Fall Census. As such, the data presented here should be used for official reporting purposes as they have been validated and can be replicated at any time using the data warehouse (a storage of all Census snapshots).
While the Fall Census captures static data snapshots into the data warehouse, institutional data continue to be dynamic in the College’s data systems beyond the Fall Census. This means that system data may be updated after the Census snapshot. The Office of Institutional Research, Planning, and Assessment encourages any individual wishing to use institutional data for research purposes to contact the Director, Richard Barry, for discussion of the most accurate approach.
Factbook Contents In the table below, click on any subsection to be taken directly to that portion of the Factbook.
Admissions
Incoming Cohort
First-Time, First-Year Students Transfer/McBride Students Academics Demographics Financial Aid
Students Geography Demographics Enrollment Financial Aid Geography Majors Declared Minors Declared Concentrations Declared Retention Rates
Undergraduate | First-Time, First-Year Admissions 2020 Historic, longitudinal data can be obtained by contacting Richard Barry, Director of Institutional Research, Planning, and Assessment via email ([email protected]) or phone x6532.
Undergraduate | Transfer and McBride Admissions 2020 Historic, longitudinal data can be obtained by contacting Richard Barry, Director of Institutional Research, Planning, and Assessment via email ([email protected]) or phone x6532.
Undergraduate | Incoming Cohort Academics 2020 Historic, longitudinal data can be obtained by contacting Richard Barry, Director of Institutional Research, Planning, and Assessment via email ([email protected]) or phone x6532.
Cohort Incoming Cohort 2019 359 100%
Chose Test Optional 86 24% Standardized Reported SAT Scores 244 68% Tests Reported ACT Scores 121 34%
SAT Scores Math EBRW Composite 25th Percentile 610 630 1260 Average 679 676 1355 Median 680 690 1390 75th Percentile 760 740 1470
ACT Scores Math English Composite 25th Percentile 24 26 26 Average 26 31 29 Median 27 33 30 75th Percentile 30 35 32
High School Rank
Reported H.S. Rank 89 25% Of reported, those in…
Top 5% of Class 46 52% Top 10% of Class 59 66% Top 25% of Class 83 93% Top 50% of Class 88 99%
of reported
of reported
of reported
of reported
High School Type
Public 217 60% Independent 68 19% Religious 35 10% Charter 24 7% Home School 2 1% Unknown 13 4%
Office of Institutional Research, Planning, and Assessment Report Updated On | 10/20/2020
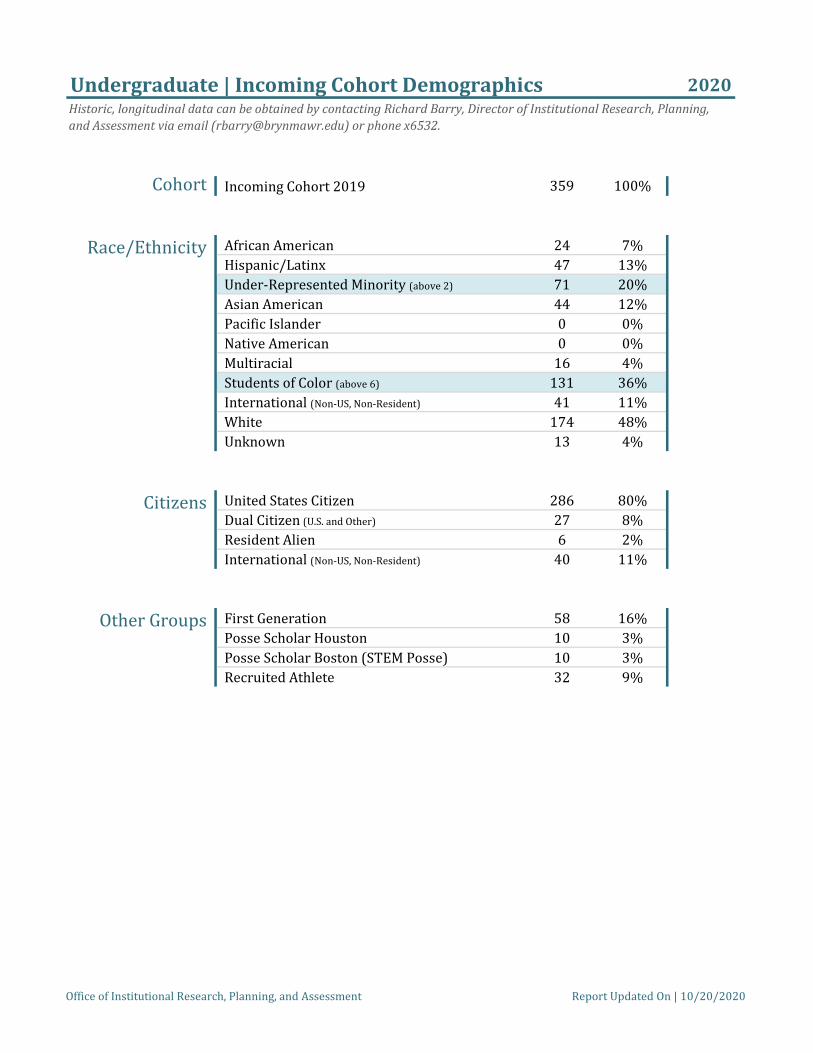
Undergraduate | Incoming Cohort Demographics 2020 Historic, longitudinal data can be obtained by contacting Richard Barry, Director of Institutional Research, Planning, and Assessment via email ([email protected]) or phone x6532.
Cohort Incoming Cohort 2019 359 100%
Race/Ethnicity African American 24 7% Hispanic/Latinx 47 13% Under-Represented Minority (above 2) 71 20% Asian American 44 12% Pacific Islander 0 0% Native American 0 0% Multiracial 16 4% Students of Color (above 6) 131 36% International (Non-US, Non-Resident) 41 11% White 174 48% Unknown 13 4%
Citizens United States Citizen 286 80% Dual Citizen (U.S. and Other) 27 8% Resident Alien 6 2% International (Non-US, Non-Resident) 40 11%
Other Groups First Generation 58 16% Posse Scholar Houston 10 3% Posse Scholar Boston (STEM Posse) 10 3% Recruited Athlete 32 9%
Office of Institutional Research, Planning, and Assessment Report Updated On | 10/20/2020
Undergraduate | Incoming Cohort Financial Aid 2020 Historic, longitudinal data can be obtained by contacting Richard Barry, Director of Institutional Research, Planning, and Assessment via email ([email protected]) or phone x6532.
Cohort Incoming Cohort 2020 359 100%
Financial Aid Recipients
Received Any Financial Aid 295 82% Grant (any source) 255 71% Bryn Mawr Grant 250 70% Pell Grant 62 17% State Grant 7 2% Outside Scholarship/Grant 53 15%
Applied for Need-Based Financial Aid 261 73% Need-Based Aid Assessed to have Financial Need 177 49% Applicants
Award Amounts
Of All Financial Aid Recipients Avg. Fin. Aid Package (per recipient) $37,991 Avg. Bryn Mawr Grant (per recipient) $37,209 Total Bryn Mawr Grant (in millions) $9.3023
Of those assessed to have Financial Need Avg. Fin. Aid Package (per recipient) $52,359 Avg. Bryn Mawr Grant (per recipient) $43,000 Total Bryn Mawr Grant (in millions) $7.6111
Office of Institutional Research, Planning, and Assessment Report Updated On | 1/21/2021
Undergraduate | Incoming Cohort Geography by Residence 2020 Historic, longitudinal data can be obtained by contacting Richard Barry, Director of Institutional Research, Planning, and Assessment via email ([email protected]) or phone x6532.
Cohort Incoming Cohort 2019 359 100%
Domestic Residents
United States Residents 315 88% New England 40 11% Mid-Atlantic 122 34% South 34 9% Midwest 23 6% Southwest 32 9% West 55 15% District/Territory 9 3%
States (of 50) Represented 38 Districts/Territories Represented 2
Count of Domestic Residents by State 1-5 6-15 >15
Office of Institutional Research, Planning, and Assessment Report Updated On | 10/20/2020
Undergraduate | Incoming Cohort Geography by Residence 2020 Historic, longitudinal data can be obtained by contacting Richard Barry, Director of Institutional Research, Planning, and Assessment via email ([email protected]) or phone x6532.
Cohort Incoming Cohort 2019 359 100%
International Residents 44 12% International Foreign Countries Represented 18 Residents
By Country China 28 Germany 2 Korea, Republic of 2 France 1 Iceland 1 India 1 Kazakhstan 1 Kenya 1 Nigeria 1 Pakistan 1 Paraguay 1 Singapore 1 Switzerland 1 United Kingdom 1 Viet Nam 1
Office of Institutional Research, Planning, and Assessment Report Updated On | 10/20/2020
Undergraduate | Student Demographics 2020 Historic, longitudinal data can be obtained by contacting Richard Barry, Director of Institutional Research, Planning, and Assessment via email ([email protected]) or phone x6532.
Overall Full Time Undergraduates 1297 100%
Race/Ethnicity African American 70 5% Hispanic/Latinx 136 10% Under-Represented Minority (above 2) 206 16% Asian American 150 12% Pacific Islander 0 0.0% Native American 0 0% Multiracial 61 5% Students of Color (above 6) 417 32% International (Non-US, Non-Resident) 241 19% White 597 46% Unknown 42 3%
Citizens United States Citizen 954 74% Dual Citizen (U.S. and Other) 82 6% Resident Alien 30 2% International (Non-US, Non-Resident) 231 18%
First Generation 178 14% Other Groups
Office of Institutional Research, Planning, and Assessment Report Updated On | 1/21/2021
Undergraduate | Student Enrollment 2020 Historic, longitudinal data can be obtained by contacting Richard Barry, Director of Institutional Research, Planning, and Assessment via email ([email protected]) or phone x6532.
All Undergraduates 1301 100% Overall
Studying at BMC (used for reporting) 1300 100% Studying Abroad 1 0%
Of Students Studying at BMC...
Students
Enrollment Status
Degree Seeking Status
Class Level (Full Time Only)
Studying at BMC 1300 100%
Full Time 1297 100% Part Time 3 0% Full Time Equivalent (FTE) 1298
Class Level above is determined based on a student's expected graduation date. Thus, the count of First-Year above is not necessarily equivalent to the Incoming Cohort count. For information specifically on incoming students , see Incoming Cohort Factbooks.
Office of Institutional Research, Planning, and Assessment Report Updated On | 1/21/2021
Undergraduate | Student Financial Aid 2020 Historic, longitudinal data can be obtained by contacting Richard Barry, Director of Institutional Research, Planning, and Assessment via email ([email protected]) or phone x6532.
Overall Full Time, Degree-Seeking Undergraduates 1297 100%
Financial Aid Recipients
Received Any Financial Aid 1003 77% Grant (any source) 927 71% Bryn Mawr Grant 917 71% Pell Grant 204 16% State Grant 55 4% Outside Scholarship/Grant 106 8%
Applied for Need-Based Financial Aid 790 61% Need-Based Aid Assessed to have Financial Need 636 49% Applicants
Award Amounts
Of All Financial Aid Recipients Avg. Fin. Aid Package (per recipient) $40,720 Avg. Bryn Mawr Grant (per recipient) $36,258 Total Bryn Mawr Grant (in millions) $33.2481
Of those assessed to have Financial Need Avg. Fin. Aid Package (per recipient) $53,032 Avg. Bryn Mawr Grant (per recipient) $43,826 Total Bryn Mawr Grant (in millions) $27.7417
Office of Institutional Research, Planning, and Assessment Report Updated On | 1/21/2021
Undergraduate | Student Geography by Residence 2020 Historic, longitudinal data can be obtained by contacting Richard Barry, Director of Institutional Research, Planning, and Assessment via email ([email protected]) or phone x6532.
Overall Full Time Undergraduates 1297 100%
Domestic Residents
United States Residents 1066 82% New England 150 12% Mid-Atlantic 455 35% South 117 9% Midwest 84 6% Southwest 84 6% West 159 12% District/Territory 17 1%
States (of 50) Represented 43 Districts/Territories Represented 4
Count of Domestic Residents by State 1-5 6-30 >30
Office of Institutional Research, Planning, and Assessment Report Updated On | 1/21/2021
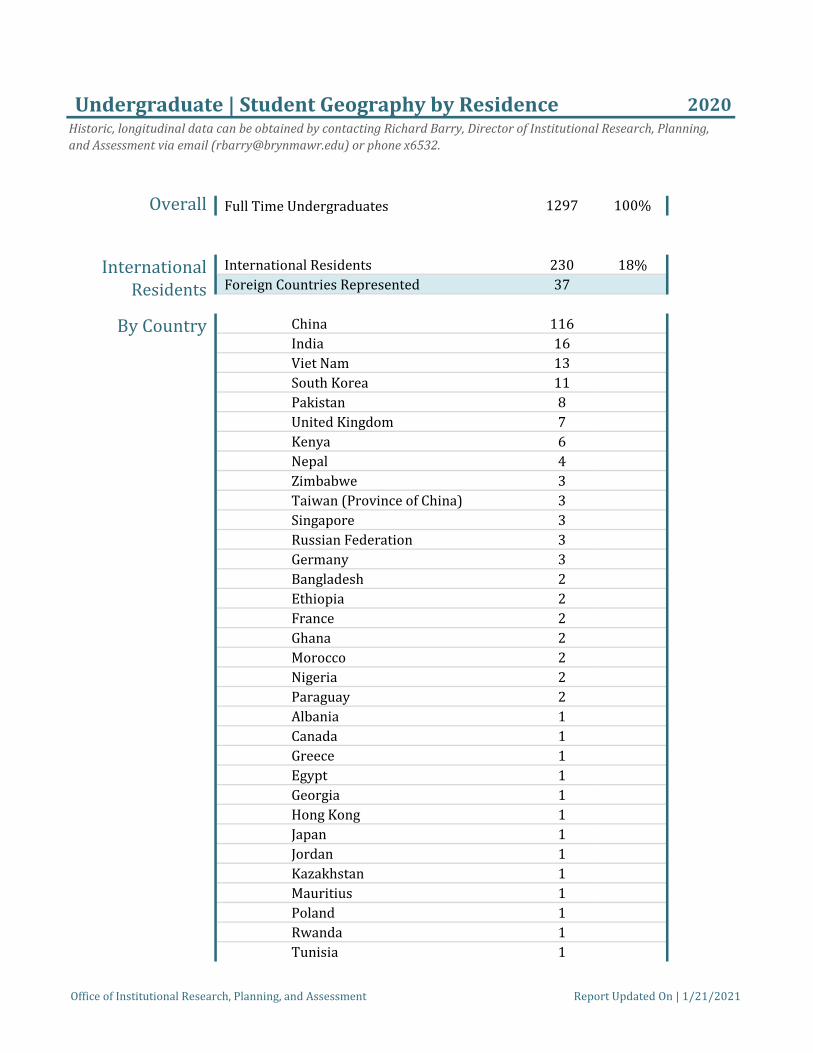
Undergraduate | Student Geography by Residence 2020 Historic, longitudinal data can be obtained by contacting Richard Barry, Director of Institutional Research, Planning, and Assessment via email ([email protected]) or phone x6532.
Overall Full Time Undergraduates 1297 100%
International Residents 230 18% International Foreign Countries Represented 37 Residents
By Country China 116 India 16 Viet Nam 13 South Korea 11 Pakistan 8 United Kingdom 7 Kenya 6 Nepal 4 Zimbabwe 3 Taiwan (Province of China) 3 Singapore 3 Russian Federation 3 Germany 3 Bangladesh 2 Ethiopia 2 France 2 Ghana 2 Morocco 2 Nigeria 2 Paraguay 2 Albania 1 Canada 1 Greece 1 Egypt 1 Georgia 1 Hong Kong 1 Japan 1 Jordan 1 Kazakhstan 1 Mauritius 1 Poland 1 Rwanda 1 Tunisia 1
Office of Institutional Research, Planning, and Assessment Report Updated On | 1/21/2021
Undergraduate | Student Geography by Residence 2020 Historic, longitudinal data can be obtained by contacting Richard Barry, Director of Institutional Research, Planning, and Assessment via email ([email protected]) or phone x6532.
By Country (continued)
Turkey 1 Ukraine 1 United Arab Emirates 1 Uzbekistan 1
Office of Institutional Research, Planning, and Assessment Report Updated On | 1/21/2021
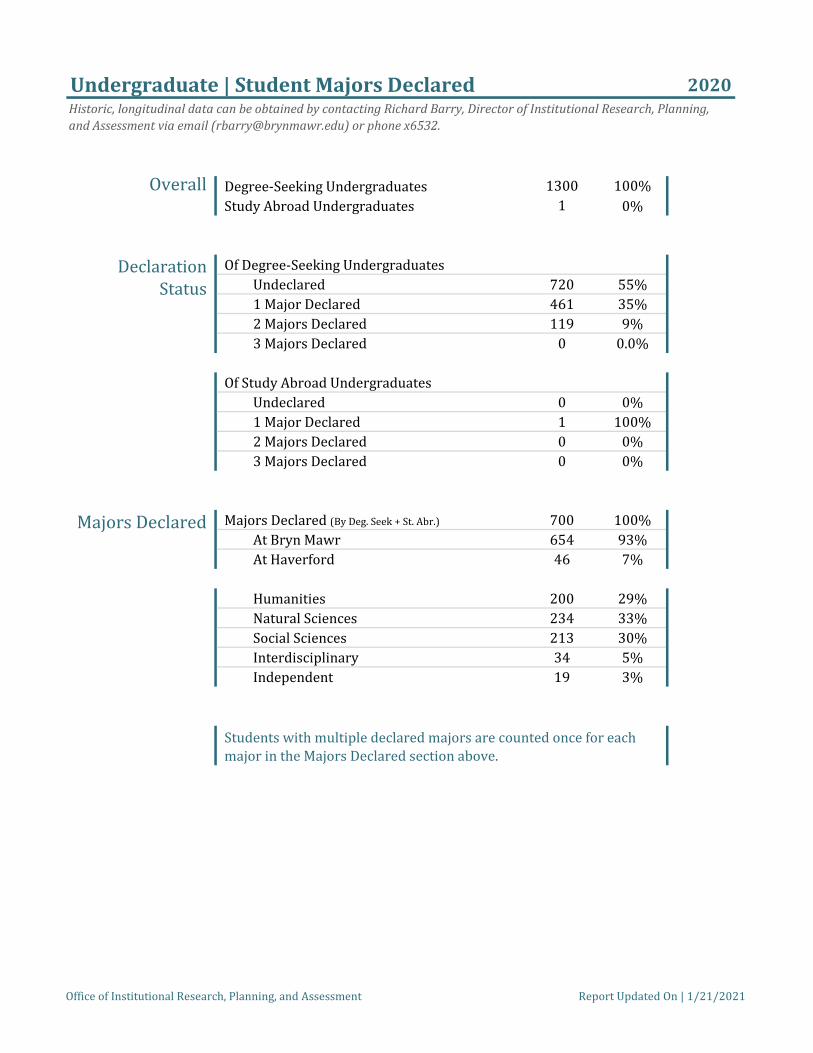
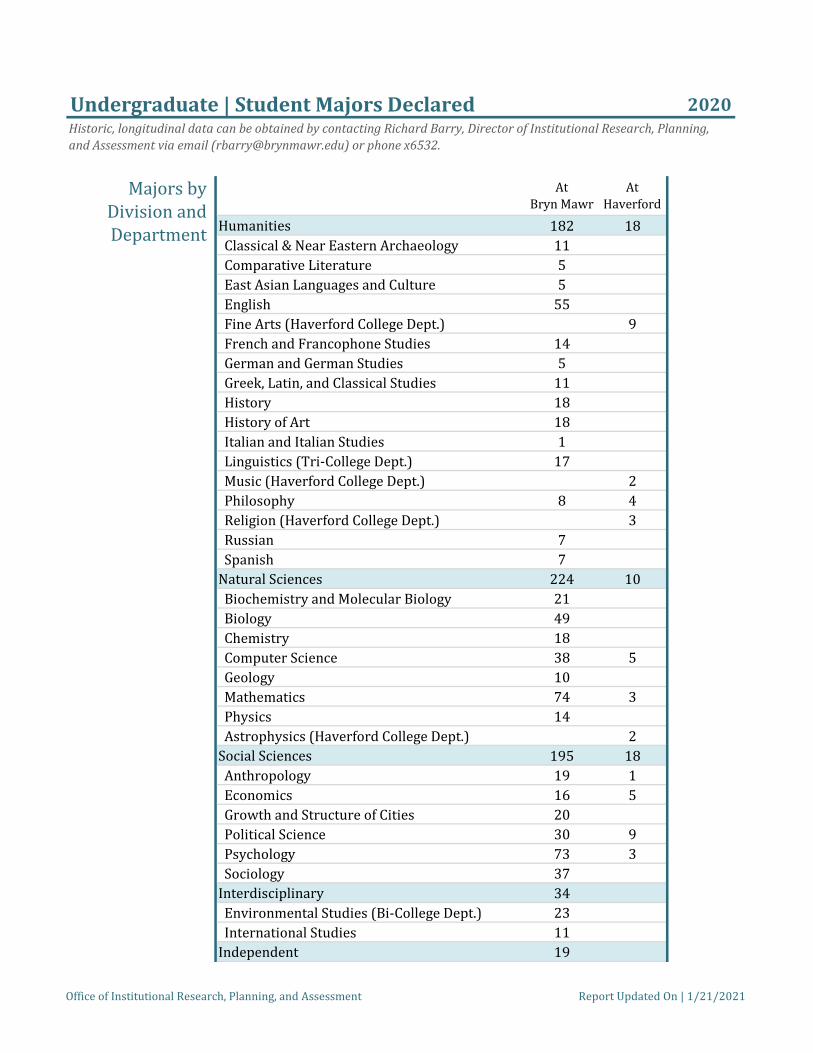
Undergraduate | Student Majors Declared 2020 Historic, longitudinal data can be obtained by contacting Richard Barry, Director of Institutional Research, Planning, and Assessment via email ([email protected]) or phone x6532.
Overall Degree-Seeking Undergraduates 1300 100% Study Abroad Undergraduates 1 0%
Undergraduate | Student Majors Declared 2020 Historic, longitudinal data can be obtained by contacting Richard Barry, Director of Institutional Research, Planning, and Assessment via email ([email protected]) or phone x6532.
Majors by Division and Department
At Bryn Mawr
At Haverford
Humanities 182 18 Classical & Near Eastern Archaeology 11 Comparative Literature 5 East Asian Languages and Culture 5 English 55 Fine Arts (Haverford College Dept.) 9 French and Francophone Studies 14 German and German Studies 5 Greek, Latin, and Classical Studies 11 History 18 History of Art 18 Italian and Italian Studies 1 Linguistics (Tri-College Dept.) 17 Music (Haverford College Dept.) 2 Philosophy 8 4 Religion (Haverford College Dept.) 3 Russian 7 Spanish 7
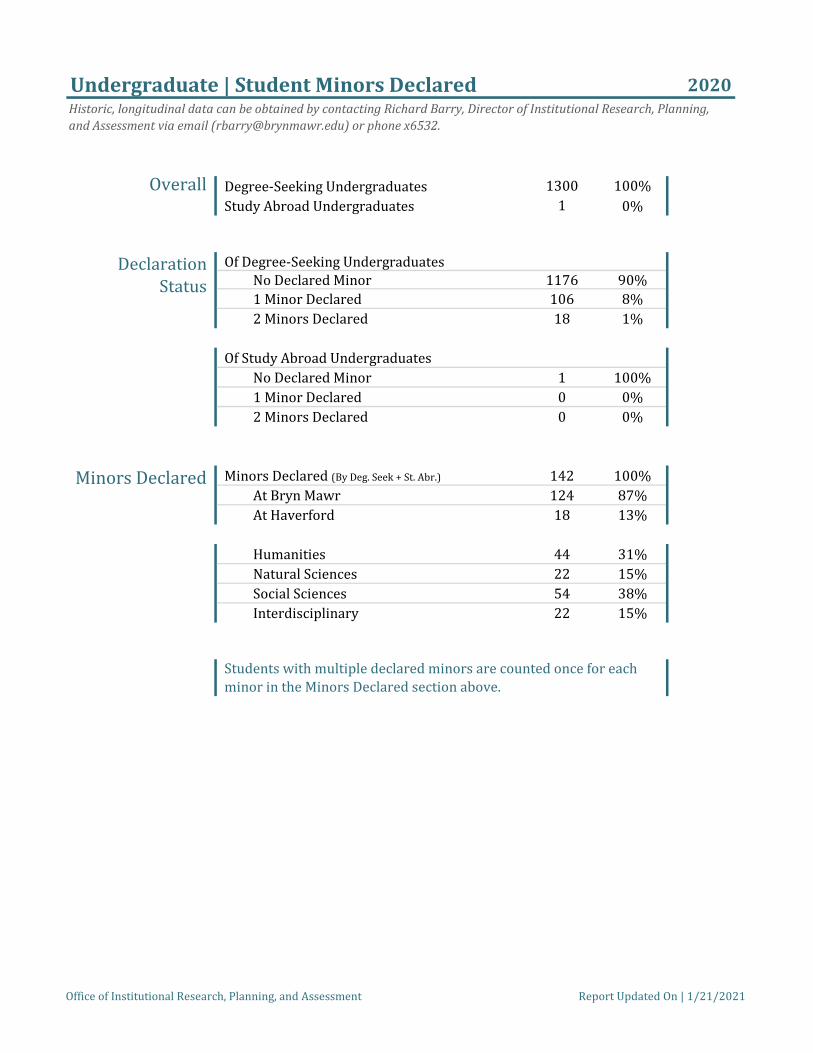
Undergraduate | Student Minors Declared 2020 Historic, longitudinal data can be obtained by contacting Richard Barry, Director of Institutional Research, Planning, and Assessment via email ([email protected]) or phone x6532.
Overall Degree-Seeking Undergraduates 1300 100% Study Abroad Undergraduates 1 0%
Declaration Status
Of Degree-Seeking Undergraduates No Declared Minor 1176 90% 1 Minor Declared 106 8% 2 Minors Declared 18 1%
Of Study Abroad Undergraduates No Declared Minor 1 100% 1 Minor Declared 0 0% 2 Minors Declared 0 0%
Minors Declared Minors Declared (By Deg. Seek + St. Abr.) 142 100% At Bryn Mawr 124 87% At Haverford 18 13%
Undergraduate | Student Minors Declared 2020 Historic, longitudinal data can be obtained by contacting Richard Barry, Director of Institutional Research, Planning, and Assessment via email ([email protected]) or phone x6532.
Minors by Division and
Field
At Bryn Mawr
At Haverford
Humanities 33 11 Creative Writing 4 Dance 2 East Asian Languages and Culture 1 English 1 Film Studies 2 Fine Arts (at Haverford) 1 French and Francophone Studies 4 History 4 History of Art 1 Japanese (at Haverford) 3 Latin American, Iberian, Latino Studies 2 Linguistics 2 1 Museum Studies 3 Music (at Haverford) 1 Philosophy 2 Russian 1 Spanish 2 Theatre 2 Visual Studies (at Haverford) 5
Undergraduate | Student Concentrations Declared 2020 Historic, longitudinal data can be obtained by contacting Richard Barry, Director of Institutional Research, Planning, and Assessment via email ([email protected]) or phone x6532.
Overall Degree-Seeking Undergraduates 1300 100% Study Abroad Undergraduates 1 0%
Declaration Status
Of Degree-Seeking Undergraduates No Declared Concentration Declared 1 Concentration
1289 11
99% 1%
Of Study Abroad Undergraduates No Declared Concentration Declared 1 Concentration
1 0
100% 0%
Concentrations Declared
Concentrations Declared (By Deg. Seek + St. Abr.) 11 100% At Bryn Mawr 8 73% At Haverford 3 27%
Concentrations by Field
At Bryn Mawr
At Haverford
Gender and Sexuality Studies 2 Middle Eastern Studies 6 Peace, Conflict, and Social Justice 1 Scientific Computation 1 Mathematical Economics 1
Office of Institutional Research, Planning, and Assessment Report Updated On | 1/21/2021
Undergraduate | Student Retention Rates 2020 Historic, longitudinal data can be obtained by contacting Richard Barry, Director of Institutional Research, Planning, and Assessment via email ([email protected]) or phone x6532.
Overall Incoming 2019 Cohort 374 Acceptable Exclusions 0 2019 Cohort After Exclusions 374 Enrolled in Second Year 327 1-Year Retention Rate 87.4%
Exclusions from the Incoming Cohort counts include any student who did not persist for the following reasons: deceased, permanently disabled, armed forces, foreign aid service of the federal government, or official church missions.
Pell Incoming 2018 Pell Students 52 Acceptable Exclusions 0 2018 Pell Students After Exclusions 52 Enrolled in Second Year 51 1-Year Retention Rate 98.1%
"Pell Students" includes any student who was awarded a Pell Grant as part of their First Year Financial Aid Package.
URM Incoming 2018 URM Students 45 Acceptable Exclusions 0 2018 URM Students After Exclusions 45 Enrolled in Second Year 44 1-Year Retention Rate 97.8%
"URM Students" includes any student who identified as either Afrian American or Hispanic/Latinx in their First Year.
Office of Institutional Research, Planning, and Assessment Report Updated On | 1/21/2021
Undergraduate | Graduating Class Demographics 2020 Historic, longitudinal data can be obtained by contacting Richard Barry, Director of Institutional Research, Planning, and Assessment via email ([email protected]) or phone x6532.
Overall Class of 2020 Graduates 358 100%
Race/Ethnicity African American 24 7% Hispanic/Latinx 39 11% Under-Represented Minority (above 2) 63 18% Asian American 37 10% Pacific Islander 0 0.0% Native American 0 0% Multiracial 23 6% Students of Color (above 6) 123 34% International (Non-US, Non-Resident) 75 21% White 134 37% Unknown 26 7%
Citizens United States Citizen 256 72% Dual Citizen (U.S. and Other) 18 5% Resident Alien 9 3% International (Non-US, Non-Resident) 75 21%
Office of Institutional Research, Planning, and Assessment Report Updated On | 1/21/2021
Undergraduate | Graduating Class Majors Completed 2020 Historic, longitudinal data can be obtained by contacting Richard Barry, Director of Institutional Research, Planning, and Assessment via email ([email protected]) or phone x6532.
Undergraduate | Graduating Class Majors Completed 2020 Historic, longitudinal data can be obtained by contacting Richard Barry, Director of Institutional Research, Planning, and Assessment via email ([email protected]) or phone x6532.
Completions by Division and Department
At Bryn Mawr
At Haverford
Humanities 116 11 Classical and Near Eastern Archaeology 9 Comparative Literature 2 East Asian Languages and Culture 3 English 33 1 Fine Arts (Haverford College Dept.) 2 French and Francophone Studies 7 German and German Studies 2 Greek, Latin, and Classical Studies 5 History 11 2 History of Art 12 Italian and Italian Studies 1 Linguistics (Tri-College Dept.) 8 Linguistics and Languages (Tri-College Dept.) 1 Music (Haverford College Dept.) 4 Philosophy 8 Religion (Haverford College Dept.) 2 Russian 6 Spanish 8
Office of Institutional Research, Planning, and Assessment Report Updated On | 1/21/2021
Independent 16
Undergraduate | Graduating Class Minors Completed 2020 Historic, longitudinal data can be obtained by contacting Richard Barry, Director of Institutional Research, Planning, and Assessment via email ([email protected]) or phone x6532.
Overall Class of 2020 Graduates 358 100%
Completed 1 Minor 136 38% Completed 2 Minors 15 4%
Completions
Completed at least 1 Minor at Haverford 19 5%
Minors Completed
Minors Completed 166 100% At Bryn Mawr 146 88% At Haverford 20 12%
Undergraduate | Graduating Class Minors Completed 2020 Historic, longitudinal data can be obtained by contacting Richard Barry, Director of Institutional Research, Planning, and Assessment via email ([email protected]) or phone x6532.
Minors by Division and
Field
At Bryn Mawr
At Haverford
Humanities 51 12 Chinese 2 Classical and Near Eastern Archaeology 2 Creative Writing 1 Dance 3 English 3 Film Studies 7 Fine Arts (at Haverford) 1 French and Francophone Studies 3 German and German Studies 1 History 5 History of Art 3 Japanese (at Haverford) 5 Latin American, Iberian, Latino Studies 5 Linguistics 1 Museum Studies 8 Philosophy 3 1 Religion (at Haverford) 2 Spanish 3 Theatre 1 Visual Studies (at Haverford) 2 Latin 1
Social Sciences 40 2 Anthropology 1 Child and Family Studies 6 Economics 3 1 Education 16 1 Growth and Structure of Cities 3 Political Science 5 Psychology 4 Sociology 2
Interdisciplinary 27 Africana Studies 5 Environmental Studies 4 Gender and Sexuality Studies 5 Health Studies 10
Office of Institutional Research, Planning, and Assessment Report Updated On | 1/21/2021
Undergraduate | Graduating Class Concentrations Completed 2020 Historic, longitudinal data can be obtained by contacting Richard Barry, Director of Institutional Research, Planning, and Assessment via email ([email protected]) or phone x6532.
Overall Class of 2020 Graduates 358 100%
Concentrations Completed
Concentrations Completed 22 100% At Bryn Mawr 19 86% At Haverford 3 14%
Concentrations by Field
At Bryn Mawr
At Haverford
Gender and Sexuality Studies 3 Middle Eastern Studies 6 Neuroscience 10 Peace, Conflict, and Social Justice 2 Scientific Computation 1
Office of Institutional Research, Planning, and Assessment Report Updated On | 1/21/2021
Undergraduate | Graduating Class Graduation Rates 2020 Historic, longitudinal data can be obtained by contacting Richard Barry, Director of Institutional Research, Planning, and Assessment via email ([email protected]) or phone x6532.
Overall Incoming 2014 Cohort 351 Acceptable Exclusions 0 2014 Cohort After Exclusions 351 Graduated in 4 or Fewer Years 280 4-Year Graduation Rate 79.8%
Graduated in 5 or Fewer Years 5-Year Graduation Rate
292 83.2%
Graduated in 6 or Fewer Years 6-Year Graduation Rate
298 84.9%
Exclusions from the Incoming Cohort counts include any student who did not persist for the following reasons: deceased, permanently disabled, armed forces, foreign aid service of the federal government, or official church missions.
Office of Institutional Research, Planning, and Assessment Report Updated On | 1/21/2021