3. BRAIN DRAIN “Malaysia faces an exodus of talent. Not only is our education system failing to deliver the required talent, we have not been able to retain local talent of all races nor attract foreign ones due to poor prospects and a lack of high-skilled jobs." (NEAC, 2010a, p.60) Human capital is the bedrock of the high-income economy. As Malaysia prepares to join the league of high-income nations, it is embarking upon a structural transformation of its economy that relies on skill-intensive and innovation-led growth. Unsurprisingly, the agenda of human capital development has taken center stage in the reform agenda. For Malaysia to meet the requirements of its new growth model, it will need to develop, attract and retain talent. Against this backdrop, brain drain—or the cross-border migration of talent—poses a specific challenge. If indeed there has been and continues to be an ‘exodus of talent’ as the quote above suggests, the brain drain could well be a major stumbling block in Malaysia’s journey towards high income. Indeed, the outflow of talent does not seem to square with what is needed domestically: a skilled, entrepreneurial and creative labor force that helps propel value added. Brain drain has long been a subject of debate and controversy, but few studies have characterized the phenomenon in the Malaysian context—be it in terms of magnitude, impact or policy response. As Danny Quah of the London School of Economics remarked in a recent New York Times interview, “people have left, growth prospects have dimmed, and then more people continue to leave… It is a vicious cycle that the economy has had to confront for the last decade or longer” (Gooch, 2010). These observations alone lead to three sets of questions The fact that “people have left” is largely uncontested. But what is the magnitude and intensity of Malaysia’s brain drain, what are its characteristics and for what reasons do people emigrate? “Growth prospects have dimmed.” This may be true, but is brain drain a fundamental cause or a symptomatic consequence? Is brain drain necessarily negative? What is the overall impact? If indeed brain drain is responsible for “a vicious cycle”, how can Malaysia break out of this cycle? Is there a role for policy? What would these policies consist of? This Chapter attempts to address these questions in the following sequence. It first places the brain drain in the global context, highlighting that brain drain is far from unique to Malaysia. Next it presents new estimates, based on the latest information available, of the magnitude of the Malaysian diaspora and brain drain. It then examines the economic impact of brain drain, where the significance of Malaysia’s brain drain, the channels of economic impact, and the overall effect on human capital formation are considered. Finally, it offers broad policy suggestions, which are anchored on the underlying determinants of brain drain and distinguish between comprehensive and targeted approaches.
Transcript
3. BRAIN DRAIN
“Malaysia faces an exodus of talent. Not only is our education system failing to deliver the required talent, we have not been able to retain local talent of all races nor attract foreign ones due to poor prospects and a lack of high-skilled jobs." (NEAC, 2010a, p.60)
Human capital is the bedrock of the high-income economy. As Malaysia prepares to join the league
of high-income nations, it is embarking upon a structural transformation of its economy that relies on skill-intensive and innovation-led growth. Unsurprisingly, the agenda of human capital development has taken center stage in the reform agenda. For Malaysia to meet the requirements of its new growth model, it will need to develop, attract and retain talent.
Against this backdrop, brain drain—or the cross-border migration of talent—poses a specific
challenge. If indeed there has been and continues to be an ‘exodus of talent’ as the quote above suggests, the brain drain could well be a major stumbling block in Malaysia’s journey towards high income. Indeed, the outflow of talent does not seem to square with what is needed domestically: a skilled, entrepreneurial and creative labor force that helps propel value added.
Brain drain has long been a subject of debate and controversy, but few studies have characterized
the phenomenon in the Malaysian context—be it in terms of magnitude, impact or policy response. As Danny Quah of the London School of Economics remarked in a recent New York Times interview, “people have left, growth prospects have dimmed, and then more people continue to leave… It is a vicious cycle that the economy has had to confront for the last decade or longer” (Gooch, 2010).
These observations alone lead to three sets of questions
The fact that “people have left” is largely uncontested. But what is the magnitude and intensity of Malaysia’s brain drain, what are its characteristics and for what reasons do people emigrate?
“Growth prospects have dimmed.” This may be true, but is brain drain a fundamental cause or a symptomatic consequence? Is brain drain necessarily negative? What is the overall impact?
If indeed brain drain is responsible for “a vicious cycle”, how can Malaysia break out of this cycle? Is there a role for policy? What would these policies consist of?
This Chapter attempts to address these questions in the following sequence. It first places the brain drain in the global context, highlighting that brain drain is far from unique to Malaysia. Next it presents new estimates, based on the latest information available, of the magnitude of the Malaysian diaspora and brain drain. It then examines the economic impact of brain drain, where the significance of Malaysia’s brain drain, the channels of economic impact, and the overall effect on human capital formation are considered. Finally, it offers broad policy suggestions, which are anchored on the underlying determinants of brain drain and distinguish between comprehensive and targeted approaches.
MALAYSIA ECONOMIC MONITOR
84
BRAIN DRAIN AS A GLOBAL PHENOMENON
The latest information on global migrant stocks suggests that 215 million people live outside their country of birth (Table 3.1) (see Box 8 on the definitions of the brain drain).47 This amounts to about 3 percent of the world’s population. The migrant population from developing countries alone totals 171 million, accounting for 80 percent of all migrants. Migration patterns vary significantly across regions (Figure 3.1). South-South migration represents 43 percent of migration originating in developing countries, with the remainder absorbed mainly by OECD high-income economies. Migrants from high-income economies typically migrate to other high-income economies. Interestingly, South-South migration seems to matter much less for countries in East Asia and Latin America, unlike other regions where one third up to two thirds of all migration is to developing countries.
Table 3.1. Developing countries are the main contributors to global migration
Global migrant stock estimates, 2010, millions and percentage shares
Migrants living in:
Developing
High-income OECD
High-income non-OECD
Total
Migrants from (millions):
Developing 74.0 73.3 24.2 171.6
High-income OECD 5.1 31.1 1.2 37.3
High-income non-OECD 1.4 5.1 0.3 6.9
Total 80.5 109.5 25.7 215.8
Migrants from (percentage shares):
Developing 43.1 42.8 14.1 100
High-income OECD 13.6 83.3 3.1 100
High-income non-OECD 20.9 74.1 5.0 100
Source: World Bank (2011c).
47
Unless otherwise specified, the estimates reported in this first section are based on the World Bank’s Migration and Remittances Factbook (see World Bank, 2011). The headline estimate of 215 million as of 2010 compares to an earlier estimate of 191 million (Ratha and Shaw, 2007). The Dumont, Spielvogel and Widmaier (2010) Database on Immigrants in OECD Countries-Enhanced (“DIOC-E”) dataset puts the total stock of migrants in OECD countries at about 125 million.
BRAIN DRAIN
85
Figure 3.1. The patterns of migration vary across regions
Share of migrants from region (vertical axis) to selected group of countries (legend), 2010, percent
Source: World Bank (2011c).
BOX 8. WHAT IS BRAIN DRAIN?
In line with the approach taken by Carrington and Detragiache (1998), Docquier and Rapoport (2004), and Docquier and Rapoport (2011), brain drain is defined as the emigration of high-skill individuals, where a high-skill emigrant is a foreign-born individual, aged 25 or more, with an academic or professional degree beyond high school (i.e. ‘post-secondary’ or ‘tertiary educated’) at the census or the survey date.
Another working definition of a person classified as a ‘brain drain’, as articulated in Grubel and Scott
(1976), is a person who has the “intention of holding permanent employment in a country other than the one in which he was educated up to a specified, high level.” More practically, brain drain simply refers to the migration of highly-skilled workers as measured by their level of educational attainment, typically at the level of Bachelor’s degree or higher.
This Chapter adopts the first definition (i.e., a foreign-born individual, aged 25+ and tertiary-
educated at the census or survey date), but it is worth highlighting that this definition poses a number of limitations:a
Illegal immigration. The definition does not capture illegal immigration. While illegal immigration could potentially distort the statics, it is unlikely to have a major impact on the data for high-skilled migrants, who have a greater propensity to migrate through conventional, legal channels. In addition, illegal immigration may be rather volatile and some of this volatility in the flows may wash out when considering the stocks of immigrants.
Source of education. The definition assumes that all foreign-born individuals that have obtained an academic or professional degree are included in the brain drain number, irrespective of where their education was acquired. This potentially significant problem may cause the brain drain numbers to be overestimated if migrants obtained their degree at destination, after
63
55
32
28
15
13
25
31
40
24
55
85
3
7
23
34
26
1
0 20 40 60 80 100
Sub-Saharan Africa
Europe & Central Asia
Middle East & North Africa
South Asia
East Asia & Pacific
Latin America & Caribbean
Within region High-income OECD High-income non-OECD
Other developing regions Unidentified
MALAYSIA ECONOMIC MONITOR
86
migrating. If migrants arrived after having received their education at home, then this is a more serious phenomenon because the home country spent resources educating these individuals but is not reaping the social dividend on their investment in human capital. Corrections based on the date of entry of immigrants, as a proxy for whether education was acquired in the home or host country, may shed light on the magnitude of this bias. Immigrant surveys may provide further insight.
Heterogeneity in human capital levels. The definition equates the notion of high-skill with having obtained an academic or professional degree, but does not make any further differentiation on the actual skill level of the migrant. To put it simply, foreign-born individuals are considered ‘brain drain’, independent of what they are actually doing in the recipient country and there may be ‘brain wastage’ as well. Field of study, type of degree, actual occupation and work experience all matter greatly and perhaps more so than the binary consideration whether or not the migrant has a tertiary degree.
Additional complications arise in connection with the measurement of migratory flows more
generally:
Lack of uniformity in data collection. There is also no uniformity in the practices of various destination countries when it comes to collection of census data. Some countries ask for country of birth while others ask for country of citizenship. This poses particular issues when attempting to compare numbers across countries and also over time, where in some cases a jurisdiction may have switched from collecting country of citizenship to country of birth (such as in the case of Singapore from the 1990 census onwards).
Foreign-born migrants versus foreign citizens who are migrants. Consider a US expatriate of Caucasian ethnicity has a child during her stay in Malaysia and afterwards returns to the US. The child will be counted as a Malaysian-born migrant. Looking at the US census returns for 2000, it seems that the number of such individuals, while not many, is by no means trivial. Out of 49,460 Malaysian-born migrants, 3,335 were not of Asian ethnicity. In other words, 6.7 percent of the stock of Malaysian-born migrants in the US were not considered ‘migrants’ in the sense of ethno-cultural transition to a different country.
Note:
a The discussion draws upon Docquier and Rapoport (2011) and Docquier and Marfouk (2006).
BRAIN DRAIN
87
Figure 3.2. The evolution of migration also differed across regions
Emigration rates of high-skilled 25+ olds to six main receiving OECD countries, percent
Source: Defoort (2008).
Zooming in on a subset of the world’s migrants (namely those aged 25+ and migrating to OECD
countries), Table 3.2 and Figure 3.2 show the evolution of the intensity of high-skill emigration across country groups over the period 1990 to 2000. A number of interesting conclusions emerge:48
While migrant stocks have been on the rise everywhere, the intensity of brain drain—as measured by the emigration rate—has not necessarily increased as much. This may be explained by improvements in educational attainment, since the emigration rate of high-skill labor compares the stock of high-skill migrants abroad with the stock of high-skill residents before migration.49
Emigration rates are the highest in middle-income countries, which have both the incentive and the means to migrate. High-income and low-income countries have typically lower rates, even if the rate of brain drain seems to have picked up significantly for low-income countries. Lower rates would be expected for high-income countries as incentives would be less strong. For low-income countries financial and human capital constraints may make emigration less likely .
Geographically, the regions most affected by brain drain are the Caribbean, the Pacific, sub-Saharan Africa and Central America. Within Asia, the brain drain is most pronounced in Southeast Asia.
48
Docquier and Rapoport (2011). 49
Defoort (2008). Recent research on high-skill migration to six major destination countries (USA, Canada, Australia, Germany, UK and France) between 1975 and 2000 suggests that migration rates increased for all education categories but that general improvements in educational attainment have reduced selection biases around the world.
0
2
4
6
8
10
12
14
16
1975 1980 1985 1990 1995 2000
Central America Sub-sahara Africa
South East Asia Northern Africa
West Asia South and central Asia
South America East Asia
Eastern Europe
MALAYSIA ECONOMIC MONITOR
88
Table 3.2. High-skill emigration has been on the rise worldwide
Emigration stocks and rates to OECD countries of emigrants aged 25+
Source: Docquier, Lowell and Marfouk (2009). Note: High-skill refers to college graduates.
Brain drain is widely credited as a facet of globalization. But to what extent is this true?
Compared with the cross-border flow of trade and capital, globalization has had little effect on the migration of people. Over the period 1960-2000, the international migrant population rose at the same pace as the world’s population, with the world emigration rate rising only from 2.5 to 2.9 percent and this was mostly explained by the break-up of the Soviet Union. In contrast, world trade to GDP tripled over the same period, whereas FDI to GDP tripled just in the 1990s.50
50
Docquier (2011) and Ozden et al. (2011).
BRAIN DRAIN
89
The picture completely changes if we focus the cross-border flow of skilled people— brain drain. Table 3.2 points to a stock of 20 million highly skilled migrants in 2000 who are educated at tertiary level, were born abroad and now live in the OECD countries. Compare this to 1990: the stock back then was only 12 million. This fast growth of 70 percent occurred over the span of a single decade, at about double the rate of increase of low-skilled migrants.51
MAGNITUDE OF BRAIN DRAIN
Clearly the brain drain is by no means unique to Malaysia, but how large is it then? What is the magnitude of Malaysia’s diaspora—the worldwide assortment overseas of men, women and children born in Malaysia? How many among them are skilled and can be considered as part of the brain drain? These are the questions that this section will attempt to address.
Estimating the magnitude of Malaysia’s diaspora and brain drain is a complex undertaking. Over the
last decade significant progress has been made in statistical efforts to document the cross-border flow of people and skills. In spite of this, international migration data remains spotty and imprecise, particularly compared to data on capital and trade flows. Underreporting of irregular migration, reporting lags in census data, and cross-country variations in the very definition of a migrant all affect the quality, availability, timeliness and comparability of the data. Statistical discrepancies remain an important limiting factor.
Given these complexities, quantifying Malaysia’s diaspora and brain drain with a single point
estimate would convey a false sense of precision. Instead, this chapter provides a ball-park range for extent of the diaspora and brain drain and it also provides a judgment as to which numbers are more likely than others. The estimates are constructed along the following steps:
- A first glance at the data. We first examine the numbers as they come in directly from
national statistical offices and other reputable sources. Based on these, we measure the size of the Malaysian diaspora and brain drain, its key characteristics, and the evolution over the past three decades. We provide an updated picture on the basis of the most recent information available, including Singapore’s census results which were released early 2011. The estimates derived in this way serve as a baseline for further analysis.
- Scenario-based estimates. Further analysis is required because of two critical missing pieces in the puzzle: first, the evolution of migrant stocks between the latest data release and 2010; and second, the share of Malaysian-born individuals in Singapore’s nonresident population which makes up a quarter of Singapore’s population. To address these gaps in our understanding, we extrapolate the latest numbers to 2010 using an assumption of moderate growth. We also construct scenarios to provide a structured and transparent view on the ‘known unknowns’ about Singapore’s nonresident population. Based on these scenarios we arrive at a range of estimates of the diaspora and brain drain—worldwide and current as of 2010.
51
Docquier and Rapoport (2006).
MALAYSIA ECONOMIC MONITOR
90
A First Glance at the Data
In what follows, we present the data as it presents itself—from national statistical authorities and alternative reputable sources. We first discuss the overall diaspora, disregarding the skill composition of migrants. Following this, we present the results on brain drain, zooming in on the subset of skilled migrants.
Diaspora Is Large, Mainly Concentrated in Singapore
Table 3.3 provides a snapshot overview of the Malaysian diaspora –the full overview is presented in Appendix A. The table shows eight countries and lumps the other twenty-four countries for which we collected data into a residual category. The information is presented at decade intervals, starting in 1980. Most countries have information available up to 2000, as the 2010 census is still ongoing for most countries. However, some (most notably Singapore) have already completed this and others provide intermediate data based on by-censuses and surveys. In what follows, the aggregate numbers are analyzed according to two types of country samples: the balanced sample is for comparisons over time (including only countries that have data for the full 1980-2000 period); the unbalanced sample is for analysis within a year (including all countries reporting data for that year).
Table 3.3. The Malaysian diaspora is spread out around the world, but concentrated in Singapore
Size of the diaspora (age 0+), by country of destination and over time, numbers
Source: United Nations Population Department (UNPD) International Migration Database, Ozden, Parsons, Schiff and Walmsley (OPSW, 2011) and National Statistical Offices. See Appendix A for details.
Note: Complete dataset in Appendix Table A1. Diaspora refers to the stock of Malaysian-born migrants, regardless of skill profile. This table shows the diaspora numbers for those aged 0+. Balanced sample
consists of all countries that have data for 1980, 1990 and 2000 (this should be used for comparison over time). Unbalanced sample is the simple in-year total. Data is based on country of birth, except for Singapore (1980. Observations for 1980 and 1990 may be of one year earlier or later depending on census. Entries in 2000 for Australia, Hong Kong, India, New Zealand and United Kingdom are as of 2001. The 2007 observation for United Kingdom is a survey estimate.
BRAIN DRAIN
91
Figure 3.3. In 2000, the five largest destination countries hosted 80 percent of the diaspora
Country share in 2000 diaspora, per cent
Source: Appendix Table A1 and World Bank staff calculations. Note: Rest of the world consists of all countries listed in the previous Table. For Singapore, resident population only.
Table 3.4. Brisk growth in 1980s was followed by a decade of slower, but still strong, growth
Annualized growth in migrant stock by destination, percent
1980-1990 1990-2000
Balanced sample total 4.2 3.6
United States 11.6 4.6
Canada 10.9 2.4
New Zealand 10.3 2.7
Australia 8.7 0.8
Singapore 5.0 4.5
Brunei 1.1 3.7
United Kingdom -0.4 1.4
India -7.0 2.6
Other countries 2.1 8.6
Source: Appendix Table A1 and World Bank staff calculations. Note: Total refers to the balanced sample of countries for which data is available 1980 through 2000: countries shown and other countries (China, Germany, Indonesia, Pakistan, Sweden and Vietnam). Together they make up 93 percent of the world total.
A first observation from this overview is that the Malaysian diaspora is not only significant but also
highly concentrated (Table 3.4 and Figure 3.3). The (unbalanced) sample total for 2000—which is the most recent year where information is consistently available across countries—indicates a diaspora of 657 thousand people. As of that year, Singapore alone represented 46 percent of the worldwide diaspora—and this accounts for just the Malaysian-born migrants that are registered as Singapore residents. The distant second is Australia, accounting for 12 percent, and the third spot is shared by Brunei, the United Kingdom and the United States, each with a share of about 8 percent. The five top destinations alone account for 83 percent of the entire diaspora.
After Brisk Growth, Migration Momentum Slowed
A further observation is that not only the numbers are large and concentrated, the diaspora has also expanded rapidly over time, even though momentum has decelerated somewhat (Table 3.5). The decade-on-decade growth numbers suggest the diaspora expanded rapidly in the 1980s and the 1990s at annualized rates of 4.2 and 3.6 percent, respectively. The diaspora in 1990 was some 50 percent larger than it was in 1980. This growth continued, although at a slightly slower pace, and in 2000 the diaspora was some 40 percent larger than it was in 1990.
These aggregates mask some remarkable fluctuations in the composition of the diaspora. The
United States, Canada, New Zealand and Australia rose to prominence in the geographical reach of the diaspora, at 10-percent annual growth for a whole decade during the 1980s and outpacing Singapore by a considerable margin. In the 1990s, however, that pace slowed to more sustainable rates, even though it is still high for some. Growth in Singapore’s resident migrant population, on the other hand, remained quite stable over these historical periods, growing at around 5 percent per year. These differential trends explain why Singapore’s share in the diaspora fluctuated between 41 and 46 percent over these decades.
7.7%
1.7%
2.2%
2.4%
3.1%
8%
8%
9%
12%
46%
0% 10% 20% 30% 40% 50%
Rest of the world
New Zealand
India
Hong Kong
Canada
United Kingdom
United States
Brunei
Australia
Singapore
83%
MALAYSIA ECONOMIC MONITOR
92
Table 3.5. Migration to New Zealand, UK and Australia accelerated in 2000s, but slowed to Singapore Annualized growth in migrant stock by destination, percent
1980-1990 1990-2000 2000-latest
New Zealand 10.3 2.7 4.9
United Kingdom -0.4 1.4 3.4
Australia 8.7 0.8 3.2
Singapore 5.0 4.5 2.4
Canada 10.9 2.4 1.2
United States 11.6 4.6 1.1
Hong Kong .. 2.0 -1.2
Source: Appendix Table A1 and World Bank staff calculations. Note: Periods for recent growth rates vary: 2000-05 for the United States, 2000-06 for Canada, 2001-06 for Australia, Hong Kong and New Zealand, 2001-07 for the United Kingdom and 2000-2010 for Singapore.
Figure 3.4. Higher-frequency data for mainly smaller countries points to mixed effects of crisis
Annualized growth in migrant stock by destination, percent
Source: Appendix Table A1 and World Bank staff calculations. Note: Different dates for Austria (2001-2007 and 2007-2009) and Ireland (2002-2006 and 2006-2010).
How did migration momentum evolve over the most recent period of the 2000s? We unfortunately
do not have a comprehensive picture, but the recent information available is representative enough given that Singapore has released its 2010 census and the other main destination countries report intermediate data during the second half of the decade.52 Table 3.5 is instructive in this respect. Importantly, growth momentum has slowed in Singapore—which is based on information spanning the full decade. Yet, for New Zealand, United Kingdom and Australia momentum picked up significantly. Canada and the United States, however, saw a deceleration.
Did the recent global and financial crisis affect migration momentum? This is an even harder
question to address given the data constraints. However, we can shed some light on the issue by examining the time series of migration to a number of European countries which collect data on migrant stocks by country of birth on a higher-frequency basis (given the small sample sizes, results may not be representative). Considering the pre-crisis period of 2000-2007 and the crisis-period 2007-2010, Figure 3.4 suggests a mixed picture. Scandinavian countries, some of whom registered negative growth in the late 2000s, attracted more during the crisis-period—although admittedly from a low base. Austria and the Netherlands registered the slowdown one would expect. Ireland, which was also the most affected country in the sample, saw rapid pre-crisis growth completely reversed.
52
Given that the recent information is not available at one common date, no common sample is constructed.
4% 4%
3% 3%3%
9%9%
7%
5%
2% 1%
-10%
-10%
-8%
-6%
-4%
-2%
0%
2%
4%
6%
8%
10%
2000-2007
2007-2010
DenmarkFinland
Sweden
NetherlandsAustria
Ireland
BRAIN DRAIN
93
Table 3.6. The brain drain is spread around the world, but concentrated again in Singapore
Size of the diaspora and brain drain (both age 25+), by country of destination and over time, numbers
1990 2000 2010
Diaspora Brain drain
Diaspora Brain drain Diaspora Brain drain
Balanced sample total 347,403 99,306 479,064 164,884 .. ..
Unbalanced sample total 347,403 99,306 524,613 184,121 .. ..
Singapore (resident only) 185,906 19,005
286,048 66,452 350,672 121,662
Australia 44,984 35,366
56,961 38,620 .. ..
United States 17,725 13,745
36,994 24,085 .. ..
United Kingdom 31,130 15,328
38,147 12,898 .. ..
Canada 12,150 8,480
17,150 12,170 .. ..
Brunei 49,439 3,142
36,216 6,438 .. ..
New Zealand 6,069 4,239
7,548 4,221 .. ..
Other countries .. ..
45,549 19,130 .. ..
Source: SingStat (2011), Docquier, Marfouk, Özden and Parsons (2010), and Docquier, Lohest and Marfouk (2007).
Note: Complete data set is provided in Appendix Table A2. Diaspora refers to the stock of Malaysian-born migrants, regardless of skill profile. This table shows the diaspora numbers for those aged 25+. Brain drain refers to the stock of tertiary educated Malaysian-born migrants, aged 25+. Total skilled migrants in Singapore aged 25+ (121,662) is based on tertiary educated resident nonstudents aged 15+. This assumes that the 15-24 year old age group has not (or not yet) completed tertiary studies.
But Brain Drain Was Magnified by Changing Patterns in Skill Selectivity
If the diaspora is large, concentrated and expanding, what does this imply for brain drain? Table 3.6 provides the information available on skilled migration—the full overview is again
available in Appendix A. The data presented here concerns the population that is 25 years old and above—the category commonly considered in the brain drain literature. 53 Note that the data reported from the sources referenced in the table above is also for the 25+ category, whereas in remainder of this Chapter the 0+ category is used. The table presents the 1990 data for seven countries (the key destination countries), the 2000 data for a larger group of twenty-six countries (full set in appendix) and the 2010 data for Singapore based on the recent census. The balanced sample consists of the seven countries reported in the table.
A few observations stand out when examining the aggregate numbers. It appears that the brain
drain is not overwhelmingly large, especially when compared to the overall size of the diaspora. As of 2000, there were some 184 thousand tertiary-educated individuals among the 25+ population that at some point left Malaysia. Thus, about a third of the 25+ diaspora in 2000 can be considered as brain drain. During the 1990s, migration became more skill-intensive: the share of skilled migrants from 28.5 percent in 1990 to 34.2 percent in 2000 (using the balanced sample numbers). The absolute stock of skilled migrants rose rapidly, at 5.2 percent annually, which led to a 60 percent overall increase on the decade.
53
The group aged 25+ thus excludes students who temporarily moved abroad to complete their studies. If the objective is to analyze the economic impact of migration, focusing on the 25+ group is appropriate since this group correlates well with the economically active part of the population.
MALAYSIA ECONOMIC MONITOR
94
Figure 3.5. In traditional diaspora destinations, skill intensities are low, but catching up quickly
Share of skilled migrants at destination in total migrants at destination, 25+, percent
Source: Appendix Table A2 and World Bank staff calculations Note: The latest observation for Singapore is 35 percent in 2010.
Figure 3.6. Despite low skill intensity, Singapore accounts for most of the brain drain Share of skilled migrants at destination relative to total skilled migration, 25+, percent
Source: Appendix Table A2 and World Bank staff calculations. Note: Aggregate is for 2000 value.
A number of noteworthy patterns emerge when looking underneath the aggregates (Figure 3.5):
Skill intensity varies widely across destinations. Malaysian-born migrants in Brunei and Singapore are generally low-skilled, with only about a fifth of them tertiary. The low skill shares for Brunei and Singapore are what one might expect: more well-developed diaspora communities typically serve as a basin of attraction for lower-skilled migration—a result observed around the world. The results for Brunei and Singapore can be contrasted with those for OECD countries, where the skill intensity of migration is higher and ranges to levels around 70 percent.
Skill shares evolved differently across destinations. For OECD countries there has generally been a decrease in the share of skilled labor, which means that low-skilled migrant stocks have risen more quickly. For Brunei and Singapore, the opposite results obtains, where migration is becoming more skill selective. This suggests that there is a degree of convergence in the skill-intensity of migratory patterns between OECD countries and the diaspora communities in Brunei and Singapore. 54
Singapore is the main magnet for skilled migrants out of Malaysia, but this has not always been the
case (Figure 3.6). Because of the large difference in skill intensity in 1990, Australia was the top destination country for skilled migration. However, as the skill intensities subsequently converged, skilled migration to Singapore saw an enormous increase. As a result, Singapore came to account for 40 percent of all the brain drain as of 2000, a marked increase from the 19 percent share a decade earlier. Therefore, as with the diaspora, brain drain is concentrated in just a few destination countries. Singapore, Australia and the United States account for almost 80 percent of the brain drain.
54
The low skill share of the United Kingdom may be related to historical ties that have led to a significant diaspora community. It comes as a surprise however that the skill intensity did not increase.
6%10%
49%
70%
78% 79%
70%
18%
23%
34%
56%
65%68%
71%
0%
20%
40%
60%
80%
Brunei UK New Zealand
USA Australia Canada
1990
2000
S'pore
3%
4%
7%
8%
15%
23%
40%
4%
3%
9%
15%
14%
36%
19%
0% 10% 20% 30% 40%
New Zealand
Brunei
Canada
UK
USA
Australia
S'pore
1990
2000
78.3%
BRAIN DRAIN
95
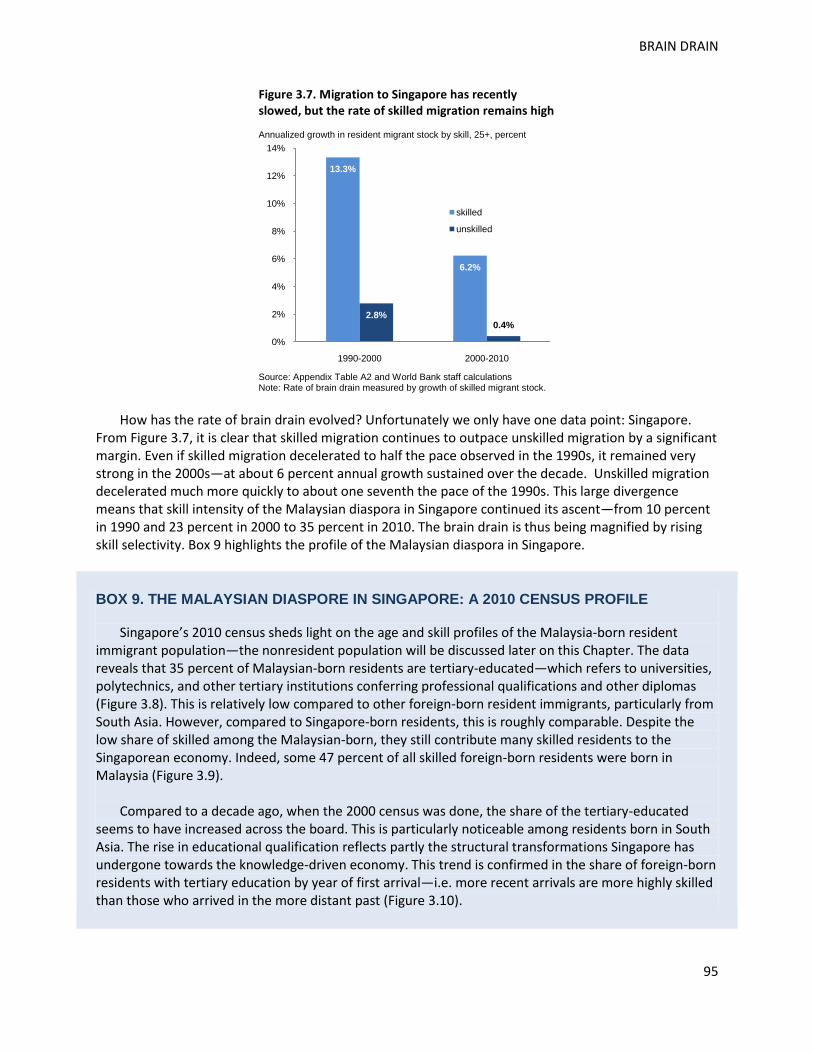
Figure 3.7. Migration to Singapore has recently slowed, but the rate of skilled migration remains high
Annualized growth in resident migrant stock by skill, 25+, percent
Source: Appendix Table A2 and World Bank staff calculations Note: Rate of brain drain measured by growth of skilled migrant stock.
How has the rate of brain drain evolved? Unfortunately we only have one data point: Singapore.
From Figure 3.7, it is clear that skilled migration continues to outpace unskilled migration by a significant margin. Even if skilled migration decelerated to half the pace observed in the 1990s, it remained very strong in the 2000s—at about 6 percent annual growth sustained over the decade. Unskilled migration decelerated much more quickly to about one seventh the pace of the 1990s. This large divergence means that skill intensity of the Malaysian diaspora in Singapore continued its ascent—from 10 percent in 1990 and 23 percent in 2000 to 35 percent in 2010. The brain drain is thus being magnified by rising skill selectivity. Box 9 highlights the profile of the Malaysian diaspora in Singapore.
BOX 9. THE MALAYSIAN DIASPORE IN SINGAPORE: A 2010 CENSUS PROFILE
Singapore’s 2010 census sheds light on the age and skill profiles of the Malaysia-born resident immigrant population—the nonresident population will be discussed later on this Chapter. The data reveals that 35 percent of Malaysian-born residents are tertiary-educated—which refers to universities, polytechnics, and other tertiary institutions conferring professional qualifications and other diplomas (Figure 3.8). This is relatively low compared to other foreign-born resident immigrants, particularly from South Asia. However, compared to Singapore-born residents, this is roughly comparable. Despite the low share of skilled among the Malaysian-born, they still contribute many skilled residents to the Singaporean economy. Indeed, some 47 percent of all skilled foreign-born residents were born in Malaysia (Figure 3.9).
Compared to a decade ago, when the 2000 census was done, the share of the tertiary-educated
seems to have increased across the board. This is particularly noticeable among residents born in South Asia. The rise in educational qualification reflects partly the structural transformations Singapore has undergone towards the knowledge-driven economy. This trend is confirmed in the share of foreign-born residents with tertiary education by year of first arrival—i.e. more recent arrivals are more highly skilled than those who arrived in the more distant past (Figure 3.10).
13.3%
6.2%
2.8%0.4%
0%
2%
4%
6%
8%
10%
12%
14%
1990-2000 2000-2010
skilled
unskilled
MALAYSIA ECONOMIC MONITOR
96
Figure 3.8. The share of Malaysian-born residents educated post-secondary is relatively low, but rising
Share of tertiary-educated among resident non-students in Singapore aged 15+, within county of origin, 2000-2010 (percent)
Source: SingStat (2010). Note: China statistics include Hong Kong SAR and Macao SAR. South Asia includes India, Pakistan, Bangladesh and Sri Lanka.
Figure 3.9. Yet, Malaysia-born residents still make up a large share of skilled born outside Singapore.
Share of tertiary-educated by country of birth in total foreign-born resident non-student population in Singapore aged 15+, 2010 (percent)
Source: SingStat (2010). Note: China statistics include Hong Kong SAR and Macao SAR. South Asia includes India, Pakistan, Bangladesh and Sri Lanka.
Figure 3.10. Educational standards among fresh arrivals are now much better than they used to be
Share of tertiary-educated non-students aged 15+ born outside Singapore by year of first arrival (percent)
Source: SingStat (2010).
Figure 3.11. The share of Malaysian-born residents aged 55 and over is relatively high
Share of age group within residents of selected country of origin, 2010 (percent)
Source: SingStat (2010). Note: China statistics include Hong Kong SAR and Macao SAR. South Asia includes India, Pakistan, Bangladesh and Sri Lanka.
The age profile for Malaysian-born resident is tilted towards the age 55-and-over category; the same
pattern holds for China (Figure 3.11). The share of youngsters is low among Malaysian-born residents. This is likely related to the long history of migration from Malaysia and China to Singapore.
23% 22%26%
46%
23%
35% 33%
44%49%
74%
0%
20%
40%
60%
80%
Malaysia Singapore China Indonesia South Asia
2000
2010
47%
20%14%
6%13%
0%
10%
20%
30%
40%
50%
60%
Malaysia China South Asia Indonesia Other
2% 6% 8%15%
27%
38%
59%
0%
10%
20%
30%
40%
50%
60%
Before 1941
1941 -1950
1951 -1960
1961 -1970
1971 -1980
1981 -1990
1991 -2000
9%
16%18%
22%
35%31%
33%
21%
12%
19%
0%
10%
20%
30%
40%
Malaysia China Indonesia South Asia Singapore
Aged less than 25
Aged 55 or more
BRAIN DRAIN
97
Scenario-Based Estimates
Based on the information available, the previous part established a common baseline estimate for the magnitude of Malaysia’s diaspora and brain drain. In what follows, we refine this baseline by considering ways to deal with two missing pieces of the puzzle:
- What are the stocks of Malaysian-born skilled and unskilled migrants as of 2010? For most countries information on the size of the diaspora is not up-to-date. For all countries, except Singapore, information on the skills break-down is missing.
- How significantly represented is the Malaysian diaspora and brain drain among the nonresident population of Singapore? The nonresident population in Singapore is large, but no information is available on the composition of the nonresidents.
To deal with these uncertainties, we extrapolate the baseline estimates to 2010 with an assumption
of moderate growth. We also construct scenarios to estimate the likely magnitude of Malaysian-born nonresidents in Singapore. Based on these two extensions, we present estimates for the worldwide diaspora and brain drain as of 2010
Estimates Are Extrapolated to 2010 on the Basis of Moderate Growth
Two further steps are required to estimate the 2010 diaspora numbers. First, we need to incorporate the most recent information that has been released already. As mentioned, most of the important destination countries have more recent information than 2000 and Singapore has released the 2010 data. Second, we need to extrapolate the latest information available into a 2010 number based on certain growth assumptions. This growth assumption is applied throughout the entire decade for those countries that report data only for 2000. In cases where we have more recent information, the growth assumption is applied to the rest of the decade.
In what follows, the numbers are extrapolated on the basis of a 2.4 percent growth rate. This
number is motivated by several factors. First, resident migrants stocks in Singapore grew at this rate. Second, the most recent data available suggests that other destination countries have grown, on average, at a rate close to 2.4 percent. There has been some marked variation in growth patterns among these other destination countries—a point that will be discussed later—but this largely averages out and settles at a rate close to the assumed growth rate.
Estimating the 2010 brain drain requires additional manipulations. The first is to transform the 0+
diaspora estimate for 2010 into a 25+ estimate. Here we make a conservative assumption of a 75 percent scale factor (share of 25+ in 0+). This assumption is based on the information we have as of 2010 for Singapore (scale factor of 90.9 percent), 2006 for Australia (74.9 percent) and 2005 for the United States (85.5 percent). We choose the lowest among these, so as not to bias the results upwards. The second is to transform the 25+ diaspora population into the 25+ skilled diaspora population (brain drain). Here take advantage of the observed 25+ skill shares for 2000. It is thus assumed that over the course of the decade the skill share did not increase, which again is likely to bias the estimates to the downside.
MALAYSIA ECONOMIC MONITOR
98
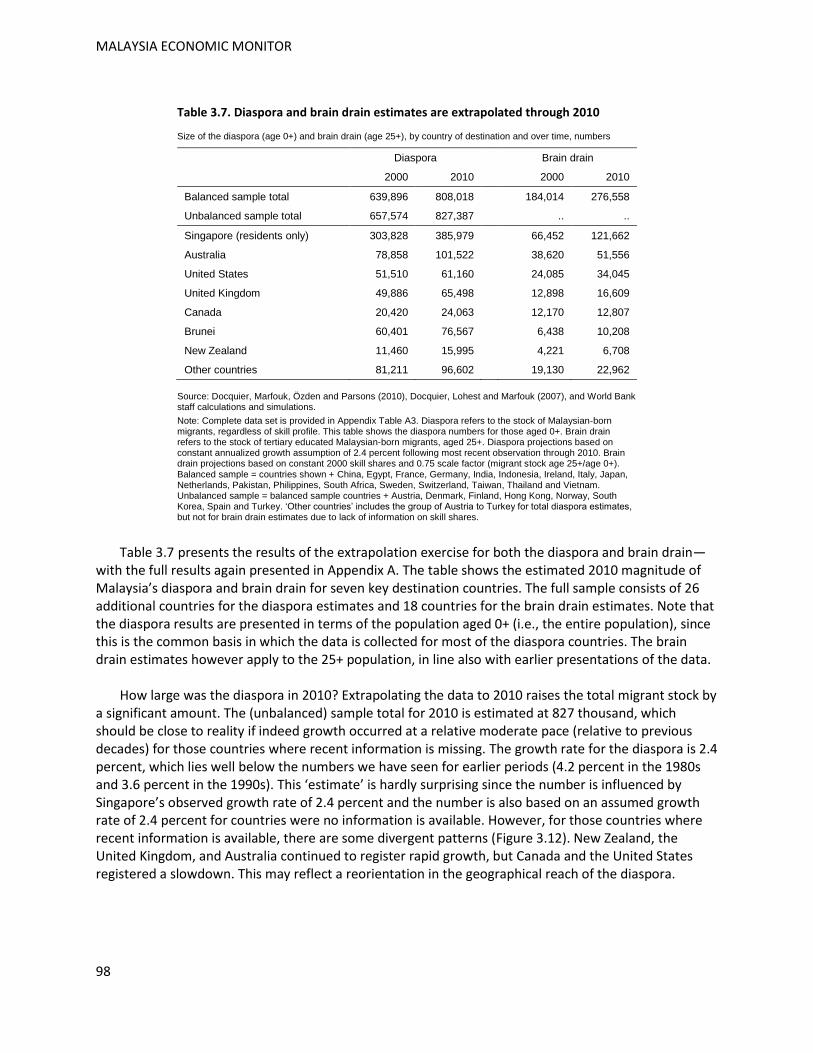
Table 3.7. Diaspora and brain drain estimates are extrapolated through 2010
Size of the diaspora (age 0+) and brain drain (age 25+), by country of destination and over time, numbers
Diaspora
Brain drain
2000 2010
2000 2010
Balanced sample total 639,896 808,018
184,014 276,558
Unbalanced sample total 657,574 827,387
.. ..
Singapore (residents only) 303,828 385,979
66,452 121,662
Australia 78,858 101,522
38,620 51,556
United States 51,510 61,160
24,085 34,045
United Kingdom 49,886 65,498
12,898 16,609
Canada 20,420 24,063
12,170 12,807
Brunei 60,401 76,567
6,438 10,208
New Zealand 11,460 15,995
4,221 6,708
Other countries 81,211 96,602
19,130 22,962
Source: Docquier, Marfouk, Özden and Parsons (2010), Docquier, Lohest and Marfouk (2007), and World Bank staff calculations and simulations.
Note: Complete data set is provided in Appendix Table A3. Diaspora refers to the stock of Malaysian-born migrants, regardless of skill profile. This table shows the diaspora numbers for those aged 0+. Brain drain refers to the stock of tertiary educated Malaysian-born migrants, aged 25+. Diaspora projections based on constant annualized growth assumption of 2.4 percent following most recent observation through 2010. Brain drain projections based on constant 2000 skill shares and 0.75 scale factor (migrant stock age 25+/age 0+). Balanced sample = countries shown + China, Egypt, France, Germany, India, Indonesia, Ireland, Italy, Japan, Netherlands, Pakistan, Philippines, South Africa, Sweden, Switzerland, Taiwan, Thailand and Vietnam. Unbalanced sample = balanced sample countries + Austria, Denmark, Finland, Hong Kong, Norway, South Korea, Spain and Turkey. ‘Other countries’ includes the group of Austria to Turkey for total diaspora estimates, but not for brain drain estimates due to lack of information on skill shares.
Table 3.7 presents the results of the extrapolation exercise for both the diaspora and brain drain—
with the full results again presented in Appendix A. The table shows the estimated 2010 magnitude of Malaysia’s diaspora and brain drain for seven key destination countries. The full sample consists of 26 additional countries for the diaspora estimates and 18 countries for the brain drain estimates. Note that the diaspora results are presented in terms of the population aged 0+ (i.e., the entire population), since this is the common basis in which the data is collected for most of the diaspora countries. The brain drain estimates however apply to the 25+ population, in line also with earlier presentations of the data.
How large was the diaspora in 2010? Extrapolating the data to 2010 raises the total migrant stock by
a significant amount. The (unbalanced) sample total for 2010 is estimated at 827 thousand, which should be close to reality if indeed growth occurred at a relative moderate pace (relative to previous decades) for those countries where recent information is missing. The growth rate for the diaspora is 2.4 percent, which lies well below the numbers we have seen for earlier periods (4.2 percent in the 1980s and 3.6 percent in the 1990s). This ‘estimate’ is hardly surprising since the number is influenced by Singapore’s observed growth rate of 2.4 percent and the number is also based on an assumed growth rate of 2.4 percent for countries were no information is available. However, for those countries where recent information is available, there are some divergent patterns (Figure 3.12). New Zealand, the United Kingdom, and Australia continued to register rapid growth, but Canada and the United States registered a slowdown. This may reflect a reorientation in the geographical reach of the diaspora.
BRAIN DRAIN
99
Figure 3.12. Diaspora estimates suggest New Zealand, UK and Australia grew the fastest in 2010 Estimated annualized growth over 2000-2010 in total diaspora, age 0+, by destination, percent
Source: World Bank staff calculations Note: Singapore numbers for resident population only.
Figure 3.13. Brain drain continued to grow rapidly in Singapore and other destinations
Estimated annualized growth over 2000-2010 in skilled migrant stocks, age 25+, by destination, percent
Source: World Bank staff calculations Note: Singapore numbers for resident population only.
How large was the brain drain in 2010? The brain drain continues to grow through 2010 in the
extrapolated scenario. Skilled migration grows from 184 to 276 thousand, at 4.2 percent—a much higher pace than total migration. Interestingly, Singapore grows the fastest (actual data), followed by New Zealand, Brunei and the United States (estimates) (Figure 3.13). Except for Singapore, this growth derives mainly from a rise in the diaspora, not a rise in skill intensity which was pinned down at the 2000 level.
Brain drain estimates for individual countries are sensitive to assumptions. Brunei is a case in point.
The Malaysian diaspora in Brunei in 2010 would be lower if the 2000 estimate of 60 thousand were too high, the growth after 2010 would have been lower than the assumed sample average growth rate of 2.4 percent (compared to 1.1 percent in the 1980s and 4.0 percent in the 1990s) the skill share would have dropped after 2000 (relative to 6 percent in 1980 and 18 percent in 2000), or the scale factor of 25+ to 0+ year-old would have been below the assumed sample average of 75 percent . Some of these conjectures may be likely, but others are not—cancelling out some of the bias. More importantly, such biases may wash out in the aggregate when the entire sample of countries is considered.
Extent of Nonresident Diaspora in Singapore Could Surprise on the Upside
A second missing puzzle concerns Singapore’s nonresident population which has risen rapidly over the last decade and which may constitute a significant portion of the Malaysian diaspora and brain drain. However, the analysis of Singapore’s nonresident population is impaired by the lack of information published on the characteristics of this nevertheless important segment of the population. 55 To remedy this, we construct a number of scenario-based estimates, which should give a feel for the data.
55
The World Bank submitted a data request to Singapore, but the response was that the data is not available.
1.7%
1.7%
2.4%
2.4%
2.6%
2.8%
3.4%
0% 1% 2% 3% 4% 5% 6%
Canada
United States
Brunei
Singapore
Australia
United Kingdom
New Zealand
2.4% average
0.5%
2.6%
2.9%
3.5%
4.7%
4.7%
6.2%
0% 1% 2% 3% 4% 5% 6%
Canada
United Kingdom
Australia
United States
Brunei
New Zealand
Singapore
4.2% average
MALAYSIA ECONOMIC MONITOR
100
Table 3.8. Singapore’s population comprises of an important and rapidly rising share of nonresidents Stocks in thousands and share n percent
Figure 3.14. About half of the resident population not born in Singapore was born in Malaysia
Share of resident immigrant population by country of birth (percent)
Source: SingStat (2010). Note: Resident immigrant = a resident not born in Singapore
Singapore’s Nonresident Population Has Risen Rapidly
As of 2010, Singapore’s total population comprises 3.7 million residents and 1.3 million nonresidents
(Table 3.8 and Figure 3.14). The resident population consists of Singaporean citizens and permanent residents (PRs). PRs are noncitizens who have been granted permanent residence in Singapore. While they are entitled to most of the rights and duties of citizens, they may not vote in general elections. The nonresident population consists of foreigners who were working, studying or living in Singapore but who were not granted permanent residence. These foreigners would hold passes for a short-term stay in Singapore, including the Employment Pass, Work Permit, Dependent’s Pass and Long-Term Social Visit Pass. The nonresident population category excludes tourists and short-term visitors, labeled as the ‘transients’. The statistics therefore do not include Malaysian workers who live in Malaysia and commute to Singapore to a daily basis.
How did Singapore’s resident and nonresident population evolve over time?
The resident population grew significantly on account of increases in permanent residency holders. PRs represented only 4 percent of total population in 1980, but in 2010 this was 11 percent. The resident immigrant population amounted to 860 thousand in 2010 compared to 590 thousand in 2000. This increase resulted in an increase in the resident immigrant population over the total resident population from 18 percent to 23 percent.
Even more eye-catching is the large increase in Singapore’s nonresident population, which rose tenfold over the short span of three decades. The share of nonresidents to Singapore’s total population rose dramatically from 5 percent to 26 percent—compare this to the resident population which less than doubled. The growth in the nonresident population contributed about half of Singapore’s population increment over the past two decades.
52%
45%
26%20%
10%14%
5% 6%
0%
10%
20%
30%
40%
50%
60%
2000 2010
Malaysia
China, Hong Kong and Macao
India, Pakistan, Bangladesh and Sri Lanka
Indonesia
BRAIN DRAIN
101
Data Gaps Obscure Efforts to Measure Malaysia-Born Nonresidents
The United Nations Population Division’s definition of immigrants, which we use, is based on country of birth and does not differentiate between resident immigrants and nonresident immigrants. Given the sheer size of Singapore’s nonresident population, omitting nonresidents is likely to severely distort our overall estimates. But estimating the nonresident population is complicated by data gaps.
In the absence of official statistics, we need to resort to two sets of assumptions about parameter
values: the first is on the share of Malaysia-born individuals classified as nonresidents; the second on the share of tertiary educated people among Malaysia-born nonresidents. Our scenarios will be based on the following ranges for these parameters values:
Share of Malaysia-born migrants: between 15 and 45 percent. The upper boundary is based on the share of Malaysia-born residents in total foreign-born residents (which equals 45 percent). The lower boundary of 15 percent corresponds more closely to what we think is likely. The significant share of high-skill expatriates and low-skill foreign labor born outside of Malaysia are expected to account for a much larger share in the nonresident population than in the resident population. Also, many of the nonresident Malaysians working in Singapore are not even captured in the nonresident statistics, since they are transient day-workers crossing the border during the day and returning home in the evening.
Skill share among Malaysia-born migrants: between 15 and 30 percent. A large share among nonresidents is non-tertiary educated—hence, it is also more difficult for them to obtain residency. As to the expatriate professional population, only 142 thousand in 2010 were granted an Employment Pass under the categories P1, P2 or Q—a proxy for high-skill qualifications. Compared to a total of 1.3 million nonresidents, this amounts to a skill share of only 10.8 percent (as reported in Kok, 2011).56 The 15 percent lower boundary is motivated by these numbers. The upper boundary reflects the share of tertiary educated among Malaysia-born resident immigrants.57
Based on these ranges, we construct four scenarios: S1, S2, S3 and S4 (Table 3.9). S1 and S4 give the
lowest and highest estimates, where S1 assumes the lowest parameter values for both variables and S4 the highest ones.58 S2 and S4 are variations producing intermediate values, with S2 assuming a 15 percent share in nonresidents and a 30 percent skill share and vice versa for S3.
56
These low numbers are consistent with Yeoh (2007): where Singapore’s nonresident workforce rose rapidly from 248 thousand in 1990 to 670 thousand in 2006, about 580 thousand foreign workers (or 86 percent) are considered lower-skilled. These work primarily in construction, service/manufacturing and marine industries or as domestic maids. The remaining 90 thousand are likely skilled employment pass holders. Apart from Malaysia, these likely come from China and India.
57 In 2010, 121,662 were reported as being tertiary educated among Malaysian-born resident immigrants who
are not students and 15 years of age or older. Assuming that most in the age group 15-24 would not (or not yet) have complete tertiary education, the relates to an overall 25+ population of 350,672 (34.7 percent) or an overall 0+ population of 385,979 (31.5 percent). The latter number motivates the assumption of 30 percent.
58 To give an example, if there are 400 nonresidents in Singapore, then scenario S1 assumes there are 60
Malaysian-born migrants (15 percent), and among these, 9 of them (15 percent) are high-skilled.
MALAYSIA ECONOMIC MONITOR
102
Table 3.9. Estimates of the Malaysian diaspora and brain drain could well be much larger once the nonresident population in Singapore is taken into account
Estimated size of the diaspora (age 0+) and brain drain (age 25+), for Singapore and over time, numbers
Source: SingStat (2011) and World Bank staff calculations and simulations. Note: Diaspora refers to the stock of Malaysian-born migrants, regardless of skill profile. This table shows the diaspora numbers for those aged 25+. Brain drain refers to the stock of tertiary educated Malaysian-born migrants, aged 25+.
Scenarios Point to a Potentially Large Diaspora Community Among Nonresidents
How does the magnitude of the Malaysian diaspora vary across these scenarios? Table 3.9 presents the full range of estimates. Adding nonresidents to the diaspora raises the 2010 estimate from 385 thousand to 385 thousand in the baseline to anywhere between 581 and 973 thousand. The latter figure corresponds to the assumption made in the 2011 Migration and Remittances Factbook (World Bank, 2011), which produces a comparable estimate of 1.06 million.59 The scenarios also affect the 2000 numbers, since the baseline of 303 thousand back then did not consider the nonresident population either. Including this, the 2000 estimate ranges between 417 and 643 thousand.
How is the brain drain estimate affected? Table 3.9 also shows the brain drain estimates for 25+
olds. These range between 151 and 297 thousand. The most conservative estimate presented in Scenario S1 applies a 15-percent skill share to a low base (15 percent of nonresident population being Malaysian-born). Thus, if Malaysians are not significantly represented in the nonresident population and their education levels are rather low, then we obtain an estimate of 151 thousand. Scenario S4 turns this around and applies a high skill share of 30 percent to a high base (45 percent of nonresidents are Malaysian-born), hence the much larger estimate of 297 thousand. Scenarios S3 and S4 show variations that bring down the overall number to levels around 180-209 thousand.
59
Indeed the Factbook extrapolates the resident Malaysian-born share to the nonresident population.
BRAIN DRAIN
103
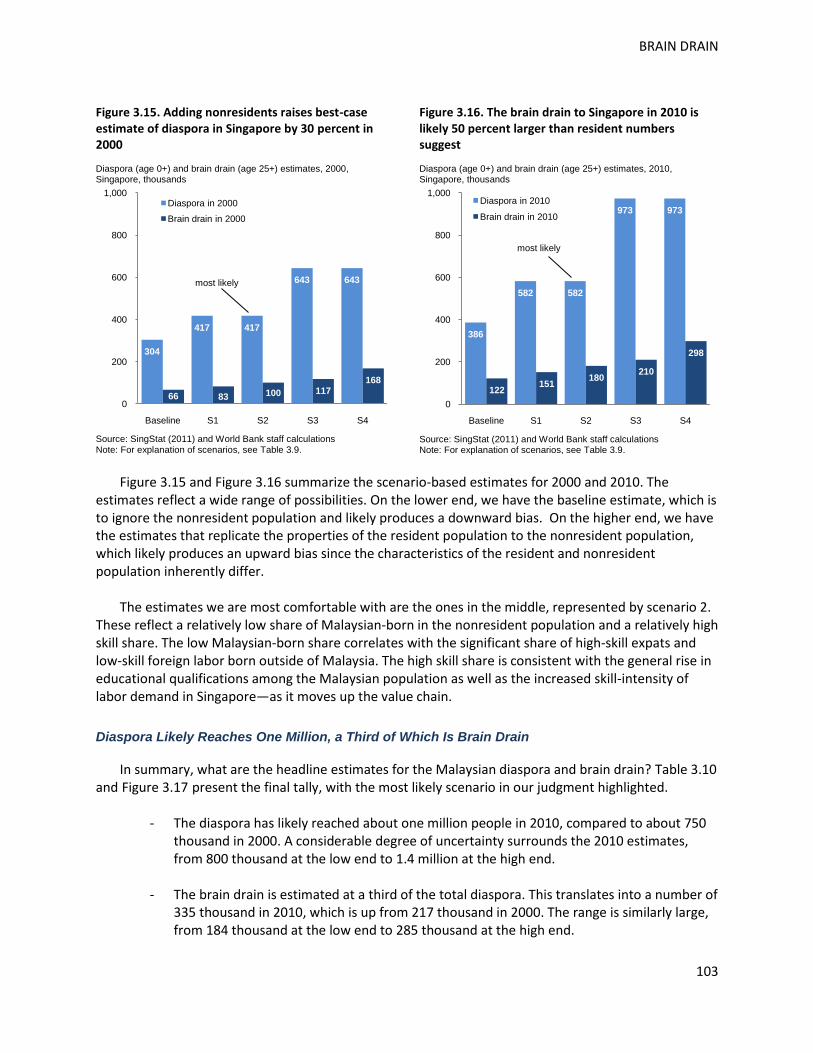
Figure 3.15. Adding nonresidents raises best-case estimate of diaspora in Singapore by 30 percent in 2000
Source: SingStat (2011) and World Bank staff calculations Note: For explanation of scenarios, see Table 3.9.
Figure 3.15 and Figure 3.16 summarize the scenario-based estimates for 2000 and 2010. The
estimates reflect a wide range of possibilities. On the lower end, we have the baseline estimate, which is to ignore the nonresident population and likely produces a downward bias. On the higher end, we have the estimates that replicate the properties of the resident population to the nonresident population, which likely produces an upward bias since the characteristics of the resident and nonresident population inherently differ.
The estimates we are most comfortable with are the ones in the middle, represented by scenario 2.
These reflect a relatively low share of Malaysian-born in the nonresident population and a relatively high skill share. The low Malaysian-born share correlates with the significant share of high-skill expats and low-skill foreign labor born outside of Malaysia. The high skill share is consistent with the general rise in educational qualifications among the Malaysian population as well as the increased skill-intensity of labor demand in Singapore—as it moves up the value chain.
Diaspora Likely Reaches One Million, a Third of Which Is Brain Drain
In summary, what are the headline estimates for the Malaysian diaspora and brain drain? Table 3.10 and Figure 3.17 present the final tally, with the most likely scenario in our judgment highlighted.
- The diaspora has likely reached about one million people in 2010, compared to about 750
thousand in 2000. A considerable degree of uncertainty surrounds the 2010 estimates, from 800 thousand at the low end to 1.4 million at the high end.
- The brain drain is estimated at a third of the total diaspora. This translates into a number of 335 thousand in 2010, which is up from 217 thousand in 2000. The range is similarly large, from 184 thousand at the low end to 285 thousand at the high end.
304
417 417
643 643
66 83 100 117168
0
200
400
600
800
1,000
Baseline S1 S2 S3 S4
Diaspora in 2000
Brain drain in 2000
most likely
386
582 582
973 973
122151
180210
298
0
200
400
600
800
1,000
Baseline S1 S2 S3 S4
Diaspora in 2010
Brain drain in 2010
most likely
MALAYSIA ECONOMIC MONITOR
104
Table 3.10. Diaspora has likely reached one million, of which a third is brain drain
Estimates of diaspora (age 0+) and brain drain (age 25+), by country of destination and over time, numbers
Total diaspora
Brain drain
2000 2010
2000 2010
Balanced sample total
Baseline 639,896 808,018
184,014 276,558
S1 753,071 1,003,768
200,990 305,920
S2 753,071 1,003,768
217,967 335,283
S3 979,421 1,395,268
234,943 364,645
S4 979,421 1,395,268
285,872 452,733
Unbalanced sample total
Baseline 657,574 827,387
184,014 276,558
S1 770,749 1,023,137
200,990 305,920
S2 770,749 1,023,137
217,967 335,283
S3 997,099 1,414,637
234,943 364,645
S4 997,099 1,414,637
285,872 452,733
Source: World Bank Staff calculations.
Note: Complete data set is provided in Appendix Table A3. Details and complete data sets are provided in Appendix A. Diaspora refers to the stock of Malaysian-born migrants, regardless of skill profile. This table shows the diaspora numbers for those aged 0+. Brain drain refers to the stock of tertiary educated Malaysian-born migrants, aged 25+. For explanation of scenarios, see Table 3.9
Figure 3.17. The Malaysian diaspora in 2010 likely totals 1 million people, a third of whom are skilled
Source: World Bank staff calculations and simulations. Note: For explanation of Scenario 2, see main text and Table 3.9
In Scenario 2—our most likely scenario—Singapore accounts for well over half the diaspora and
brain drain (Figure 3.18). An estimated 57 percent of the diaspora and 54 percent of the brain drain are hosted in Singapore, the latter figure being lower due Singapore’s lower skill intensity. This pattern also holds for other historically large communities in Brunei and the United Kingdom. As for the more recent rapid risers—the other countries shown in the Figure—the opposite pattern holds. As a result their role in the brain drain is more important than their role in the diaspora.
827
1,023 1,023
1,415 1,415
277 306 335 365
453
0
200
400
600
800
1,000
1,200
1,400
Baseline S1 S2 S3 S4
Diaspora in 2010
Brain drain in 2010
most likely
2%
4%
10%
5%
3%
15%
54%
2%
2%
6%
6%
7%
10%
57%
0% 10% 20% 30% 40% 50% 60%
New Zealand
Canada
United States
United Kingdom
Brunei
Australia
Singapore
Diaspora in 2010
Brain drain in 2010
BRAIN DRAIN
105
ECONOMIC IMPACT OF BRAIN DRAIN
Has the brain drain been harmful to Malaysia’s economic performance? Whereas the previous section established the magnitude of Malaysia’s diaspora and brain drain, this section qualifies these numbers in terms of their likely impact on the Malaysian economy. We first examine how significant the brain drain is, then provide an overview of the channels through which brain drain affects economic outcomes, and conclude with an assessment how the potentially opposing effects are playing out on human capital formation in Malaysia.
Significance of Brain Drain
How significant is Malaysia’s brain drain? In other words, what do the numbers mean in terms of their likely importance for the Malaysian economy? A number of considerations will be relevant. First, how does the brain drain related to the human capital base of the economy? Clearly, any given magnitude of brain drain will be more costly the narrower is the human capital base. Second, how do emigration patterns differ from immigration patterns? If a large outflow of talent is compensated by inflows of similar magnitude and kind—as is the case in Singapore—then brain drain might be a less significant cause for concern. Third, to what extent have those leaving been educated at home? Emigration would be less costly if those that migrate acquire their education at destination rather than in the home country.
Relative to Narrow Skill Base, Intensity of Brain Drain Is High
More important than the magnitude of the brain drain as measured by the absolute numbers is the intensity of the brain drain, which is measured by the skilled emigration rate. The skilled emigration rate relates how many skilled migrants are leaving to initial skills base of the sending country—that is the stock of skilled people, which includes both the skilled resident population and the skilled migrants before migration. When the ratio is high, brain drain represents a more significant draw upon a nation’s human capital than when it is low.
Malaysia’s brain drain intensity is high (Table 3.11). At the surface, however, it seems as if brain
drain does not present an issue. After all, as Figure 3.19 shows, other countries in the region have seen a more rapid increase in their respective diasporas over the period 1990-2000 (based on the OECD numbers reported by Docquier and Rapoport, 2010). Yet, when we examine Figure 3.20, a different picture emerges. Relative to the domestic skills base, Malaysia climbs up the rankings in the chart on brain drain intensity. This suggests that, despite slower emigration than elsewhere, Malaysia’s stock of human capital domestically has not grown as fast as elsewhere. True, the level of brain drain intensity has fallen in Malaysia, as it has elsewhere in the world, but brain drain intensity remains high.
For every ten skilled Malaysians born in Malaysia, one of them elects to leave the country. This is
double the world average. Superficially, it would appear that the numbers are more in line with what is observed among other countries within the region (Figure 3.20). But the high numbers for Hong Kong and Singapore distort the regional picture and their high numbers are also typical for relatively small and open economies.
MALAYSIA ECONOMIC MONITOR
106
Table 3.11. Even though brain drain intensity has moderated, it remains at high levels
Numbers for brain drain to OECD countries only, thousands
1990 2000 1990 2000
High-Skill at Home
High-Skill Overseas
High-Skill at Home
High-Skill Overseas
Brain Drain Intensity
China 11,593 359 19,893 783 3.0% 3.7%
Hong Kong 379 182 696 292 32.5% 29.5%
Japan 17,399 233 22,128 278 1.3% 1.2%
Korea 3,083 335 7,565 613 9.8% 7.5%
Malaysia 222 79 818 96 26.2% 10.5%
Singapore 84 28 279 47 25.3% 14.4%
Source: Docquier, Lowell and Marfouk (2007)
Figure 3.19. Other countries have seen a much more rapid growth in skilled migration
Decade-on-decade growth foreign-born high-skill migrant stock from selected country, 1990-2000, percent, OECD destinations only
Source: Docquier, Lowell and Marfouk (2007)
Figure 3.20. Brain drain intensity fell, but remains high
Gross emigration rate, percent, OECD destinations only
Source: Docquier, Lowell and Marfouk (2007). Note: * To illustrate that adding Singapore (residents) makes a big difference; not for international comparison since others are OECD only.
Including Singapore would double the estimates of Malaysia’s brain drain intensity. The preceding
analysis is valid only for the 31 OECD countries whose data on migrants were used to construct the bilateral numbers and skill shares. Singapore—the premier migration destination—is not part of the OECD. Including the Malaysian-born resident migrants in Singapore would raise the high-skill emigration rate to close to 20 percent in 2000, compared to 34 percent in 1990.
Why is Malaysia’s brain drain intensity so high? Returning to OECD countries only, this appears to be
related to ‘skill selectivity’. One can decompose the skilled emigration rate into its components of ‘openness’ and ‘skill selectivity’. Openness captures the overall rate of emigration for all migrants—skilled and unskilled. Skill selectivity is the ratio of the skill share for migrants and the skill share of the population. It appears that in Malaysia skill selectivity is the main driver of the emigration rate. Examining the sample of emigrants to OECD countries in 2000, the skilled are much more than proportionally represented in the migrant population (56 percent) as opposed to the overall population (8 percent) (Table 3.12).
19%
22%
60%
65%
83%
118%
0% 20% 40% 60% 80% 100% 120%
Japan
Malaysia
Hong Kong
Singapore
Korea
China
1.2%
4%
8%
11%
14%
30%
1.3%
3%
10%
26%
25%
33%
0% 10% 20% 30%
Japan
China
Korea
Malaysia
Singapore
Hong Kong
1990
20005% global average
20%
34%
Including Singapore*
BRAIN DRAIN
107
Table 3.12. Malaysia’s brain drain is primarily a function of high skill selectivity
Selected indicators, 2000, percent
Emigration rate Openness Skill selectivity
share skilled emigrants in =
share migrants in x (
share skilled in /
share skilled in )
total skilled workers total workers total migrants total workers
Indonesia 2.0 0.4 34.6 5.2
China 3.8 0.2 46.7 2.7
Global average 6.5 1.7 47.1 12.2
South Korea 7.5 3.9 50.9 26.7
Malaysia 10.5 1.5 56.2 8.3
Taiwan 12.8 3.4 79.2 21.0
Philippines 13.6 5.0 66.2 24.4
Singapore 14.5 3.2 53.7 12.0
Source: Calculations based on Docquier and Marfouk (2006).
A few caveats apply. First, if we were to control for the quality of skills among the tertiary educated,
the skills-adjusted selectivity factor would likely be even stronger. Typically, the highly skilled are prone to emigration, as they may have skills that are more easily marketed internationally, an effect called positive self-selection.60 Second, the statistics above pertain only to migration to OECD destination countries. If Singapore was included, the selectivity factor may also be subject to a negative self-selection effect as the nearby diaspora facilitates low-skill migration.61 Third, we need to remain cognizant of the fact that the wider set of numbers, including Singapore, are subject to a significant degree of uncertainty concerning the nonresident population as has been highlighted before.
Regardless of these caveats, international comparisons suggest that Malaysia’s skill base is narrow.
Given the lower skill base—as proxied by educational attainment—the impact of a person leaving should also be higher in Malaysia than elsewhere, keeping all else constant. The low skill base is inherently related to the challenges Malaysia faces in its education sector. Hence, the brain drain is also closely connected to Malaysia’s domestic human capital development agenda. This is an important point when considering policy options to address the brain drain.
60
Chiquiar and Hanson (2005). The highest performing high school student in Singapore in the last 2 years has hailed from Malaysia (Mohandas, 2011).
61 McKenzie and Rapoport (2007) and Beine, Docquier, Özden (2011). Empirical studies for the migration
corridor Mexico-USA suggest that with increasing diaspora communities (as in the case of the Malaysia-Singapore migration corridor), the average skill level of emigrants decreases, hence the observation of a negative self-selection effect due to lower emigration costs.
MALAYSIA ECONOMIC MONITOR
108
Encouragingly, however, we also know that—albeit from a low base—educational attainment did improve considering longer periods of time. Indeed, Malaysia’s universities have been churning out larger numbers of graduates over the years. This then also explains why the emigration rate has fallen over time, thanks to improvements in the skills base. As such, while many people have been leaving, the impact on the overall stock of skill Malaysians was lower than before and therefore the intensity of the brain drain appears to have lowered—even if it remains at a high level. Yet, the quality of education needs to be considered also. If a recent expansion in the provision of tertiary education was accompanied by a decline in standards, then the fall in the emigration rate due to an effect on numbers might not make a large difference. A larger stock of poorer-quality students may contribute to the economy in a similar way as a smaller stock of better-quality students.
Brain Drain Is Not Alleviated By Compensating Inflows
Malaysia is not just a sending country but, even more so, a receiving country. The World Bank’s 2011 Migration and Remittances Factbook estimates Malaysia’s overall immigrant population at 2.4 million, with the stock of Indonesian-born immigrants accounting for about 1.4 million. This places the Indonesia-Malaysia migration corridor among the largest migration corridors in the world (the 13th largest if one excludes the countries of the Former Soviet Union) and, compared to the Malaysia-Singapore corridor, the Indonesia-Malaysia corridor is about a third larger.62
Immigration could in principle alleviate some of the brain drain. However, as documented further in
Box 10, the overall patterns of immigration are such that immigrants are mostly poorly educated and are employed in low-skill occupations in assembly-based industries, low-end services and extractive industries. The upshot is that migratory patterns exert downward pressure on the skill composition of the domestic human capital base. The outflow of both skilled and unskilled Malaysians seems to have been overwhelmed by the inflow of low-skilled foreign labor.
These patterns are likely exacerbated by illegal immigration. The in- and outflow of high-skill
individuals tends to be generally well-documented since the highly-skilled tend to migrate legally. But this is not the case of for low- or unskilled migration where illegal migration is more prevalent. Estimates of the number of illegal immigrants in Malaysia vary widely, but it is clear that the total number is high—ranging from half a million to one million, and up—and it can be safely assumed that virtually all of the illegal immigrants are low-skilled (Tham, 2010). Once illegal migration is taken into account, it becomes clear that the impact of immigration on the domestic skills base is skewed much further to the low end of the spectrum than official statistics would suggest.
62
As mentioned in the previous section, where we estimate the magnitude of the brain drain, the Factbook assumes that the share of Malaysia-born residents applies to total foreign-born residents, which results in a high estimate of about 1.1 million Malaysian-born migrants in Singapore.
BRAIN DRAIN
109
BOX 10. IMMIGRANT WORKERS IN MALAYSIA
Foreign workers have stabilized at a high share of the labor force
The share of migrants in the Malaysian labor force has stabilized since 2000. Migration grew initially very rapidly in the 1990s, doubling as a share in the labor force in the middle of the decade. Then the Asia crisis struck and the share stabilized at roughly 10 percent (Figure 3.21). As the unemployment rate among the migrant workers remained very low and much lower than for Malaysian citizens, it appears that the increased flow of migrants was in response to higher demand.
Figure 3.21. Following rapid increase, the share of migrants in the labor force has stabilized Persons for the left axis and percent for the right axis
Source: EPU and World Bank staff calculations.
Figure 3.22. The share of low-skill migrants in total migrants continued to rise however
Percent
Source: EPU and World Bank staff calculations.
Education levels of foreign workers are generally low
Migrants are typically low-skilled. Only 40 percent of employed migrants received secondary
education and about 10 percent obtained tertiary education. The share of less educated migrants has been rising especially in recent years: nearly 40 percent of migrants had no formal education at all in recent years (Figure 3.22). A large number of migrants also report ‘not applicable’ as their education level. Furthermore, labor force surveys are generally better at catching higher skilled workers. Both of these factors should bias the actual education level of migrants further downward.
Relative to citizens, the levels of educational attainment of migrants are significantly lower.
Migrants’ education level has remained much the same since 2000. The share of tertiary education even fell slightly in recent years. But, citizens’ education level has risen steadily (Figure 3.23). As a result, the gap is widening over time, especially for higher education. This indicates that migrants are filling the demand for unskilled labor in the Malaysian economy as the overall skill level of the natives is increasing.
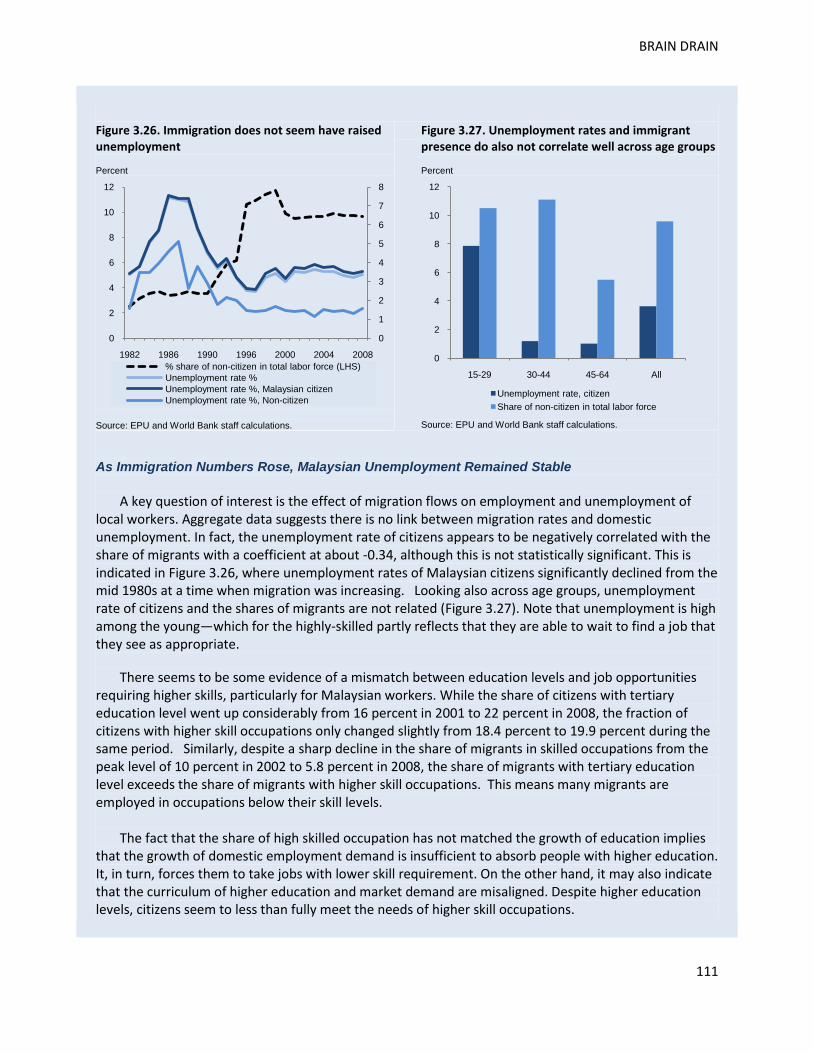
Figure 3.24. Very few migrant workers work in skilled occupations
Percent
Source: EPU and World Bank staff calculations.
Few Foreign Workers Work in High-Skill Occupations
As may be expected from education levels, the majority of migrants are active in occupations with
lower skill levels. If clerical workers, technicians and associated professionals, professionals, and legislators, senior officials and managers are defined as high skilled occupations and the rest as lower skill occupations, less than 5 percent of migrants work in higher skill occupations (Figure 3.24). This has not changed much since 2001. In contrast, about 20 percent of citizens identify themselves as belonging to these occupations. As a result, the share of migrants in the total employment of higher skill occupations has been less that 2 percent while their share in lower skill occupations is over 11 percent (Figure 3.25).
Figure 3.25. In total employment, few foreign workers have high-skill jobs
Percent
Source: EPU and World Bank staff calculations.
0
10
20
30
40
50
60
70
80
90
1982 1986 1990 1996 2000 2004 2008% share of employed citizen with secondary education% share of employed non-citizen with secondary education% share of employed citizen with tertiary education% share of employed non-citizen with tertiary education
0
5
10
15
20
2001 2002 2003 2004 2005 2006 2007 2008
Share of employed migrants with higher skill occupation
Share of employed citizen with higher skill occupation
0
2
4
6
8
10
12
2001 2002 2003 2004 2005 2006 2007 2008
Share of migrants in total employment of lower skill occupations
Share of migrants in total employment of higher skill occupations
BRAIN DRAIN
111
Figure 3.26. Immigration does not seem have raised unemployment
Percent
Source: EPU and World Bank staff calculations.
Figure 3.27. Unemployment rates and immigrant presence do also not correlate well across age groups
Percent
Source: EPU and World Bank staff calculations.
As Immigration Numbers Rose, Malaysian Unemployment Remained Stable
A key question of interest is the effect of migration flows on employment and unemployment of
local workers. Aggregate data suggests there is no link between migration rates and domestic unemployment. In fact, the unemployment rate of citizens appears to be negatively correlated with the share of migrants with a coefficient at about -0.34, although this is not statistically significant. This is indicated in Figure 3.26, where unemployment rates of Malaysian citizens significantly declined from the mid 1980s at a time when migration was increasing. Looking also across age groups, unemployment rate of citizens and the shares of migrants are not related (Figure 3.27). Note that unemployment is high among the young—which for the highly-skilled partly reflects that they are able to wait to find a job that they see as appropriate.
There seems to be some evidence of a mismatch between education levels and job opportunities requiring higher skills, particularly for Malaysian workers. While the share of citizens with tertiary education level went up considerably from 16 percent in 2001 to 22 percent in 2008, the fraction of citizens with higher skill occupations only changed slightly from 18.4 percent to 19.9 percent during the same period. Similarly, despite a sharp decline in the share of migrants in skilled occupations from the peak level of 10 percent in 2002 to 5.8 percent in 2008, the share of migrants with tertiary education level exceeds the share of migrants with higher skill occupations. This means many migrants are employed in occupations below their skill levels.
The fact that the share of high skilled occupation has not matched the growth of education implies
that the growth of domestic employment demand is insufficient to absorb people with higher education. It, in turn, forces them to take jobs with lower skill requirement. On the other hand, it may also indicate that the curriculum of higher education and market demand are misaligned. Despite higher education levels, citizens seem to less than fully meet the needs of higher skill occupations.
0
1
2
3
4
5
6
7
8
0
2
4
6
8
10
12
1982 1986 1990 1996 2000 2004 2008
% share of non-citizen in total labor force (LHS)
Unemployment rate %
Unemployment rate %, Malaysian citizen
Unemployment rate %, Non-citizen
0
2
4
6
8
10
12
15-29 30-44 45-64 All
Unemployment rate, citizen
Share of non-citizen in total labor force
MALAYSIA ECONOMIC MONITOR
112
Skilled Migrants Earn Much More than Citizens, But Unskilled Migrants Much Less
Based on 2006 data on wage rates, migrants on average earn significantly less than citizens. The
pattern reverses itself for migrants with tertiary education. These migrants earn 50 percent more on average (Figure 3.28). This may reflect the scarcity premium of tertiary educated migrants over the Malaysian tertiary educated workers. However, below tertiary education, there is little return to education for migrant workers. For migrants with at most secondary education, the wage rate does not go up with education levels.
Figure 3.28. Migrant wages are generally lower, except for highly-educated migrants
RM per month
Source: EPU and World Bank staff calculations.
Figure 3.29. Migrant wages are lower across occupations, except for the high-skill ones
RM per month
Source: EPU and World Bank staff calculations.
A similar story appears when we look at occupational structure. Migrants earn less than citizens across all lower skill occupations and two higher skill occupations (clerical, technician). But, for the most skilled, professionals, and legislators, senior officials and managers, migrants’ wage rates are double those of citizens (Figure 3.29). Thus, most migrants are employed in lower skill and lower pay jobs.
Large Share of Diaspora Acquired Education Overseas
Turning back to emigration, where did Malaysian-born skilled migrants acquire their education? Migration data identifies skill levels with education level and without regard to whether the education took place in the home or host country. One could however use the age of entry of immigrants as a proxy for where the education has been acquired. Beine, Docquier and Rapoport (2006) find that, for 2000, 68 percent of the global brain drain is accounted for by emigration of people aged 22 or more upon arrival. This presents a problem since ideally the brain drain should only consider people with home-country higher education.
Foreign-educated migrants have been on the rise in Malaysia (Table 3.13). Consider the 1990 data
and recall that this concerns migration to the OECD. The emigration rate for the 0+ age group was close to 25 percent, whereas this was only 11 percent for the 22+ group. A similar result obtains for 2000. In terms of the ratio between the two migration rates, the 22+ migration rate is a third lower in both 1990 and 2000 and the discrepancy is significantly larger than the global average.
0
500
1000
1500
2000
2500
3000
3500
4000
No formal education
Primary Secondary Tertiary Total
Wage of non-citizen
Wage of citizen
0
1000
2000
3000
4000
5000
6000
7000
8000
9000
Skill
ed
Ele
menta
ry
Assem
ble
r
Serv
ices
Cra
ft
Cle
rical
Tech
Pro
fessio
nal
Manager
Tota
l
Wage of non-citizen
Wage of citizen
BRAIN DRAIN
113
This implies that Malaysia has had to bear lower costs of (tertiary) education for those people. But
the other side of this coin is that people who spent the formative years of their lives abroad may be less inclined to return. The trend also indicates that the emigration phenomenon in Malaysia becomes ‘younger’, as more people below the age of 23 emigrate. The international comparison shows that, except for Vietnam, there is no other country in this benchmark group that has more skilled emigrants leaving the country at early age.
The large share of Malaysia-born foreign-educated migrants correlates with quality issues in
Malaysia’s education system. The transferability of human capital across borders is an important factor in determining whether high-skilled workers can be easily assimilated at destination and hence can earn high wages. Workers who are trained at destination get better wages and are more likely to be employed, particularly if the education system at source is of low quality (Coulombe and Tremblay, 2009). Data from the US New Immigrants Survey suggests that sending countries with low skill prices are much less successful in bringing these students back (Rosenzweig, 2008).
Table 3.13. Controlling for age of entry makes a large difference
Skilled OECD emigration rates of adult population by country of origin who arrived at selected age or above (percent)
The common perception is that brain drain depletes a country’s human capital stock and imposes negative externalities on those remaining. Theories of these negative impacts are well developed—they featured prominently in the literature of the 1970s as well as in the early literature on endogenous growth. The most recent literature offers a more balanced and empirically-grounded perspective: depending on circumstances, the net effect of brain drain on development and welfare may be either positive or negative. So, contrary to popular belief, skilled migration is not just associated with costs, but also with benefits—some of which, while perhaps not immediately obvious, may build up over time through technology transfers, trade and capital flows introduced by ‘brain circulation’ and might eventually overturn any detrimental effects.
MALAYSIA ECONOMIC MONITOR
114
Brain Drain Can Erode Skill Base and Depress Innovation
Brain drain could create a vicious circle that may trap a country into an undesirable equilibrium with low levels of human capital and a large technology gap. In this sense, brain drain could contribute to rich countries becoming richer at the expense of poorer countries. Two key factors are responsible for bringing about this trap (Docquier and Rapoport, 2011):
The domestic human capital base shrinks. The most direct effect of skilled emigration on the human capital base at origin is that those who migrate will no longer be there to actively contribute to domestic production.
The capability to innovate is eroded. The lower skill base may have an important spill-over effect on productivity growth as innovation—which is one of the key driving factors of sustained productivity improvement—rests on a solid base of human capital.
Reinforcing these negative effects are the following channels. Productivity at destination may be
raised, magnifying pull effects. This would occur in circumstances where the brain drain is substantial enough to boost productivity growth in the destination economy, which would provide further incentives for people at source to migrate. The technology gap may also widen further, which boils down to the same effect (Mountford and Rapoport, 2011).63
Also, unemployment may rise for all skill levels. If wages are determined non-competitively, then the employment prospects for the remaining skilled workers may—counterintuitively—increase as the skilled migrate. This mechanism relies on the internationally mobile highly-educated bargaining for higher wages, which leads also low-skilled workers to raise their wage demands and a situation where the only way to offset these demands will be higher unemployment (Bhagwati and Hamada, 1974).
Finally, occupational shortages may drive economy-wide productivity down. Shortages in certain
important sectors and professions (such as teachers, engineers, physicians and nurses) may affect the productivity of others or reduce the pace of human capital accumulation in the country (Kremer, 1993).
But Incentive Effects May Boost Human Capital Formation
A fundamental weakness in the preceding discussion is that there are no feedback effects on human capital formation. It is assumed that the prospect of emigration does not affect the stock of human capital before migration takes place or, when it does, the additional human capital created fully ends up abroad. The more recent literature allows for such feedback effects, where the prospect of migration raises the expected return on human capital and this in turn incentivizes investment in human capital. However, probabilistically, not all who respond to this incentive leave and this offsets or compensates for the loss of those who do leave (Docquier and Rapoport, 2011). However, the extra human capital accumulated may not be useful at origin. One type of ‘brain waste’ would occur youngsters who may anticipate migration chose a field of study in areas that are in need at destination but not at source.64
63
Some of this may be mitigated if indeed additional growth trickles back into external demand for the source economy or when technological progress subsequently trickles down.
64 Indeed, “people contemplating migration may choose to study geriatrics instead of pediatric, meaning that
if they end up not migrating, their skills are likely to be partly wasted.” (Docquier and Rapoport, 2011)
BRAIN DRAIN
115
Theory suggests that two conditions need to be satisfied for brain drain to have an overall positive effect on human capital formation.65 First, the differential in skill prices should be large enough so that there is a strong incentive effect. However, at the same time, the differential should not be overly large in that it constraints potential migrants in financing additional years of education. Second, the probability of skilled migration should be sufficiently low, i.e. a large enough proportion of those who taken on additional education end up staying.
Other Benefits Accrue From Remittances, Return Migration and Diaspora Effects
In addition the positive incentive effects on human capital formation, there are other potential benefits that together may transform what initially was seen as a brain drain into a brain gain.
Remittances may compensate for the loss of talent. Remittances from the highly-skilled that left the country may assist at origin in alleviating liquidity constraints, stimulating education investment, as well as reducing poverty.
Return migration may bring additional benefits. Brain drain may lead to brain gain if migrants who upgraded their skills abroad return to the home country. Return migration may also boost entrepreneurship and innovation, if returning migrants put to good use additional knowledge and financial capital gained abroad. A net benefit is more likely to be obtained if the fraction of time spent abroad is not too large.
High-skill diasporas could benefit in various ways. Migration may lead to a reduction in international transaction costs, facilitating the exchange of goods, factors and knowledge between origin and destination countries. Diasporas could contribute to better technology diffusion, by the creation of scientific and business networks, and stimulate trade and FDI. They could also contribute to improving institutions in the home country.
Effect on Malaysian Human Capital Base
Brain Drain Does Not Appear to Have Eroded Stock of Tertiary-Educated
Whether the overall effect is positive is ultimately an empirical question. Beine, Docquier and Rapoport (2008) estimate the impact for a large set of countries on the basis of a counterfactual experiment. The authors find that doubling the skilled emigration rate raises human capital formation by 5 percent among the overall population (including both residents and emigrants). Based on this result, a counterfactual experiment is constructed, where the high-skill emigration rate is equated to the low-skill emigration rate. The counterfactual human capital stock then consists of the initial stock of human capital less the increment that would have happened if the high-skill migration rate were to rise from the counterfactual high-skill migration rate (set at the low-skill migration rate) to the observed high-skill migration rate using the 5 percent coefficient obtained from cross-country regressions. The difference between the observed human capital stock (taking into account emigration and the incentive effect) and the counterfactual one (removing both these effects) constitutes then the net impact of the brain drain.
65
Beneficial brain drain in this context occurs when the positive (ex ante) incentive effect dominates the negative (ex post) direct emigration effect on the human capital stock that arises when people leave.
MALAYSIA ECONOMIC MONITOR
116
The results suggest that Malaysia has so far been spared from the detrimental type of brain drain
that depletes the domestic stock of human capital. As Table 3.14 shows, even though brain drain has caused a reduction in the overall labor force (relative to counterfactual in 2000), the skilled labor force remains almost constant and the share of highly-skilled remains virtually the same (a modest increase of 0.1 percent). On the positive side, this evidence suggests that the brain drain has not had a significant detrimental effect in reducing the stock of the educated workforce. On the negative side, the brain drain has also not been beneficial as it has been in some of the other countries in the region, where the incentive effect was even larger.66
Table 3.14. The impact of skilled migration on human capital formation is positive in Malaysia
Total labor force and skilled labor force (thousands) and other shares of skilled (percent)
Effect on 90 percent confidence
total labor skilled labor share of skilled min max
Beneficial brain drain:
Thailand -83 318 1.0 0.2 1.8
Indonesia -99 451 0.4 0.1 0.8
China -741 1,440 0.2 0.0 0.4
Philippines -1,008 -176 0.1 -1.5 1.8
Malaysia -92 -1 0.1 -0.5 0.6
Detrimental brain drain:
Cambodia -45 -23 -0.4 -0.7 -0.1
Vietnam -458 -289 -0.7 -1.1 -0.4
Laos -48 -37 -1.7 -2.0 -1.4
Source: Beine, Docquier and Rapoport (2008). Note: Results show country specific impact of skilled migration on human capital counterfactual experiment where the skilled emigration rate is set equal to the unskilled emigration rate. Effect on the labour force (population aged 25 and more): observed labour force minus counterfactual labour force. Effect on the skilled labour force (with post-secondary education): observed skilled labour force minus counterfactual skilled labour force. Effect on the proportion of skilled (BG): observed proportion minus counterfactual proportion (brain gain)
But Skills Shortages Point to Concerns about Quality of Human Capital
Brain drain—as will be discussed later in Box 11—is subject positive selection effects. Migrants typically have higher than average skills and therefore the best and brightest are more likely to be overrepresented among migrant. As a result, even if the domestic stock of tertiary-educated continues to be replenished quickly enough in comparison to the outflows measured by the numbers, it is well possible that the quality of the human capital base declined due to these composition effects.
There is ample evidence to support the argument that the domestic human capital base in Malaysia
does not adequately meet the demand from the market. The base appears too narrow and employers are concerned about the quality of educational qualifications.
66
Country characteristics that make it most likely for beneficial brain drain to occur are low level of human capital and a low emigration rate of skilled workers. In countries, where the migration rate is well above 20 percent and/or the share of people with higher education is greater than 5 percent, the brain drain is likely to exert an overall negative effect.
BRAIN DRAIN
117
Figure 3.30. Finding a qualified technician in Malaysia takes long when compared internationally
Number of weeks for both axes. Years after country names denote survey period.
Source: World Bank’s global investment climate survey database
Figure 3.31. Lack of skilled workers dampens current and potential firm growth and productivity
Percent of surveyed manufacturing firms which viewed that…
Source: World Bank (2009a)
The World Bank’s most recent investment climate assessment suggests that Malaysia continues to
face a tight labor market for skills and that this is affecting firm productivity (World Bank, 2009a). In a 2007 survey of Malaysian manufacturing firms, the average time spent to recruit a professional worker was reported to be a lengthy period of six weeks. The situation also deteriorated slightly from 2002, the date of the previous investment climate assessment. From a cross-country perspective, it takes a long time in Malaysia to hire a skilled technician—and there is also greater uncertainty about how long it takes (Figure 3.30).
Moreover, it appears that the lack of skilled workers not only prevented firms from operating at
their maximum capacity but also deterred them from scaling up employment (Figure 3.31). The human capital shortages observed in Malaysia also dampen firm productivity. For example, the lack of knowledgeable IT staff and consultants to design IT-based solution systems has discouraged firms from adopting and/or expanding the use of IT, which could greatly enhance productivity (Figure 3.31).
These skill shortages are likely to have been exacerbated by the brain drain due to positive selection
effects. Because of the lack of return migration thus far the brain drain has also not contributed to alleviating these skills shortages by adding to the stock of human capital individuals who have enhanced their capabilities through an overseas experience.
8.8 5.3 5.1 3.8 3.7 3.4 3.2 2.9 1.6
0
2
4
6
8
10
12
14
0
2
4
6
8
10
Bra
zil
2003
Mala
ysia
2007
Thaila
nd 2
007
Irela
nd 2
005
Germ
any
2005
Kore
a 2
005
India
2002
Russia
2005
Indonesia
2003
Time required to fill a vacancy for skilled technician (LHS)
Standard deviation of time required (RHS)
75.0
69.5
31.4
73.7
74.4
42.3
0 20 40 60 80
Lack of knowledgeable IT personnel is an important
obstacle to introducing/expanding IT use
Skilled worker shortage discourages the firm from expanding employment
Shortage of skilled labor is one of the key reasons why
production capacity was not fully utilized 2002 survey
2007 survey
MALAYSIA ECONOMIC MONITOR
118
POLICY APPROACHES TO BRAIN DRAIN
The human capital agenda is of paramount importance as Malaysia embarks upon its journey towards a high-income nation. This journey will require Malaysia to significantly strengthen the domestic human capital base, which is too narrow to meet current demand and will likely fall short to an even greater extent as growth becomes more skill-intensive. Developing human capital domestically will be one important objective, but so will be the objectives of attracting and retaining talent.
Relative to the presently narrow base of human capital, the brain drain has been intensive.
Universities continue to churn out graduates, alleviating the erosion in the number of tertiary-educated remaining in Malaysia. Yet, the widespread skill shortages continue to point to significant quality issues in the domestic human capital stocks. Brain drain is likely to have amplified these concerns about the quality of the human capital base. On the one hand, as elsewhere around the world, positive selection effects imply the best and brightest leave, causing a decline in average quality. On the other hand, concerns about the quality of the education system constitute a push factor driving migration decisions.
How can policymakers reverse these patterns and realign the migration of talent with the high-
income aspiration? This section will first argue that brain drain is a symptom, driven by underlying factors, rather than necessarily a problem in itself. This entails three sets of policy implication, which are subsequently examined. First, the fundamental factors need to be identified that account for the brain drain and incentivize the decisions to migrate. Second, the policy suggestions need to reflect the fundamental factors, not the symptoms. Third, approaches that target the flow of talent directly may complement, but cannot not substitute for, comprehensive approaches that address the fundamental drivers of brain drain.
Fundamental Drivers of Brain Drain
Brain drain is a symptom of underlying factors. Individuals respond to incentives and to understand what is fundamentally driving the brain drain so as to be able respond with policies, one needs to understand these incentives. In what follows, we follow two complementary approaches to understand the incentives for Malaysia’s brain drain. The first is a review of the generic push and pull factors advocated in the brain drain literature, coupled with an interpretation of how these may play out in the Malaysian context. The second is a presentation of a survey that we conducted among the Malaysian diaspora, with the objective of getting a ‘qualitative feel’ for the factors that mattered in actual decisions of migration.
Push and Pull Factors Drive the Migration Decision
To the extent that the brain drain is a global phenomenon, one would presume that the set of underlying drivers of brain drain is similar across countries that experience brain drain (see Box 11). As suggested by Docquier and Rapoport (2006): “The causes of *the+ growing brain drain are well known. On the supply-side, the globalization of the world economy has strengthened the tendency for human capital to agglomerate where it is already abundant and contributed to increase positive self-selection among migrants. And on the demand side, host countries have gradually introduced quality-selective immigration policies and are now engaged in what appears as an international competition to attract global talent.”
BRAIN DRAIN
119
BOX 11. DETERMINANTS OF BRAIN DRAIN: CROSS-COUNTRY EVIDENCE
Explanations for the marked cross-country differences that are observed around the world in the
degree of brain drain intensity traditionally center around push and pull factors. Push factors that disincentivize a potential migrant to stay and pull factors that the potential migrant to go. Recall that the emigration rate of high-skill individuals, which measures brain drain intensity, can be split up into two components: openness (that is the emigration rate regardless of skill) and selection bias (that is the skill share in those that migrate relative to the skill share in the total population including migrants).
The impact of push and pull factors on high-skill emigration rates can thus be decomposed into the
impact on openness and selectivity. For developing countries these effects typically play out as follows (Docquier, Lohest and Marfouk, 2007):
Openness, that is the general tendency to emigrate regardless of skill, is larger when the origin and destination countries are nearby and when the country of origin is small or more developed.
Selectivity is not so much affected by distance, which makes sense since the highly-skilled may face less financial constraints in migration. Religious fractionalization at country of origin exerts a strong push effect. Greater development at origin reduces selectivity, as well as brain drain intensity (since the negative effect for selectivity is larger than the positive one for openness).
Two further patterns are noteworthy in empirical studies of brain drain:
Positive selection occurs when migrants have higher than average skills. This tends to occur when there are large skill-related differences in earnings between source and destination countries (Grogger and Hanson (2011). However, the existence of a large diaspora overseas not only increases the size of migration flows but also lowers the average educational level of migrants, amounting to negative selection (Beine, Docquier and Ozden, 2011).
Positive sorting reflects the tendency for high-skill migration to be absorbed by countries where the returns to skill are high. The larger the earnings differential is between high and low-skilled workers at destination, the larger the relative stock of high-skilled migrants in the destination country is (Grogger and Hanson (2011).
Researchers distinguish generically between push and pull factors for migration. In what follows, we
provide an overview of the general empirical evidence in cross-country studies and discuss their relevance for Malaysia. The analysis of push and pull factors on skilled emigration proves difficult, since differences in personal backgrounds create significant ambiguities. Based on the literature (see Box 11) and the various interviews we conducted in Malaysia, Singapore, and the United States for the purpose of this study, we identify the following factors: 67
67
See Belot and Hatton (2008), Lee (1966), Docquier, Lohest and Marfouk (2007), Grogger and Hanson (2008), McKenzie and Rapoport (2010), Beine, Docquier and Ozden (2010).
MALAYSIA ECONOMIC MONITOR
120
Less attractive salary / benefits than overseas after adjustment for cost of living. For those who have the means to migrate, low salary levels and benefits provide a powerful incentive to do so.68 This applies particularly to the highly-skilled. The prospect of higher wages may serve as one, but not the only, motivation for the skilled to emigrate. As people grow accustomed to higher real wages abroad, this factor even further gains weight. A hypothetical return may then be associated with losses in income and status.
Lack of career prospects / unavailability of opportunities in specific fields. A lack of suitable high-productivity employment opportunities in the professional field an individual would wish to work in provides a strong incentive for migration. A range of professional occupations may not be offered in much depth in Malaysia. The lack of depth and breadth of the job market, particularly in knowledge- and skill-intensive sectors, provides both an incentive to emigrate and a disincentive to return-migrate.
Sense of social injustice. Perceptions of social injustice appear to feature prominently in the decision to migrate or return-migrate. Malaysia’s diaspora has a strongly ethnic dimension—as will be discussed later on. Factors such as unequal access to scholarships and higher education seem to be of significant concern, particularly among the younger population within the non-Bumiputera community.
Quality of life factors. Differences in quality of life matter both in the decision to emigrate and the rationalization of the decision to remain abroad. As part of this, safety and security issues are likely to be an important component. In the Malaysian context, stories of kidnappings and armed robberies appear to be shared widely in the diaspora community and form a narrative to justify the decision to remain abroad.
Access to high-quality education. Emigrants perceive both an access issue with respect to quality education and a quality gap between domestic and foreign institutions of primary through tertiary education. While the lack of access seems to serve as a strong push factor, the quality aspect serves as a deterrent to return.
Country size and diaspora network. The proximity to Singapore and presence of many Malaysians there seem to play key roles in attracting skilled emigrants. The proximity allows them to stay in touch with family left behind in Malaysia, whereas the presence of Malaysians in high-productivity jobs in Singapore contributes to the powerful narrative of emigration.
68
Perhaps counterintuitively, a large compensation differential does not necessarily raise migration rates. If the differential is the result of low compensation domestically that limit the means to migrate, then openness would suffer and emigration may not occur.
BRAIN DRAIN
121
Economic Incentives and Social Disincentives Matter Most
To get a more structured response than solely feedback based on interviews, on online survey was administered at Qualtrics. The survey received 194 responses over a period of 3 weeks mid-February 2011. The survey was designed to provide a more human dimension to the quantitative data that made up a big part of the report’s discussion so far. While the results of the survey are corroborated by other surveys (such as Wong, 2010) as well as the various qualitative interviews we have conducted, the small sample size implies that the results need be interpreted with caution.
The demographic profile of the respondents—shown in Appendix B—is skewed towards the younger
population of Chinese ethnicity. About half of respondents are students and the most of the remainder are working. Given the large share of students, about half of them are age 24 and below. The remainder is concentrated in the age 25-40 bracket. The respondents are mainly of Chinese ethnicity (81 percent). The concentration of the sample on young people of Chinese descent might be considered as biasing the results. Countering this, however, are the following two arguments. First, Malaysia’s diaspora has a strongly ethnic dimension. Most of the diaspora is of Chinese ethnicity and this will be discussed further later on. Second, the focus on young people offers a worthwhile perspective from the point of view of designing policies. If Malaysia wishes to reattract, tap into or engage with the diaspora, the future will lie in the hands of these young people.
Figure 3.32. Economic conditions and social injustice are considered as the top three drivers of brain drain
Share of respondents listing item as one of three top reasons for brain drain in Malaysia
Source: Survey among the diaspora.
What does the survey suggest? The results suggest that economic incentives and social disincentives matter most (Figure 3.32). ‘Better career prospects overseas’ topped the list, with two thirds of respondents listing this as their top-three concern. ‘More attractive salary / benefits overseas’ was the number three, listed by over half of the respondents. Some 60 percent of respondents considered a ‘sense of social injustice’ as one of the top three reasons for brain drain. The importance of both economic incentives and social disincentives has been underscored in other surveys as well. Wong (2010) finds similar results in an online survey (of a larger sample of 854 respondents but with a similar demographic).69
69
See pluggingthebraindrain.wordpress.com. Note that this survey is also geared towards young Malaysians of Chinese ethnicity: 90 percent are younger than 27 and 85 percent are of Chinese ethnicity. This survey rates the
12%
19%
23%
28%
30%
54%
60%
66%
0% 10% 20% 30% 40% 50% 60% 70%
Livability
Study and return
Politics
Safety and security
Study and stay on
Compensation
Social injustice
Career prospects
MALAYSIA ECONOMIC MONITOR
122
Comprehensive Approaches
For Malaysia to fulfill its aspiration to become a high-income economy by 2020, it will be important to consider the underlying factors that lie at the heart of individuals’ migration decisions.70 The previous discussion showed that productivity (a catch-all for economic incentives) and inclusiveness (a catch-all for social disincentives) are two key factors driving emigration decisions. Boosting productivity and strengthening inclusiveness will therefore be key and on this front the Government of Malaysia has announced—and is in the course of implementing—major transformative initiatives. Most notably, the Government Transformation Programme (GTP) and Economic Transformation Programme (ETP) embody the principles of the comprehensive approaches outlined below. The discussion below will serve to underline the relevance of these approaches as well as the importance to implement them.
Boosting Productivity
The productivity challenge is an interplay between human capital development issues (affecting the supply of skill) and broader investment climate issues (affecting firms’ productivity and the demand for skill). The concern is that this interplay has caused the Malaysian economy to be stuck in an undesirable low-skill low-productivity equilibrium, where the supply and demand deficiencies reinforce each other.
Education Policies to Foster the Supply of Skills
One reason why productivity is constrained relates to the human capital base in Malaysia, where as mentioned earlier the current base may be too narrow and of insufficiently high quality to support the needs of the high-growth model. The risk is that, as the demand for skilled labor picks up when investment climate issues are tackled, existing skill shortages would become even more binding.
The World Bank’s recent investment climate assessments highlight the concerns of firms about the
quality of the skills base. Some 40 percent out of 1,400 firms sampled in a recent survey reported the skills issue as a top investment climate obstacle.71 It also appears that the concern about human capital is held across the board, regardless of the region where the firm operates, the size of its operations, its export orientation, its ownership structure or the industry it belongs to.
The concerns about quality apply across the entire skills spectrum and includes both cognitive and
non-cognitive (Figure 3.33 and Figure 3.34). Firms are particularly concerned about the skills of local production workers, especially in manufacturing but also in services. The key concerns are in the area of technical/professional, communication, IT, leadership and English language proficiency skills for manufacturing, and technical/professional, IT, communication, social, leadership, creativity/innovation skills for services. Firms also report skills deficiencies at the local professional level, especially creativity/innovation and IT skills in manufacturing and creativity/innovation, leadership, problem solving, and communication skills in services.
determinants of migration on a scale of 0 (does not at all affect) to 5 (greatly affects), with the share of respondents rating the following factors at 4 or 5 listed in brackets: economic situation in Malaysia (56 percent), political situation in Malaysia (69 percent), human rights and media freedom (55 percent), inter-racial harmony (58 percent), quality of education (63 percent), crime rate (63 percent).
70 These factors, incidentally, also apply to the cross-border flow of physical and financial capital, where
Malaysia has seen significant outflows as well. 71
World Bank (2009c).
BRAIN DRAIN
123
Figure 3.33. Skill deficiencies for local production workers
Percent of managers considering the listed skill of local skilled production workers as ‘poor’ or ‘very poor’.
Source: World Bank (2005 and 2009c).
Figure 3.34. Skill deficiencies for local professional workers
Percent of managers considering the listed skill of local professionals as ‘poor’ or ‘very poor’.
Source: World Bank (2005 and 2009c).
These skills problems harm productivity growth as firms have no other choice than to hire someone
who is less than ideally qualified for the job. Employee surveys confirm these suboptimal hiring policies. Only 7 percent of manufacturing workers (15 percent in services) feel that the ideal field of education best suited for their job is the one they possess. As much as 17 percent of manufacturing workers (15 percent in services) feel the ideal field is completely different from their own.
Looking ahead, to ensure the demand for skill can be satisfied, efforts will be required to improve
both the quantity and quality of skilled labor.72 This requires attention to incentives, competition, and merit-based recruitment in education, as well as curriculum development, better teacher training, and leveraging efforts with the help of the private sector—topics which have been discussed in previous issues of the Malaysia Economic Monitor.
Growth Policies to Boost the Demand for Skills
Firms are concerned about the quality of education, but an alternative explanation may lie in the unwillingness of firms to offer higher wages to attract the best and brightest. This unwillingness may result from a lack of productivity caused by factors other than human capital. In other words, even if firms could find the right skills, they cannot afford to pay higher wages given other constraints.
Indeed there is ample evidence to suggest that Malaysia’s economic structure over the last few
decades has remained largely centered on low- and semi-skilled production modes (assembly-based manufacturing), which has dampened the demand for skilled labor.73 We also see that the services sectors remains highly protected, removing the incentive of firms to innovate and upgrade along the value chain, reducing the need for skills further.
72
Asides from promoting productivity growth which reduces the incentive to emigrate, education policies can also mitigate migration more directly since quality of education is considered as one of the factors motivating the decision to seek overseas education.
73 See World Bank (2010a).
0 10 20 30 40 50 60
IT
English language proficiency
Professional communication
Creativity/innovation
Technical/professional
Problem solving
Numerical
Time management
Leadership
Adaptability
Social
Teamworking
Manufacturing
Services
0 2 4 6 8 10 12 14
Creativity/innovation
IT
Time management
Technical/professional
English proficiency
Leadership
Adaptability
Problem solving
Communication
Numerical
Teamworking
Social
Manufacturing
Services
MALAYSIA ECONOMIC MONITOR
124
How to raise the demand for skills? Improvements to the enabling environment can facilitate this
through the building of an internally-competitive and business-friendly economy, the provision of appropriate soft and hard infrastructure to support the knowledge economy and the adequate provision of bank finance and venture capital for innovation. Focused technology, innovation and urbanization policies can nurture niches of growth by building on existing strengths—and this is indeed the route being followed through Malaysia’s National Key Economic Activities. Greater specialization will assist in accelerating growth and create demand for skilled labor—and increase social and private returns to education and skills upgrading.
Figure 3.35. Lack of finance appears to be constraining innovation Share of firms considering ‘lack of appropriate source of finance’ as factor hampering innovation activities, according to importance
Source: World Bank (2010a).
Figure 3.36. Firms have become increasingly concerned about anti-competitive practices
Share of firms indicating ‘anti-competitive practices’ as ‘severe’ of ‘very severe’ problem, 2002-2007, percentage points
Source: World Bank (2005 and 2009c).
Of particular importance will be the need to smooth the flow of capital to innovating firms and to
unleash the forces of competition within the economy. As Figure 3.35 shows, firms consider a lack of appropriate finance as a top bottleneck hampering innovation activities. As of the latest innovation survey, some 43 percent considered this a ‘very important factor’. To activate innovation, Malaysia will also need to unleash the forces of internal competition, which is the driving force of private sector-led innovation. However, the competitive landscape in Malaysia is not even.74 Manufacturing is exposed to international competition, but many services subsectors lack both international and domestic competition. World Bank surveys of Malaysian firms suggest that anti-competitive practices in the services sector were considered of major—and rising—concern (Figure 3.36).75
74
As the New Economic Model puts it, “Malaysia’s major obstacle is the absence of fairer competition to raise competitiveness within the nation. The existing restrictions on equity holdings and operations as well as slow liberalization and deregulation policies make it difficult for domestic and global entrepreneurs to invest in Malaysia, undermining the efforts of local players to improve themselves through competition.” (NEAC,2010b).
75 World Bank (2009c).
10%
30%23% 24%
43%19%
38% 55% 47%
41%71%
32%23%
29%15%
0%
20%
40%
60%
80%
100%
1990-94 1997-99 2000-01 2002-04 2005-08
Not important or slightly important
Moderately important
Very important
14 1416
20
0
5
10
15
20
25
Manufacturing firms Services firms
2002
2007
BRAIN DRAIN
125
Strengthening Inclusiveness
In addition to economic incentives, social disincentives have played an important role in the migration decision, particularly among the non-Bumiputera communities (see Box 12 below). As acknowledged in the Roadmap of the Government Transformation Programme:
“An unintended outcome of the National Economic Policy (NEP) was a sense of deprivation,
discrimination and even resentment felt by the non-Bumiputeras, which was attributed to the over-zealous attitude and approach in implementation by some officers in certain agencies. There has also been a widening of the income gap within the Bumiputera community, leading to rising discontent amongst certain segments of that community. These factors have pushed many Malaysians, especially professionals, to work and reside overseas, in economically more advanced countries with attractive pull factors such as higher income, wider exposure and opportunities, better quality of life and education for their children. May have chosen to settle permanently, and there are signs that this brain drain has become increasingly serious. It is imperative that these issues […] are addressed, as not only is our economy’s competitiveness, stability and sustainability at stake, but continued widening and rising disparities will jeopardize national unity.” (Pemandu, 2010; p. 76)
Figure 3.37. The share of ethnic Chinese among the Malaysian diaspora in Singapore is high and rising
Share of Malaysia-born resident population according to ethnicity, 2010 (percent)
Source: SingStat (2010).
Figure 3.38. Among the Malaysian diaspora in the US, 10 percent speak Malay Share of Malaysian adults in the US by language group, 2000, percent
Source: Lucas (2008) based on US Census 2000 data in IPUMS.
Even if economic incentives play an important role as well, the observation that social disincentives
have mattered correlates with the Malaysian diaspora having a strongly ethnic dimension. By 2010, the share of ethnic Chinese in the diaspora residing in Singapore has risen to almost 90 percent, with the share of ethnic Indians flat at 5 percent (Figure 3.37). Among the Malaysian diaspora residing in the US in 2000, 10 percent reported Malay as their mother tongue, while over 60 percent report one of the Chinese languages and 6 percent report on of the Indian languages (Figure 3.38). Other data is scarce and less reliable, but nevertheless suggestive. For example, based on a limited sample out of the Australia’s longitudinal immigrant survey in 2000, Lucas (2008) reports that among Principal Visa Applicants born in Malaysia and admitted to Australia between September 1999 and August 2000, 73
85%
9%5%
88%
6%5%
0%
20%
40%
60%
80%
Chinese Malay Indian
2000
2010
61%
18%
10% 6%2.3% 2.2%
0%
10%
20%
30%
40%
50%
60%
Chinese
English
Malay
Indian
Other Asian
Other
MALAYSIA ECONOMIC MONITOR
126
percent were ethnic Chinese and 15 percent ethnic Indian.76 These numbers suggest that the non-Bumiputera are highly overrepresented in the diaspora relative to their population shares (26 percent for the Chinese ethnicity and 7.7 percent for the Indian ethnicity).
Strengthening inclusiveness is an important policy priority in the Government of Malaysia’s reform
agenda. The objective of unity in diversity and inclusiveness, while ensuring fairness for all, lies at the heart of the 1Malaysia principle and is also anchored in the Federal Constitution of Malaysia. As Prime Minister Dato’ Sri Najib Razak has recently remarked:
“It is important that we first acknowledge the tremendous progress that we, as a nation, have
made in creating a more united and inclusive Malaysia. Nevertheless more needs to be done, and it is my belief that Malaysians have reached the level of maturity necessary to discuss some of the tougher issues that we face. These issues often do not have a solution and represent polarities that require compromises to be made by all parties.” (Pemandu, 2010; p. 64).
The need for change is echoed in a quote of former Deputy Prime Minister Tun Musa Hitam:
“We must now begin to pay heed to questions as to whether our redistributive economic policies
are indeed holding us back competitively compared with the rest of the world. Race-based economic policies do not sit well with the realities of globalization and free trade. Malaysia must find a way to create race-neutral space within itself and find the correct formulae to harness the qualities necessary to compete on a global level” (Pemandu, 2010; p. 76). The need to update Malaysia’s inclusiveness strategies reflects both new realities and new
challenges. The new reality is that poverty is no longer the key issue when thinking about inclusive growth. Poverty still exists—and pockets of poverty remain deep, concentrated and geographically biased—but inequality is now in the spotlight and is presenting a tremendous challenge. The other new reality is that inequality is no longer what it was four decades ago. Nowadays over 90 percent of the level of inequality is explained by differences within ethnic groups rather than differences between these groups (World Bank, 2010b). Individual socio-economic characteristics, such as activity status, sector of employment, urban versus rural stratum, and educational attainment are now the capital explanatory factors, no longer ethnicity.
Malaysia’s high-income aspiration is also raising a whole new set of challenges. High-income
economies tilt the demand for labor in favor of the skilled, sharpening income inequality across the skills spectrum. They tend to specialize in product niches and concentrate activity in narrow geographical clusters, raising challenges to retrain people and move them around to where the new jobs are. They are also open to competitive forces, creating challenges for those who are unable to compete or unlucky as a result of such competition.
76
The stratified sample consists of only 64, so these results should be interpreted with extreme caution. The longitudinal survey is available from Dept. of Immigration and Citizenship Australia (2000).
BRAIN DRAIN
127
What could an updated inclusiveness strategy consist of? The previous issue of the Malaysia Economic Monitor proposed a three-pillar approach (World Bank, 2010b):
Increasing economy-wide income-earning opportunities. Malaysia’s steady growth has benefitted many. However, there are those who are being excluded because growth has not translated into steady employment or has not turned self-employment from a desperate last resort to an opportunity to become an independent and creative entrepreneur. In this respect policies would be welcome to reduce the costs of and barriers to labor mobility, increase competitiveness in the labor market to push up wages, and reduce the rigidities in labor market regulations. Together, these measures would help to raise the level of employment, strengthen the labor market matching process, and reduce the degree of informality.
Promoting investment in human capital. Many Malaysians cannot take advantage of income-earning opportunities because they lack the skills to do so. Some never got them in the first place, despite the massive investments that Malaysia has made in its education system. In the case of others, the skill needs of the Malaysian economy have changed more quickly than the educational and training opportunities that are available to them. Policies could address these challenges by reducing disparities in the availability of quality basic education among states and between rural and urban areas, restructuring the vocational training system, and ensuring that the skills being produced match the needs of the market.
Providing social protection for the poor and vulnerable. Some Malaysians will not be able to avail themselves of opportunities to increase their incomes or their human capital because of disability, old age, or other factors. Others may require temporary support because of factors beyond their control such as natural disasters or the financial crisis. In this respect policies would ensure that benefits get to the right people and provide sufficient protection to allow them to take the prudent risks needed to participate fully in today’s global economy.
MALAYSIA ECONOMIC MONITOR
128
BOX 12. SUGGESTIONS FROM THE DIASPORA The survey that we organized earlier this year led to a wealth of suggestions from those who left
Malaysia and are considering whether to return. While the responses below reflect the opinions expressed and should not be construed as necessarily representative, they provide a valuable input for debate. In a close-ended question where respondents are asked to rank policy initiatives which they view as critical in attracting emigrants back to Malaysia, social and governance issues such as affirmative action, government effectiveness, and education quality were considered as important factors (Figure 3.39).
Figure 3.39. Social/public administration policies are important for return migration
Percent of respondents who viewed that these policy initiatives may entice a migrant to return to Malaysia
Source: Survey among the diaspora.
Open-ended questions reveal suggestions about inclusiveness, corruption, career opportunities, and
access to education. Here is a summary of the suggestions made:
Government-related Private sector-related
Inclusiveness and social justice
- Ensure equal opportunities based on merit, not race or religion
- Embrace Malaysia’s multi-culture nature and promote tolerance and acceptance of people
- Strengthen public dialogue and debate on political issues - Allow dual citizenship
- Practice meritocracy in race-blind way in hiring and daily workplace activities
- Reduce top-down management - Adjust wages based on qualification, not age - Create awareness of civil rights and corporate
responsibility
Governance and anti-corruption
- Increase transparency in policy making and procurement through open tenders, clear selection criteria
- Reduce corruption especially in enforcing agencies - Strengthen the role of the media
- Demand for more transparency from government - Be proactive and advocate for policy changes - Participate more actively in unions and associations
17
40
46
82
87
0 20 40 60 80 100
Favorable tax structure
Embrace migration flows and compete for skilled labor, regardless of nationality
Greater investment in public education
Evidence of fundamental and positive change in the
government / public sector
Paradigm shift away from raced-based towards needs-based
affirmative action
BRAIN DRAIN
129
Economic management and career prospects
- Reduce government intervention in the economy - Open up services sectors such as legal services to
foreign firms - Improve labor regulations - Promote the creation of high-paid, high-productivity job
opportunities - Ensure wage increases to keep up with rising cost of
living - Improve physical public infrastructure, e.g. electricity and
broadband - Let the ringgit appreciate more strongly
- Adopt systems of international standards in pay and benefits
- Recruit Malaysians studying overseas to return with competitive remuneration packages, internship, training, career advancement opportunities, and work-life balance
- Create global business competitions linked to scholarship awards
- Create partnerships to allow foreign-educated Malaysian students to work with foreign partners for a few years prior to returning to Malaysia to serve out their contracts
- Encourage environment for creativity and collaboration
Education
- Disconnect racial issues from tertiary education - Open up the opportunities for non-Bumiputera students
to join the local university based on meritocracy - Strengthen teaching and research quality of personnel at
tertiary education institutions
Living conditions
- Ensure safer communities through stronger law enforcement
- Promote affordable housing and public transportation - Improve healthcare service quality - Improve natural resources management to preserve
nature
Targeted Approaches
While comprehensive approaches to boost productivity and inclusiveness are necessary, they may not be sufficient. For Malaysia to retain, attract or re-attract the best and brightest in support of the high-income objective it also needs to proactively participate in the global competition for talent. In addition, Malaysia can also engage with the diaspora in other ways than influencing the flow of talent.
Competing for Talent
Participating in today’s global competition for talent requires developing Malaysia into a location of choice, where people want to live, work, raise a family and retire. Given the expanded set of options available in today’s globalized world, talented individuals may be choosing a location first before they choose a job. As a result, the source of competitiveness of a region has become increasingly tied to quality of life considerations and the ability of the region to attract on this basis talented individuals.77
77
A key factor here is to transform urban areas, where economic activity tends to be concentrated, into sticky places that spur creativity and innovation. These sticky places serve as magnets for creative and high-skilled individuals. This must go beyond addressing bads such as crime and congestion, but transform the city fundamentally into a livable and sustainable space.
MALAYSIA ECONOMIC MONITOR
130
However, once the enabling conditions are satisfied and Malaysia offers an attractive value proposition in terms of productivity-linked wages, social inclusion, quality of life and other factors—through the comprehensive approached discussed earlier—then the question becomes how Malaysian can best facilitate the flow of talent across borders in the most effective and efficient way.
In this regard, talent management policies could play a potentially pivotal role, which is
corroborated by our survey. As Box 13 shows the attitudes of migrants surveyed in our samples reveal a strong sense of attachment to Malaysia. Many of them remain connected in one way or the other. This level of attachment is particularly strong among migrants who have recently migrated. This suggests that the time window within which migrants consider to return migrate shrinks rapidly as the length of time spent abroad increases—a result that is picked up in the survey as well. This is encouraging news as it suggests that, providing the enabling conditions are right, targeted talent management policies could flip the balance over to Malaysia’s advantage, transforming the brain drain into an overall brain gain.
Figure 3.40. The number of expatriates in Malaysia has fallen, primarily in manufacturing
Number of expatriates by sector employed, thousands
Source: Department of Immigration Malaysia. Note: Peninsular Malaysia only.
Table 3.15. Among the main source countries, the decrease was particularly large for Japan Number of expatriates by country of origin, numbers and percent
Level
Share Growth
2004 2010 2010 2004-10
All countries 43,406 32,583 100% -25%
India 9,609 5,888 18% -39%
China 4,414 3,206 10% -27%
Japan 5,397 2,248 7% -58%
United Kingdom 2,290 1,964 6% -14%
Bangladesh 563 1,878 6% 234%
Philippines 1,905 1,835 6% -4%
Indonesia 1,794 1,735 5% -3%
Pakistan 1,424 1,406 4% -1%
South Korea 1,504 1,399 4% -7%
Singapore 3,091 1,249 4% -60%
Australia 1,396 1,023 3% -27%
United States 1,006 874 3% -13%
Iran 240 706 2% 194%
Taiwan 1,400 589 2% -58%
Source: Department of Immigration Malaysia. Note: Peninsular Malaysia only.
But in addition to enticing the diaspora to return, Malaysia could also tap more fully into the global
pool of talent (Figure 3.40 and Table 3.15). To date, it seems that Malaysia has yet to reap the benefits of importing foreign talent. In fact, the number of expatriates declined by a quarter over the period 2004-2010, with much of this decline apparent in the expatriates employed in the manufacturing industries of Malaysia. This is consistent with the decline registered in expatriates from Japan, given the significant presence of Japanese multinationals and affiliates in the manufacturing industry. However, the magnitude of the decline is somewhat disconcerting, as the expatriate population from Japan was halved over the period considered. The decline was substantial as well among other higher-income countries but much less pronounced for lower-income countries.
7 5 5 6 4 3 5
19
15 1618 22
22 21
17
13 13
1210
7 7
0
10
20
30
40
50
2004 2005 2006 2007 2008 2009 2010
Manufacturing
Services
Other
BRAIN DRAIN
131
A few qualifications are in order before we can interpret the decline in expatriate statistics. Expatriates are defined as professional or skilled foreign workers that stay or remain temporarily in Malaysia for the purpose of employment. They are issued an Employment Pass or Work Pass (in the case of Sabah) for a minimum period of two years and entitled to a salary of not less than RM1,200 per month. However, the minimum salary requirement has been changed to RM5,000 starting from 2008. However, following this change, some sectors, such as in ICT, health (nurses), education (international school teachers), could not afford to hire expatriates at this salary level, where other, such as in oil and gas, could not comply with the period of two years (in some cases, their contract lasts for only 6 month). To address such cases, the Immigration Department issued a Temporary Visit Pass. The statistics shown comprise of both categories. However, they only consist of the expatriate population on the peninsula.
How to interpret the decline in the expatriate population resident in Malaysia? Clearly, one factor has been the global economic crisis, which affected not only the movement of capital across borders (particularly FDI) but also that of professional workers. Indeed, following an initial decline after 2004, the numbers were growing steadily, a process that was interrupted in 2009. The Malaysian authorities also report that the decline may be a result of stricter enforcement by the expatriate committee (JKPD) to minimize fraudulent cases. At the same time rigid conditions and criteria in applying for an Employment Pass may have played a role as well. 78
Looking ahead, as skills demand in the Malaysian economy is expected to rise, it will be important to reverse these trends. In this respect, it is important to discard the idea that foreign and Malaysian skilled workers are perfect substitutes. On the contrary, they are strong complements. Knowledge workers interact with one another in ways that lead to exponential benefits and increase the productivity of all (rather like the internet—the more the number of users, the more powerful is the web).
Visa and restrictive employment requirements on foreign skilled workers are proving to be a critical
and binding constraint preventing companies from accessing the skills needed to move up the value chain. Therefore, it is helpful to introduce a fast-track procedure for work permits for high-tech and high-skilled businesses and individuals, and for work in research and universities. At this moment the tardiness of getting for example foreign lecturers approved means that by the time they are given the approval they have picked another job elsewhere.
Returning migrants are most likely to be attracted by programs which welcome them and their
families to stay, provide security through granting permanent residency, and offer them an environment in which they can innovate and build a new business. Overregulation of the services sector, in particular, is a major barrier for returning migrants. Qualifications obtained abroad are not recognized domestically and criteria other than quality may be applied. All pharmacists getting a license to work in Malaysia must first work for the government for three years. Such measures discourage those who have gone abroad from coming home.
78
Based on feedback received from Department of Immigration and Economic Planning Unit. Note that the rigidities with respect to the Employment Pass are now being addressed—see a bit further in the text.
MALAYSIA ECONOMIC MONITOR
132
Malaysia could also allow for the greater inflow of foreign students in universities, which can provide a welcome source of revenue and also deepen linkages with local providers of services to the university. Elite universities can be important exporters of services and can be significant revenue generators for the local economy. Also important are the potential spillover effects. University teaching and research in the life sciences has the potential to generate synergies with the hospital sector, where Malaysia is a growing exporter of medical services. Finally, once foreign students graduate they could be offered the opportunity to put their skills to good use in Malaysia.
Malaysia has recently established the Talent Corporation, which has been tasked to coordinate
efforts in these areas. Two recent initiatives target expatriate and returning migrants respectively:
- Residence Pass (RP). RP holders can work and live in Malaysia up to ten years and can change employers without having to renew the pass. Any foreign talent who has been living and working in Malaysia for at least 3 years on a continuous basis. Preference would be given though to experts in areas relating to the National Key Economic Activities (NKEAs), as well as ICT, aeronautics and biotech.79 The RP would allow foreigners who are posted in Malaysia with a multinational to have the option to stay longer at the end of their tour of duty. The RP would also provide an option to come back to those who may no longer be Malaysian, such as children of Malaysians who have moved overseas for education.
- Returning Experts Programme (REP). Malaysian professionals working abroad are offered a flat income tax rate of 15 percent for five years. The low tax rate would ensure greater competitiveness with respect to other countries, which have lower marginal tax rates (but also different tax brackets) such as Hong Kong and Singapore. Diploma holders with at least 10 years of overseas work experience would qualify for the REP if they have the relevant industry experience in any of the NKEAs. In the past these efforts were managed under the Expert Scheme introduced in 2001, which up till the end of 2010 managed to attract 750 people with expertise in various fields.
79
The NKEAs consist of 11 economic sectors (oil, gas and energy; palm oil; financial services; tourism; business services; electronics and electrical; wholesale and retail; education; healthcare; communications content and infrastructure; agriculture) and 1 geographical sector (greater Kuala Lumpur and Klang Valley).
BRAIN DRAIN
133
BOX 13. ATTITUDES TOWARDS RETURN MIGRATION
Turning again to the survey, a number of revealing attitudes can be observed among the diaspora. Figure 3.41 suggests that almost half of the Malaysians based overseas who responded to the survey feel a strong sense of attachment to their country, with another 20 percent undecided. This seems to suggest that many Malaysians remain connected to home even though they are living or studying abroad. On the other hand, Figure 3.42 seems to suggest a great level of comfort in their current country of residence. While this demonstrates that high-skilled migrants have generally been successful in their pursuits outside of Malaysia, it reveals a more challenging question that policymakers will need to address when thinking about wooing its talented nationals back home: leveraging and strengthening existing ties enough to tip the balance in favor of return migration.
Figure 3.41. I feel a strong sense of patriotism for, and / or emotional attachment to, Malaysia
Count of of survey respondents
Source: Survey among the diaspora.
Figure 3.42. My professional goals have been met through migration out of Malaysia
Count of of survey respondents
. Source: Survey among the diaspora
Figure 3.43. I intend to return to Malaysia for good at some point in my life
Finally, a third insight that can be drawn from the survey results is the time window within which
migrants are considering return migration. Figure 3.44 and Figure 3.45 show the responses to 2 questions broken down by age of respondents. Both questions follow an interesting pattern: as the age of respondents increases from left to right, the number of positive (‘Strongly Agree’ or ‘Agree’) responses decreases, while the number of uncertain or negative responses clearly increases.
Figure 3.44. If nothing about Malaysia changes, I will still return home and contribute positively to the economy
Count of of survey respondents, by age group
Source: Survey among the diaspora
Figure 3.45. I intend to return to Malaysia for good at some point in my life
Count of of survey respondents, by age group
Source: Survey among the diaspora
As Malaysia develops new initiatives to tap into the diaspora by encouraging return migration, it will
be helpful to consider policies that are not too tightly conditioned on the migrant’s permanent return. Countries around the world focus on the mobility of migrants, which encompasses virtual, short-term and permanent return, and gives the diaspora members also the freedom to go home and return to their host country without losing legal status or citizenship (Plaza and Ratha, 2011).
Engaging with the Diaspora
Malaysia could also leverage more fully on the diaspora community in other ways than enticing them to physically return migrate to Malaysia. Case studies from around the world suggest that diaspora communities can contribute to trade, foreign direct investment and knowledge spillovers. The diaspora can play a positive role in supporting development, particularly in the context of encouraging high-tech industries. Diaspora members can act as bridges between foreign technology and markets and local entrepreneurs, and complement and strengthen local market-based institutions. The diasporas of Taiwan (China), Chile and Israel have helped develop high-tech industries, and more recent examples include China and India (Leipziger, 2008).
0
5
10
15
20
20-2425-29
30-3435-39
40-44
Co
un
t
Age / Years
Strongly Agree Agree Not sure
Disagree Strongly Disagree
0
5
10
15
20
20-2425-29
30-3435-39
40-44
Co
un
t
Age / Years
Strongly Agree Agree Not sure
Disagree Strongly Disagree
BRAIN DRAIN
135
The diaspora can contribute significantly to developing trade. At one level, this is reflected in the demand from diaspora members for ‘nostalgic products’—i.e., Malaysia-specific products that are not produced overseas—even though the impact of this might be limited since these products would have been consumed as well if no migration had taken place. At another level, diaspora members can assist exporters from Malaysia to find buyers, improve their knowledge of the market, and comply with government requirements and standards. Activities around the world have included: the creation of Diaspora Trade Councils and participation in trade missions and business networks (Plaza and Ratha, 2011).
Members of the diapora are also sought after to facilitate foreign multinationals and other firms to
invest in Malaysia. Diaspora members can provide context and resolve uncertainty as foreign multinationals approach them. Diaspora members themselves can also invest directly in Malaysia—and they might be willing to take more risk doing so for their home country as they are also better placed to evaluate opportunities and possess contacts to facilitate the process (Lucas, 2001). Business forums could be established overseas and investment promotion agencies could engage more actively with the diaspora.
Malaysia could also engage by developing direct and indirect financial linkages. An example of the
latter is the creation of the diaspora investment funds, where the diaspora could actively contribute in the development of particular domestic sectors. An example of the former would be to engage with foreign venture capital firms. There are various firms in, for example, Silicon Valley who focus on exporting entrepreneurial ecosystems and providing seed-, early- and growth-stage capital for innovative ventures coupled with local entrepreneurial talent.80
The ability to hold dual or multiple citizenship provides an essential link between the diaspora and
the home country. Citizenship and residency rights are important determinants of a diaspora’s participation in trade, investment and technology transfer with the origin country (Cheran, 2004). Some origin countries do not allow dual citizenship but offer identity card schemes in destination countries, which could also help. Similarly, the granting of voting rights could also help strengthen links with the diaspora. Some countries even reserve a specific number of seats in parliament for diaspora representatives (Plaza and Ratha, 2011).
The diaspora can thus act as ‘global search networks’ for developing local industries. For example,
key members of the Taiwanese government and leading overseas engineers in Silicon Valley played such a role in the establishment of a successful venture capital industry in Taiwan (China). However, harnessing the enthusiasm, commitment and resources of the diaspora can be challenging. Creation of a robust diaspora network requires time, patience and institutional capabilities. Furthermore, it can be challenging to turn ‘discussions’ (e.g. through conferences, websites and online communications) into ‘projects’. (Kuznetsov and Sabel, 2008).
80
In the context of an ongoing World Bank study on how Malaysia can move up the value chain in its manufacturing industries, we have met with a group of Arab-American venture capitalists, who intend to expand their operations around the world—including Malaysia.
MALAYSIA ECONOMIC MONITOR
136
Given that it may be easy to initiate but more difficult to sustain contact, it is important that diaspora engagement efforts maintain a transaction focus. Talent Corporation could in this regard provide selective incentives, organize events and competitions for ideas that reach out to the diaspora and connect them to Malaysia. Awards could be provided in the form of recognition and promotion of these projects or provision of funds in collaboration with external partners.
Bottom-up initiatives could complement top-down ones. For example, in Scotland, an agency
connected with about 300 high profile diaspora members, three quarters of which agreed to engage and became the founding members of this network and reached out to other diaspora colleagues via invitations (World Bank Institute, 2006). The ‘by invitation’-initiative gained popularity and proved more fruitful than a top-down effort of ‘getting registered by the state’. Rather than developing new technical platforms governed by a government agency, one could also bring concepts to existing networks: such as Facebook, Linked-In, Xing and other non-internet based networking solutions within the diaspora community. This makes these efforts more cluttered over the internet and less centralized, but also more participatory.
CONCLUSION
Brain drain—the migration of talent across borders—touches upon the core of Malaysia’s aspiration to become a high-income nation. Human capital is the bedrock of the high-income economy. Sustained and skill-intensive growth will require talent going forward. For Malaysia to stand success in its journey to high income, it will need to develop, attract and retain talent. Brain drain does not appear to square with this objective: Malaysia needs talent, but talent seems to be leaving.
This Chapter has shown that the Malaysian diaspora is large and expanding, as well as
geographically concentrated and ethnically skewed. The brain drain represents about a third of the total Malaysian-born migrant population, which is conservatively estimated at around 1 million.
Malaysia’s brain drain is intensive, not necessarily because too many are leaving but because the
skills base is too narrow. This is aggravated by the lack of compensating inflows, since the skill profile of immigrants in Malaysia is geared to the low end. The intensity of the brain drain is mitigated by the fact that a substantial share of the skilled diaspora acquired their education overseas—lowering fiscal costs for Malaysia but also making it less likely for them to return as they have spent their formative years abroad.
Brain drain does not appear to have eroded the number of graduates available domestically to the
Malaysian economy as universities have managed to replenish the outflows. But it is likely to have eroded the quality of the human capital stock. As anywhere else around the world, brain drain is prone to positive selection: the best and brightest leave first. But given the narrow skills base in Malaysia this is particularly worrisome. The concern is also reflected on the demand side of the skills market: firms in Malaysia raise the quality of the skills base as a top concern, as successive investment climate assessments have indicated. While brain drain is not the only factor affecting quality, it has likely been an important one.
BRAIN DRAIN
137
Brain drain is a wave to be ridden, not a tide to be turned. Brain drain reflects the forces of globalization that make the world a smaller place. Brain drain is not unique to Malaysia and neither is it avoidable or to to be avoided. The challenge for Malaysia, as for many other countries, is to embrace the global mobility of talent. As Malaysia needs talent, it will need to turn the brain drain to its advantage.
To address the brain drain, Malaysia will need to tackle the underlying determinants of brain drain.
Brain drain is symptom—an outcome of underlying, more fundamental factors. Individuals respond to incentives and disincentives—these are the push and pull factors that drive the migration decision. Identifying these factors constitutes the first step towards formulating policy responses to brain drain. Among the factors that matter in Malaysia are differences in earnings potential, career prospects, quality of education and quality of life, relative to overseas locations. However, discontent with Malaysia’s inclusiveness policies is a critical factor too—particularly among the non-Bumiputeras who make up the bulk of the diaspora.
The productivity and inclusiveness agendas are well understood and policy frameworks have been
well articulated in Malaysia’s transformation programs. Forceful implementation of these programs should assist in strengthening both the demand and supply side of the market for talent, so that productivity and wages levels can rise in tandem. This will also reduce the incentive to emigrate and help attract talent from abroad. Progress on updating Malaysia’s inclusiveness strategies will be equally important as this is perceived by the diaspora as a key push factor that fuels the incentive to leave and serves as a deterrent to return.
Once the enablers are in place, targeted measures are helpful to further facilitate the flow of talent
and engage with the diaspora in other ways than through the physical flow of people. However, these targeted measures cannot substitute for more comprehensive measures outlined earlier. Malaysia’s Talent Corporation is developing new initiatives and recent measures, such as the Residence Pass and Returning Experts Programme, are encouraging. The challenge going forward will be to also find effective ways to connect with the diaspora—as interest is more easily raised than sustained. One immediate example of engaging might be to seek the diaspora’s input on how Malaysia can make a leap forward in embracing the globalization of talent and turning brain drain to its favor.
MALAYSIA ECONOMIC MONITOR
138
APPENDIX A. MIGRANT STOCK DATA AND ESTIMATES Table A1. The Malaysian diaspora (1980-2010) Size of the diaspora (age 0+), by country of destination and over time, numbers
Historical series
Most recent
Source
1980 1990 2000
value year
Singapore 120,104 194,929 303,828
385,979 2010
NSO
Australia 31,598 72,628 78,858
92,334 2006
UNPD
Brunei 37,544 41,900 60,401
60,401 2000
UNPD; 2000: OSPW
United States 11,001 32,931 51,510
54,321 2005
UNPD
United Kingdom 45,430 43,511 49,886
61,000 2007
UNPD ( IPUMSI)
Canada 5,707 16,100 20,420
21,885 2006
NSO; 1980: OPSW
Hong Kong .. 12,754 15,579
14,664 2006
NSO
India 23,563 11,357 14,685
14,685 2001
UNPD
New Zealand 3,300 8,820 11,460
14,547 2006
UNPD
China 937 548 7,278
7,278 2000
OPSW
Taiwan .. 191 6,635
6,635 2000
OPSW
Japan .. 5,047 5,849
5,480 2005
NSO
Viet Nam 299 821 4,813
4,813 2000
OPSW
Philippines .. 270 3,991
3,991 2000
OPSW
Indonesia 2,654 3,417 3,146
3,146 2000
OPSW
Germany 49 1,724 2,945
2,945 2000
OPSW
Netherlands .. 2,217 2,739
3,471 2010
UNPD; EuroStat
Ireland .. .. 2,398
2,277 2010
UNPD; EuroStat
Egypt .. .. 1,944
1,301 2006
UNPD
France .. .. 1,718
2,276 2005
UNPD; EuroStat
Pakistan 3,128 2,015 1,618
1,618 2000
OPSW
Thailand .. .. 1,290
1,068 2003
UNPD
Sweden 309 591 961
1,370 2010
UNPD; EuroStat
Switzerland .. .. 916
916 2000
UNPD
South Africa 479 .. 393
393 2001
UNPD
Denmark .. .. 390
672 2010
UNPD; EuroStat
South Korea .. 156 353
353 2000
UNPD
Austria .. .. 332
414 2009
UNPD; EuroStat
Norway .. 182 304
436 2007
UNPD
Turkey .. .. 266
266 2000
UNPD
Spain .. .. 230
535 2010
UNPD; EuroStat
Finland .. .. 224
362 2010
UNPD; EuroStat
Italy .. .. 214
275 2007
UNPD; EuroStat
Source: UN Nations Population Department (UNPD) International Migration Database, Ozden, Parsons, Schiff and Walmsley (OPSW, 2011), Integrated Public Use Micro-Data Series International (IPUMSI), EuroStat, and the following national statistical offices (NSOs): Hong Kong Census and Statistics Department, Singapore Department of Statistics, Statistics Bureau of Japan, and Statistics Canada.
Note: Diaspora refers to the stock of Malaysian-born migrants, regardless of skill profile. This table shows the diaspora numbers for those aged 0+. Data is based on country of birth, except for Italy, Japan, Singapore (1980), Switzerland and Thailand, where country of citizenship is used. Observations for 1980 and 1990 may be of one year earlier or later depending on census timing. Observations for 2000 are as of 2002 for Ireland, 2001 for Australia, Austria, Hong Kong, India, Italy, New Zealand, South Africa and United Kingdom, 1999 for France, and 1996 for Egypt. The 2007 observation for United Kingdom is a survey estimate.
BRAIN DRAIN
139
Table A2. The Malaysian diaspora and brain drain (1990-2000) Size of the diaspora and brain drain (both age 25+), by country of destination and over time, numbers
1990 2000
Diaspora Brain drain
Diaspora Brain drain
Singapore 185,906 19,005
28,6048 66,452
Australia 44,984 35,366
56,961 38,620
United States 17,725 13,745
36,994 24,085
United Kingdom 31,130 15,328
38,147 12,898
Canada 12,150 8,480
17,150 12,170
Brunei 49,439 3,142
36,216 6,438
New Zealand 6,069 4,239
7,548 4,221
Philippines .. ..
6,323 2,974
Taiwan .. ..
5,686 2,916
China .. ..
5,255 2,655
Egypt .. ..
2,657 1,588
Viet Nam .. ..
3,599 1,517
India .. ..
4,569 1,509
Thailand .. ..
2,061 1,071
Japan .. ..
3,864 961
Germany .. ..
1,810 783
Ireland .. ..
1,397 685
Netherlands .. ..
2,303 560
Indonesia .. ..
1,449 393
France .. ..
1,086 381
Switzerland .. ..
1,005 358
Pakistan .. ..
636 297
Sweden .. ..
830 210
South Africa .. ..
314 193
Italy .. .. 340 79
Source: Docquier, Marfouk, Özden and Parsons (2010); Docquier, Lohest and Marfouk (2007).
Note: Diaspora refers to the stock of Malaysian-born migrants, regardless of skill profile. This table shows the diaspora numbers for those aged 25+. Brain drain refers to the stock of tertiary educated Malaysian-born migrants, aged 25+.
MALAYSIA ECONOMIC MONITOR
140
Table A3. The Malaysian diaspora and brain drain (2000 and 2010 estimates) Size of the diaspora (age 0+) and brain drain (age 25+), by country of destination and over time, numbers
Diaspora (0+)
Brain drain (25+)
2000 2010
2000 2010
Balanced sample total 639,896 808,018
184,014 276,558
Unbalanced sample total 657,574 827,387
184,014 276,558
Singapore 303,828 385,979
66,452 121,662
Australia 78,858 101,522
38,620 51,556
United States 51,510 61,160
24,085 34,045
United Kingdom 49,886 65,498
12,898 16,609
Canada 20,420 24,063
12,170 12,807
Brunei 60,401 76,567
6,438 10,208
New Zealand 11,460 15,995
4,221 6,708
India 14,685 18,179
1,509 4,503
China 7,278 9,226
2,655 3,496
Taiwan 6,635 8,411
2,916 3,235
Viet Nam 4,813 6,101
1,517 1,929
Philippines 3,991 5,059
2,974 1,785
Germany 2,945 3,733
783 1,211
Japan 5,849 6,170
961 1,151
Ireland 2,398 2,277
685 837
Indonesia 3,146 3,988
393 811
Pakistan 1,618 2,051
297 718
France 1,718 2,563
381 674
Egypt 1,944 1,430
1,588 641
Netherlands 2,739 3,471
560 633
Thailand 1,290 1,261
1,071 491
Switzerland 916 1,161
358 310
Sweden 961 1,370
210 260
South Africa 393 487
193 224
Italy 214 295
79 51
Hong Kong 15,579 16,123
.. ..
Denmark 390 672
.. ..
Norway 304 468
.. ..
Korea 353 447
.. ..
Finland 224 362
.. ..
Austria 332 424
.. ..
Turkey 266 337
.. ..
Spain 230 535
.. ..
Source: Docquier, Marfouk, Özden and Parsons (2010), Docquier, Lohest and Marfouk (2007), and World Bank staff calculations and simulations.
Note: Diaspora refers to the stock of Malaysian-born migrants, regardless of skill profile. This table shows the diaspora numbers for those aged 0+. Brain drain refers to the stock of tertiary educated Malaysian-born migrants, aged 25+. Diaspora projections based on constant annualized growth assumption of 2.4 percent following most recent observation through 2010. Brain drain projections based on constant 2000 skill shares and 0.75 scale factor (migrant stock age 25+/age 0+). Balanced sample = countries shown for which data is available for both diaspora and brain drain estimates. Unbalanced sample = all countries with data available in a given year.
BRAIN DRAIN
141
APPENDIX B: DEMOGRAPHIC PROFILE OF SURVEY RESPONDENTS
The key features are as follows. Slightly more women responded to the survey than men. Most of the respondents were students currently pursuing tertiary education outside Malaysia. The ethnic composition reflected mostly Chinese Malaysians, in line with the ethnic breakdown of Malaysian-born emigrants in the Australia and US. Almost all were Malaysian citizens.
47%53%
Count of Gender (N=194)
Male Female
15
88
24
39
23
1
4
0 20 40 60 80 100
15-19
20-24
25-29
30-34
35-39
40-44
45-49
Count of Age (N=194)
81%
7%
8%4%
Count of Ethnicity (N=194)
Chinese Indian Malay Others
185
4
3 1
1
Country of Citizenship (N=194)
Malaysia (blank)
Singapore (blank)
Others: Australia
Others: China
Others: UK
10281
11
Count of Current Activity (N=194)
a student working in a different situation 177
16
154
Count of Marital Status; Spouse's Nationality (N=194)
Spouse is Malaysian Citizen
Spouse is Other Nationality
Spouse is Singapore Citizen or PR
I am single
MALAYSIA ECONOMIC MONITOR
142
Many respondents earned salaries of six figures. The respondents reported a wide range of countries in which they were currently working.