A current picture of brain drain from Africa: Scope and effect Abdeslam Marfouk IRES - Université Catholique de Louvain DULBEA - Université Libre de Bruxelles Access to Success: Fostering trust and exchange between Europe and Africa Workshop 3: Europe and Africa: Intra and Inter regional academic mobility Accra, 3-4 May, 2010
Transcript
A current picture of brain drain from Africa: Scope and effect
Abdeslam Marfouk
IRES - Université Catholique de Louvain
DULBEA - Université Libre de Bruxelles
Access to Success: Fostering trust and exchange between Europe and Africa
Workshop 3: Europe and Africa: Intra and Inter regional academic mobility
Accra, 3-4 May, 2010
Outline
� Why African brain drain matters?
� How big is the brain drain form Africa?
� Women international migration: The hidden dimension of the African brain drain
� Medical brain drain: Emigration of health personnel from Africa
� Impact of the brain drain on the source countries
Why African brain drain matters?
� Education and human capital are drivers of economic growth: Strong consensus that better endowed nations in human capital grew more rapidly
� Deficiency in human capital major reason why poor � Deficiency in human capital major reason why poor countries remain poor, Stark (2004)
� Public expenditures on education 4.5% of GNP and 17.5% of total government expenditures, 2007
� Many African countries have relatively low levels of human capital, measured by education levels, literacy rates, innovation indicators and health personnel
Why African brain drain matters?
� UNESCO (2010): In 2007, 20% or 153 million of the world adults illiterates live in Sub-Saharan Africa
� Sub-Saharan Africa more than one in three adults is � Sub-Saharan Africa more than one in three adults is illiterate (38%), LAC (9%), Central Asia (1%), N. America & W. Europe (0.6%)
� 12 African countries have illiteracy rates >50% - In 4 countries more than 70% of the adult population is illiterate
� In 11 countries of Sub-Saharan Africa 50% or more of the population aged 17 to 22 years have fewer than 4 years of education
Why African brain drain matters?
R&D Researchers, 2007
Researchers (thousands)
% of World researchers
Researchers per million inhabitants
World 7 ,094 100.0% 1,063
Other indicators reveal that the African countries are lagged far behind others nations in terms of human capital
World 7 ,094 100.0% 1,063 North America 1,572 22.2% 4,654 European Union 1,340 18.9% 2,728 Africa 163 2.3% 169 Asia 2,940 41.4% 742
Japan 710 10.0% 5,548 China 1,423 20.1% 1,071 France 211 3.0% 3,442 Germany 284 4.0% 3,442 UK 175 2.5% 2,888 USA 1,425 20.1% 4,707
Source: UNESCO (2010)
Why African brain drain matters?
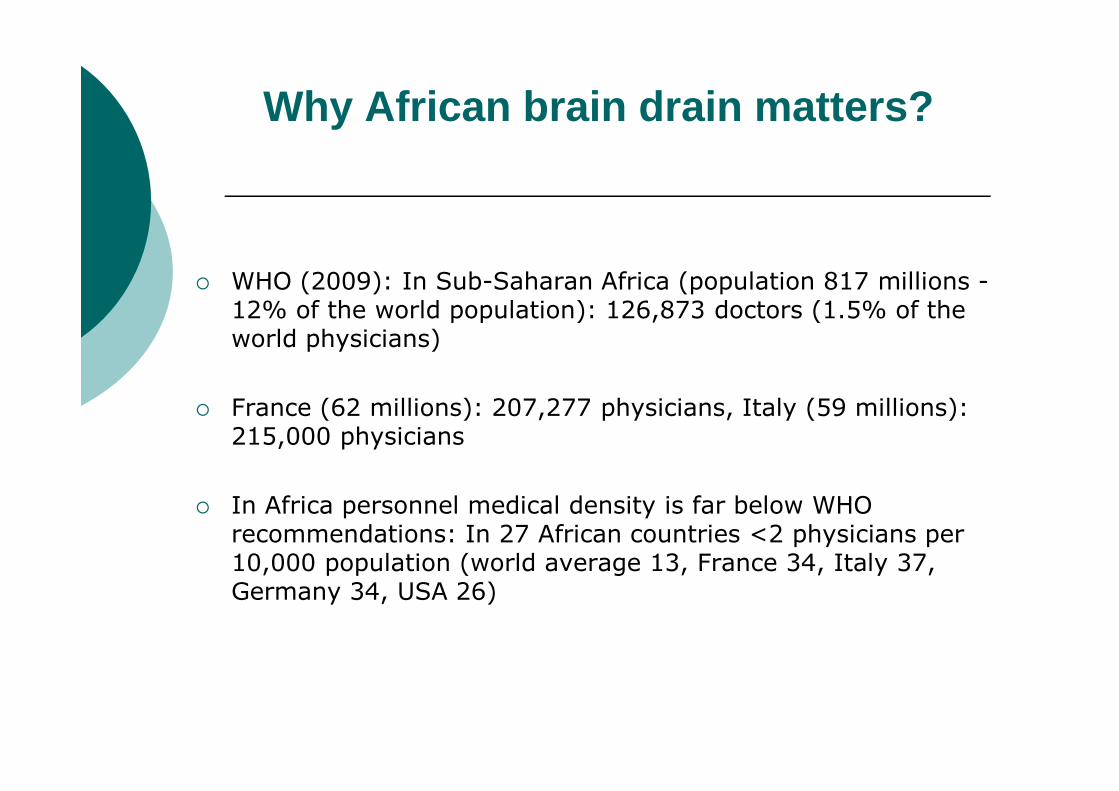
� WHO (2009): In Sub-Saharan Africa (population 817 millions -12% of the world population): 126,873 doctors (1.5% of the world physicians)
France (62 millions): 207,277 physicians, Italy (59 millions): � France (62 millions): 207,277 physicians, Italy (59 millions): 215,000 physicians
� In Africa personnel medical density is far below WHO recommendations: In 27 African countries <2 physicians per 10,000 population (world average 13, France 34, Italy 37, Germany 34, USA 26)
How big is the brain drain form Africa?
� Sustained efforts will be needed to narrow the deficit of the African countries in terms of human capital: African nations face a substantial brain drain
� Until recently nobody was able to present a full and � Until recently nobody was able to present a full and realistic picture of magnitude of skilled migration from Africa: Magnitude of African brain drain was unknown
� No idea about the global cost of the flight of human capital on source countries
� Original data sets: Docquier, Lowell and Marfouk (2007, 2009), OCDE (2007)
How big is the brain drain form Africa?
Highly skilled emigration form Africa to the OECD (persons aged 25+), situation in 2000
Origin Highly skilled emigrants Proportion of highly skilled (in %)
Absolute numbers
(in thousands)
In % of the
Total
Among
emigrants
In region of origin
labor force
Africa 1,407 100% 32% 4%
Note: According to the international countries classification, Sudan is included in Northern Africa and Sub-Saharan Africa
Source: Docquier, Lowell and Marfouk and author’s calculations
Africa 1,407 100% 32% 4%
Sub-Saharan Africa 960 68% 44% 3%
Northern Africa 465 33% 20% 7%
Eastern Africa 348 25% 43% 2%
Middle Africa 96 7% 37% 2%
Southern Africa 177 13% 65% 10%
Western Africa 320 23% 40% 10%
How big is the brain drain form Africa?
120%
140%
124%123%
highly skilled Low-skilled
Migration by region of origin and skill level, variation 1990-2000, in %
0%
20%
40%
60%
80%
100%
Africa Sub-Saharan
Africa
Northern
Africa
Eastern
Africa
Middle
Africa
Southern
Africa
Western
Africa
World
90%97%
78%
70%
85%
64%
24%
37%
20%
10%
85%
9%
53%
23%
Source: Docquier, Lowell and Marfouk and author’s calculations
How big is the brain drain form Africa?
14,0%
16,0%
18,0%
20,0%
18,3%
highly skilled Low-skilled
High-skilled and low-skilled workers emigration rates,by regions of origin, in %, situation in 2000
0,0%
2,0%
4,0%
6,0%
8,0%
10,0%
12,0%
14,0%
10,6%
12,6%
7,9%
13,0%
7,3%
12,5%
5,5%
0,9% 0,4%
2,6%
0,3% 0,4% 0,3%
2,9%
1,3%
Source: Docquier, Lowell and Marfouk and author’s calculations
How big is the brain drain form Africa?
140000
160000
180000 South Africa (12%) – Top 15 (89%)
Highly skilled migrants by countries of origin (Top 15), in absolute numbers, situation in 2000
0
20000
40000
60000
80000
100000
120000
140000
Source: Docquier, Lowell and Marfouk and author’s calculations
How big is the brain drain formAfrica?
82%
77%
68%
56%60%
70%
80%
90%
highly skilled workers emigration rates (Top 20), in %, situation in 2000
56%
49%45% 44%
39%36% 35% 35%
32%28% 28% 27%
23% 21% 21% 21%19%
0%
10%
20%
30%
40%
50%
60%
Source: Docquier, Lowell and Marfouk and author’s calculations
Women international migration: The hidden dimension of the African brain drain
Proportion of women in total migration (>50%), situation 2000
Africa: 51% - Ghana: 45% 50%
60%
70%
Africa 51%, Ghana 45%
Source: Docquier, Lowell and Marfouk and author’s calculations
0%
10%
20%
30%
40%
Women international migration: The hidden dimension of the African brain drain
25%
30%
Men Women
High-skilled workers emigration rates by gender (in %), situation in 2000
0%
5%
10%
15%
20%
Source: Docquier, Lowell and Marfouk and author’s calculations
Women international migration: The hidden dimension of the African brain drain
Men’ and Women’s highly skilled emigration rates, in %, situation in 2000
70%
80%
90%
Men Women
0%
10%
20%
30%
40%
50%
60%
Source: Docquier, Lowell and Marfouk and author’s calculations
Medical brain drain: Emigration of health personnel from Africa
10.000
12.00010.793
56,831 physicians from AfricaAlgeria (19%) - Top-10 (79%)
Number of physicians working in the OECD countries (Top 10), situation in 2000
0
2.000
4.000
6.000
8.000 7.355 7.243
6.221
4.611
2.415 2.385
1.512 1.4691.084
Source: OECD and author’s calculations
Algeria (19%) - Top-10 (79%)
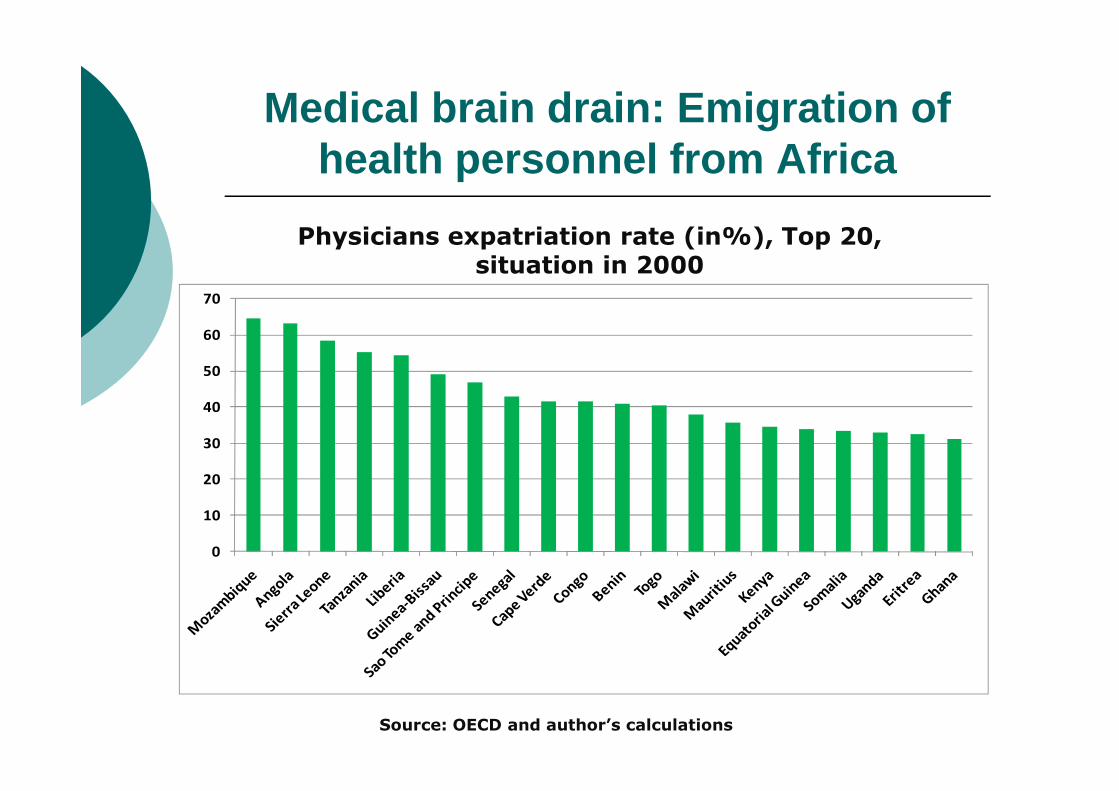
Medical brain drain: Emigration of health personnel from Africa
50
60
70
Physicians expatriation rate (in%), Top 20, situation in 2000
0
10
20
30
40
Source: OECD and author’s calculations
Medical brain drain: Emigration of health personnel from Africa
50
60
70
80
69,014 nurses from Africa
Nurses expatriation rate (in%), Top 20, situation in 2000
0
10
20
30
40
Source: OECD and author’s calculations
Impact of the brain drain on the source countries
� Bhagwati et Hamada (1974), Usher (1977), Miyagiwa (1991), Blomqvist (1986), Haque & Kim (1995), Wong & Yip (1999), Desai, Kapur, McHale & Rogers(2009)
� Loss of investment of public spending on education of emigrants
� Highly skilled migrants are net fiscal contributors and their departure represent a fiscal lost
� Brain Drain is blamed for depriving source countries of one of their scarcest resource: human capital
Impact brain drain on the source countries
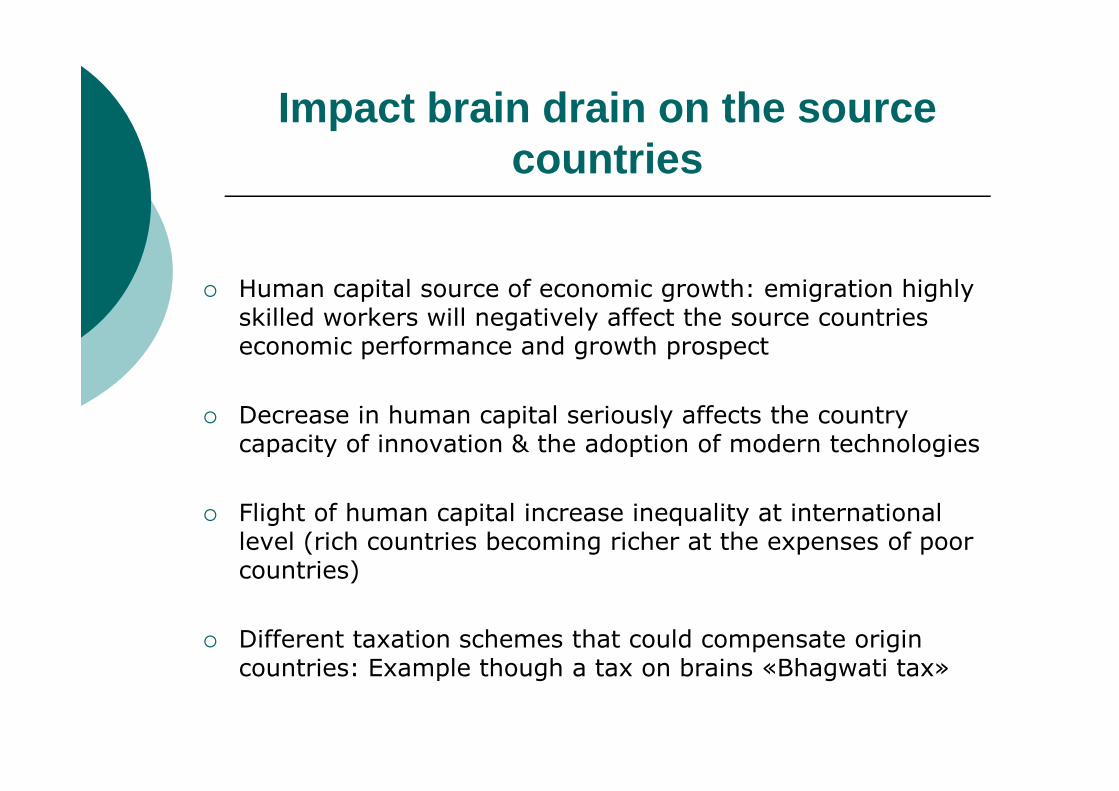
� Human capital source of economic growth: emigration highly skilled workers will negatively affect the source countries economic performance and growth prospect
� Decrease in human capital seriously affects the country capacity of innovation & the adoption of modern technologies
� Flight of human capital increase inequality at international level (rich countries becoming richer at the expenses of poor countries)
� Different taxation schemes that could compensate origin countries: Example though a tax on brains «Bhagwati tax»
Impact brain drain on the source countries
� Stark et al. (1997, 1998), Mountford (1997), Vidal (1998) et Beine, Docquier and Rapoport (2001, 2008),…
� Range of feedback effects on source countries: Remitttances, � Range of feedback effects on source countries: Remitttances, tourism revenu, return migration with additionnal skills acquired abroad, creation of business networks: Trade, FDI
� Faini (2007) and Nimii et al (2008): volume of remittances decreases with the proportion of highly skilled individuals among the emigrants
� Negative impact of the brain drain cannot be counter balanced by higher remittances
Impact brain drain on the source countries
6.895
8.694
9.980
Morocco
Egypt
Nigeria
9,8%
10,1%
27,0%
Senegal
Togo
Lesotho
Recorded remittances inflows(US$ millions), Top 10, 2008
Recorded remittances inflowsin % of GDP, Top 10, 2008
724
823
1.288
1.692
1.977
2.202
3.100
6.895
- 2.000 4.000 6.000 8.000 10.000 12.000
Uganda
South Africa
Senegal
Kenya
Tunisia
Algeria
Sudan
Morocco
5,3%
6,7%
7,0%
7,7%
8,0%
8,5%
9,0%
9,8%
0,0% 5,0% 10,0% 15,0% 20,0% 25,0% 30,0%
Egypt
Liberia
Guinea-Bissau
Sierra Leone
Morocco
Gambia, The
Cape Verde
Senegal
Source: World Bank and author’s calculations
Africa 41 billions US$
Conclusions
� Human capital is still underdeveloped Africa
� At the same time, many highly educated African go abroad: 12 African countries lost at least 30% of their well educated labor forcelabor force
� Women’s skilled migration rates are higher than those of men (Men: 11 countries high skilled emigration rate>30%, Women 20 countries)
� A large skilled Diaspora poses costs and benefits for the region
� Even with remittance income, skilled emigration could be a substantive loss, because human capital is critical in sustaining long term growth
Conclusions
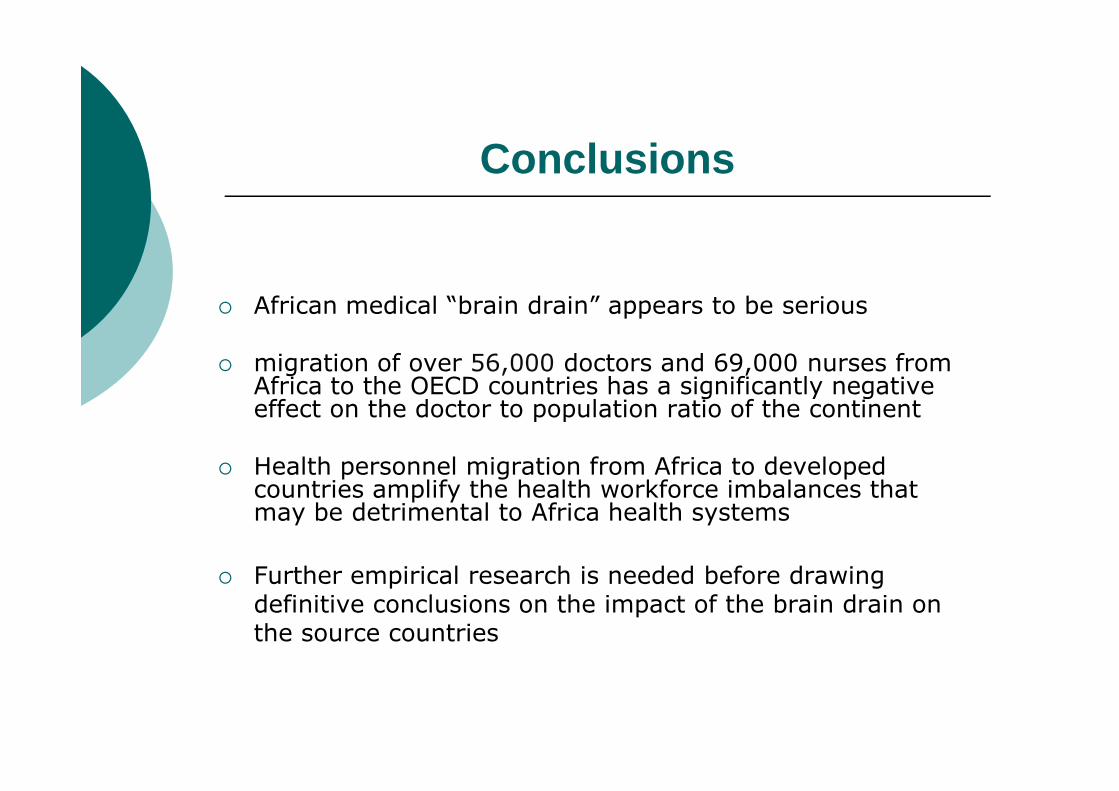
� African medical “brain drain” appears to be serious
� migration of over 56,000 doctors and 69,000 nurses from Africa to the OECD countries has a significantly negative effect on the doctor to population ratio of the continentAfrica to the OECD countries has a significantly negative effect on the doctor to population ratio of the continent
� Health personnel migration from Africa to developed countries amplify the health workforce imbalances that may be detrimental to Africa health systems
� Further empirical research is needed before drawing definitive conclusions on the impact of the brain drain on the source countries