Int. J. Electrochem. Sci., 4 (2009) 444 - 457 www.electrochemsci.org A Dysprosium Nanowire Modified Carbon Paste Electrode for Determination of Nanomplar Level of Diphenhydramin by Continuous Square Wave Voltammetry in Flow Injection System Parandis Daneshgar 1 , Parviz Norouzi 1,2,* , Mohammad Reza Ganjali 1,2 , Faeze Dousty 1 1 Center of Excellence in Electrochemistry, Department of Chemistry, University of Tehran, Tehran, Iran 2 Endocrinology & Metabolism Research Center, Tehran University of Medical Science, Tehran, Iran * E-mail: [email protected]Received: 3 February 2009 / Accepted: 15 February 2009 / Published: 1 March 2009 A new detection technique called the fast Fourier transform square-wave voltammetry (FFT SWV) is based on measurements of electrode admittance as a function of potential. The response of the detector (microelectrode) is fast, which makes the method suitable for most applications involving flowing electrolytes. The carbon paste electrode was modified by nanostructures to improve better sensivity. The redox property of Diphenhydramin was used for determination of it in human serum and urine samples. Synthesized dysprosium nanowires make more effective surface like nanotubes [1-4] so they are good candidates for using as a modifier for electrochemical reactions. The drug presented one irreversible oxidation peaks at 1080mV vs. Ag/ AgCl by modified Nanowire carbon paste electrode which produced high current and reduced the oxidation potential about 300mV. Furthermore, signal- to-noise ratio has significantly increased by application of discrete fast Fourier Transform (FFT) method, background subtraction and two-dimensional integration of the electrode response over a selected potential range and time window. To obtain the much sensivity the effective parameters such as frequency, amplitude and pH was optimized. As a result, LOD of 4.0 ×10 -11 mol l -1 and an LOQ of 8.0× 10 -11 mol l -1 were found for determination for Diphenhydramin. A good recovery was obtained for assay spiked urine samples and a good quantification of Diphenhydramin was achieved in a commercial formulation. Keywords: Fast Fourier Transformation; Square wave voltammetry; Carbon paste electrode; Dysprosium nanowire; Diphenhydramin; Oxidation-reduction
Transcript
Int. J. Electrochem. Sci., 4 (2009) 444 - 457
�������������������
����������� ����
������� www.electrochemsci.org
A Dysprosium Nanowire Modified Carbon Paste Electrode for Determination of Nanomplar Level of Diphenhydramin by Continuous Square Wave Voltammetry in Flow Injection System
Parandis Daneshgar1, Parviz Norouzi1,2,*, Mohammad Reza Ganjali1,2, Faeze Dousty1
1 Center of Excellence in Electrochemistry, Department of Chemistry, University of Tehran, Tehran, Iran 2 Endocrinology & Metabolism Research Center, Tehran University of Medical Science, Tehran, Iran *E-mail: [email protected] Received: 3 February 2009 / Accepted: 15 February 2009 / Published: 1 March 2009 A new detection technique called the fast Fourier transform square-wave voltammetry (FFT SWV) is based on measurements of electrode admittance as a function of potential. The response of the detector (microelectrode) is fast, which makes the method suitable for most applications involving flowing electrolytes. The carbon paste electrode was modified by nanostructures to improve better sensivity. The redox property of Diphenhydramin was used for determination of it in human serum and urine samples. Synthesized dysprosium nanowires make more effective surface like nanotubes [1-4] so they are good candidates for using as a modifier for electrochemical reactions. The drug presented one irreversible oxidation peaks at 1080mV vs. Ag/ AgCl by modified Nanowire carbon paste electrode which produced high current and reduced the oxidation potential about 300mV. Furthermore, signal-to-noise ratio has significantly increased by application of discrete fast Fourier Transform (FFT) method, background subtraction and two-dimensional integration of the electrode response over a selected potential range and time window. To obtain the much sensivity the effective parameters such as frequency, amplitude and pH was optimized. As a result, LOD of 4.0 ×10⁻¹¹mol l-1 and an LOQ of 8.0× 10⁻¹¹ mol l-1 were found for determination for Diphenhydramin. A good recovery was obtained for assay spiked urine samples and a good quantification of Diphenhydramin was achieved in a commercial formulation. Keywords: Fast Fourier Transformation; Square wave voltammetry; Carbon paste electrode; Dysprosium nanowire; Diphenhydramin; Oxidation-reduction
Int. J. Electrochem. Sci., Vol. 4, 2009
445
1. INTRODUCTION
Diphenhydramine,2-(diphenylmethoxy)-N,N-dimethyamine, is a first-generation antihistamine drug. Despite being one of the oldest antihistamines on the market, it is largely the most effective antihistamine available either by prescription or over-the-counter, and has been shown to exceed the effectiveness of even the latest prescription drugs [1]. Like other antihistaminic species, local anaesthetic activities have been observed. It is usually given orally in a preparation of tablet, capsule or syrup. It may be administered by intramuscular or intravenous injections in severe allergies and applied topically for local allergic reactions in preparations of lotion and cream [2] various anti-motion-sickness medications, which many of them are available over the counter, are commonly used to ameliorate motion sickness. Many antihistamines dimenhydrinate, meclizine and promethazine have been effective anti-motion-sickness drugs; however, these drugs are antihistamine-H1 receptor antagonists that cause sedation as the most common subjective side effect. Wood and Garybiel demonstrated that D-amphetamine improves tolerance to Coriolis stimulation of the vestibular system. They found that the antihistamines produced an increase in treatment effectiveness and reduced sedation when D-amphetamine was added. However, many anti-motion-sickness drugs, alone or in combination are only partially effective, and their adverse effect cannot be ruled out. Therefore, it is highly desirable to look for a drug that is effective for prevention of motion sickness and which is relatively free of side effect [3].
Several methods have been proposed for determining diphenhydramine in pharmaceutical preparations including titrimetry, fluoremetry electrochemical analysis and spectrophotometry, which a batch-wise has been applied [2-5]. Chromatographic methods have been used such as gas chromatography[6] and HPLC [7], and the necessity to ensure the quality of pharmaceutical polydrugs like diphenhydramine and consequently the safety and efficacy of the final marketed product has led to the development and evaluation of new techniques that reduce the time and cost of analysis such as capillary electrophoresis [8,9].
The method which introduced in this paper is very sensitive, inexpensive and fast for detection of Diphenhydramin. The square wave voltammetry (SWV) has recently been shown to be advantageous for environmental detection of several compounds [10]. The adaptation of this technology to SWV of Diphenhydramin on a DyNWCPE could provide a substantial improvement for rapid and very sensitive analysis [11, 12].
Carbon-paste electrodes (CPEs), due to their ease of construction, renewability, and compatibility with various types of modifiers, have been widely used as a suitable matrix for preparation of modified electrodes. Further, they show rather low background current compared to the solid graphite or noble metal electrodes [13]. In recent years, application of the CNT-modified carbon paste electrodes showed considerable improvements in electrochemical behavior of biologically important compounds [14, 15]. Metal nanowires such as Dysprosium showed behavior like CNTs. A CPE containing 3% (w/w) of DyNW, in comparison with CPE without nanowire, showed a very effective catalytic activity in the electrochemical oxidation of diphenhydramine.
Using the fast Fourier transform method was found very sensitive system in combination by electrochemical method for trace detection of several compounds [16-22]. This paper describes a
Int. J. Electrochem. Sci., Vol. 4, 2009
446
fundamentally different approach to SWV measurement, in which the detection limits are improved, while preserving the information content of the SW voltammogram. The approach is designed to separate the voltammetric signal and background signal in frequency domain by using discrete Fast Fourier Transformation (FFT) method. SWV measures the current response while rapid alternating potentials are applied during a staircase scan, whereas CV, which uses only a forward and reverse linear dc scan, is not sensitive to the potential dependence of changes that occur in the double layer.
However, the reported methods suffer from limitations such as material waste and time consumption, because a number of preliminary steps are often required to obtain the species from the sample matrix. In this paper a very simple and sensitive electrochemical method was introduced for determination of diphenhydramine. 2. EXPERIMENTAL PART
2.1. Instrumentation
The Electrochemical instrument, ultra voltammetry, a home made potentioastate were used for the present voltammetric measurements. All electrochemical experiments were done using a setup comprised of a PC PIV equipped with a data acquisition board (PCL-818H, Advantech Co.) was used to output an analog waveform to the working electrode and acquire current readings from the working electrode that connected to a custom made potentiostat. The card and accompanying dynamic link libraries allowed waveform generation and current sampling to be synchronized, which was essential in interpreting SWV current response. The memory and CPU requirements of the computer were dictated by the nature of the data acquisition requirements. Software was developed using Delphi 6.0 to repeatedly apply a waveform to the working electrode and synchronously acquire, analyze, and store the current data. The data could be interpreted in real time, or stored data could be loaded and reanalyzed to generate electropherograms. The algorithms used to interpret the current response from each waveform cycle were discussed before. Most of the waveform parameters could be modified from within the software; including the pre- and post scan potential/time, square wave frequency/amplitude, dc ramp initial/final potential, and ramp time.
2.2. Carbon paste electrode
The DyNW/CPE was prepared by hand-mixing 0.97 g graphite powder, 0.03 g DyNW, and 0.34 ml paraffin oil adequately in a gate mortar. A portion of the resulting paste was then packed firmly into the electrode cavity (1.0 mm diameter) of a polytetrafluorethylene (PTFE) sleeve. The unmodified CPE was prepared in a similar way using 1.25 g graphite powder and 0.45 ml paraffin oil. Electrical contact was established via a copper wire. The surfaces of all the modified and unmodified CPEs were carefully smoothed on weighing paper and rinsed with twice distilled water prior to each measurement.
Int. J. Electrochem. Sci., Vol. 4, 2009
447
2.3. Materials and reagents
All chemicals and reagents were of analytical grade quality. Diphenhydramin was a gift from Drug and Food quality control, Tehran, Iran. A stock solution of 1.0 × 10⁻⁷M of Diphenhydramin was prepared in doubly distilled water at 4˚C. More dilute solutions were prepared daily with deionised water just before use. The phosphate buffer (pH 3-10), Britton-Robinson (0.04M of Phosphoric acid, acetic acid and boric acid) and acetate buffer and tris-HCl were prepared using analytical grade reagents and were used as supporting electrolytes. All the solution was made by double distilled water.
Figure 1. The diagram of potential waveform used in measurements.
2.4. Stripping voltammetry
In this new method to improve the detector sensitivity, the FFT-SWV technique was modified in the potential excitation waveform and current sampling and data processing Fig. 1. The potential waveform consisted of three sections; a) electrode conditioning and b) accumulation part C) measurement the potential waveform contained three additional potential steps, Ec1 to Ec2 (for cleaning the electrode surface) and Es (for accumulation of Diphenhydramin). As is shown in Fig. 1, the measurement part of the waveform contains multiple SW pulses with amplitude of Esw and frequency of f0, were superimposed on a staircase potential function, which was changed by a small potential step of ∆E. The values of potential pulse of SW (ESW) and ∆E were in a range of few mV (10 to 150 mV). In potential ramp, the currents sampled four times per each SW polarization cycle. After preparing the solution, the measurements were carried out in the continuous fast Fourier
Int. J. Electrochem. Sci., Vol. 4, 2009
448
transform stripping square wave voltammetric mode (FFTSW). A typical experiment consisted of three consecutive steps with the following experimental conditions: the pre-concentration at -0.8V versus Ag/AgCl for 15s, and a polarization (stripping step) run from 600mV to 1250V by applying a ƒ= 1000 Hz, and the pulse height, Esw = 100mV.
2.5. Sample preparation assay
Twenty tablets of (25mg tablets) were weighed, finely powdered and portions equivalent to 50 mg Diphenhydramin were transferred into 100 ml volumetric flask;50 ml distilled water was added, shaken thoroughly to dissolve, made up to volume and mixed well. Suitable aliquots of solution were filtered through a Millipore filter (0.45µm). 1ml of the filtered solution was diluted with distilled water in a 100 ml volumetric flask. Then 50 µl of the resulting solution was added to a 100 ml volumetric flask and made up to volume with 0.05 M phosphoric acid to yield starting concentration of 50nM.
2.6. Determination of Diphenhydramin in human urine and plasma
1 ml of untreated urine containing 100ng/ml Diphenhydramin was placed into a 10 ml volumetric flask and diluted with water to the mark. A 1ml of this solution was diluted with pH 7 buffer solution to 10 ml into a volumetric flask. Then 50 �l aliquot was injected into the system.
For the determination of Diphenhydramin in plasma, 100 µl aqueous Diphenhydramin solutions (5ng/ml) were added to 100µl of untreated plasma. The mixture was vortexed for 30s. In order to precipitate the plasma proteins, the plasma samples were treated with 20µl perchloric acid HClO4 15%. After that, the mixture was vortexed for a further 30 s and then centrifuged at 6000 rpm for 5 min. Then 50 �l aliquot of the obtained supernatant was injected into the system.
The voltammograms were recorded according to the above recommended procedure. The voltammograms of samples without Diphenhydramin do not show any signal that can interfere with the direct determination, so external calibration can be used.
3. RESULTS AND DISCUSSION
3.1. Electrochemical behavior of Diphenhydramin by using modified DyNWCPE
Fig. 2(a-c) shows a relatively broad and weak anodic wave for the electro-oxidation of Diphenhydramin on the surface of the modified and unmodified electrode revealed that the electrode process is sluggish at the unmodified electrode and it oxidized at higher potential about 300mV. On the other hand, using DyNW-modified electrode, a well-defined and very sharp anodic wave with a peak potential of 1080mV is obtained for Diphenhydramin. On the basis of these observations, it can be postulated that the addition of DyNW to the matrix of CPE exhibits an effective catalytic fashion in the electrochemical oxidation of Diphenhydramin, leading to the remarkable enhancement of the anodic
Int. J. Electrochem. Sci., Vol. 4, 2009
449
peak current. For Diphenhydramin, in the potential range of 600-1400 mV (versus Ag/AgCl) there are oxidation peaks at 1080mV on the NWCPE which by increase of potential scan rates, peak current increase. The anodic peak current at the DyNW/CPE is enhanced greatly by approximately 250% and is accompanied by a negative shift of 300 mV in the oxidation potential. This indicates that the DyNW/CPE improves electrochemical reactivity toward the oxidation of Diphenhydramin compared with bare CPE.
-10
10
30
50
70
90
110
130
600 800 1000 1200 1400E(mV)
I(µµ µµ
A)
Figure 2. The voltammograms of 1.0×10⁻⁷M Diphenhydramin on the modified (a) and unmodified (b) carbon paste electrode at acetate buffer pH 7, (c) acetate buffer using NWCPE.
3.2. Effect of pH
The influence of the solution Britton-Robinson buffer (pH 2.0–7.0), phosphate buffer (pH 3.0–7.0) and acetate buffer (pH 3.0–7.0) was also analyzed in the response of the peak current after preconcentration of 15s at -800 mV. The peak current was pH-dependent and much more developed in acetate buffer solution. The dependence of peak current (Ip) of Diphenhydramin at concentration of 1.0 × 10⁻⁷M on pH for acetate buffer solution is shown in Fig. 3a. From the Ip on pH dependence it is seen that different ionic species, having different diffusion coefficients are present in the solution. As can be seen Ip is increase from pH 4 to 7 and then it decrease from 7 to 10. The higher sensitivity will be obtained at pH 7.So, the pH 7 was chosen because it is close to physiological pH. It was found that the peak potential is shifted to more negative values with increasing pH of 2.0-9.0, which could indicate the presence of chemical reaction (proton-transfer reaction) precedes the electrode process. Following equation displays correlation between peak potential and pH: E (mV)= -71.95 pH + 1590.6
Int. J. Electrochem. Sci., Vol. 4, 2009
450
The slope is close to that expected for a 3proton/2electron reaction. That is based on the equation of 0.0592(h/n) V/pH, where h and n are the number of protons and electrons involved in the electrode process [23].This is in accordance with literature data about mechanistic scheme of some catechol groups compounds to changed hydroxyl group to quinon group [24]. For analytical purposes, the medium chosen to carry out further studies was the 0.05 mol l-1 acetate buffer solution at pH 7.0.
0
1
2
3
4
5
6
7
8
3 5 7 9 11 13 15pH
I(µµ µµ
A)
y = -71.95x + 1590.6R2 = 0.9939
850
950
1050
1150
1250
1350
3 5 7 9 11pH
E(m
V)
Figure 3. Influence of pH on the a) peak potential and b)peak current for 1.0 ×10⁻⁷M in 0.05M of acetate buffer.
3.3. Effect of accumulation potential
The dependence of the peak current on the accumulation potential was evaluated over the range of -1.0 to 0.2V for 1.0 ×10⁻⁷mol l-1 of Diphenhydramin at 0.05 mol l-1 acetate buffer pH 7.0 in the presence of the drug, for an accumulation period of 20s. The inset at Fig.4 the results obtained shown that the Ip values are maximum for an accumulation potential -0.8V and after that the current decrease so the potential -0.8V was selected as a best accumulation potential.
3.4. Effect of accumulation time
As expected, the extent pre-concentration is a function of the accumulation time (tacc). The dependence of peak current on accumulation time was studied at concentration level of Diphenhydramin 1.0 ×10⁻⁷mol l-1(Fig.4). The peak current increased with increasing accumulation time till 15s and after that it decrease. For a period longer than 15s indicating the saturation of the
Int. J. Electrochem. Sci., Vol. 4, 2009
451
carbon paste electrode by drug to make a fouling of the electrode. Hence, an accumulation time of 15s were chosen to evaluate the best work conditions to the proposed method.
5
5.5
6
6.5
7
7.5
-1200 -700 -200 300 800accumulation potential/mV
I(µµ µµA
)
5
5.5
6
6.5
7
7.5
0 20 40 60t/s
I(µµ µµ
A)
Figure 4. effect of the accumulation time and potential on the peak current in the presence of Diphenhydramin solution a) 1.0 ×10⁻⁷M at acetate buffer pH=7. ƒ=1000Hz, amplitude = 20mV
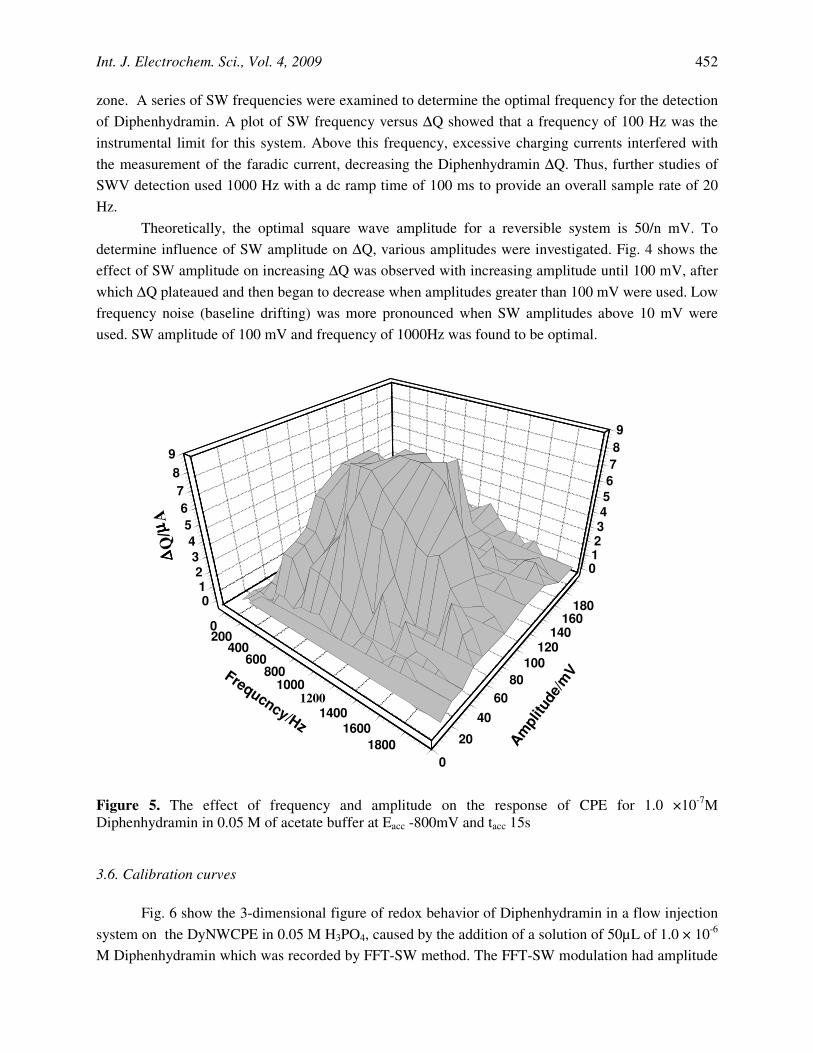
3.5. Optimization of FFT-SW frequency and amplitude
To study the effect of these factors, the SW frequency and amplitude between 500-2000 Hz and amplitude of 5 to 50 mV were examined. In Fig. 5 the importance of frequency and amplitude is demonstrated for solution of Diphenhydramin. In fast voltammetric analysis, the SW frequency and amplitude are important factors since analyte signal, background noise, and peak shape rely on speed of excitation signal. It should be noted that the solution resistance, electrode diameter, and stray capacitance of the system will limit the sensitivity gains obtained by raising the SW frequency. However, increasing the SW frequency will increase the SW peak current, or the sensitivity, but this will be tempered by a higher charging/faradic current ratio. Due to this fact that, the SW frequency acts similar to sweep rate in cyclic voltammetry. Therefore, using very high SW frequencies causes a shorter potential scan times, consequently, the response peak for the analysis becomes smaller and skewed, due to insufficient time for oxidation of the electrode surface. But for the redox reaction it should be optimized for electron transfer rate. While application of lower SW frequencies results to a longer potential scan times, which result to lower number of potential scan for each injected sample
Int. J. Electrochem. Sci., Vol. 4, 2009
452
zone. A series of SW frequencies were examined to determine the optimal frequency for the detection of Diphenhydramin. A plot of SW frequency versus ∆Q showed that a frequency of 100 Hz was the instrumental limit for this system. Above this frequency, excessive charging currents interfered with the measurement of the faradic current, decreasing the Diphenhydramin ∆Q. Thus, further studies of SWV detection used 1000 Hz with a dc ramp time of 100 ms to provide an overall sample rate of 20 Hz.
Theoretically, the optimal square wave amplitude for a reversible system is 50/n mV. To determine influence of SW amplitude on ∆Q, various amplitudes were investigated. Fig. 4 shows the effect of SW amplitude on increasing ∆Q was observed with increasing amplitude until 100 mV, after which ∆Q plateaued and then began to decrease when amplitudes greater than 100 mV were used. Low frequency noise (baseline drifting) was more pronounced when SW amplitudes above 10 mV were used. SW amplitude of 100 mV and frequency of 1000Hz was found to be optimal.
0200
400600
8001000
12001400
16001800
0
20
4060
80100
120140
1601800
1234
56
78
9
0123456789
Frequcncy/Hz
Ampl
itude
/mV
∆∆∆∆Q
/µµµµA
Figure 5. The effect of frequency and amplitude on the response of CPE for 1.0 ×10⁻⁷M Diphenhydramin in 0.05 M of acetate buffer at Eacc -800mV and tacc 15s
3.6. Calibration curves
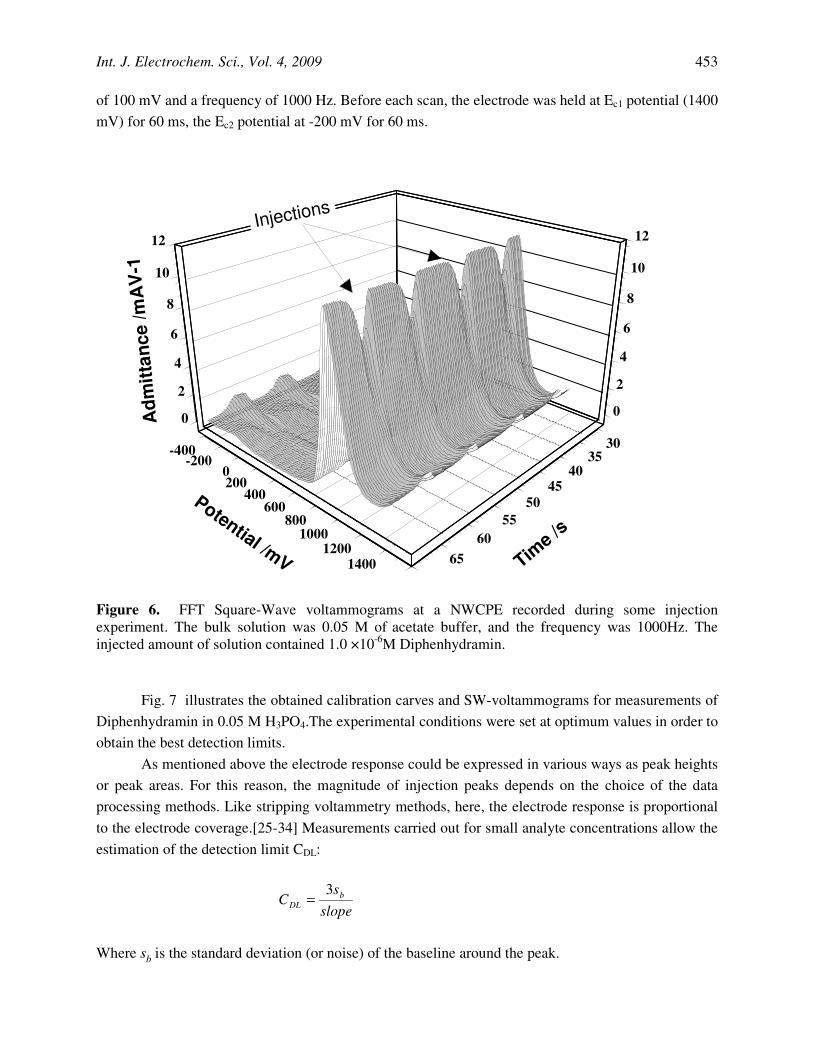
Fig. 6 show the 3-dimensional figure of redox behavior of Diphenhydramin in a flow injection system on the DyNWCPE in 0.05 M H3PO4, caused by the addition of a solution of 50µL of 1.0 × 10⁻⁶ M Diphenhydramin which was recorded by FFT-SW method. The FFT-SW modulation had amplitude
Int. J. Electrochem. Sci., Vol. 4, 2009
453
of 100 mV and a frequency of 1000 Hz. Before each scan, the electrode was held at Ec1 potential (1400 mV) for 60 ms, the Ec2 potential at -200 mV for 60 ms.
-400-200
0200
400600
8001000
12001400
3035
4045
5055
6065
0
2
4
6
8
10
12
0
2
4
6
8
10
12
Time /s
Potential /mV
Adm
ittan
ce /m
AV
-1
Injections
Figure 6. FFT Square-Wave voltammograms at a NWCPE recorded during some injection experiment. The bulk solution was 0.05 M of acetate buffer, and the frequency was 1000Hz. The injected amount of solution contained 1.0 ×10⁻⁶M Diphenhydramin.
Fig. 7 illustrates the obtained calibration carves and SW-voltammograms for measurements of Diphenhydramin in 0.05 M H3PO4.The experimental conditions were set at optimum values in order to obtain the best detection limits.
As mentioned above the electrode response could be expressed in various ways as peak heights or peak areas. For this reason, the magnitude of injection peaks depends on the choice of the data processing methods. Like stripping voltammetry methods, here, the electrode response is proportional to the electrode coverage.[25-34] Measurements carried out for small analyte concentrations allow the estimation of the detection limit CDL:
slope
sC b
DL
3=
Where sb is the standard deviation (or noise) of the baseline around the peak.
Int. J. Electrochem. Sci., Vol. 4, 2009
454
-2.5
-1.5
-0.5
0.5
1.5
2.5
3.5
4.5
5.5
6.5
7.5
500 700 900 1100 1300 1500 1700 1900
E/mV
I( µA
)
y = 24.002x + 4.6512R2 = 0.9975
4
4.5
5
5.5
6
6.5
7
7.5
0 0.05 0.1C(µM)
I( µA
)
Figure 7. Adsorptive square wave voltammograms obtained for the increasing concentration of Diphenhydramin in acetate buffer (pH=7) a) buffer (b-i) at concentrations ( 0.1,0.05,0.01,0.008,0.005,0.001 and 0.0001 µM) respectively. Intercept: dependence of peak current on the Diphenhydramin concentration at the optimized condition which mentioned before.
The Linearity was evaluated by linear regression analysis, which calculated by the least square regression method [35]. The calibration curves constructed for Diphenhydramin were linear over the concentration range of 0.1-0.0001µM. Peak areas of Diphenhydramin were plotted versus its concentration and linear regression analysis performed on the resultant curve. A correlation coefficient of R=0.9982 with %R.S.D. values ranging from 0.22–2.3% across the concentration range studied were obtained following linear regression analysis. Typically, the regression equation for the calibration curve was found to be Y= 24.002+4.6512 Fig.7. shows the calibration graph that obtained for the monitoring of Diphenhydramin in a 0.05 M H3PO4. The LOD was measured as the lowest amount of the analyte that may be detected to produce a response which is significantly different from that of a blank. Limit of detection was approved by calculations based on the standard deviation of the response (�) and the slope (S) of the calibration curve at the levels approaching the limits according to equation LOD= 3.3 (�/S) [35]. The LOD for Diphenhydramin was 4.0 ×10⁻¹¹M. The LOQ was measured as the lowest amount of analyte that can be reproducibly quantified above the baseline noise, for which triplicated injections resulted in a RSD � 1.5%. A practical LOQ giving a good precision and acceptable accuracy was found to be 8.0 ×10⁻¹¹M.
Int. J. Electrochem. Sci., Vol. 4, 2009
455
3.7. Assay of tablets
The method developed in the present study was applied for the determination of Diphenhydramin in tablets from the Iranian market. The results showed a percent recovery of 99.96% and a R.S.D. of 1.22%.
3.8. Analytical application
After the application of the method to the Iranian market injection, the resulting data showed a recovery percentage value of 99.88 % and a respective R.S.D. value of 1.94 %. The proposed method was also applied to the determination of Diphenhydramin in spiked urine and plasma samples. The results of analysis of spiked��human plasma (n = 5) and urine (n=5) is shown in Table 1. The results are satisfactory, accurate and precise. No interference was noticed from the urine content after just dilution with the supporting electrolyte. The major advantage of the method as applied to plasma and urine is that no prior extraction step is required.
Table 1. Application of the proposed method to the determination of Diphenhydramin in spiked humane plasma and urine
By comparison of the detection limit of the proposed method with the other reported methods
(Table2) it is very clear that the sensitivity of the method is superior to all previously reported methods. The data reveals that the detection limit of the method is about 1000 times lower than the most sensitive reported method.
Table �. Comparison between the detection limit of the proposed method with those of other reported methods
This report described a novel, sensitive, and widely applicable FFT-SWV detection method using of DyNW/CPE. This modification by metal oxide nanowire help to improve the sensivity of determination of drug by reducing the over-potential and increasing the current, like other nanomaterial such as carbon nanotubes. It is observed that DyNW could facilitate the exchange electrons with the electrode FFT-SWV was demonstrated to provide sensitive detection of a wide range of analytes based on oxidation on the electrode surface. The square-wave adsorptive voltammetry on a carbon paste electrode can be used to determine Diphenhydramin at trace levels because of its low detection limit. Diphenhydramin can be effectively accumulated from aqueous solutions or urine samples onto the surface of DyNWCPE increasing sensitivity of the method. The electrochemical methods for pharmaceutical and biological samples analysis have been proven to be fast, precise, and simple to perform and produce low cost results, in which the interference from excipients of the drugs and interference of the biological fluids do not interfere with the determination, and, consequently, extraction procedures are not needed. The above methods can be suggested as a good alternative for the routine quality control of this antibiotic drug in pharmaceutical formulation.
Finally, the principal advantage of the electroanalytical method is that it was simple, fast and more sensitive than the reported method [2,6,8] with precision and accuracy equivalent. It is hoped that this will make FFT-SWV easier to use as well as provide enhanced sensitivity. Also, application of FFT-SWV to high-performance liquid chromatography is being considered. ACKNOWLEDGEMENTS This was supported by research council of university of Tehran. References 1. G. D. Raphael, J. T. Angello, M. M. Wu, H. M. Druce, Ann. Allergy Asthma Immunol. 96 (2006)
606. 2. P. Reguera, M. G. Rubio, Anal. Sci. 25 (2004) 799. 3. C. Wang, G. Fan, M. Lin, Y. Chen, W. Zhao, Y. Wu, J. Chramaogr. B, 854 (2007) 48. 4. P. Tipparat, S. Lapanantnoppakhun, J. Parma. Biomed. Anal. 30 (2002)105. 5. W. S. Hassan, M. M. El-Henawee, A. A Gouda, J. Spectrochim. Acta part A, 69 (2008) 245. 6. S. S. Rai, S. U Kapdia, A. P Argekar, Talanta, 46 (1998) 221. 7. C. Barbas, A. Garsia, L. Saavedra, M. Castro, J. Chromatogr. A, 870 (2000) 97. 8. M. R. Gomez, R. A. Olsina, J. Pharm. Biomed. Anal. 30 (2002) 791. 9. Y. Dong, X. Chen, Y. Chen, X. Chen, Z .Hu, J. Pharm. Biomed. Anal. 39 (2005) 285. 10. Y. C. Tsai, B. A. Coles, G. Compton, F. Marken, Electroanalysis, 13 (2001) 639. 11. S. H. Tan, S. P. Kounaves, Electroanalysis, 10 (1998) 364. 12. D. Rurikova, I. Kunakova, Chem. Papers, 53 (1999) 246. 13. K. Kalcher, J. M. Kaufmann, J. Wang, I. Svancara, K. Vytras, C. Neuhold, Z. Yang,
Electroanalysis, 7 (1995) 5. 14. F. Valentini, A. Amine, S. Orlandocci, M. L. Terranova, G. Palleschi, Anal. Chem. 75 (2003) 5413. 15. A. Antiochia, I. Lavagnini, F. Magno, F. Valentini, G. Palleschi, Electroanalysis, 16 (2004) 1451. 16. P. Norouzi, M. R. Ganjali, S. Shirvani-Arani, A. Mohammadi, J. Pharm. Sci. 95 (2007) 893.
Int. J. Electrochem. Sci., Vol. 4, 2009
457
17. P. Norouzi, S. Shirvani-Arani, P. Daneshgar, M. R. Ganjali, Biosens. Bioelectron. 22 (2006) 1068. 18. P. Norouzi, M. R. Ganjali, A. A. Moosavi-Movahedi, J. Brazil. Chem. Soc. 18 (2007)� 231. 19. P. Norouzi, M. R. Ganjali, P. Daneshgar, Anal. Lett. 40 (2007) 547. 20. P. Norouzi, M. R. Ganjali, L. Hajiaghababaei Anal. Lett. 39 (2006) 1941. 21. P. Norouzi, M. R. Ganjali, P. Daneshgar, Sens. Actuators B, 123 (2007) 1125. 22. P. Norouzi, M. R. Ganjali, P. Daneshgar, T. Alizadeh, A. Mohammadi, Anal. Biochem. 360 (2007)
175. 23. A. Radi, M. A. El Ries, F. El-Anwar, Z. El-Sherif, Anal. Lett. 34 (2001) 739. 24. H. R. Zare, M. Namazian, N. Nasirizadeh, J. Electroanal. Chem. 584 (2005) 77. 25. P. Norouzi, M. R. Ganjali, P. Daneshgar, J. Pharmacol. Toxicol .Methods, 55 (2007) 289. 26. P. Norouzi, M. R. Ganjali, A. A. Moosavi-movahedi, B. Larijani, Talanta, 73 (2007) 54. 27. P. Norouzi, M. R. Ganjali, M. Zare, A. Mohammadi, J. Pharm. Sci. 96 (2007) 2009. 28. P. Norouzi, M. R. Ganjali, B. Akbari-Adergani, Acta Chim. Slov. 53 (2007) 499. 29. G. Nabi Bidhendi, P. Norouzi, P. Daneshgar, M. R. Ganjali, J. Hazard. Mater. 143 (2007) 264. 30. P. Norouzi, M. R. Ganjali, S. Labbafi, A. Mohammadi, Anal. Lett. 40 (2007) 747. 31. P, Norouzi, M. R. Ganjali, P. Daneshgar, P. Dinarvand, A. A. Moosavi-Movahedi, A. A. Saboury
Anal. Chim. Acta, 590 (2007) 74. 32. P. Norouzi, G. R. Nabi Bidhendi, M. R. Ganjali, A. Sepehri, M. Ghorbani, Microchim. Acta, 152
(2005) 123. 33. P. Norouzi, M. R. Ganjali, T. Alizadeh, P. Daneshgar, Electroanalysis, 18 (2006) 947. 34. M. R. Ganjali, P. Norouzi, M. Ghorbani, A. Sepehri, Talanta, 66 (2005) 1225. 35. J. C. Miller, J. N. Miller, Statistics for Analytical Chemistry, Ellis Horwood, Chichester, 22 (1984)