11
CANADIAN ECONOMIC OUTLOOK AND MARKET FUNDAMENTALS 20 20 THIRD QUARTER UPDATE 22 ND ANNUAL EDITION

CANADIAN ECONOMIC OUTLOOKAND MARKET FUNDAMENTALS20
20
THIRD QUARTER UPDATE
22
ND A
NN
UA
L E
DIT
ION

Copyright © 2020 by Morguard Investments Limited. All rights reserved. Any request for reproduction of this Research Report should be directed to: Keith Reading Director of Research 905-281-5345 [email protected]
FORWARD-LOOKING STATEMENTS DISCLAIMER
Statements contained herein that are not based on historical or current fact, including without limitation statements containing the words “anticipates,” “believes,” “may,” “continue,” “estimate,” “expects” and “will” and words of similar expression, constitute “forward-looking statements.” Such forward-looking statements involve known and unknown risks, uncertainties and other factors that may cause the actual results, events or developments to be materially different from any future results, events or developments expressed or implied by such forward-looking statements. Such factors include, among others, the following: general economic and business conditions, both nationally and regionally; changes in business strategy; financing risk; existing governmental regulations and changes in, or the failure to comply with, governmental regulations; liability and other claims asserted; and other factors. Given these uncertainties, readers are cautioned not to place undue reliance on such forward-looking statements. The Publisher does not assume the obligation to update or revise any forward-looking statements.
TABLE OF CONTENTS
THIRD QUARTER UPDATE
CANADIAN ECONOMIC OUTLOOKAND MARKET FUNDAMENTALS20
20
4 Q3 2020 UPDATE | 2020 CANADIAN ECONOMIC OUTLOOK & MARKET FUNDAMENTALS
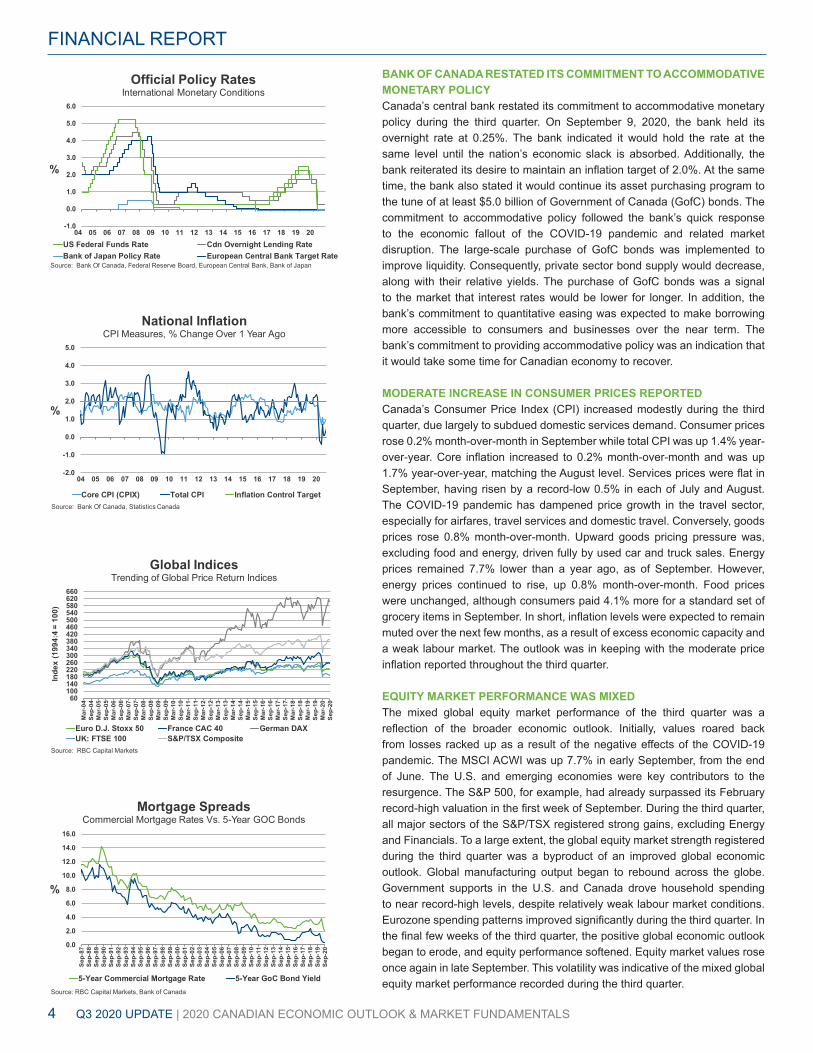
BANK OF CANADA RESTATED ITS COMMITMENT TO ACCOMMODATIVE MONETARY POLICYCanada’s central bank restated its commitment to accommodative monetary policy during the third quarter. On September 9, 2020, the bank held its overnight rate at 0.25%. The bank indicated it would hold the rate at the same level until the nation’s economic slack is absorbed. Additionally, the bank reiterated its desire to maintain an inflation target of 2.0%. At the same time, the bank also stated it would continue its asset purchasing program to the tune of at least $5.0 billion of Government of Canada (GofC) bonds. The commitment to accommodative policy followed the bank’s quick response to the economic fallout of the COVID-19 pandemic and related market disruption. The large-scale purchase of GofC bonds was implemented to improve liquidity. Consequently, private sector bond supply would decrease, along with their relative yields. The purchase of GofC bonds was a signal to the market that interest rates would be lower for longer. In addition, the bank’s commitment to quantitative easing was expected to make borrowing more accessible to consumers and businesses over the near term. The bank’s commitment to providing accommodative policy was an indication that it would take some time for Canadian economy to recover.
MODERATE INCREASE IN CONSUMER PRICES REPORTEDCanada’s Consumer Price Index (CPI) increased modestly during the third quarter, due largely to subdued domestic services demand. Consumer prices rose 0.2% month-over-month in September while total CPI was up 1.4% year-over-year. Core inflation increased to 0.2% month-over-month and was up 1.7% year-over-year, matching the August level. Services prices were flat in September, having risen by a record-low 0.5% in each of July and August. The COVID-19 pandemic has dampened price growth in the travel sector, especially for airfares, travel services and domestic travel. Conversely, goods prices rose 0.8% month-over-month. Upward goods pricing pressure was, excluding food and energy, driven fully by used car and truck sales. Energy prices remained 7.7% lower than a year ago, as of September. However, energy prices continued to rise, up 0.8% month-over-month. Food prices were unchanged, although consumers paid 4.1% more for a standard set of grocery items in September. In short, inflation levels were expected to remain muted over the next few months, as a result of excess economic capacity and a weak labour market. The outlook was in keeping with the moderate price inflation reported throughout the third quarter.
EQUITY MARKET PERFORMANCE WAS MIXED The mixed global equity market performance of the third quarter was a reflection of the broader economic outlook. Initially, values roared back from losses racked up as a result of the negative effects of the COVID-19 pandemic. The MSCI ACWI was up 7.7% in early September, from the end of June. The U.S. and emerging economies were key contributors to the resurgence. The S&P 500, for example, had already surpassed its February record-high valuation in the first week of September. During the third quarter, all major sectors of the S&P/TSX registered strong gains, excluding Energy and Financials. To a large extent, the global equity market strength registered during the third quarter was a byproduct of an improved global economic outlook. Global manufacturing output began to rebound across the globe. Government supports in the U.S. and Canada drove household spending to near record-high levels, despite relatively weak labour market conditions. Eurozone spending patterns improved significantly during the third quarter. In the final few weeks of the third quarter, the positive global economic outlook began to erode, and equity performance softened. Equity market values rose once again in late September. This volatility was indicative of the mixed global equity market performance recorded during the third quarter.
FINANCIAL REPORT
-1.0
0.0
1.0
2.0
3.0
4.0
5.0
6.0
%
Official Policy RatesInternational Monetary Conditions
US Federal Funds Rate Cdn Overnight Lending RateBank of Japan Policy Rate European Central Bank Target Rate
Source: Bank Of Canada, Federal Reserve Board, European Central Bank, Bank of Japan
0.0
2.0
4.0
6.0
8.0
10.0
12.0
14.0
16.0
Sep
-87
Sep
-88
Sep
-89
Sep
-90
Sep
-91
Sep
-92
Sep
-93
Sep
-94
Sep
-95
Sep
-96
Sep
-97
Sep
-98
Sep
-99
Sep
-00
Sep
-01
Sep
-02
Sep
-03
Sep
-04
Sep
-05
Sep
-06
Sep
-07
Sep
-08
Sep
-09
Sep
-10
Sep
-11
Sep
-12
Sep
-13
Sep
-14
Sep
-15
Sep
-16
Sep
-17
Sep
-18
Sep
-19
Sep
-20
%
Mortgage SpreadsCommercial Mortgage Rates Vs. 5-Year GOC Bonds
5-Year Commercial Mortgage Rate 5-Year GoC Bond YieldSource: RBC Capital Markets, Bank of Canada
60100140180220260300340380420460500540580620660
Mar
-04
Sep
-04
Mar
-05
Sep
-05
Mar
-06
Sep
-06
Mar
-07
Sep
-07
Mar
-08
Sep
-08
Mar
-09
Sep
-09
Mar
-10
Sep
-10
Mar
-11
Sep
-11
Mar
-12
Sep
-12
Mar
-13
Sep
-13
Mar
-14
Sep
-14
Mar
-15
Sep
-15
Mar
-16
Sep
-16
Mar
-17
Sep
-17
Mar
-18
Sep
-18
Mar
-19
Sep
-19
Mar
-20
Sep
-20
Inde
x (1
994:
4 =
100)
Global IndicesTrending of Global Price Return Indices
Euro D.J. Stoxx 50 France CAC 40 German DAXUK: FTSE 100 S&P/TSX Composite
Source: RBC Capital Markets
-2.0
-1.0
0.0
1.0
2.0
3.0
4.0
5.0
04 05 06 07 08 09 10 11 12 13 14 15 16 17 18 19 20
%
National InflationCPI Measures, % Change Over 1 Year Ago
Core CPI (CPIX) Total CPI Inflation Control TargetSource: Bank Of Canada, Statistics Canada
2020 CANADIAN ECONOMIC OUTLOOK & MARKET FUNDAMENTALS | Q3 2020 UPDATE 5
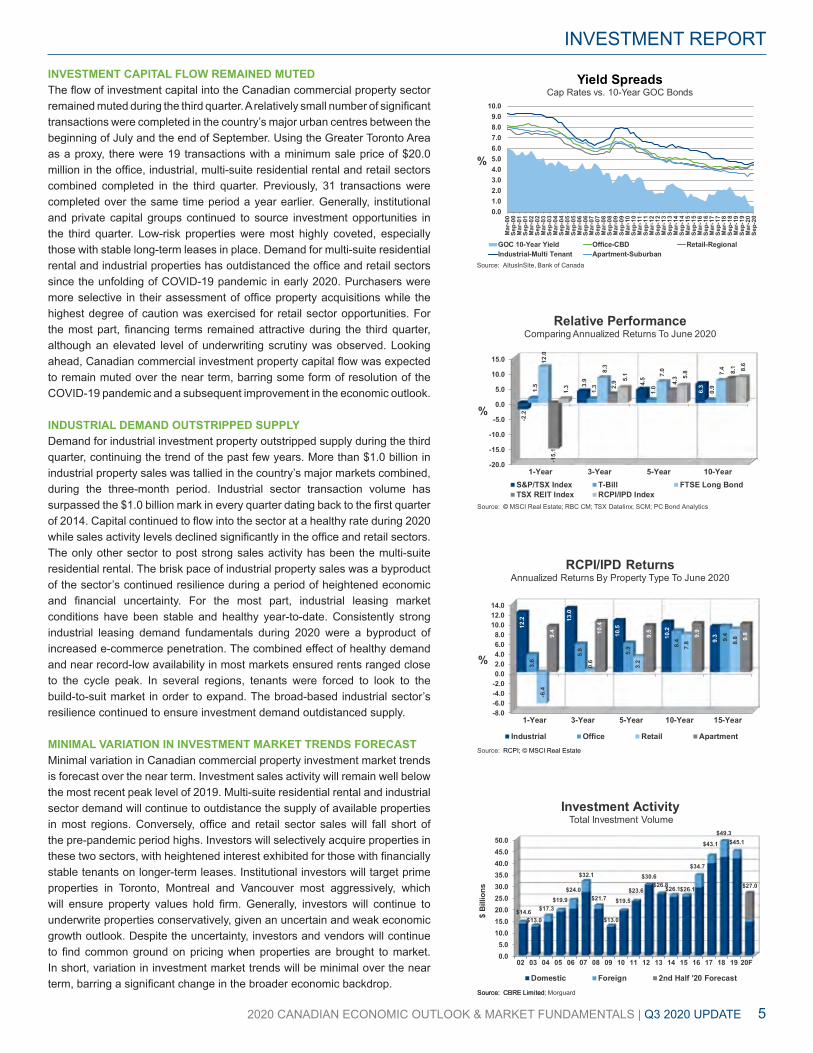
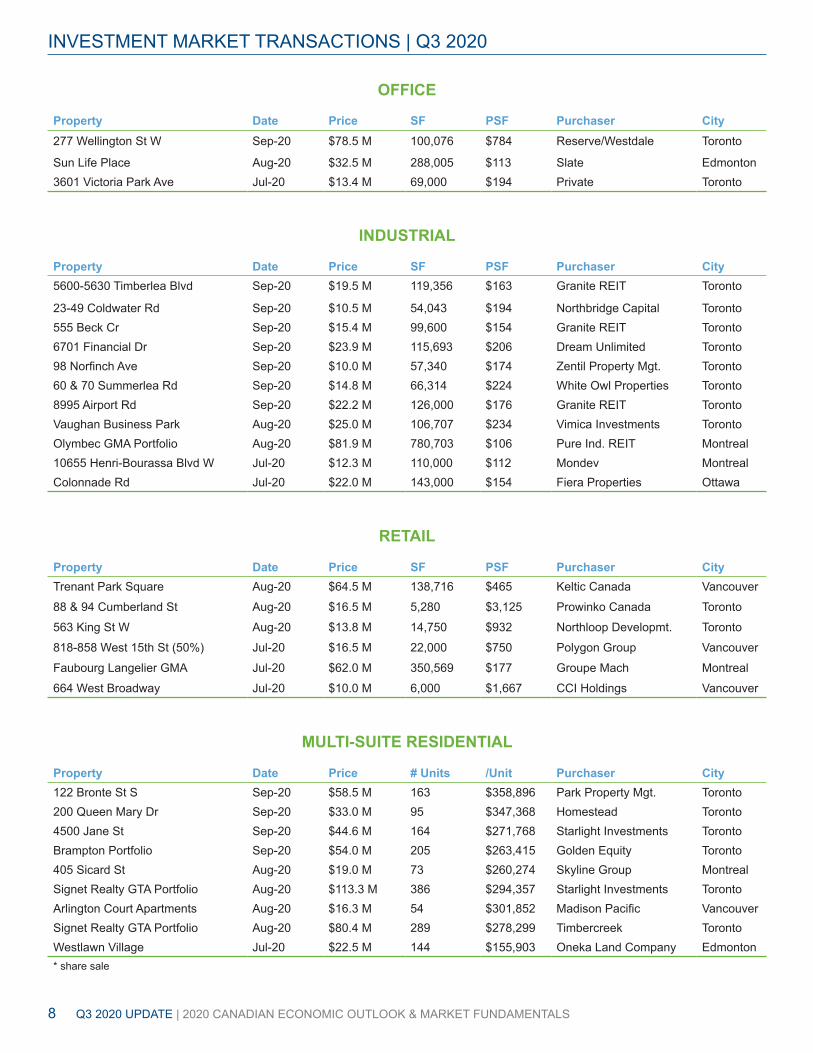
INVESTMENT CAPITAL FLOW REMAINED MUTEDThe flow of investment capital into the Canadian commercial property sector remained muted during the third quarter. A relatively small number of significant transactions were completed in the country’s major urban centres between the beginning of July and the end of September. Using the Greater Toronto Area as a proxy, there were 19 transactions with a minimum sale price of $20.0 million in the office, industrial, multi-suite residential rental and retail sectors combined completed in the third quarter. Previously, 31 transactions were completed over the same time period a year earlier. Generally, institutional and private capital groups continued to source investment opportunities in the third quarter. Low-risk properties were most highly coveted, especially those with stable long-term leases in place. Demand for multi-suite residential rental and industrial properties has outdistanced the office and retail sectors since the unfolding of COVID-19 pandemic in early 2020. Purchasers were more selective in their assessment of office property acquisitions while the highest degree of caution was exercised for retail sector opportunities. For the most part, financing terms remained attractive during the third quarter, although an elevated level of underwriting scrutiny was observed. Looking ahead, Canadian commercial investment property capital flow was expected to remain muted over the near term, barring some form of resolution of the COVID-19 pandemic and a subsequent improvement in the economic outlook.
INDUSTRIAL DEMAND OUTSTRIPPED SUPPLYDemand for industrial investment property outstripped supply during the third quarter, continuing the trend of the past few years. More than $1.0 billion in industrial property sales was tallied in the country’s major markets combined, during the three-month period. Industrial sector transaction volume has surpassed the $1.0 billion mark in every quarter dating back to the first quarter of 2014. Capital continued to flow into the sector at a healthy rate during 2020 while sales activity levels declined significantly in the office and retail sectors. The only other sector to post strong sales activity has been the multi-suite residential rental. The brisk pace of industrial property sales was a byproduct of the sector’s continued resilience during a period of heightened economic and financial uncertainty. For the most part, industrial leasing market conditions have been stable and healthy year-to-date. Consistently strong industrial leasing demand fundamentals during 2020 were a byproduct of increased e-commerce penetration. The combined effect of healthy demand and near record-low availability in most markets ensured rents ranged close to the cycle peak. In several regions, tenants were forced to look to the build-to-suit market in order to expand. The broad-based industrial sector’s resilience continued to ensure investment demand outdistanced supply.
MINIMAL VARIATION IN INVESTMENT MARKET TRENDS FORECASTMinimal variation in Canadian commercial property investment market trends is forecast over the near term. Investment sales activity will remain well below the most recent peak level of 2019. Multi-suite residential rental and industrial sector demand will continue to outdistance the supply of available properties in most regions. Conversely, office and retail sector sales will fall short of the pre-pandemic period highs. Investors will selectively acquire properties in these two sectors, with heightened interest exhibited for those with financially stable tenants on longer-term leases. Institutional investors will target prime properties in Toronto, Montreal and Vancouver most aggressively, which will ensure property values hold firm. Generally, investors will continue to underwrite properties conservatively, given an uncertain and weak economic growth outlook. Despite the uncertainty, investors and vendors will continue to find common ground on pricing when properties are brought to market. In short, variation in investment market trends will be minimal over the near term, barring a significant change in the broader economic backdrop.
INVESTMENT REPORT
-8.0-6.0-4.0-2.00.02.04.06.08.0
10.012.014.0
1-Year 3-Year 5-Year 10-Year 15-Year
12.2 13
.0
10.5
10.2
9.3
3.6
5.8 5.9 8.
4 9.4
-6.4
0.6
3.2
7.8 8.
89.4 10
.4
9.5
9.9
9.8
%
RCPI/IPD ReturnsAnnualized Returns By Property Type To June 2020
Industrial Office Retail ApartmentSource: RCPI; © MSCI Real Estate
-20.0
-15.0
-10.0
-5.0
0.0
5.0
10.0
15.0
1-Year 3-Year 5-Year 10-Year
-2.2
3.9 4.5
6.31.5
1.3
1.0
0.9
12.0
8.3
7.0 7.4
-15.
1
2.9 4.
3
8.1
1.3
5.1 5.8 8.
6
%
Relative PerformanceComparing Annualized Returns To June 2020
S&P/TSX Index T-Bill FTSE Long BondTSX REIT Index RCPI/IPD Index
Source: © MSCI Real Estate; RBC CM; TSX Datalinx; SCM; PC Bond Analytics
0.05.0
10.015.020.025.030.035.040.045.050.0
02 03 04 05 06 07 08 09 10 11 12 13 14 15 16 17 18 19 20F
$14.6$13.0
$17.3$19.9
$24.0
$32.1
$21.7
$13.0
$19.5$23.6
$30.6$26.8$26.1$26.1
$34.7
$43.1
$49.3$45.1
$27.0
$ B
illio
ns
Investment ActivityTotal Investment Volume
Domestic Foreign 2nd Half '20 Forecast
Source: CBRE LimitedSource: CBRE Limited; Morguard
0.01.02.03.04.05.06.07.08.09.0
10.0
Mar
-00
Sep
-00
Mar
-01
Sep
-01
Mar
-02
Sep
-02
Mar
-03
Sep
-03
Mar
-04
Sep
-04
Mar
-05
Sep
-05
Mar
-06
Sep
-06
Mar
-07
Sep
-07
Mar
-08
Sep
-08
Mar
-09
Sep
-09
Mar
-10
Sep
-10
Mar
-11
Sep
-11
Mar
-12
Sep
-12
Mar
-13
Sep
-13
Mar
-14
Sep
-14
Mar
-15
Sep
-15
Mar
-16
Sep
-16
Mar
-17
Sep
-17
Mar
-18
Sep
-18
Mar
-19
Sep
-19
Mar
-20
Sep
-20
%
Yield Spreads Cap Rates vs. 10-Year GOC Bonds
GOC 10-Year Yield Office-CBD Retail-RegionalIndustrial-Multi Tenant Apartment-Suburban
Source: AltusInSite, Bank of Canada
6 Q3 2020 UPDATE | 2020 CANADIAN ECONOMIC OUTLOOK & MARKET FUNDAMENTALS
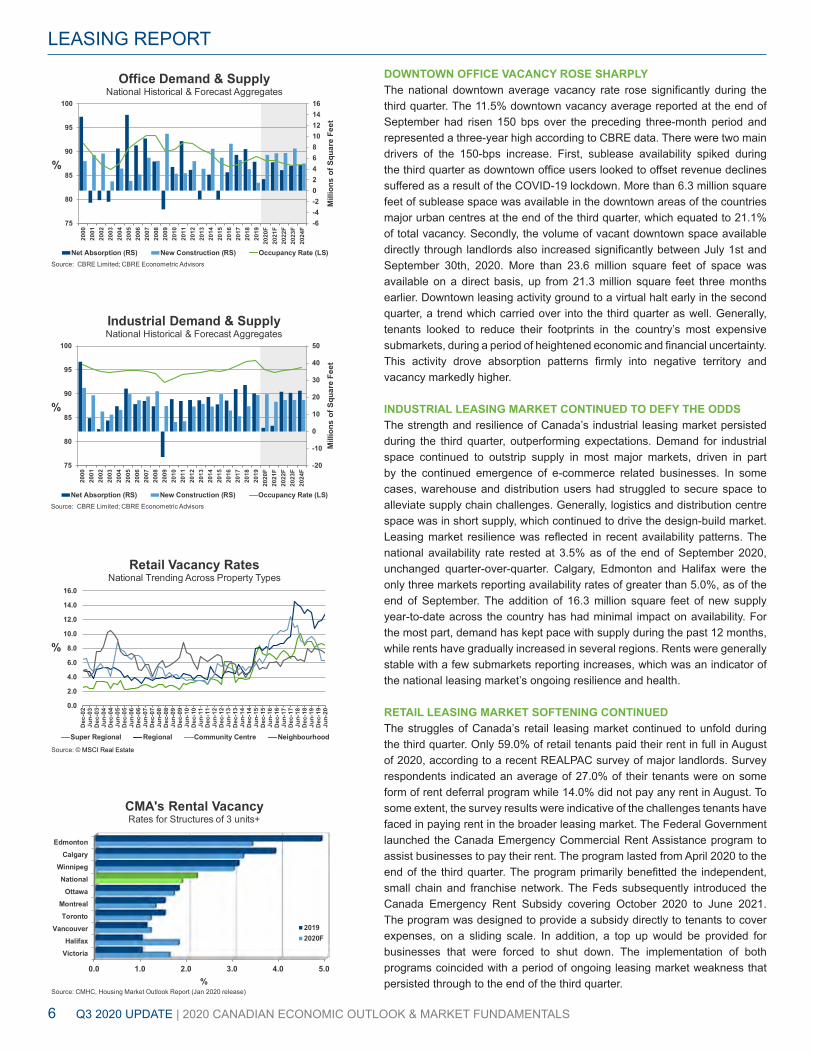
DOWNTOWN OFFICE VACANCY ROSE SHARPLYThe national downtown average vacancy rate rose significantly during the third quarter. The 11.5% downtown vacancy average reported at the end of September had risen 150 bps over the preceding three-month period and represented a three-year high according to CBRE data. There were two main drivers of the 150-bps increase. First, sublease availability spiked during the third quarter as downtown office users looked to offset revenue declines suffered as a result of the COVID-19 lockdown. More than 6.3 million square feet of sublease space was available in the downtown areas of the countries major urban centres at the end of the third quarter, which equated to 21.1% of total vacancy. Secondly, the volume of vacant downtown space available directly through landlords also increased significantly between July 1st and September 30th, 2020. More than 23.6 million square feet of space was available on a direct basis, up from 21.3 million square feet three months earlier. Downtown leasing activity ground to a virtual halt early in the second quarter, a trend which carried over into the third quarter as well. Generally, tenants looked to reduce their footprints in the country’s most expensive submarkets, during a period of heightened economic and financial uncertainty. This activity drove absorption patterns firmly into negative territory and vacancy markedly higher.
INDUSTRIAL LEASING MARKET CONTINUED TO DEFY THE ODDSThe strength and resilience of Canada’s industrial leasing market persisted during the third quarter, outperforming expectations. Demand for industrial space continued to outstrip supply in most major markets, driven in part by the continued emergence of e-commerce related businesses. In some cases, warehouse and distribution users had struggled to secure space to alleviate supply chain challenges. Generally, logistics and distribution centre space was in short supply, which continued to drive the design-build market. Leasing market resilience was reflected in recent availability patterns. The national availability rate rested at 3.5% as of the end of September 2020, unchanged quarter-over-quarter. Calgary, Edmonton and Halifax were the only three markets reporting availability rates of greater than 5.0%, as of the end of September. The addition of 16.3 million square feet of new supply year-to-date across the country has had minimal impact on availability. For the most part, demand has kept pace with supply during the past 12 months, while rents have gradually increased in several regions. Rents were generally stable with a few submarkets reporting increases, which was an indicator of the national leasing market’s ongoing resilience and health.
RETAIL LEASING MARKET SOFTENING CONTINUEDThe struggles of Canada’s retail leasing market continued to unfold during the third quarter. Only 59.0% of retail tenants paid their rent in full in August of 2020, according to a recent REALPAC survey of major landlords. Survey respondents indicated an average of 27.0% of their tenants were on some form of rent deferral program while 14.0% did not pay any rent in August. To some extent, the survey results were indicative of the challenges tenants have faced in paying rent in the broader leasing market. The Federal Government launched the Canada Emergency Commercial Rent Assistance program to assist businesses to pay their rent. The program lasted from April 2020 to the end of the third quarter. The program primarily benefitted the independent, small chain and franchise network. The Feds subsequently introduced the Canada Emergency Rent Subsidy covering October 2020 to June 2021. The program was designed to provide a subsidy directly to tenants to cover expenses, on a sliding scale. In addition, a top up would be provided for businesses that were forced to shut down. The implementation of both programs coincided with a period of ongoing leasing market weakness that persisted through to the end of the third quarter.
LEASING REPORT
0.0 1.0 2.0 3.0 4.0 5.0
VictoriaHalifax
VancouverToronto
MontrealOttawa
NationalWinnipeg
CalgaryEdmonton
%
CMA's Rental VacancyRates for Structures of 3 units+
20192020F
Source: CMHC, Housing Market Outlook Report (Jan 2020 release)
0.0
2.0
4.0
6.0
8.0
10.0
12.0
14.0
16.0
Dec
-02
Jun-
03D
ec-0
3Ju
n-04
Dec
-04
Jun-
05D
ec-0
5Ju
n-06
Dec
-06
Jun-
07D
ec-0
7Ju
n-08
Dec
-08
Jun-
09D
ec-0
9Ju
n-10
Dec
-10
Jun-
11D
ec-1
1Ju
n-12
Dec
-12
Jun-
13D
ec-1
3Ju
n-14
Dec
-14
Jun-
15D
ec-1
5Ju
n-16
Dec
-16
Jun-
17D
ec-1
7Ju
n-18
Dec
-18
Jun-
19D
ec-1
9Ju
n-20
%
Retail Vacancy RatesNational Trending Across Property Types
Super Regional Regional Community Centre Neighbourhood
Source: © MSCI Real Estate
-20
-10
0
10
20
30
40
50
75
80
85
90
95
100
2000
2001
2002
2003
2004
2005
2006
2007
2008
2009
2010
2011
2012
2013
2014
2015
2016
2017
2018
2019
2020
F20
21F
2022
F20
23F
2024
F
Mill
ions
of S
quar
e Fe
et
%
Industrial Demand & Supply National Historical & Forecast Aggregates
Net Absorption (RS) New Construction (RS) Occupancy Rate (LS)Source: CBRE Limited; CBRE Econometric Advisors
-6-4-20246810121416
75
80
85
90
95
100
2000
2001
2002
2003
2004
2005
2006
2007
2008
2009
2010
2011
2012
2013
2014
2015
2016
2017
2018
2019
2020
F20
21F
2022
F20
23F
2024
F
Mill
ions
of S
quar
e Fe
et
%
Office Demand & Supply National Historical & Forecast Aggregates
Net Absorption (RS) New Construction (RS) Occupancy Rate (LS)Source: CBRE Limited; CBRE Econometric Advisors
2020 CANADIAN ECONOMIC OUTLOOK & MARKET FUNDAMENTALS | Q3 2020 UPDATE 7
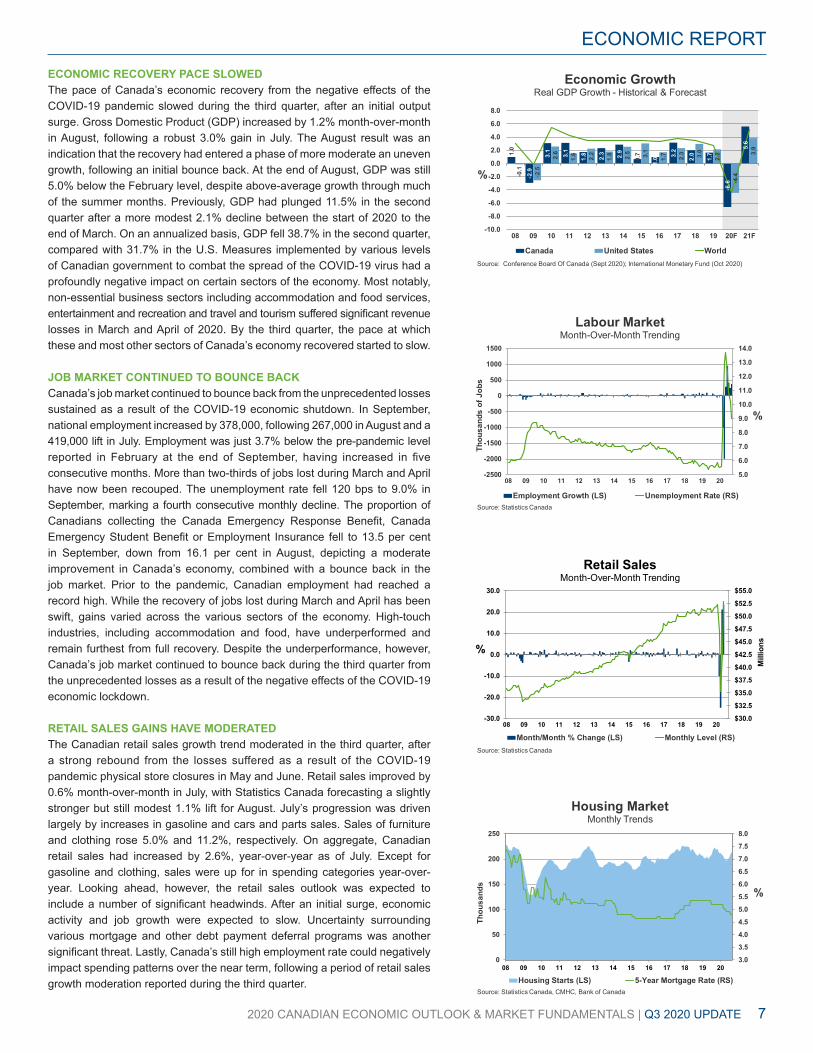
ECONOMIC RECOVERY PACE SLOWEDThe pace of Canada’s economic recovery from the negative effects of the COVID-19 pandemic slowed during the third quarter, after an initial output surge. Gross Domestic Product (GDP) increased by 1.2% month-over-month in August, following a robust 3.0% gain in July. The August result was an indication that the recovery had entered a phase of more moderate an uneven growth, following an initial bounce back. At the end of August, GDP was still 5.0% below the February level, despite above-average growth through much of the summer months. Previously, GDP had plunged 11.5% in the second quarter after a more modest 2.1% decline between the start of 2020 to the end of March. On an annualized basis, GDP fell 38.7% in the second quarter, compared with 31.7% in the U.S. Measures implemented by various levels of Canadian government to combat the spread of the COVID-19 virus had a profoundly negative impact on certain sectors of the economy. Most notably, non-essential business sectors including accommodation and food services, entertainment and recreation and travel and tourism suffered significant revenue losses in March and April of 2020. By the third quarter, the pace at which these and most other sectors of Canada’s economy recovered started to slow.
JOB MARKET CONTINUED TO BOUNCE BACKCanada’s job market continued to bounce back from the unprecedented losses sustained as a result of the COVID-19 economic shutdown. In September, national employment increased by 378,000, following 267,000 in August and a 419,000 lift in July. Employment was just 3.7% below the pre-pandemic level reported in February at the end of September, having increased in five consecutive months. More than two-thirds of jobs lost during March and April have now been recouped. The unemployment rate fell 120 bps to 9.0% in September, marking a fourth consecutive monthly decline. The proportion of Canadians collecting the Canada Emergency Response Benefit, Canada Emergency Student Benefit or Employment Insurance fell to 13.5 per cent in September, down from 16.1 per cent in August, depicting a moderate improvement in Canada’s economy, combined with a bounce back in the job market. Prior to the pandemic, Canadian employment had reached a record high. While the recovery of jobs lost during March and April has been swift, gains varied across the various sectors of the economy. High-touch industries, including accommodation and food, have underperformed and remain furthest from full recovery. Despite the underperformance, however, Canada’s job market continued to bounce back during the third quarter from the unprecedented losses as a result of the negative effects of the COVID-19 economic lockdown.
RETAIL SALES GAINS HAVE MODERATED The Canadian retail sales growth trend moderated in the third quarter, after a strong rebound from the losses suffered as a result of the COVID-19 pandemic physical store closures in May and June. Retail sales improved by 0.6% month-over-month in July, with Statistics Canada forecasting a slightly stronger but still modest 1.1% lift for August. July’s progression was driven largely by increases in gasoline and cars and parts sales. Sales of furniture and clothing rose 5.0% and 11.2%, respectively. On aggregate, Canadian retail sales had increased by 2.6%, year-over-year as of July. Except for gasoline and clothing, sales were up for in spending categories year-over-year. Looking ahead, however, the retail sales outlook was expected to include a number of significant headwinds. After an initial surge, economic activity and job growth were expected to slow. Uncertainty surrounding various mortgage and other debt payment deferral programs was another significant threat. Lastly, Canada’s still high employment rate could negatively impact spending patterns over the near term, following a period of retail sales growth moderation reported during the third quarter.
ECONOMIC REPORT
1.0
-2.9
3.1
3.1
1.8
2.3 2.9
0.7
1.0 3.
2
2.0
1.7
-6.6
5.6
-0.1
-2.5
2.6
1.6
2.2
1.8 2.5 3.1
1.7
2.3 3.0
2.2
-4.4
3.9
-10.0
-8.0
-6.0
-4.0
-2.0
0.0
2.0
4.0
6.0
8.0
08 09 10 11 12 13 14 15 16 17 18 19 20F 21F
%
Economic Growth Real GDP Growth - Historical & Forecast
Canada United States WorldSource: Conference Board Of Canada (Sept 2020); International Monetary Fund (Oct 2020)
5.0
6.0
7.0
8.0
9.0
10.0
11.0
12.0
13.0
14.0
-2500
-2000
-1500
-1000
-500
0
500
1000
1500
08 09 10 11 12 13 14 15 16 17 18 19 20
%
Thou
sand
s of
Job
s
Labour MarketMonth-Over-Month Trending
Employment Growth (LS) Unemployment Rate (RS)Source: Statistics Canada
$30.0
$32.5
$35.0
$37.5
$40.0
$42.5
$45.0
$47.5
$50.0
$52.5
$55.0
-30.0
-20.0
-10.0
0.0
10.0
20.0
30.0
08 09 10 11 12 13 14 15 16 17 18 19 20
Mill
ions%
Retail SalesMonth-Over-Month Trending
Month/Month % Change (LS) Monthly Level (RS)Source: Statistics Canada
3.0
3.5
4.0
4.5
5.0
5.5
6.0
6.5
7.0
7.5
8.0
0
50
100
150
200
250
08 09 10 11 12 13 14 15 16 17 18 19 20
%
Thou
sand
s
Housing MarketMonthly Trends
Housing Starts (LS) 5-Year Mortgage Rate (RS)Source: Statistics Canada, CMHC, Bank of Canada
8 Q3 2020 UPDATE | 2020 CANADIAN ECONOMIC OUTLOOK & MARKET FUNDAMENTALS
INVESTMENT MARKET TRANSACTIONS | Q3 2020
OFFICE
Property Date Price SF PSF Purchaser City277 Wellington St W Sep-20 $78.5 M 100,076 $784 Reserve/Westdale Toronto
Sun Life Place Aug-20 $32.5 M 288,005 $113 Slate Edmonton3601 Victoria Park Ave Jul-20 $13.4 M 69,000 $194 Private Toronto
INDUSTRIAL
Property Date Price SF PSF Purchaser City5600-5630 Timberlea Blvd Sep-20 $19.5 M 119,356 $163 Granite REIT Toronto
23-49 Coldwater Rd Sep-20 $10.5 M 54,043 $194 Northbridge Capital Toronto555 Beck Cr Sep-20 $15.4 M 99,600 $154 Granite REIT Toronto6701 Financial Dr Sep-20 $23.9 M 115,693 $206 Dream Unlimited Toronto98 Norfinch Ave Sep-20 $10.0 M 57,340 $174 Zentil Property Mgt. Toronto60 & 70 Summerlea Rd Sep-20 $14.8 M 66,314 $224 White Owl Properties Toronto8995 Airport Rd Sep-20 $22.2 M 126,000 $176 Granite REIT TorontoVaughan Business Park Aug-20 $25.0 M 106,707 $234 Vimica Investments TorontoOlymbec GMA Portfolio Aug-20 $81.9 M 780,703 $106 Pure Ind. REIT Montreal10655 Henri-Bourassa Blvd W Jul-20 $12.3 M 110,000 $112 Mondev MontrealColonnade Rd Jul-20 $22.0 M 143,000 $154 Fiera Properties Ottawa
RETAIL
Property Date Price SF PSF Purchaser CityTrenant Park Square Aug-20 $64.5 M 138,716 $465 Keltic Canada Vancouver
88 & 94 Cumberland St Aug-20 $16.5 M 5,280 $3,125 Prowinko Canada Toronto
563 King St W Aug-20 $13.8 M 14,750 $932 Northloop Developmt. Toronto
818-858 West 15th St (50%) Jul-20 $16.5 M 22,000 $750 Polygon Group Vancouver
Faubourg Langelier GMA Jul-20 $62.0 M 350,569 $177 Groupe Mach Montreal
664 West Broadway Jul-20 $10.0 M 6,000 $1,667 CCI Holdings Vancouver
MULTI-SUITE RESIDENTIAL
Property Date Price # Units /Unit Purchaser City122 Bronte St S Sep-20 $58.5 M 163 $358,896 Park Property Mgt. Toronto200 Queen Mary Dr Sep-20 $33.0 M 95 $347,368 Homestead Toronto4500 Jane St Sep-20 $44.6 M 164 $271,768 Starlight Investments TorontoBrampton Portfolio Sep-20 $54.0 M 205 $263,415 Golden Equity Toronto405 Sicard St Aug-20 $19.0 M 73 $260,274 Skyline Group MontrealSignet Realty GTA Portfolio Aug-20 $113.3 M 386 $294,357 Starlight Investments TorontoArlington Court Apartments Aug-20 $16.3 M 54 $301,852 Madison Pacific VancouverSignet Realty GTA Portfolio Aug-20 $80.4 M 289 $278,299 Timbercreek TorontoWestlawn Village Jul-20 $22.5 M 144 $155,903 Oneka Land Company Edmonton* share sale

ACKNOWLEDGEMENTS & CITED RESEARCH RESOURCES
In the course of compiling the statistical information and commenting on real estate markets,
national, regionally and across Canadian metropolitan areas, we acknowledge the assistance
and feedback from the following parties in completing this report:
The Altus Group, Avison Young, Bank of Canada, Bank of Japan, BMO Economics, BMO Nesbitt Burns,
British Bankers’ Association, Brunsdon Martin & Associates, CBRE Econometric Advisors, CBRE Limited,
CIBC World Markets, Canada Newswire, Canadian Mortgage and Housing Corporation (CMHC), Canadian
Mortgage Loans Services Limited, The Canadian Real Estate Association (CREA), Colliers International,
Conference Board of Canada, Cushman & Wakefield, Developers and Chains e-news, Economy.com,
European Central Bank, The Federal Reserve Board, Frank Russell Canada (RCPI), The Globe and Mail,
ICR Commercial Real Estate, International Council of Shopping Centres (ICSC), Insite-Altus Research,
International Monetary Fund, The Johnson Report (Winnipeg), Jones Lang LaSalle, Monday Report on Retailers,
MSCI, The Network, Ottawa Business Journal, PC Bond Analytics, PricewaterhouseCoopers, RBC Capital Markets,
RBC Economics, RealNet Canada Inc., Rogers Media, Statistics Canada, Scotia Capital, TD Economics,
Toronto Star, Torto Wheaton Research, Urban Land Institute, United States Department of the Treasury,
York Communications
With a strategic focus on high-quality assets and diversification, we realize the potential of
real estate through consistent investment performance. Our primary business strategy is to
generate stable and increasing cash flow and asset value by improving the performance of
the real estate investment portfolio and by acquiring and developing real estate properties in
sound economic markets.
We have developed a broad and efficient real estate platform in North America to manage our
own real estate portfolio, as well as invest and manage real estate on behalf of institutional
clients. Today, our owned and managed Real Estate Portfolio is valued at more than $15 billion.
TO CONTACT US, VISIT MORGUARD.COM
MORGUARD’S CORE STRENGTH IS REAL ESTATE OWNERSHIP, MANAGEMENT AND INVESTMENT.

55 City Centre Drive
Suite 800
Mississauga, ON
L5B 1M3
905-281-3800
MORGUARD.COM


