17

Census at School Food Preference Survey
Subjects Taught: Mathematics, Language Arts, Nutrition, Social Studies, National Family and Consumer Sciences Grade Levels: 5-8 Brief Description: Students will participate in the Census at School program, complete the on-line questionnaire and compare the results with their class, school, U.S. students and beyond to learn about statistics, nutrition, and cultural differences; apply graphing, mathematics, and analysis skills to real-world examples; and justify their analysis of data. Objectives: At the end of this lesson the students will be able to: 1. Complete the Census at School on-line survey; 2. Use statistical concepts to analyze real data collected from their class, school, peers across the
United States and perhaps internationally to assess similarities and differences and draw conclusions;
3. Use appropriate graphs to depict data; 4. Develop a logical argument supporting their analysis of data; 5. Transfer the knowledge gained to analyze progress toward meeting nutritional recommendations
and identify cultural differences. Life Skills: Analyzing, applying, comparing similarities and differences, developing a logical argument, differentiating, formulating, identifying, summarizing, synthesizing, Materials Needed: Copies of the survey instrument Pens or pencils Computers with Internet Access Copies of MyPlate diagrams and food groups descriptions Time: Preparation to Take Survey (measurements, conversions, etc.): 30-40 minutes Reviewing Data with Students Prior to Taking On-line Survey: 20 minutes Taking Census Survey: 15-20 minutes Activity One: Two, 45 minute to 1 hour sessions Activity Two: 45 minutes – 1 hour Extensions: 45 minutes – 1 hour Preparation: 1. Prior to conducting this lesson, review whether the school has a policy on students providing
personal information on-line. If so, determine the appropriate communications needed with parents and/or legal guardian (to assure that information is confidential and summaries only will be used) and permission that must be obtained for student participation. Information about Internet security, the survey, questions that will and will not be asked on the survey, and how the information gathered will be used are found under the Security on the Web section available at http://www.amstat.org/censusatschool/ under the Teacher button. You will find other information there as well.

2. Read and follow the teacher directions at http://www.amstat.org/censusatschool/ under the Teacher Section, register your classes and obtain ID numbers for student use.
3. Print out copies of the survey, found at http://amstat.org/censusatschool/pdfs/[email protected], one per student, and have students complete their answers in writing in preparation to take the survey on-line. This will save time on the computer, streamline the student process, and give students time to prepare answers without pressure. a. Students will need to participate in several activities that can be done in advance of completing
the on-line survey – reaction time, memory test, reaction slider, etc. that will need to be completed on-line.
b. Students will also need to take several measurements in metric or make measurement comparisons (Which foot is longer your right or left?).
c. Pair up students to take and confirm measurements. It may avoid misinformation. There is a measurement guide available that will aid students at http://www.amstat.org/censusatschool/pdfs/[email protected]).
4. Review student surveys and conversions prior to taking on-line survey to avoid errors (for example, wrong units for height) and ensure that the data is correct.
5. Have students complete the Census at School survey at http://www.amstat.org/censusatschool/students.cfm. Students should select the “complete the on-line survey” link and enter the teacher provided class ID and password.
6. Follow the teacher instructions to observe and clean the data for each class to make sure values that do not make sense do not cause misunderstandings or confusion for students or skew results.
7. Download MyPlate diagrams and food group descriptions @ http://www.choosemyplate.gov/ and make copies for students – one per student.
Vocabulary: Analysis, analyze, statistics, statistical, variability, variables Common Core Standards Addressed: See the chart at the end of the lesson. Background Information: The world we live in is constantly gathering, analyzing and reporting data. The evening news reports on political polls, scientific research findings, government census data, effectiveness of flu vaccines, and probabilities of events occurring – being struck by lightning, winning the lottery, or annual highway deaths, etc. Commercial use of consumer data has never been more prevalent – television ratings, shopper loyalty cards, tracking of on-line purchases, airline frequent flyer programs, frequent hotel stay programs, self-identified likes on social media, etc. That information is used by advertisers to target consumers. Personal profiles are developed from that data and used to market specific products to us. Not only do we need to be aware of the information being collected but how that information is being used. We also need to understand the analysis and reporting of data as consumers and citizens. What does the report on that survey or scientific study mean? What is the probability of error? How will that analysis affect decision makers? Is this something I need to pay attention to and use to make decisions about my life and family? Should I cooperate and take the on-line survey as requested when I visit a Web site or answer the questions in a political poll? Why did I get that catalog in the mail or email with a promotional coupon?
This lesson introduces students to the collection of census data and helps them to identify why, how, and where such data can be used, who would like to know that information, how to analyze that data, and learn to understand the reporting and analysis of data. Introduction 1. Explain to the students that the class will be using the data from the Census at School survey that
they have all taken in a number of lessons. For the purpose of this lesson we will be using questions 22, 23 and 24 about food and beverage preferences.
2. For older students review, for younger students introduce what is or is not a statistical questions by
asking which of these questions is a statistical question: “What is your favorite food?” “What is the favorite food of the members of this class?” 3. The second question is a statistical question. Why? Because the first question will give one answer
and the second will give a variety of answers – there is variability in the student answers. 4. If needed to reinforce the concept, ask more comparison questions. Which question in the pair is
the statistical question: “What beverage does the class drink most often?” (Statistical question) “What beverage do you drink most often?” “Are you a vegetarian?” “Are the members of the class vegetarian?” (Statistical question) “Do members of the class eat fish?” (Statistical question)
“Do you eat fish?”
5. Discuss why each option is or is not a statistical question. (A statistical question anticipates variability in the answers.) What is a variable? (A variable is a changeable value. The responses vary from one individual being questioned to another.)
Activity One 1. State, “Using question 23, “What is your favorite type of food?” let’s determine what the favorite
foods are for students in this class.” So, the question we are asking is, “What is the most popular favorite food for students in this class participating in U.S. Census at School?”
2. Walk students through this question:
a. Identify what are the variables for the class. b. What are the numerical summaries for those variables? c. What type of graph would best depict this data? d. Graph the data. e. Interpret the results and come to a conclusion. (The most popular favorite foods among the U.S. Census at School students in the sample were pizza/pasta and meat, which includes hamburgers.)
Random Sample of 500 U.S. Census at School Participants
RowSummary
Column Summary
Gender
Male
Gender
Female
Coffee
Energy drink
Juice
Milk
Other
Pow dered drink
Soft drink (caffeinated)
Soft drink (non-caffeinated)
Sports drink
Tea
Water
Beverage
6 1
2 5
24 16
18 17
2 2
3 8
23 25
1 2
5 21
23 13
113 110
220 220
7
7
40
35
4
11
48
3
26
36
223
440S1 = count
Column Summary
3. Ask students, “To determine which foods are the least favorite of the class, what question should we ask and what process should we follow?” (What are the least popular favorite foods of students in this class that are participating in the U.S. Census at School? Follow the same process listed above in 2.a-e. The least popular were vegetables and salads.)
4. For these same two questions analyze the data for the other classes in the school, in the U.S. and for
older students - internationally. Compare the results of their class with the school, U.S. and International students.
5. Ask, “If we wanted to find out what beverages students in the class drink most often what question would we need to answer?” (What is the most common beverage consumed daily by students in this class?)
6. Have students collect the data and analyze it to answer that question. Include appropriate graphs,
variables and the numerical summaries for those variables. 7. To take the analysis one step further, ask the students what question do we need to ask to see if
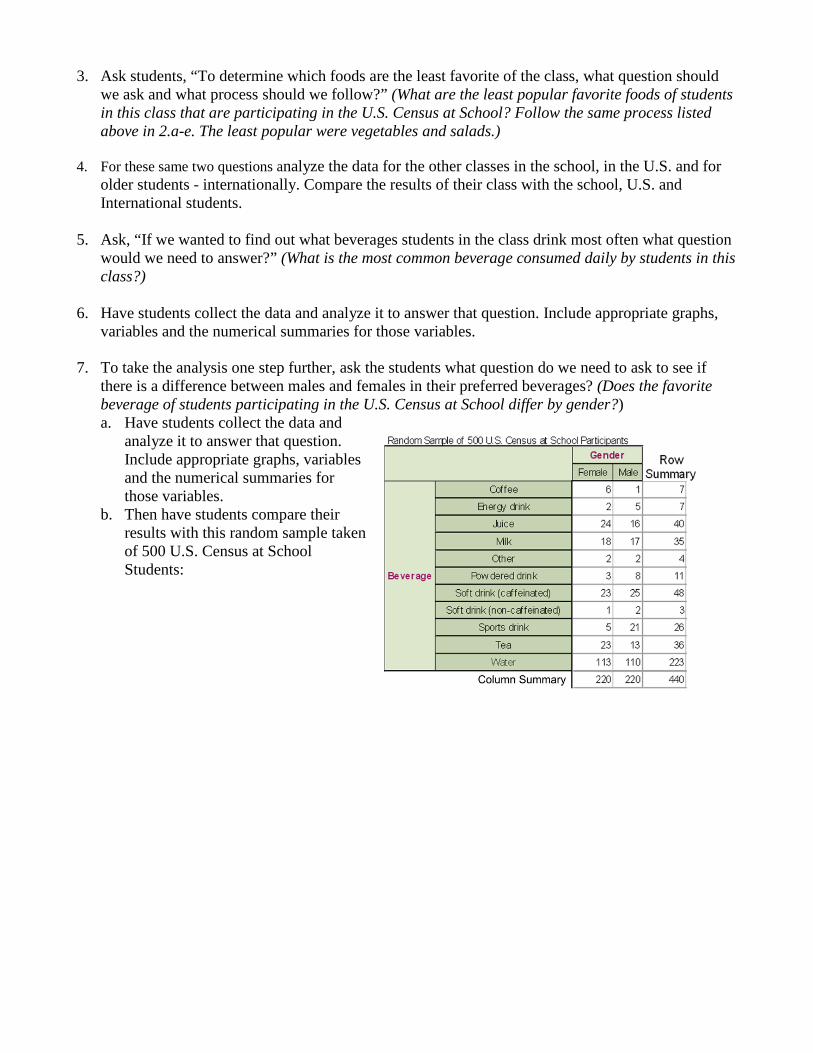
there is a difference between males and females in their preferred beverages? (Does the favorite beverage of students participating in the U.S. Census at School differ by gender?) a. Have students collect the data and
analyze it to answer that question. Include appropriate graphs, variables and the numerical summaries for those variables.
b. Then have students compare their results with this random sample taken of 500 U.S. Census at School Students:
( )

c. Although this is a random sample of 500 participants, you will note that there are only 400
responses and that they are equally distributed between 220 male and 220 female respondents. Why? (Only 440 people answered the question. The equal proportion of males to females is just a random happenstance. This is an actual random sample taken from the results of the survey and it had not been adjusted to create this result). Would you expect to receive equal distribution of males and females in all samples of students participating in Census at School? (No)
(The most popular favorite beverage is water among students in this sample. The least popular is non-caffeinated soft drinks.)
Although the proportion of males to females is equal in this sample, it is informative to
investigate percentages in addition to comparing the frequencies of male/female across the favorite beverage categories to investigate a potential association between gender and favorite beverage.
Interpret the results for each category of beverage by percentage and relate your interpretation
to the original question. If the gender percentages are the same across the favorite beverage categories, we do not have evidence of association.
GenderFemale Male
20
40
60
80
100
120
140
160
180
200
220
240
Beverage
Cof
fee
Ener
gy d
rink
Juic
e
Milk
Oth
er
Pow
dere
d dr
ink
Soft
drin
k (c
affe
inat
ed)
Soft
drin
k (n
on-c
affe
inat
ed)
Spor
ts d
rink
Tea
Wat
er
count
Random Sample of 500 U.S. Census at School Participants Bar Chart
Beverage

Column Summary
Random Sample of 500 U.S. Census at School Participants
RowSummary
Column Summary
Gender
Male
Gender
Female
Coffee
Energy drink
Juice
Milk
Other
Pow dered drink
Soft drink (caffeinated)
Soft drink (non-caffeinated)
Sports drink
Tea
Water
Beverage
85.7143 14.2857
28.5714 71.4286
60 40
51.4286 48.5714
50 50
27.2727 72.7273
47.9167 52.0833
33.3333 66.6667
19.2308 80.7692
63.8889 36.1111
50.6726 49.3274
50 50
100
100
100
100
100
100
100
100
100
100
100
100S1 = rowProportion •
Column Summary

Random Sample of 500 U.S. Census at School Participants
RowSummary
Column Summary
Vegetarian
Yes
Vegetarian
No
Breads/Sandw iches
Desserts
Fruit
Meat
No favorite
Other
Pizza/Pasta
Poultry
Rice/Noodle dishes
Salads
Seafood
Soups
Vegetables
Favorite_Food
11 3
25 2
43 2
92 1
37 0
11 1
97 5
39 0
29 1
4 1
33 2
5 1
0 2
426 21
14
27
45
93
37
12
102
39
30
5
35
6
2
447S1 = count
(Since they do differ in this case, we have evidence of potential relationship between gender and favorite beverage among participating U.S. Census at School students. It appears that some of the beverage types are preferred by a higher proportion of male students and some beverage types by a higher proportion of female students. Some of the beverage types have similar preferences among male and female students. Of those U.S. Census at School students who prefer sports drinks, the largest percentage (80.8%) are males in this sample. Of those preferring energy drinks, powdered drinks, and non-caffeinated soft drinks, the majority are also males. Of those who prefer coffee, the largest percentage are females (85.7%). Of those preferring tea and juice, the majority are also females (63.9% and 60%, respectively. Other beverages such as water, which is the most popular among all the beverages, has a fairly similar proportion of males and females who prefer drinking water.)
d. Since these data come from a random sample of students participating in U.S. Census at
School, what inferences might you draw to all students participating in U.S. Census at School about favorite beverages and the potential relationship between favorite beverage and gender? (This might be representative of all students, or it might not.) Do you expect the sample results to exactly equal the population data results of all U.S. Census at School students? (Probably not.)
Activity Two 1. Share that the class has examined questions 23 and 24, now let’s turn our attention to question 22.
Indicate that the next question to be examined will be: “Is there a potential association between favorite food and whether someone is vegetarian?
a. Have students collect the data
and analyze it to answer that question. Include appropriate graphs, variables and the numerical summaries for those variables. (The majority of students in the sample were not vegetarian.)
Comparing it to a random sample of 500 U.S. Census at School participants.
b. Although this is a random
sample of 500 participants in U.S. Census at School, why are there only 447 responses to this question in this sample?
Column Summary
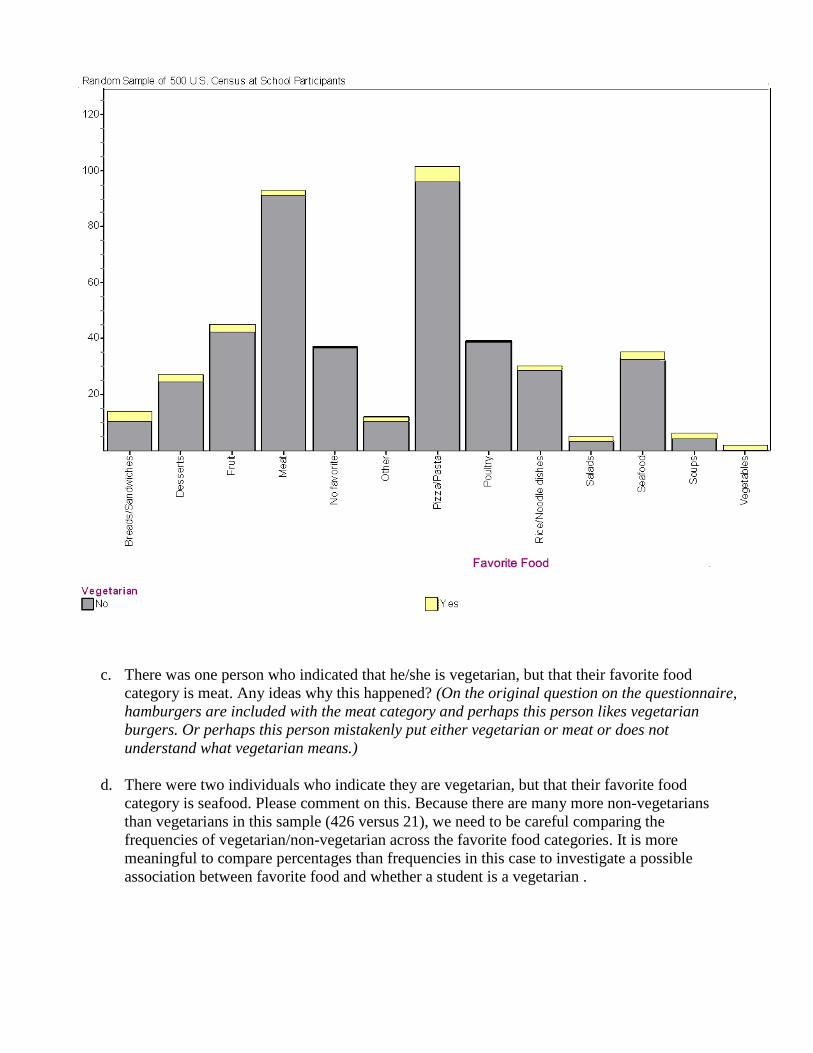
c. There was one person who indicated that he/she is vegetarian, but that their favorite food category is meat. Any ideas why this happened? (On the original question on the questionnaire, hamburgers are included with the meat category and perhaps this person likes vegetarian burgers. Or perhaps this person mistakenly put either vegetarian or meat or does not understand what vegetarian means.)
d. There were two individuals who indicate they are vegetarian, but that their favorite food
category is seafood. Please comment on this. Because there are many more non-vegetarians than vegetarians in this sample (426 versus 21), we need to be careful comparing the frequencies of vegetarian/non-vegetarian across the favorite food categories. It is more meaningful to compare percentages than frequencies in this case to investigate a possible association between favorite food and whether a student is a vegetarian .
VegetarianNo Yes
20
40
60
80
100
120
Favorite_Food
Brea
ds/S
andw
iche
s
Des
serts
Frui
t
Mea
t
No
favo
rite
Oth
er
Pizz
a/Pa
sta
Poul
try
Ric
e/N
oodl
e di
shes
Sala
ds
Seaf
ood
Soup
s
Vege
tabl
es
count
Random Sample of 500 U.S. Census at School Participants Bar Chart
Favorite Food

Random Sample of 500 U.S. Census at School Participants
RowSummary
Column Summary
Vegetarian
Yes
Vegetarian
No
Breads/Sandw iches
Desserts
Fruit
Meat
No favorite
Other
Pizza/Pasta
Poultry
Rice/Noodle dishes
Salads
Seafood
Soups
Vegetables
Favorite_Food
78.5714 21.4286
92.5926 7.40741
95.5556 4.44444
98.9247 1.07527
100 0
91.6667 8.33333
95.098 4.90196
100 0
96.6667 3.33333
80 20
94.2857 5.71429
83.3333 16.6667
0 100
95.302 4.69799
100
100
100
100
100
100
100
100
100
100
100
100
100
100S1 = rowProportion •
VegetarianNo Yes
0
20
40
60
80
100
120
Favorite Food
Brea
ds/S
andw
iche
s
Des
serts
Frui
t
Mea
t
No
favo
rite
Oth
er
Pizz
a/Pa
sta
Poul
try
Ric
e/N
oodl
e di
shes
Sala
ds
Seaf
ood
Soup
s
Vege
tabl
es
rowProportion •
Random Sample of 500 U.S. Census at School Participants Bar Chart
Column Summary

(Since the vegetarian percentages do differ in this case, we have evidence of potential relationship between favorite food and whether someone is vegetarian among Census at School students. - Of those students surveyed who prefer vegetables, the largest percentage (100%, though
only 2 respondents) are vegetarians in this sample. - Of those who prefer meat or poultry, the smallest percentages are vegetarian, which makes
sense since vegetarians do not eat meat. - The favorite food categories with the largest percentage of vegetarians indicating that was
their favorite food category include vegetables, sandwiches, salads, and soups.
2. Discuss the results by asking: “Since these data come from a random sample of students participating in U.S. Census at School, what inferences might you draw to all students participating in U.S. Census at School about favorite food categories and the potential relationship between favorite food and whether a student is vegetarian?” “Do you expect the sample results to exactly equal the population data results of all U.S. Census at School students?
3. As an additional activity, take additional random samples of size 500 from the U.S. random
sampler to get an idea about potential variability in the sample results and an idea about how much the results of a particular sample might different from the population of all Census at School students.
4. Discuss the results. Food favorites - ask:
“Did the food preferences surprise the class? Why or Why not?” (Answers will vary.)
“Who might like to have this information for your class and the whole school student body and why?” (School cafeteria manager - to plan breakfast and lunch menus, prevent food from being wasted, and invent alternatives for inventing new ways to improve the consumption of vegetables. School nurse, school wellness committee, and or nutritionists and dieticians - to analyze whether students are consuming balanced diets or not. Local stores selling snacks, and ready-to-eat foods – to know what to make available for purchase and advertise. Local restaurants- to know what foods to promote and which ones to avoid selling. Etc.) “How and where do the favorite food preferences fit in the MyPlate food categories and on MyPlate? (Answers will vary.) If the class’s and school’s preferences represented a meal what would the plate look like using a MyPlate diagram? Would it be balanced? Would it represent all food groups? (Answers will vary.) If you only ate your favorite foods would it be healthy? “Comparing your class/school’s preferences with U.S. results and international results are there cultural differences?” (Answers will vary.)

“Are the favorite foods of students across the U.S. or from other countries more balanced as to food categories or representing an even distribution on MyPlate?”
Beverage preferences ask: “Did the beverage preferences surprise the class? Why or Why not?” (Answers will vary.)
“Who might like to have this information for your class and the whole school student body and why?” (School cafeteria manager, school nurse, school wellness committee, and or nutritionists and dieticians - to analyze whether students are consuming enough milk to build strong bones and teeth. If not to determine alternatives to increasing calcium in the students’ diet. Local dairy farmers and processors - to assess milk consumption and plan marketing campaigns. Local restaurants stores and vending machine owners- to know what beverages to stock and which ones to avoid selling. Local dentists and doctors - to anticipate current and future health issues (osteoporosis, frequent bone fractures. Sports coaches – to anticipate student athlete capabilities or potential problems. Etc.) “How do the favorite beverages preferences fit in the MyPlate dairy categories and on the MyPlate diagram? (Answers will vary.) “Comparing your class/school’s preferences with U.S. results and international results are there cultural differences?” (Answers will vary.) “Are the favorite beverages of students across the U.S. or from other countries more balanced as to food categories or representing an even distribution on MyPlate?”
5. Discuss whether food groups and beverages underrepresented in the favorites data are consumed or not in the students’ diets in sufficient quantities to meet food group guidelines and quantities or not. If not, brainstorm ways that those foods and beverages can be increased to help students have healthy diets.
6. Select a single food and a single beverage from the preferences. Research what components make
up that food, who grows or produces those components in the United States and/or internationally. Identify the 5 states and/or countries and estimate how many miles that foodstuff travels so that you can consume it. Use the census of agriculture information at http://www.agcensus.usda.gov to and world production reports by commodity at http://www.fas.usda.gov/report.asp begin your search. You may also use information found at your state Department of Agriculture. Write a report explaining those details and design a solution to reduce the number of miles by the choices you make in choosing suppliers.
Evaluation Options: 1. Assess student’s successful completion of the activities, appropriate choices of graphs to represent
data, accurate analysis, interpretation and justification of data. 2. Pose this question to students: “Imagine that the whole school is planning an end-of –the year
celebration to honor students successfully completing the school year. You are serving on the planning committee and you need to address these issues:
-Use the information learned in this lesson to plan the foods and beverages purchased for the event and the numbers of each that will be needed for your class and the rest of the school. Favorite foods and beverages will be served to reward the students. -What plans will need to be made for the vegetarian students and how many foods and beverages will need to be made available for those students. -Two of the planning committee members want the event to include taking the students fishing and serving the fish they catch as a major food for the event. Is this a good idea? Why or why not? -Another member of the committee wants vegetables from the school garden to be served? Is this a good idea? Why or why not? - A local dairy processor will donate all of the milk for the event if there is a guarantee that it will be the only beverage served with the meal. Will you accept the offer? Why or why not? If not, can you propose a compromise that will be acceptable? -Other local food producers want to participate by making food donations. Which food providers should you accept donations from to meet food preferences?
3. Assess the research report, analysis of information, accuracy of information, and conclusions the students arrived at to reduce the number of miles that foodstuffs travel.
Extensions or Variations: 1. As an additional activity for the beverage preference question, you might take additional random
samples of size 500 from the U.S. random sampler to get an idea about potential variability in the sample results and an idea about how much the results of a particular sample might different from the population of all Census at School students.
2. Identify what local foods might be student food favorites that could be purchased by the school
cafeteria to improve student nutrition, help the local economy, and make students happy with their school lunch program.
3. Have students identify what questions need to be created on a new survey to provide more specific
information to those who may need more detailed insight. Resources and Credits: Census of Agriculture Information, National Agricultural Statistics Service, United States Department of Agriculture http://www.agcensus.usda.gov . Census at School, American Statistics Association, http://www.amstat.org/censusatschool/. My Plate, United States Department of Agriculture http://www.choosemyplate.gov/ World Production Reports, Foreign Agricultural Service, United States Department of Agriculture http://www.fas.usda.gov/report.asp

Common Core Standards Addressed
Common Core Standards – Mathematics 5.MD – 1
Convert among different-sized standard measurement units within a given measurement system (e.g., convert 5 cm to 0.05 m), and use these conversions in solving multi-step, real world problems.
6SP – 1 Develop understanding of statistical variability. Recognize a statistical question as one that anticipates variability in the data related to the question and accounts for it in the answers. For example, “How old am I?” is not a statistical question, but “How old are the students in my school?” is a statistical question because one anticipates variability in students’ ages.
6SP – 2 Understand that a set of data collected to answer a statistical question has a distribution which can be described by its center, spread, and overall shape.
6SP – 3 Recognize that a measure of center for a numerical data set summarizes all of its values with a single number, while a measure of variation describes how its values vary with a single number.
6SP – 4 Display numerical data in plots on a number line, including dot plots, histograms, and box plots. 6SP – 5 Summarize numerical data sets in relation to their context, such as by:
a. Reporting the number of observations. b. Describing the nature of the attribute under investigation, including how it was measured and its units of measurement.
7RP – 3 Use proportional relationships to solve multistep ratio and percent problems. Examples: simple interest, tax, markups and markdowns, gratuities and commissions, fees, percent increase and decrease, percent error.
7SP – 1 Understand that statistics can be used to gain information about a population by examining a sample of the population; generalizations about a population from a sample are valid only if the sample is representative of that population. Understand that random sampling tends to produce representative samples and support valid inferences.
8SP – 4 Understand that patterns of association can also be seen in bivariate categorical data by displaying frequencies and relative frequencies in a two-way table. Construct and interpret a two-way table summarizing data on two categorical variables collected from the same subjects. Use relative frequencies calculated for rows or columns to describe possible association between the two variables. For example, collect data from students in your class on whether or not they have a curfew on school nights and whether or not they have assigned chores at home. Is there evidence that those who have a curfew also tend to have chores?
Common Core Standards English Language Arts – Reading: Informational Text RI.5.7 Draw on information from multiple print or digital sources, demonstrating the ability to locate
an answer to a question quickly or to solve a problem efficiently. RI.6.7 Integrate information presented in different media or formats (e.g., visually, quantitatively) as
well as in words to develop a coherent understanding of a topic or issue. Common Core Standards English Language Arts – Writing W.5.7 W.6.7 W.7.7 W.8.7
Conduct short research projects to answer a question (including a self-generated question), drawing on several sources and generating additional related, focused questions that allow for multiple avenues of exploration.
W.5.9 W.6.9 W.7.9 W.8.9
Draw evidence from literary or informational texts to support analysis, reflection, and research.
Common Core Standards English Language Arts Speaking and Listening SL.5.1 SL.6.1 SL.7.1 SL.8.1
Engage effectively in a range of collaborative discussions (one-on-one, in groups, and teacher-led) with diverse partners on grade 8 topics, texts, and issues, building on others’ ideas and expressing their own clearly. Come to discussions prepared, having read or researched material under study; explicitly draw
on that preparation by referring to evidence on the topic, text, or issue to probe and reflect on ideas under discussion. Follow rules for collegial discussions and decision-making, track progress toward specific goals and deadlines, and define individual roles as needed. Pose questions that connect the ideas of several speakers and respond to others’ questions and comments with relevant evidence, observations, and ideas. Acknowledge new information expressed by others, and, when warranted, qualify or justify their own views in light of the evidence presented.
Common Core Standards English Language Arts – Language: Conventions of Standard English L.5.6 L.6.6 L.7.6 L.8.6
Acquire and use accurately grade-appropriate general academic and domain-specific words and phrases; gather vocabulary knowledge when considering a word or phrase important to comprehension or expression.
Literacy 6-12 in History/Social Studies, Science and Technical Subjects English Language Arts – Science and Technical Subjects RST.6-8.7 Integrate quantitative or technical information expressed in words in a text with a version of that
information expressed visually (e.g., in a flowchart, diagram, model, graph, or table). Literacy 6-12 in History/Social Studies, Science and Technical Subjects English Language Arts – Science and Technical Subjects RST.6-8.3 Follow precisely a multistep procedure when carrying out experiments, taking measurements, or
performing technical tasks. RST.6-8.7 Integrate quantitative or technical information expressed in words in a text with a version of that
information expressed visually (e.g., in a flowchart, diagram, model, graph, or table). Common Core Standards English Language Arts – Writing: Text Types and Purposes WHST.6-8.2 Write informative/explanatory texts, including the narration of historical events, scientific
procedures/ experiments, or technical processes. Introduce a topic clearly, previewing what is to follow; organize ideas, concepts, and information into broader categories as appropriate to achieving purpose; include formatting (e.g., headings), graphics (e.g., charts, tables), and multimedia when useful to aiding comprehension. Develop the topic with relevant, well-chosen facts, definitions, concrete details, quotations, or other information and examples. Use appropriate and varied transitions to create cohesion and clarify the relationships among ideas and concepts. Use precise language and domain-specific vocabulary to inform about or explain the topic. Establish and maintain a formal style and objective tone. Provide a concluding statement or section that follows from and supports the information or explanation presented.
WHST.6-8.7 Conduct short research projects to answer a question (including a self-generated question), drawing on several sources and generating additional related, focused questions that allow for multiple avenues of exploration.
National Family and Consumer Sciences Standards 2.4.1 Summarize types of technology that affect family and consumer decision-making 2.5 Analyze relationships between the economic system and consumer actions. 9.3.7 Categorize foods into exchange groups and plan menus, applying the exchange system to meet
various nutrient needs. 9.5.1 Analyze various factors that affect food preferences in the marketing of food. 9.5.2 Analyze data in statistical analysis in making development and marketing decisions. 14.3.1 Apply various dietary guidelines in planning to meet nutrition and wellness needs.


