24
Correlation and Causation By Melissa Storm
| Date post: | 16-Dec-2015 |
| Category: |
Documents |
| Upload: | brian-burns |
| View: | 221 times |
| Download: | 3 times |

Correlation and Causation
By Melissa Storm

Storm
2Correlation
• A statistical measurement of a linear relationship between two variables
• Correlation is considered positive when the values increase together
• Correlation is negative when as one value increases the other decreases

Storm
3Causation
• Causation is the process in which the change in one variable causes a change in another variable
• Can also be considered as a cause and effect relationship
• Example: When the variable “hours worked” increases, the variable “income earned” also increases. This is a direct relationship where as the “hours worked” changes, the “income earned” will always change with it.

Storm
4Correlation vs Causation
• Correlation does not imply causation
• Two events may occur together but that does not mean that one event causes the other
• Example: Research shows a strong positive correlation between ice cream sales and crime. Does this mean that buying ice cream causes crime? Or is there some hidden factor, like warm weather, that perhaps could be causing both?
• Google Correlate

Storm
5Correlation vs Causation

Storm
6Correlation vs Causation

Storm
7Coincidence
• Coincidence occurs when two variables are correlated but one does not cause the other
• This situation happens when no confounding variable can be found that explains the correlation and the two variables just happened to be correlated randomly
• Example: Global average temperature and number of pirates are positively correlated. This, however, does not imply that the number of pirates cause temperature rises or that temperature rises cause an increase in the number of pirates. This is merely a coincidence.

Storm
8Confounding Variable
• A confounding variable is a variable that may not have been considered in the model when two variables are found to be correlated.
• A confounding variable will be correlated with both of the other variables
• Going back to the ice cream/crime example, warm weather would be considered the confounding variable. As the weather gets warmer, both crime and ice cream sales increase.

Storm
9Chain Reaction
• A chain reaction occurs when X causes Y indirectly. Usually this implies that there is another variable, or several variables, involved in a chain reaction between X and Y
• Example: Amount of precipitation might be highly correlated with the price of produce. This is due to the chain reaction where the amount of precipitation affects the quality and amount of produce that is produced therefore affecting the price of the produce.

Storm
10Reverse Causation
• Reverse causation occurs when a change in the response variable causes a change in the independent variable
• Example: If the response variable is the crime rate and one of the independent variables is the number of police officers, it would be incorrect to assume that as the number of police officers increases so does the crime rate. In this situation, the number of police officers increases because the crime rate increases.

Storm
11Bidirectional Causation
• Bidirectional Causation occurs when variable A effects B, and B also effects A
• Example: A job interview (A) in the afternoon will effect the anxiety level in the morning (B), and also the level of anxiety in the morning (B) will effect the job interview in the afternoon (A).

Storm
12Control Group
• A control group is used to reduce the impact of unknown external variables making it easier to identify causation
• Example: In clinical trials, there is always a treatment group and a control group. If both groups get better, we can assume that some external factor is causing the improvement, and not the treatment under consideration. If only the treatment group gets better, it is safe to assume that the treatment is what is causing the patients to get better.

Storm
13Double Blinding
• Double blinding is used to repress the placebo effect in clinical trials
• The placebo effect is where patients believe they are getting better, so they actually do
• In double blinding, neither the patient nor the doctor administering the treatment know whether they are receiving the treatment or the control.
• Double blinding helps researchers to pinpoint the cause of symptom relief

Storm
14Example: Correlation in Law
• A man that is bald uses a treatment that promises to make him grow hair. When the man does not grow any hair, he decides to conduct a study by collecting information about the amount of hair men have and whether or not they have used the treatment. His results show a correlation between baldness and use of the treatment. He decides to take this to court and sue the company for selling a product that does not work.
• The people who sell the treatment use correlation vs. causation as their argument. People who use the treatment have less hair to begin with which is why they are using the treatment in the first place.

Storm
15Example: Correlation in Sports
• In basketball, it has been found that there is a high correlation between winning percentage and free throw attempts.
• This does not, however, imply that free throw attempts lead to winning the game.
• This is an example of reverse causation, when a team is losing the game they are more likely to foul the other team in order to attempt to get the ball back at the end of a game.

Storm
16Example: Correlation in Health
• People who are overweight are more likely to be ingesting diet foods which use sugar replacements in order to make them fat free. A study would show that there is a strong positive correlation between the amount of diet food a person eats and how overweight they are.
• This does not however imply that the sugar replacements in the diet foods are making people overweight. People who are overweight are just more likely to be eating diet foods.

Storm
17Example: Correlation in Politics
• There is a strong positive correlation between the GDP and government spending.
• Democrats insist that increased government spending leads to a higher GDP because increased government spending leads to an increase in the demand for goods and services.
• Republicans disagree and state that a higher GDP is what leads to more government spending because when GDP increases, the government takes in more tax revenue.

Storm
18Correlation vs. Causation in the News

Storm
19Pearson r Correlation
• Measure of the linear correlation between X and Y giving some value between 1 and -1
• Assumptions:• Normally distributed• Linearity• Homoscedasticity

Storm
20Kendall Rank Correlation
• A non-parametric test that measures the strength of dependence between two variables
• Concordant: when a pair of observations (,) and (,) have the same rank (i.e.
• Discordant: when a pair of observations have different ranks (i.e.

Storm
21Spearman Rank Correlation
• Non-parametric test that measures the degree of association between two variables
• No assumptions about the distribution
• Ordinal data
Storm
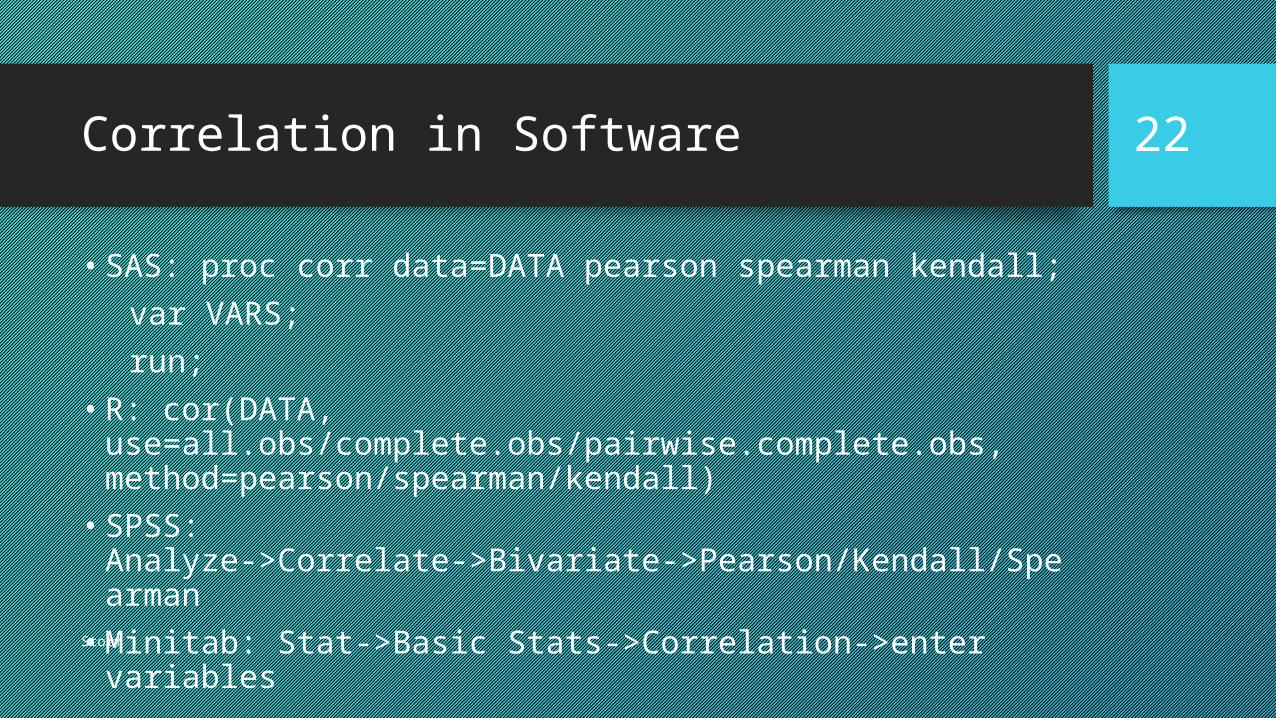
22Correlation in Software
• SAS: proc corr data=DATA pearson spearman kendall;
var VARS;
run;
• R: cor(DATA, use=all.obs/complete.obs/pairwise.complete.obs, method=pearson/spearman/kendall)
• SPSS: Analyze->Correlate->Bivariate->Pearson/Kendall/Spearman
• Minitab: Stat->Basic Stats->Correlation->enter variables

Storm
23Sources
• https://www.mathsisfun.com/data/correlation.html
• http://www.statisticssolutions.com/correlation-pearson-kendall-spearman/
• http://www.google.com/trends/correlate/
• http://science.howstuffworks.com/innovation/science-questions/10-correlations-that-are-not-causations.htm

Storm
24The End!


