153
District Watershed Development Unit- Porbandar 1

District Watershed Development Unit- Porbandar
1
District Watershed Development Unit- Porbandar
2
:Contents :
Table no.1: Basic project information ....................................................................................................................................... 6 Table no.2: Weightage of the project ........................................................................................................................................ 8 Table no.3: Watershed information ........................................................................................................................................ 12 Table no.4: Developmental programmes running in the project area: ................................................................................... 12 Table no. 5: Previous Watershed programmes in the project area: ....................................................................................... 10 Table no. 6: PIA: ..................................................................................................................................................................... 14 Table no. 7: Staff at PIA level: ................................................................................................................................................ 19 Table no. 8: Land use pattern: ................................................................................................................................................ 20 Table no. 9: Soil type and topography: ................................................................................................................................... 22 Table no. 10: Flood and drought condition: ............................................................................................................................ 23 Table no. 11.1: Soil Erosion .................................................................................................................................................... 23 Table no. 11.2: Soil Salinity/Alkalinity (Salinity ingress) ......................................................................................................... 24 Table no. 11.3: Waterlogging Conditions ............................................................................................................................... 24 Table no. 12: Climatic conditions: ........................................................................................................................................... 25 Table no. 13: Physiography and relief .................................................................................................................................... 25 Table no. 14: Land ownership details ..................................................................................................................................... 25 Table no. 15: Agriculture ......................................................................................................................................................... 27 Table no. 16: Irrigation ............................................................................................................................................................ 29 Table no. 17: Crop details: ...................................................................................................................................................... 30 Table no. 18: Livestock ........................................................................................................................................................... 32

District Watershed Development Unit- Porbandar
3
Table no. 19: Drinking water ................................................................................................................................................... 33 Table no. 20: Details of Common Property Resources .......................................................................................................... 34 Table no. 21: Demographic information ................................................................................................................................. 38 Table no. 22: Literacy rate ...................................................................................................................................................... 39 Table no. 23: Migration details................................................................................................................................................ 39 Table no. 24: Poverty .............................................................................................................................................................. 41 Table no. 25: Village infrastructure ......................................................................................................................................... 41 Table no. 26 : Facilities / HH assets ....................................................................................................................................... 43 Table no. 27: Income .............................................................................................................................................................. 44 Table no.28: Dependence on Forest/CPR ............................................................................................................................. 44 Table no. 29: Livelihood pattern (Occupational distribution) .................................................................................................. 45 Table no. 30: Details of Scientific Planning and Inputs in IWMP projects* ............................................................................ 46 Table no. 31: Watershed Committee details ............................................................................ Error! Bookmark not defined. Table no. 32: SHG detail ........................................................................................................................................................ 69 Table no. 33: UG detail ........................................................................................................................................................... 69 Table no.34: Entry point activities (EPA) (All financial figures in lakh Rs.) ............................................................................ 73 Table no.35: Details of activities of preparatory phase (All financial figures in lakh Rs.) ...................................................... 84 Table no.36: Activities related to Surface water resources in the project areas (all financial figures in lakh Rs.) ..................... Table no.37: Activities related to recharging ground water resources in the project areas (all financial figures in lakh Rs.) 93 Table no. 38: Activities related to livelihoods by Self Help Groups (SHGs) in the project areas ........................................... 97 Table no. 39: Other activities of watershed works phase – Proposed target ....................................................................... 100 Table no.40: Details of engineering structures in watershed works* ................................................................................... 100
District Watershed Development Unit- Porbandar
4
Table no.41: Details of activities connected with vegetative cover in watershed works ............................................................ Table no.42: Details of allied / other activities ...................................................................................................................... 106 Table no.43: Details of activities in the CPRs in the project areas ........................................... Error! Bookmark not defined. Table no. 44: Capacity Building Institution: .......................................................................................................................... 112 Table no. 45: Capacity Building plan: ................................................................................................................................... 113 Table no.46: Information, education and Communication Activities: ................................................................................... 113 Table no. 47: Village wise- activity wise budget ................................................................................................................... 116 Table no. 48: Budget at a glance .......................................................................................................................................... 117 Table no.49: Details of Convergence of IWMP with other Schemes ................................................................................... 118 Table no. 50: Public-Private Partnership in the IWMP projects* .......................................................................................... 119 Table no. 51: Employment in Project area: .......................................................................................................................... 119 Table no. 52: Details of seasonal migration from Project area ............................................................................................ 122 Table no. 53: Details of average ground water table depth in the project areas (in meters) ............................................... 122 Table no. 54: Status of Drinking water* ................................................................................................................................ 124 Table no. 55: Details of Kharif crop area and yield in the project areas ............................................................................... 125 Table no. 56: Area under horticulture ................................................................................................................................... 126 Table no. 57: Forest/vegetative cover ................................................................................................................................. 126 Table no. 58: Details of livestock in the project areas * (for fluids please mention in litres, for solids please mention in kgs. and income in Rs.) ................................................................................................................................................................ 127 Table no. 59: Backward-Forward linkages ........................................................................................................................... 128
District Watershed Development Unit- Porbandar
5

District Watershed Development Unit- Porbandar
6
1.1 Project Background (IWMP-1) Kadegi project is located in Kutiyana Taluka, Porbandar District of Gujarat state. The project is a cluster
of 6 micro-watersheds with 5G1B1b1a, 5G1A6a2e, 5G1C1b1b, 5G1A5b1a, 5G1A6a2e, 5G1A6a2e being their respective codes. The total project area of the watershed is about 5853.11 Ha, of which has been undertaken to be treated under Integrated Watershed Management Programme (IWMP) starting year 2009-10.
The watershed includes three Villages Mer, Patel ,SC & Bharmin are the primary inhabitants of the village. The livelihood of these people is primarily based on rainfed agriculture, animal husbandry, wage labour, goat and sheep rearing.
The Project area falls under the IWDP according to DoLR Classification. It is a very poor and desolate village on the border of Porbandar. The Kadegi Project was heavily Every year Flood. This has resulted in Productivity of Agriculture Land was too low camper another villages of Kutiyana Block.
Table no.1: Basic project information
Sl No.
Name of the project
Villages Gram
Panchayats Taluka District Area of the project
Area proposed
to be treated
Total project
cost PIA Name Census
code
1
IWMP-1
Junej (00798000) Junej
KUTIYANA
PORBANDAR 496.6 496.6 5959200 DWDU PORBANDAR
2 Bhadula (00797900) Bhadula
PORBANDAR 936.6 936.60 11239200 DWDU PORBANDAR
3 Bhogsar (00797000) Bhogsar
PORBANDAR 453.4 453.40 5440800 DWDU PORBANDAR
4 JAMRA (00797500) JAMRA
PORBANDAR 1460.4 1460.40 17524800 DWDU PORBANDAR
5 KADEGI (00798200) KADEGI
PORBANDAR 1651.8 849.8 19821600 DWDU PORBANDAR
6 Kotda (00796400) Kotda
PORBANDAR 1365.6 854.27 16387200 DWDU PORBANDAR

District Watershed Development Unit- Porbandar
7
Figure 1, Geographical Location of Kadegi
Porbandar District Kadegi Project
District Watershed Development Unit- Porbandar
8
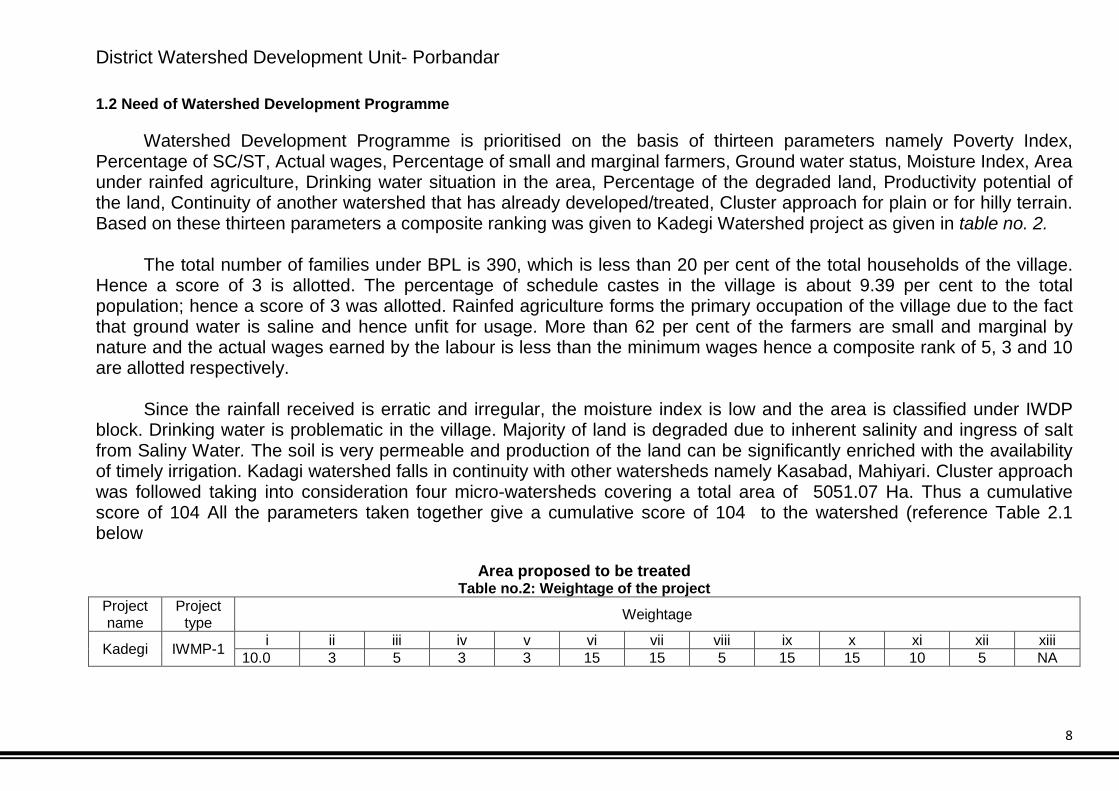
1.2 Need of Watershed Development Programme
Watershed Development Programme is prioritised on the basis of thirteen parameters namely Poverty Index, Percentage of SC/ST, Actual wages, Percentage of small and marginal farmers, Ground water status, Moisture Index, Area under rainfed agriculture, Drinking water situation in the area, Percentage of the degraded land, Productivity potential of the land, Continuity of another watershed that has already developed/treated, Cluster approach for plain or for hilly terrain. Based on these thirteen parameters a composite ranking was given to Kadegi Watershed project as given in table no. 2.
The total number of families under BPL is 390, which is less than 20 per cent of the total households of the village.
Hence a score of 3 is allotted. The percentage of schedule castes in the village is about 9.39 per cent to the total population; hence a score of 3 was allotted. Rainfed agriculture forms the primary occupation of the village due to the fact that ground water is saline and hence unfit for usage. More than 62 per cent of the farmers are small and marginal by nature and the actual wages earned by the labour is less than the minimum wages hence a composite rank of 5, 3 and 10 are allotted respectively.
Since the rainfall received is erratic and irregular, the moisture index is low and the area is classified under IWDP
block. Drinking water is problematic in the village. Majority of land is degraded due to inherent salinity and ingress of salt from Saliny Water. The soil is very permeable and production of the land can be significantly enriched with the availability of timely irrigation. Kadagi watershed falls in continuity with other watersheds namely Kasabad, Mahiyari. Cluster approach was followed taking into consideration four micro-watersheds covering a total area of 5051.07 Ha. Thus a cumulative score of 104 All the parameters taken together give a cumulative score of 104 to the watershed (reference Table 2.1 below
Area proposed to be treated Table no.2: Weightage of the project
Project name
Project type Weightage
Kadegi IWMP-1 i ii iii iv v vi vii viii ix x xi xii xiii 10.0 3 5 3 3 15 15 5 15 15 10 5 NA

District Watershed Development Unit- Porbandar
9
Table no. 2.1 Criteria and weightage for selection of watershed Sr.
No.
Criteria Maximum
Score
Ranges & Scores
i Poverty index (% of poor
to population
10 Above 80% (10) 80 to 50 % (7.5) 50 to 20 % (5) Below 20 %
(2.5)
ii % of SC/ST population 10 More than 40% (10) 20 to 40%(5) Less than 20% (3)
iii Actual wages 5 Actual wages are
significantly lower than
minimum wages (5)
Actual wages
are equal to or
higher than
minimum wages
(0)
iv % of small and marginal
farmers
10 More than 80% (10) 50 to 80% (5) Less than 50 %
(3)
v Ground water status 5 Over exploited (5) Critical (3) Sub critical (2) Safe (0)
vi Moisture index / DPAP /
DDP Block
15 -66.7 & below (15)
DDP Block
-33.3 to -66.6
(10) DPAP Block
0 to -33.2 (0) Non
DPAP / DDP
District Watershed Development Unit- Porbandar
10
Block
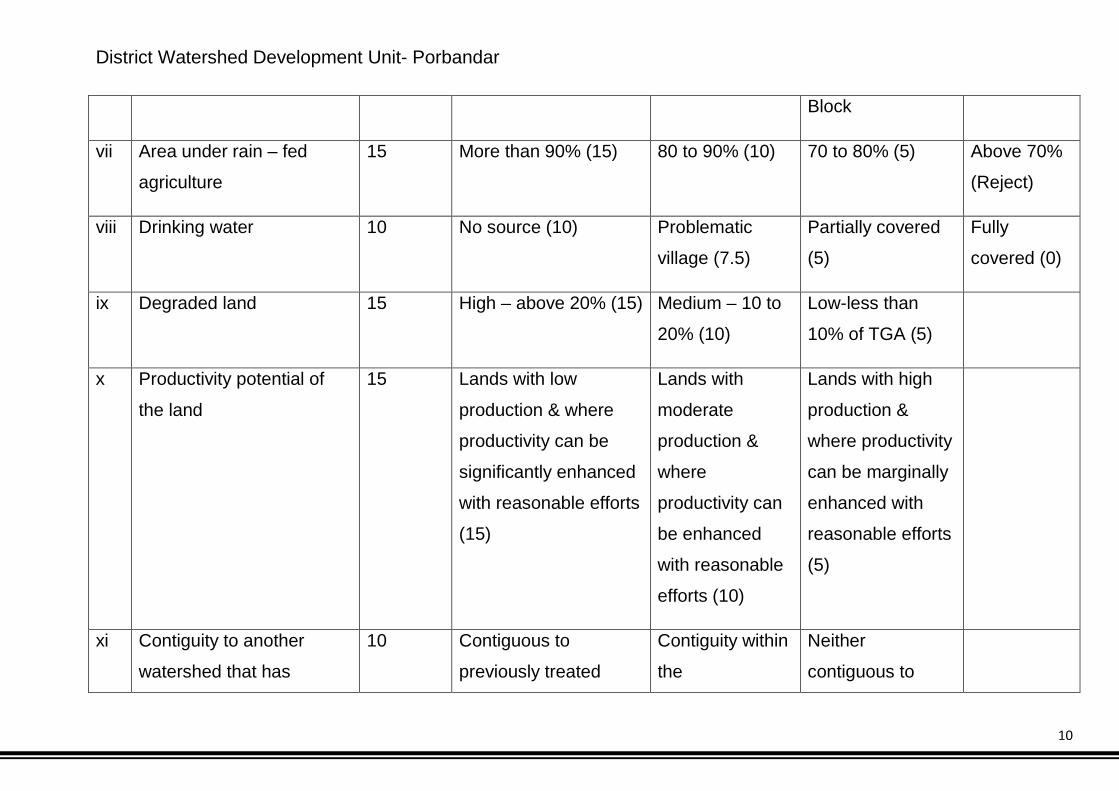
vii Area under rain – fed
agriculture
15 More than 90% (15) 80 to 90% (10) 70 to 80% (5) Above 70%
(Reject)
viii Drinking water 10 No source (10) Problematic
village (7.5)
Partially covered
(5)
Fully
covered (0)
ix Degraded land 15 High – above 20% (15) Medium – 10 to
20% (10)
Low-less than
10% of TGA (5)
x Productivity potential of
the land
15 Lands with low
production & where
productivity can be
significantly enhanced
with reasonable efforts
(15)
Lands with
moderate
production &
where
productivity can
be enhanced
with reasonable
efforts (10)
Lands with high
production &
where productivity
can be marginally
enhanced with
reasonable efforts
(5)
xi Contiguity to another
watershed that has
10 Contiguous to
previously treated
Contiguity within
the
Neither
contiguous to

District Watershed Development Unit- Porbandar
11
already been
developed/treated
watershed & contiguity
within the
microwatersheds in
the project (10)
microwatersheds
in the project but
non contiguous
to previously
treated
watershed (5)
previously treated
watershed nor
contiguity within
the
microwatersheds
in the project (0)
xii Cluster approach in the
plains (more than one
contiguous micro-
watersheds in the project )
15 Above 6 micro-
watersheds in cluster
(15)
4 to 6
microwatersheds
in cluster (10)
2 to 4
microwatersheds
in cluster (5)
xiii Cluster approach in the
hills (more than one
contiguous micro-
watersheds in the project )
15 Above 5 micro-
watersheds in cluster
(15)
3 to 5
microwatersheds
in cluster (10)
2 to 3
microwatersheds
in cluster (5)
Total 150 150 90 41 2.5

District Watershed Development Unit- Porbandar
12
Project type: Hilly/desert/Other Table no.3: Watershed information
Name of the Village Name of Project Name of the Village No. Of watersheds to be treated Watershed code Watershed
regime/type/order Junej
Kede
gi
Proj
ect
IWM
P-I
Junej 1 5G1B1b1a Mini Watershed Bhadula Bhadula 1 5G1A6a2e Mini Watershed Bhogsar Bhogsar 1 5G1C1b1b Mini Watershed Jamra Jamra 1 5G1A5b1a Mini Watershed Kadegi Kadegi 1 5G1A6a2e Mini Watershed Kotada Kotada 1 5G1A6a2e Mini Watershed
1.3 Other developmental projects/schemes running in the Kadegi Project
This village being very back ward, has been on top priority of a number of developmental projects. These programmes are Mahatma Gandhi National Rural Employment Guarantee Scheme (MGNREGS), Total Sanitation Campaign (TSC), Indira Awas Yojana (IAY) and Sakhi Mandal Besides, previously. i. MGNREGS: Construction of, murram road 58, Deepning of pond 7, Land Development 15 and 3 construction of lack has been taken-up under MGNREGA. ii. Total Sanitation Campaign (TSC): 1067 individual toilets are constructed under TSC programme. iii. Indira Awas Yojana: (Total 492 house have been constructed in the Kadegi Project under various Awas Yojana in which under Indira Awas Yojana= 177, Earth Quake covered 315 beneficiaries . iv. Sakhi Mandal Yojna– 47 Mandals are linked with bank and given loan of Rs.47000

District Watershed Development Unit- Porbandar
13
Table no.4: Developmental programmes running in the project area:
Sl no
Name of the programme/scheme
Sponsoring agency
Objectives of the programme/scheme Year of commencement Villages
covered
Estimated number of
beneficiaries 1 WASMO DWSSB WASMO 2007-08-09 6 1451
2 MGNREGS Rural Department Employment 2009 6 3285
3 IAY Rural
Department Housing 2005-08-09 6 177
4 TSC Rural Department Sanitation 2004-05 still 6 1067

District Watershed Development Unit- Porbandar
14
Figure 2, Geographical Condition of the project
District Watershed Development Unit- Porbandar
15
District Watershed Development Unit- Porbandar
16
2.1. Project Implementing Agency The Project Implementing Agencies (PIA) is selected by an appropriate mechanism by Gujarat State Watershed
Management Agency (GSWMA), the State Level Nodal Agency (SLNA) for Integrated Watershed Management
Programme (IWMP) in Gujarat. The PIAs are responsible for implementation of watershed project. These PIAs may include
relevant line departments, autonomous organizations under State/ Central Governments, Government Institutes/ Research
bodies, Intermediate Panchayats, Voluntary Organizations (VOs).The PIA for Mahiyari watershed Project is Chief
Conservator of Forest (Social Forest), Porbandar.
2.2 About Social Forest Department, Porbandar 2.2.1 The organization and its objectives: The District Watershed Development Unit (DWDU), Porbandar is a district level nodal agency and was established on 1
August ,2009 to oversee the smooth implementation of watershed projects in the district. The District Development Officer
(DDO) is the chairman of the DWDU. The DWDU has dedicated and experienced staff comprising one Project Manager
(deputation from Gujarat Forest Department), a technical expert and a multidisciplinary team of agriculture expert,
community mobilization expert and Data Entry Operator, civil engineer, MIS coordinator, system analyst, surveyor, and
accountant. The objectives of the DWDU, Porbandar are supervising, planning, implementing, documenting and promoting
watershed development projects and related developmental activities in the district as per guidelines. The DWDU,
Porbanar also works as a PIA for two IWMP projects.
District Watershed Development Unit- Porbandar
17
2.2.2 Programmes/projects of DWDU, Porbandar:
At present 3 IWMP projects have been sanctioned by Government of India for Porbandar district . The entry point activities of all the Three IWMP projects have been identified by the respective PIAs in the district. Porbandar Forest Division is PIA for 1 projects (IWMP- 2) and DWDU itself is PIA for rest of the two projects (IWMP-1 & 3). Apart from the 3 IWMP projects, DWDU Porbandar is involved in a total of 94 pre-Hariyali & Hariyali projects (DDP &
IWDP); 51 projects are completed and 43 projects are still running in the district. The DWDU, Porbandar is also
monitoring a central government sponsored scheme on “Artificial Recharge of Groundwater through Dugwells” in the
district.
2.3 SWOT Analysis of the DWDU: Strength: (1) Dedicated and experienced staff and a multidisciplinary team
(2) Independent District Level Nodal Agency.
(3) Strong linkages with national and state level institutions, agricultural universities, North Gujarat University and NGOs for
capacity building and technical guidance
(4) Scientific planning in watershed projects with the help of BISAG, Gandhinagar,
(5) District level monitoring, coordination & Co-operation Committee

District Watershed Development Unit- Porbandar
18
Weakness: (1) No permanent office building.
(2) No Vehicle
(3) Not any Technical Expert person in any Project of Watershed in Porbandar.
Opportunities: (1) A number of different other development schemes of the government are running; so, there can be horizontal
integration and convergence of programmes
(2) Better financial provision under IWMP
(3) Usage of new ICT tools like GIS, GPS
Threats: (1) Rainfall being very scarce and unreliable in the project area, the activities planned to be taken up may yield limited
impact
(2) Irregularities in fund flow can derail the smooth functioning
(3) Lack of contribution and cooperation from local people
(4) Low literacy rate in the project area.
(5) Because of flood prone area flood water remain for longer revised, farmer can’t take any monsoon Crop.
(6) Soil is saline.
District Watershed Development Unit- Porbandar
19
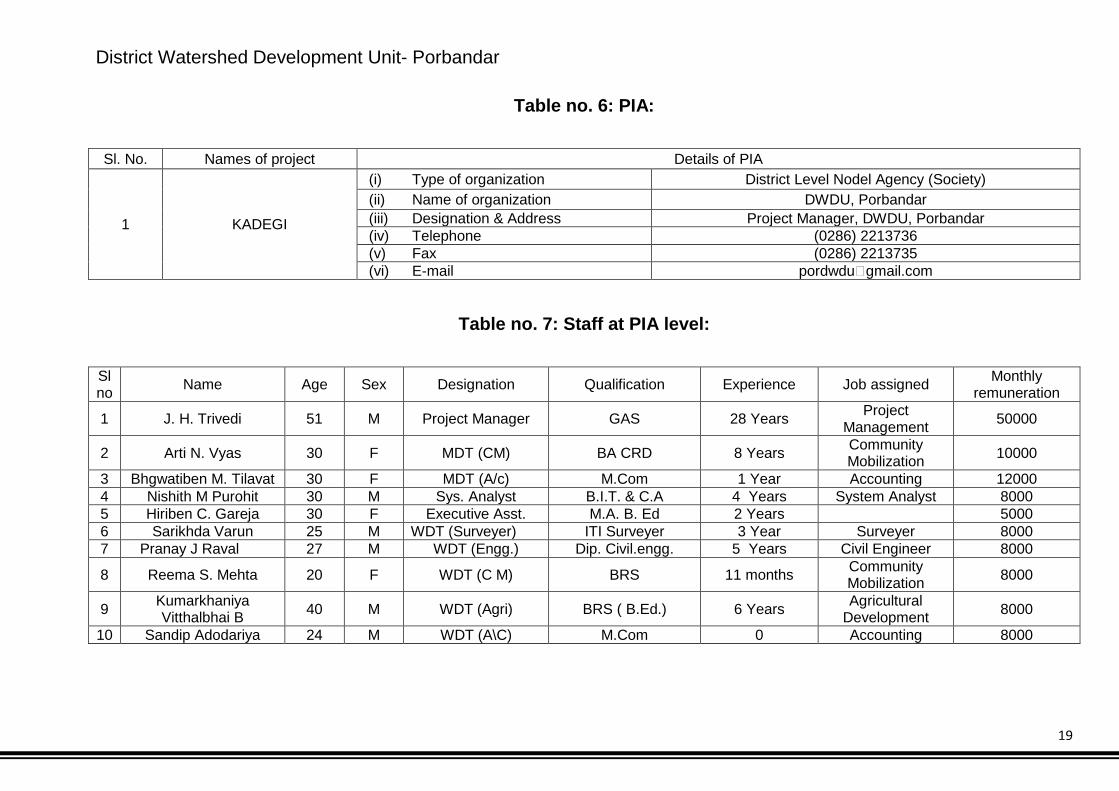
Table no. 6: PIA:
Sl. No. Names of project Details of PIA
1 KADEGI
(i) Type of organization District Level Nodel Agency (Society) (ii) Name of organization DWDU, Porbandar (iii) Designation & Address Project Manager, DWDU, Porbandar (iv) Telephone (0286) 2213736 (v) Fax (0286) 2213735 (vi) E-mail pordwdugmail.com
Table no. 7: Staff at PIA level:
Sl no Name Age Sex Designation Qualification Experience Job assigned Monthly
remuneration
1 J. H. Trivedi 51 M Project Manager GAS 28 Years Project Management 50000
2 Arti N. Vyas 30 F MDT (CM) BA CRD 8 Years Community Mobilization 10000
3 Bhgwatiben M. Tilavat 30 F MDT (A/c) M.Com 1 Year Accounting 12000 4 Nishith M Purohit 30 M Sys. Analyst B.I.T. & C.A 4 Years System Analyst 8000 5 Hiriben C. Gareja 30 F Executive Asst. M.A. B. Ed 2 Years 5000 6 Sarikhda Varun 25 M WDT (Surveyer) ITI Surveyer 3 Year Surveyer 8000 7 Pranay J Raval 27 M WDT (Engg.) Dip. Civil.engg. 5 Years Civil Engineer 8000
8 Reema S. Mehta 20 F WDT (C M) BRS 11 months Community Mobilization 8000
9 Kumarkhaniya Vitthalbhai B 40 M WDT (Agri) BRS ( B.Ed.) 6 Years Agricultural
Development 8000
10 Sandip Adodariya 24 M WDT (A\C) M.Com 0 Accounting 8000

District Watershed Development Unit- Porbandar
20

District Watershed Development Unit- Porbandar
21
3.1. Geography and Geo-hydrology 3.1.1 Land use pattern: The net geographical area of Kadegi watershed is about 5853.11 ha out of which has no forest area. The About 70% of
land is under agriculture which is completely rain-fed; mainly a Kharif crop is taken. About 13.69% of the total land is
classified under wasteland of which 2.84 percent is cultivable and rest is uncultivable and hilly. The watershed consists of
thorny species of Ground Nuts which was mainly broadcasted to stop the spread of desert.
Table no. 8: Land use pattern:
S. No. Names of villages
Geographical Area of the
village
Forest Area
Land under agricultural
use
Rainfed area
Perm-anent
pastu-res
Wasteland
Cultivable Non-cultivable
1 Junej 496.6 - 347.7 347.7 53.9 - 14.1 2 Bhadula 936.6 - 690.2 690.2 102.5 - 16.5 3 Bhogsar 453.4 - 392 392 40.2 - 21.2 4 Jamra 1460.4 - 1287.8 1287.8 165.7 - 7 5 Kadegi 1651.8 - 1100.6 1100.6 289.8 - 70.4 6 Kotda 1365.6 - 676.2 676.2 201.8 - 14.5

District Watershed Development Unit- Porbandar
22
3.1.2 Soil and topography: Kadegi watershed project (IMWP) falls under Saurashtra South Zone. The soil is mainly sandy
loamy and saline. The soil is Sticky Black to very dark grayish brown in surface colour. The depth of soil is moderate to
deep about 22 to 73 cm. The predominant texture of soil is loamy sand and silt and clay. The soil fertility is very poor with
low nitrogen, phosphorus and potash. The soil falls in Undulated to Flat. The topography of the area is moderate ranging
from 0-1% slop.
Table no. 9: Soil type and topography:
S. No. Name of the Agro-climatic zone covers project area Area in ha
Names of the villages
Major soil types Topo-graphy a)Type b) Area in ha
1
Saurashtra South Zone – 7
496.6 Junej
Sticky Black/ Sandy long –
Saline
496.6
Moderate Undulated to
flat
2 936.6 Bhadula 936.6
3 453.4 Bhogsar 453.4 4 1460.4 Jamra 1460.4 5 1651.8 Kadegi 1651.8 6 1365.6 Kotda 1365.6
# Flat, undulating, moderate slope, Steep slope
District Watershed Development Unit- Porbandar
23
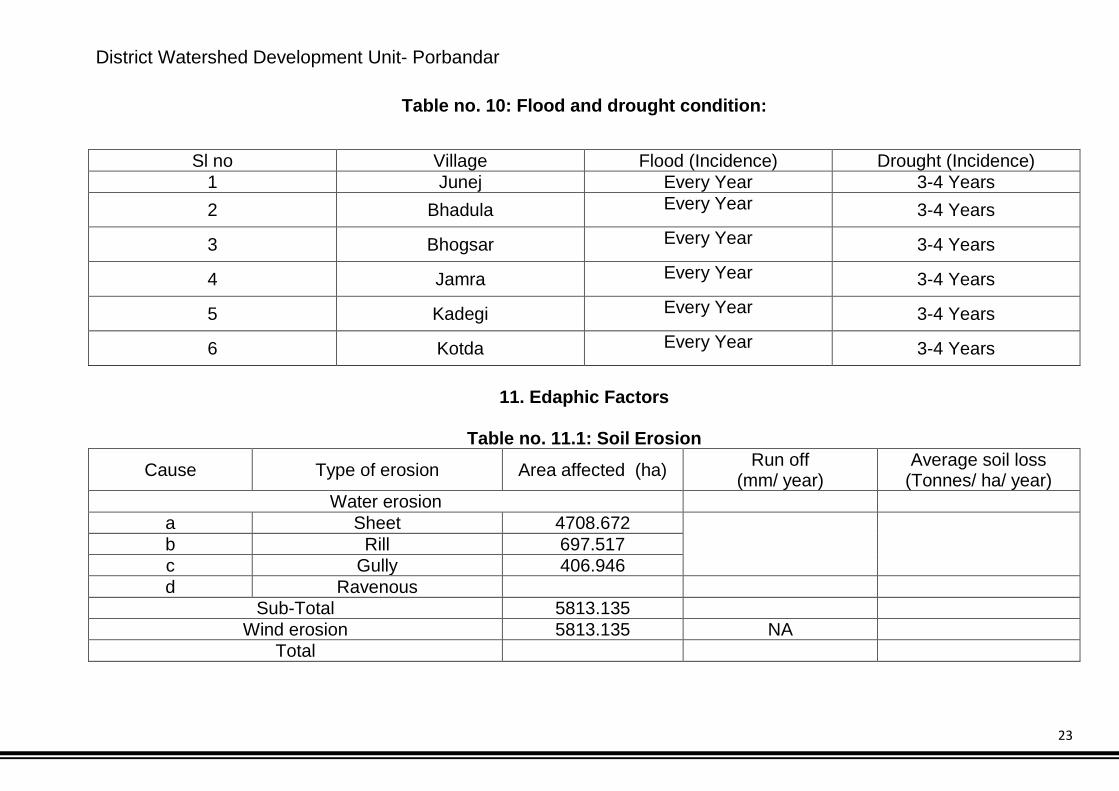
Table no. 10: Flood and drought condition:
Sl no Village Flood (Incidence) Drought (Incidence) 1 Junej Every Year 3-4 Years 2 Bhadula Every Year 3-4 Years
3 Bhogsar Every Year 3-4 Years
4 Jamra Every Year 3-4 Years
5 Kadegi Every Year 3-4 Years
6 Kotda Every Year 3-4 Years
11. Edaphic Factors
Table no. 11.1: Soil Erosion
Cause Type of erosion Area affected (ha) Run off (mm/ year)
Average soil loss (Tonnes/ ha/ year)
Water erosion a Sheet 4708.672
b Rill 697.517 c Gully 406.946 d Ravenous
Sub-Total 5813.135 Wind erosion 5813.135 NA
Total

District Watershed Development Unit- Porbandar
24
Table no. 11.2: Soil Salinity/Alkalinity (Salinity ingress)
Name of the Village Survey Number Soil pH Type of Salinity (Inherent/Ingress)
Junej
Ingrees
Bhadula Bhogsar Jamra Kadegi Kotda
Table no. 11.3: Waterlogging Conditions Name of the Village Survey Number Reasons
Junej All most all the land area Kharo river is Nearest Villages Runoff water washout the soil
Bhadula All most all the land area Kharo river is Nearest Villages Runoff water washout the soil
Bhogsar All most all the land area Bhadar river is Nearest Villages Runoff water washout the soil
Jamra All most all the land area Kharo River is Water and Nearest Villages Runoff water washout the soil
Kadegi All most all the land area Kharo River is Water and Nearest Villages Runoff water washout the soil
Kotda All most all the land area Milsar, Bhadar, Lakendri and Dudhi rivers are Nearest Villages Runoff
water washout the soil

District Watershed Development Unit- Porbandar
25
The rainfall is scanty which has resulted in recurrent phenomenon Flood every years. The average rainfall of this
area is about 833 mm (from past five year data) with a highest intensity of 84 mm within span of a day. This uneven distribution is leading to runoff of soil every year to the streams, rivulets and depressed area saline.
Table no. 12: Climatic conditions:
Name of project Average rainfall- last 5 years Average temperature
IWMP-1 833 Summer Winter
Max Min Max Min 42 35 40 39
Table no. 13: Physiography and relief
Project name Elevation Slope range (%) Major streams IWMP-1 43 meters 0-1 % Kharo River
3.1.3 Land and Agriculture: Lack of surface water source and high salinity of ground water has limited the sufficient base for irrigation as well as for
drinking purpose. The average land holding is ranging from 1 to 4 ha. Lack of irrigation source forces the majority of the
farmers to take one Crop in all seasons. This affects directly the demographic profile of the village. The major crops
cultivated by the farmers are Ground nuts and Jowar (Sorghum). Some of the farmers take up rain-fed castor crop if rainfall
is good. The land conservation measures such as earthen bunds and farm bunds in the area will help them to take up a
rabi crop of wheat and Chana in the residual moisture.

District Watershed Development Unit- Porbandar
26
Table no. 14: Land ownership details
Sl
no Village
Total owned land HHs giving
land on lease
HHs taking
land on lease Gen OBC SC ST
1 Junej
2 Bhadula 297.9915 598.1670 24.2294 -
3 Bhogsar
4 Jamra 40.5063 814.80548 - -
5 Kadegi 30.2181 1060.5197 39.8232 -
6 Kotda

District Watershed Development Unit- Porbandar
27
Figure 3, Bio Physical Survey of the project

District Watershed Development Unit- Porbandar
28
Table no. 15: Agriculture
Sl no Village Net sown area (in ha)
One time Two times Three times
1 Junej 335.8 NA NA
2 Bhadula 670.2 NA NA
3 Bhogsar 330.6 NA NA
4 Jamra 1115.1 951.78 NA
5 Kadegi 1056.78 NA NA
6 Kotda 658.2 NA NA

District Watershed Development Unit- Porbandar
29
Table no. 16: Irrigation
Sl
no Village
Source 1 : Canal Source 2 : Check dam / Pond Source 3 : Well
Availability
months Net area
Gross
area
Availability
months Net area
Gross
area
Availability
months
Net
area
Gross
area
1 Junej NA NA NA 6 month NA NA NA NA NA
2 Bhadula NA NA NA NA NA NA NA NA NA
3 Bhogsar NA NA NA 3-6 5 5 0-3 5 5
4 Jamra NA NA NA 3-6 75 75 - - -
5 Kadegi NA NA NA 6 - - - - -
6 Kotda NA NA NA 3-6 75 75 NA NA NA

District Watershed Development Unit- Porbandar
30
Table no. 17: Crop details
Sl
no Village Kharif (Monsoon)
Ground Nut Crop 2 Crop 3
Area Production Productivity Area Production Productivity Area Production Productivity
1 Jamra 618.66 123731 200 - - - - - -
2 Kadegi 686.91 137382 200 - - - - - -
3 Junej 235.06 70518 300 - - - - - -
4 Bhadula 459.14 410497.5 875 - - - - - -
5 Bhogsar 231.42 57855 250 - - - - - -
6 Kotda 460.74 129007 280 - - - - - -

District Watershed Development Unit- Porbandar
31
Sl
no Village Rabi (Winter)
Juwar Channa Crop 3
Area Production Productivity Area Production Productivity Area Production Productivity
1 Jamra 519.20 62304 120 230.25 29932 130 - - -
2 Kadegi 430.25 47327.5 110 267.30 32076 120 - - -
3 Junej 153.80 19225 125 135.20 18252 135 - - -
4 Bhadula 315.20 36248 115 165.33 20666 125 - - -
5 Bhogsar 163.15 22025 135 125.23 14401 115 - - -
6 Kotda 380.25 53235 140 156.20 19525 125 - - -

District Watershed Development Unit- Porbandar
32
3.1.4 Livestock: The village has 266 cows, 1732 buffaloes, 1006 bullocks, 1526 goat . Majority of rabari community depends on goat and
sheep rearing for their livelihood. Cows and buffaloes are of local breed. Lack of rain and surface water has reduced the
fodder and pasture availability for their animals. This leads to heavy migration to other parts of the state with their herds of
goats and sheep. Milk production is so low in the village.
Table no. 18: Livestock
Sl
no Village Buffalo Cow
Total Milk
(Buffalo+Cow) Goat Sheep Bullock Hen Others
No milk No Milk No Milk
1 Junej 235 1420/DAY 25 90/DAY 1510/DAY 350 350/DAY 350 210 0 4
2 Bhadula 175 1750/DAY 10 55/DAY 1805/DAY 5 4/DAY 00 100 0 11
3 Bhogsar 100 1500/DAY 40 400/DAY 1900/DAY 25 23.5/DAY 60 80 0 3
4 Jamra 200 2850/DAY 25 250/DAY 3100/DAY 100 91/DAY - 140 0 3
5 Kadegi 230 1700/DAY 60 250/DAY 1950/DAY 525 25/DAY 500 110 0 15
6 Kotda 792 6336/DAY 106 530/DAY 6866/DAY 524 511/DAY 860 366 0 29
Total 1732 15556/DAY 266 1575/DAY 17131/DAY 1526 1004.5/DAY 1770 1006 0 65
District Watershed Development Unit- Porbandar
33
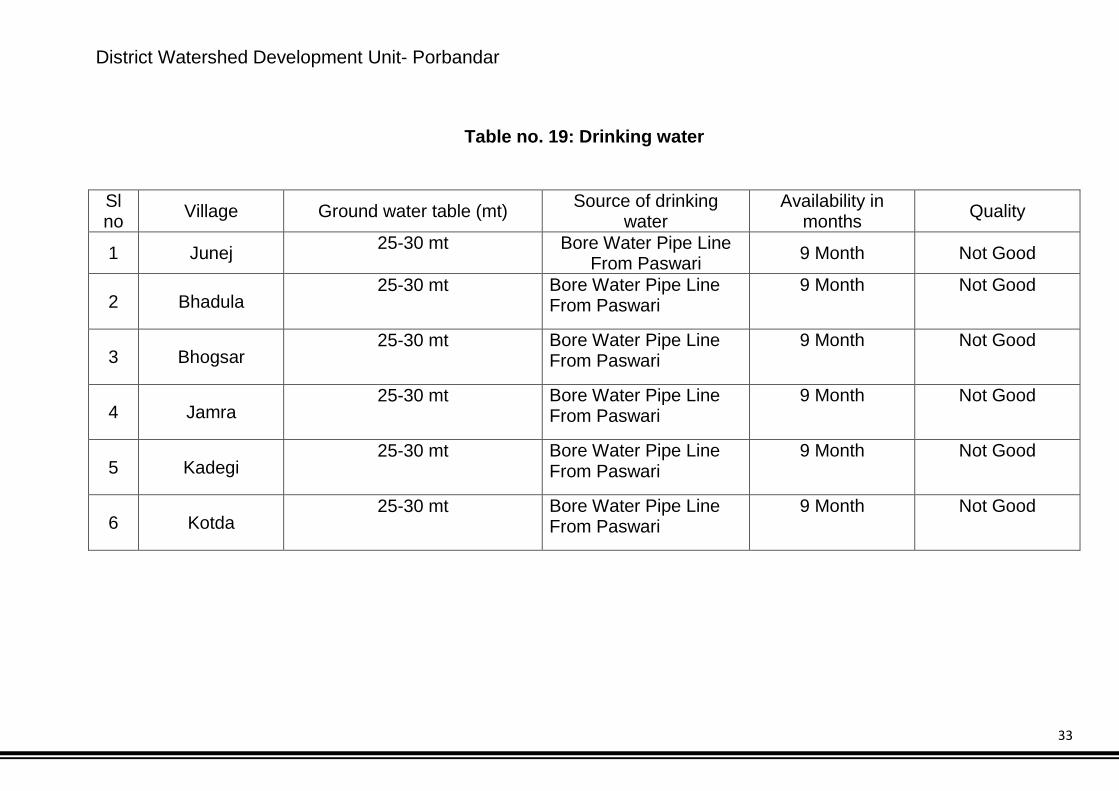
Table no. 19: Drinking water
Sl no Village Ground water table (mt) Source of drinking
water Availability in
months Quality
1 Junej 25-30 mt
Bore Water Pipe Line From Paswari 9 Month Not Good
2 Bhadula 25-30 mt Bore Water Pipe Line
From Paswari 9 Month Not Good
3 Bhogsar 25-30 mt Bore Water Pipe Line
From Paswari 9 Month Not Good
4 Jamra 25-30 mt Bore Water Pipe Line
From Paswari 9 Month Not Good
5 Kadegi 25-30 mt Bore Water Pipe Line
From Paswari 9 Month Not Good
6 Kotda 25-30 mt Bore Water Pipe Line
From Paswari 9 Month Not Good

District Watershed Development Unit- Porbandar
34
Table no. 20: Details of Common Property Resources
S. No.
Names of
project
Name of
Village
CPR Particulars
Total Area (ha) Area owned/ In possession of Area available for treatment (ha)
Pvt. persons
Govt. (specif
y deptt.)
PRI Any
other (Pl. Specify)
Pvt. person
s
Govt. (speci
fy deptt.)
PRI Any other
(Pl. Specify)
1
IWMP-
1
Junej
Wasteland/
degraded land 279.7 53.9 279.7 53.9
Pastures 14.1 14.1
Village Ponds/
Tanks 2
Community
Buildings 1
Temples/ Places of
worship 4

District Watershed Development Unit- Porbandar
35
2
IWMP-1
Bhadula
Wasteland/ degraded land 690.2 16.5 690.2 16.5
Pastures 102.5 102.
5
Village Ponds/ Tanks 2
Community Buildings 1
Temples/ Places of worship 3
3 Bhogsar
Wasteland/ degraded land 330.6 40.2 330.6 40.2
Pastures 21.2 21.2 Village Ponds/ Tanks 4
Community Buildings 1
Temples/ Places of worship 3

District Watershed Development Unit- Porbandar
36
4
IWMP-1
JAMRA
Wasteland/ degraded land 1115.1 165.7 1115.1 165.7
Pastures 7 7 Village Ponds/ Tanks 2
Community Buildings 1
Temples/ Places of worship 7
5 KADEGI
Wasteland/
degraded land 740.4 289.8 740.4 289.8
Pastures 70.4 70.4
Village Ponds/
Tanks 1
Community
Buildings 1
Temples/ Places of
worship 9

District Watershed Development Unit- Porbandar
37
6 IWMP-
1
Kotda
Wasteland/
degraded land 459.9 201.8 459.9 201.8
Pastures 14.5 14.5
Village Ponds/
Tanks 7
Community
Buildings 1
Temples/ Places of
worship 10

District Watershed Development Unit- Porbandar
38
3.2. Socio-Economic Profile 3.2.1 Demographic Status: Kadegi watershed project has a total of 2129 households with a population of 8369 (as per base-line survey) out of which
4461 are male and 3908 female .The sex ratio is 877 female to 1000 male. There are 390 BPL families. The average
family size is 5. The literacy rate is average i.e. 51.04 per cent; male literacy rate is 59.41 per cent (of total male
population) and female literacy rate is 41.14 per cent (of total female population). It is noticeable that only 15 Percent
persons have reached up to ninth standard. The major castes in the village are Patel. Mer(OBC), Gen and Schedule Tribe
. Majority of population is involved in agriculture and animal husbandry.
Table no. 21: Demographic information
Sl
no Village Population SC ST
Total Male Female Total Male Female % Total Male Female %
1 Junej 560 299 261 67 38 29 11.96 0 0 0 0
2 Bhadula 698 366 332 88 43 45 12.60 0 0 0 0
3 Bhogsar 485 252 233 55 29 26 11 0 0 0 0
4 Jamra 1191 637 554 128 62 66 11 7 3 4 0.06
5 Kadegi 2227 1142 1085 75 39 36 3.40 0 0 0 0
6 Kotda 3208 1765 1443 205 105 100 06 0 0 0 0
Total 8369 4461 3908 618 316 302 9.33 7 3 4 0.06
District Watershed Development Unit- Porbandar
39
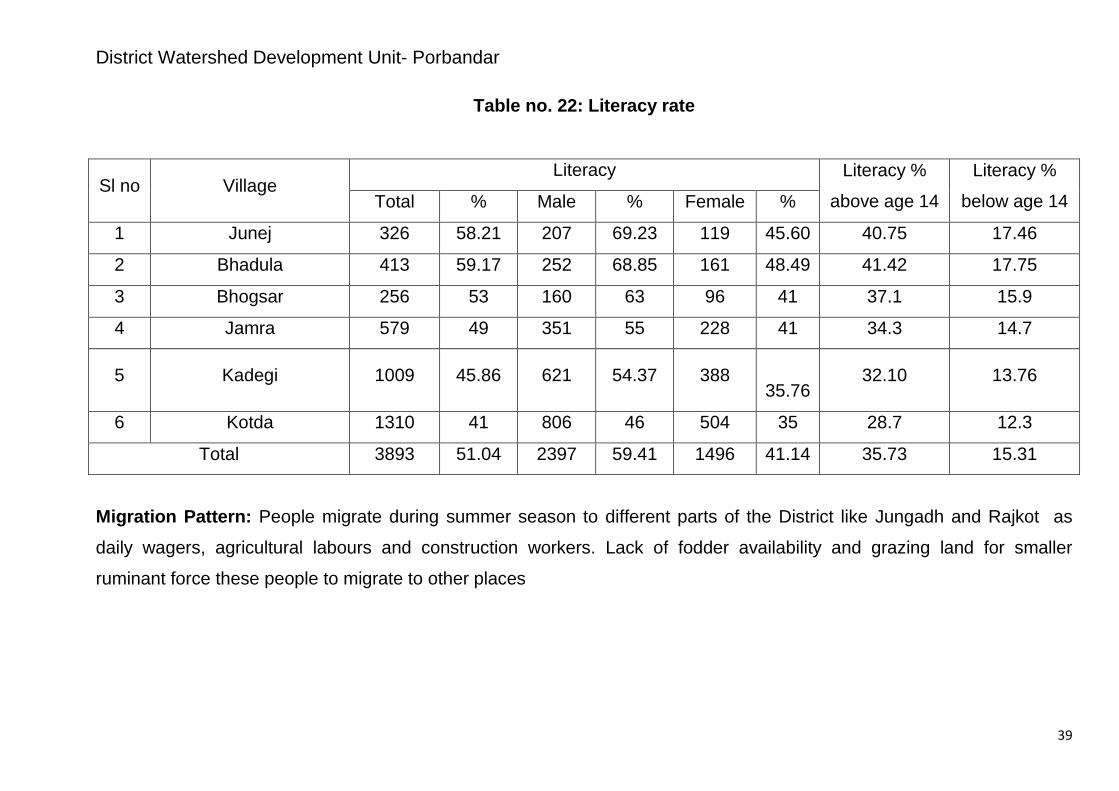
Table no. 22: Literacy rate
Sl no Village Literacy Literacy %
above age 14
Literacy %
below age 14 Total % Male % Female %
1 Junej 326 58.21 207 69.23 119 45.60 40.75 17.46
2 Bhadula 413 59.17 252 68.85 161 48.49 41.42 17.75
3 Bhogsar 256 53 160 63 96 41 37.1 15.9
4 Jamra 579 49 351 55 228 41 34.3 14.7
5 Kadegi 1009 45.86 621 54.37 388
35.76 32.10 13.76
6 Kotda 1310 41 806 46 504 35 28.7 12.3
Total 3893 51.04 2397 59.41 1496 41.14 35.73 15.31
Migration Pattern: People migrate during summer season to different parts of the District like Jungadh and Rajkot as
daily wagers, agricultural labours and construction workers. Lack of fodder availability and grazing land for smaller
ruminant force these people to migrate to other places

District Watershed Development Unit- Porbandar
40
Table no. 23: Migration details
Sl
no Village
Total
population
Migration Migration by months
Main reason
for migration
Income
during
migration
/ month
Total Male Female Up to 3
months
3-6
months
More
than 6
months
1 Junej 560 58 42 16 Na YES
Lake of
Employment
2200
2 Bhadula 698 140 84 56 Na YES 2250
3 Bhogsar 485 65 45 20 Na YES 2350
4 Jamra 1191 250 180 70 Na NO 2350
5 Kadegi 2227 245 174 71 Na NO 2200
6 Kotda 3208 550 335 215 Na YES 2850

District Watershed Development Unit- Porbandar
41
Table no. 24: Poverty
Sl no Village Total
Household
BPL % of BPL
HH
Total Land less
HH
% of land less
HH 0-16 16-20 Total
1 Junej 154 5 6 11 7.14 24 15.58%
1 Bhadula 190 4 33 37 19.47 37 19.47%
1 Bhogsar 167 43 21 64 38.32 25 14.80%
1 JAMRA 275 116 82 198 72% 9 3.28%
1 KADEGI 525 3 38 41 7.80% 39 7.42%
1 Kotda 733 17 22 39 5.32 90 12.28%
Infrastructure facilities: Kadegi watershed is well connected with Kutiyana Taluka with pucca roads. The village has electricity connectivity under
Jyotigram Yojana of the State Government. Nearly 99 per cent of households in the village have their personal electric
meters. Kadegi Projecthas a primary school with all facilities. For middle and higher secondary education, the students
have to go to Kutiyana 30 kilometres away. This also contributes to lower education level of the people. The village do not
have a Primary Health Centre for which villagers have to go to Kutiyana which is 30 Km. away. The village comes under
not Group Panchayat..

District Watershed Development Unit- Porbandar
42
Table no. 25: Village infrastructure
Sl
no Village
Pucca
road
to the
village
(Y/N)
Schools
Colleges
(Number)
Post
Office
(Distance)
Banks
(Number)
Distance
from
nearest
market
yard
Milk
collection
centre
(Number)
Milk
cooperative
(Number)
Other
cooperatives
/ CBIs
(Number)
Any other
institution LP UP HS
1 Junej Y LP up 0 2 km 0 30 KM 1 1 0 0
2 Bhadula Y LP 0 0 0 28 KM 1 1 0 0
3 Bhogsar Y LP 0 7 0 15 KM 1 1 0 0
4 Jamra Y LP UP 0 0 0 22 KM 1 1 0 0
5 Kadegi Y LP UP 0 0 0 32 KM 1 1 0 0
6 Kotda Y LP 0 0 0 9 KM 1 1 0 0
District Watershed Development Unit- Porbandar
43
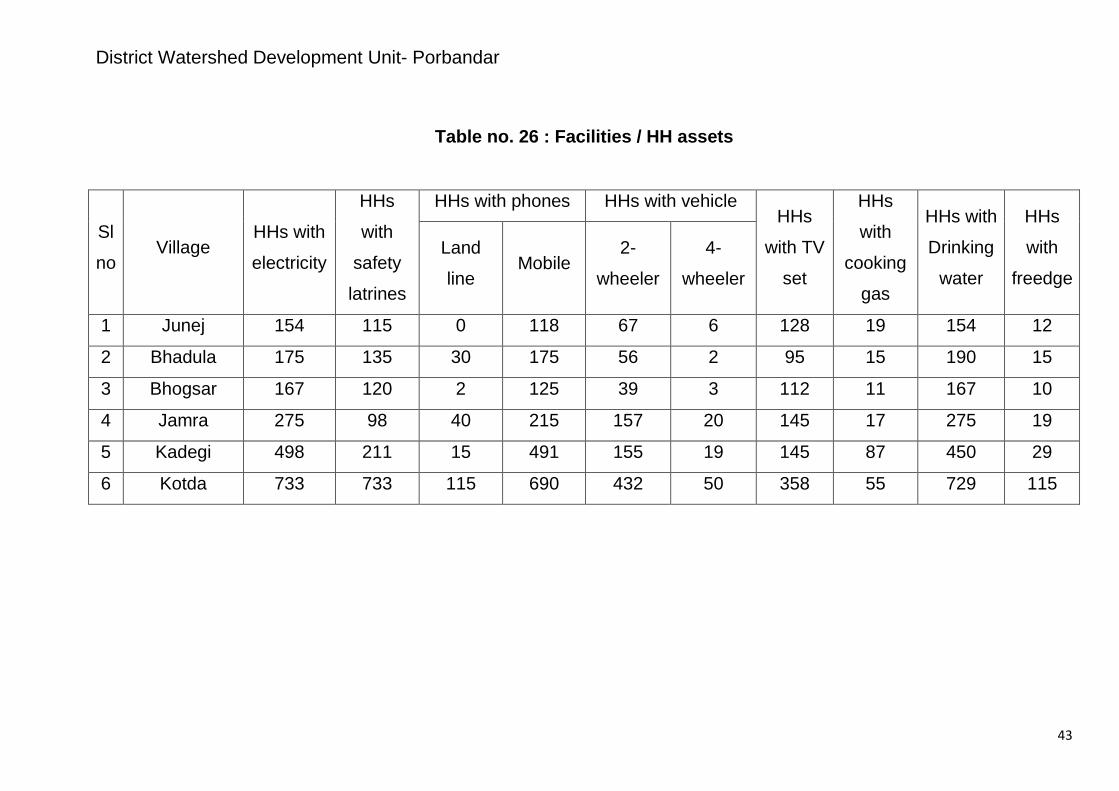
Table no. 26 : Facilities / HH assets
Sl
no Village
HHs with
electricity
HHs
with
safety
latrines
HHs with phones HHs with vehicle HHs
with TV
set
HHs
with
cooking
gas
HHs with
Drinking
water
HHs
with
freedge
Land
line Mobile
2-
wheeler
4-
wheeler
1 Junej 154 115 0 118 67 6 128 19 154 12
2 Bhadula 175 135 30 175 56 2 95 15 190 15
3 Bhogsar 167 120 2 125 39 3 112 11 167 10
4 Jamra 275 98 40 215 157 20 145 17 275 19
5 Kadegi 498 211 15 491 155 19 145 87 450 29
6 Kotda 733 733 115 690 432 50 358 55 729 115
District Watershed Development Unit- Porbandar
44
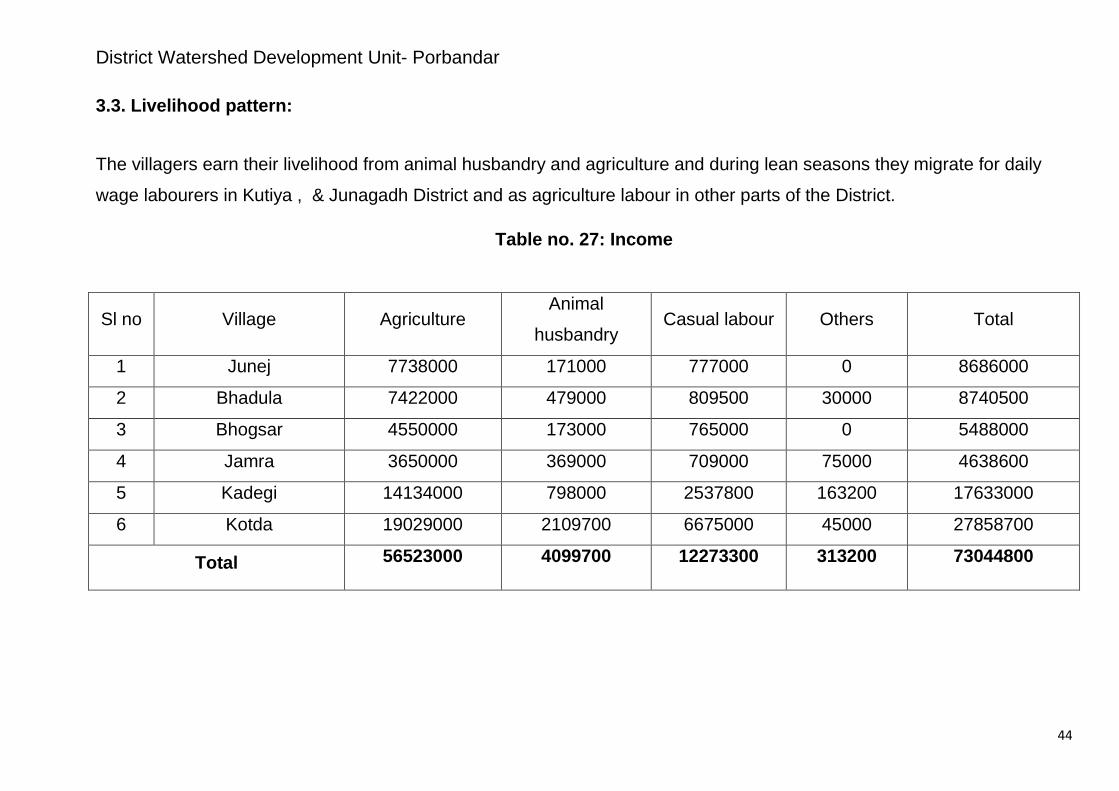
3.3. Livelihood pattern:
The villagers earn their livelihood from animal husbandry and agriculture and during lean seasons they migrate for daily
wage labourers in Kutiya , & Junagadh District and as agriculture labour in other parts of the District.
Table no. 27: Income
Sl no Village Agriculture Animal
husbandry Casual labour Others Total
1 Junej 7738000 171000 777000 0 8686000
2 Bhadula 7422000 479000 809500 30000 8740500
3 Bhogsar 4550000 173000 765000 0 5488000
4 Jamra 3650000 369000 709000 75000 4638600
5 Kadegi 14134000 798000 2537800 163200 17633000
6 Kotda 19029000 2109700 6675000 45000 27858700
Total 56523000 4099700 12273300 313200 73044800

District Watershed Development Unit- Porbandar
45
Table no. 29: Livelihood pattern (Occupational distribution)
Sl
no Village
Total
workforce Agriculture
Animal
husbandry
(AH)
Agriculture
+ AH
Casual
labour Services Handicraft Others
1 Junej 364 200 73 55 47 18 0 25
2 Bhadula 454 250 91 68 59 23 0 32
3 Bhogsar 315 173 63 47 41 16 0 22
4 Jamra 774 426 155 116 101 39 0 54
5 Kadegi 1448 796 290 217 188 72 0 101
6 Kotda 2085 1147 417 313 271 104 0 146
Total 5440 2992 1088 816 707 272 0 381
District Watershed Development Unit- Porbandar
46
3.4. Comparative data of the crop productivity of the area: project area vs. District vs. State vs. Country vs. World: “The term productivity in general means the total output per unit of factor input. For example land productivity means
output per hectare of land. Productivity is an average and is calculated by dividing the total output of a particular crop by
the total cultivated area under that crop.”
Data are made available by the Baseline survey (for Kadegi Project), Handbook of Agriculture, ICAR publication 2006(For
Gujarat and India), and Final district plan (IWDP) of Dept. of Agriculture (for Porbandar). The results indicate that Kadegi
Project has very low productivity compared to world, India, Gujarat and Porbandar. The productivity is low not only
because that the land is unproductive or the farmer’s lack the skills to manage their crop but also due lack to of source of
irrigation, salty water and scarcity of rain.
The Kadegi Project comes under arid zone. So farmers grow crop according to the rainfall. If they get good rainfall they
generally grow high value crops like Ground nut, Juwar etc. In case of low rainfall they can’t take any crops. So we can
say that monsoon decides cropping patterns of Kadegi Project.
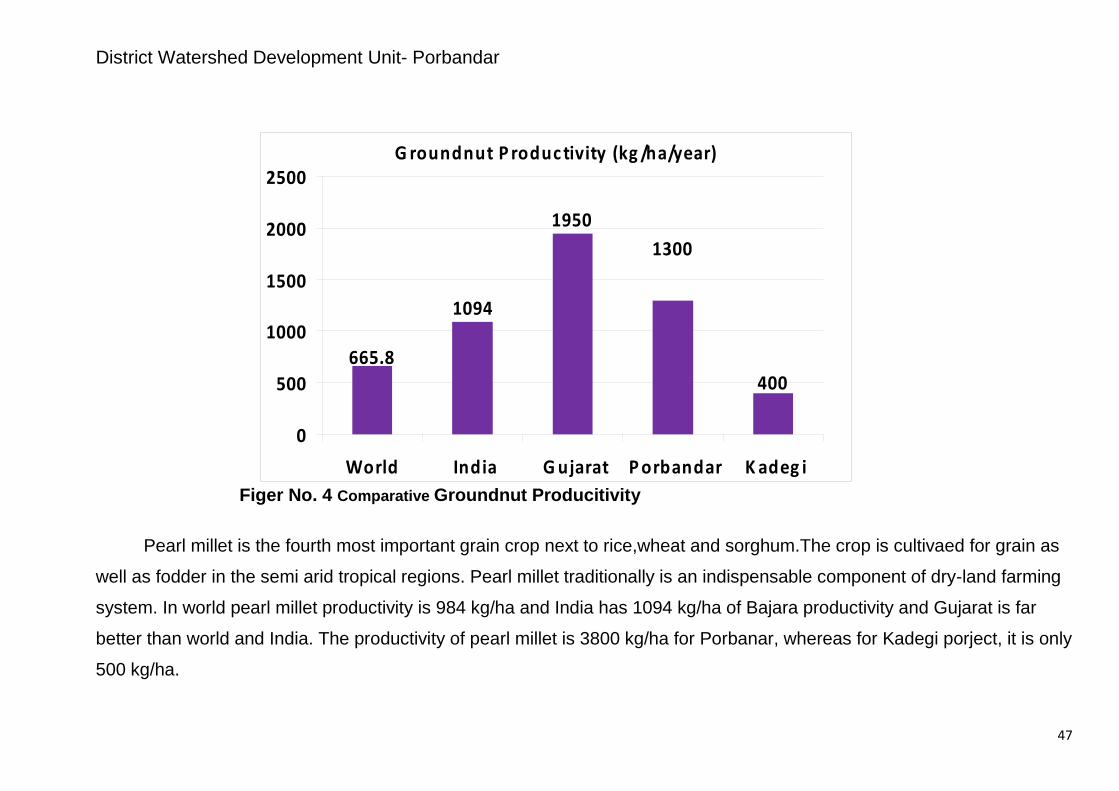
The world productivity of Ground nuts is 665.80 kg/ha. In India, it is grown in about 7.3 lakh hectares with a production of
8.0 lakh tonnes and productivity of 1,094 kg/ha. Gujarat alone produces about 80% of the total castor of our country from
50% of the area with a record productivity of about 1950 kg/ha. Porbanar district has very good productivity 1300 kg /ha.
The Kadegi Projectarea has only 400 kg/ha productivity. It is very low compare to district, State, India and world.
District Watershed Development Unit- Porbandar
47
Figer No. 4 Comparative Groundnut Producitivity
Pearl millet is the fourth most important grain crop next to rice,wheat and sorghum.The crop is cultivaed for grain as
well as fodder in the semi arid tropical regions. Pearl millet traditionally is an indispensable component of dry-land farming
system. In world pearl millet productivity is 984 kg/ha and India has 1094 kg/ha of Bajara productivity and Gujarat is far
better than world and India. The productivity of pearl millet is 3800 kg/ha for Porbanar, whereas for Kadegi porject, it is only
500 kg/ha.
G roundnut P roduc tivity (kg /ha/year)
665.8
1094
19501300
400
0
500
1000
1500
2000
2500
World India G ujarat P orbandar K adeg i

District Watershed Development Unit- Porbandar
48
Figer No. 5 Comparative Pearal Millet Producitivity
Rapeseed (mustard) is the second most important oilseed crop after groundnut,contributing nearly 25-30% of the total
oilseed production in the country.The world productivity of Rapeseed-mustard is 829 kg/ha.We can see that Kadegi
Projecthas very low productivity in comparison to Porbanar,Gujarat,India and world
P earl millet produc tivity (kg /ha/year)
9841,094
1,9501,800
500
0
500
1000
1500
2000
World India G ujarat P orbandar K adeg i

District Watershed Development Unit- Porbandar
49
The world and India productivity of cumin are 550 kg,400 kg per hectare respectively. Gujarat is a major cumin producing
state in India with the productivity of 472 kg/ha.Cumin productivity of Porbanar is 300 kg/ha and Kadegi village has very
poor productivity with 225 Kg/ha.
Figer No. 6 Comparative Cumin Producitivity
C umin produc tivity (kg /ha/year)
550
400
472
300
225
0
100
200
300
400
500
600
World India G ujarat P orbandar K adeg i
District Watershed Development Unit- Porbandar
50
The Kadegi Project area has low productivity because of the following reasons:
i) Full dependence on monsoon: Kadegi Project is dependent on monsoon. Water is essential input in agriculture. Due to the absence of proper irrigation
facility, 100% of the total cultivated area depends on the uncertain monsoon. Therefore, the success or failure of the
monsoon determines the success or failure of agriculture production. The rainfall is unreliable due to two factors: untimely
and inadequate.
ii) Low use of fertilizer per unit cropped area: Farmers do not use sufficient fertilizer due to lack of water, scarcity of fertilizer in market and insufficient money for
fertilizer. Many a times they don’t get fertilizer at the right time. and the salinity also decrees his fertility.
iii) Traditional farming methods: This also leads to low productivity. There is a lot of ignorance about the use of new farming methods and technologies
such as multiple cropping. They don’t use FYM and other input in a proper way; that is why they don’t get 100% output. So
these factors contribute to low productivity.

District Watershed Development Unit- Porbandar
51
iv) Lack of adequate farm machinery: Even today a large number of farmers in Junej use wooden ploughs and bullocks. They don’t have adequate machinery
like seed drill. So, old machineries take more time in tillage practices.
v) Lack of finances for farmers: In Junej most of the farmers are marginal and small. They do not have enough money to buy good quality seeds,
machinery and other inputs.
vi) Lack of good quality seeds and fertilizers: Good quality seed, fertilizer and pesticide are important factor in agriculture productivity. The use of good quality leads to
higher land productivity. In Junej, however, there are two limitations in the use of fertilizer. First these fertilizers are most
useful in irrigated condition. But in Junej 100 per cent of land depend on rainfall. In Junej mostly farmers use nitrogenous
fertilizers, especially urea, it can’t decrees salinity. This has resulted in disproportionate use of fertilizer depleting the
quality of land.
District Watershed Development Unit- Porbandar
52
vii) Lack of other facilities such as storage and marketing: 5-10% of agriculture product damage after harvesting due to scarcity of proper storage and proper market for sale. So he
sells to local traders at the low prices. Farmers mainly face proper means of transportation and roads. And second problem
is farmers don’t have proper storage facilities.
District Watershed Development Unit- Porbandar
53

District Watershed Development Unit- Porbandar
54
Watershed Activities Watershed management as a strategy has been adopted by Government of India especially in the rain-fed regions of semi-
arid tropics. These regions are characterized by low and undependable rain, low soil fertility, poor infrastructure
development, low literacy and high incidence of migration. Several studies have identified that there is a dire need of a
systematic and scientific approach to deal with watershed development. The common guidelines generate a fresh and
flexible framework for the next generation watershed development.
4.1. Scientific Planning:
i) Cluster Approach This envisages a broader vision of Geo-hydrological unit which involves treating a cluster of micro-watershed. The Kadegi
Projectconsists of four micro- watersheds namely 5G1B1b1a as their respective codes. Further Junej watershed project is
in continuation with other watershed projects.
ii) Base line Survey To access the impact of any watershed development programme a detailed baseline survey has to be conducted. This
acts a benchmark for any intervention during and post implementation of any development programme. A detailed baseline
survey was undertaken which involved household census survey, Bio-physical survey and Village level data collection from
Talati –cum mantri. Household census survey includes a detailed questionnaire which was been filled by visiting each and
every household in the village. This gave in the details of the demographic profile of the village, the literacy percentage,

District Watershed Development Unit- Porbandar
55
SC/ST population, number of BPL household, cattle population, net consumption rate in the village, average milk
production of the cattle and various schemes running and their benefits
Bio-physical survey was undertaken to identify various natural resources available in the village. It included the soil
typology, well in the area, crop taken in the field, Cropping pattern, fertilizer used and various sources of irrigation in the
field.
iii) Participatory Rural Appraisal (PRA) The past experience of watershed has given tremendous input to focus on creating accountability of the stakeholders
towards the programme. This has created an emphasis to include all the stakeholder communities and their local and
indigenous Technological Knowledge (ITK) while planning for any activity. Participatory approach provides a new path for
planning, implementing, monitoring and post- withdrawal activities with a complete accountability of the stakeholders.
Various PRA techniques like resource mapping, social mapping, and season calendars were used to understand the
physical and social orientation of the village in general and watershed in specific. These tools put the villagers in ease than
the complicated questionnaires. Various tools like Matrix ranking, Venn Diagram were used to identify various local
vegetations (apt for afforestation) , Fodders crops , various institution and their significance in the life of the farmers
District Watershed Development Unit- Porbandar
56
iv) Use of GIS and Remote sensing for planning
Use of various high science tools has been promoted at various stages of watershed development.
a) Prioritization Geographical Information System (GIS) has been used for prioritization process. Various layer maps were created like
Geo-morphological, Soil, BPL Population, SC/ST population, Ground water Status, Drinking water situation Slope percent.
These were all given proper weightage according to the DoLR specification. This helped in prioritization of various
watershed areas.
b) Planning A action plan matrix was formulated by State Level Nodal Agency (SLNA) taking into account various features like the
slope percent, soil Depth, Soil Texture, Soil erosion in the area for wasteland, forest land and agricultural land. Global
positioning System (GPS) was used to identify each and every water conservation structures available in the project area.
This was used to create a map. Contour Map of vertical interval of 1 meter at a scale of 1:8000 was used for identifying
various locations for soil and water conservation structures.

District Watershed Development Unit- Porbandar
57
c) Hydrological modelling
Hydrology modelling technique was used for locating drainage, stream length, flow direction, sink, Flow accumulation. This
model overlaid over cadastral map to calculate the catchment area of each structures like the check dam etc. This has
helped to remove the human error which generally occurs while calculating the catchment area of a check dam.
Table no. 30: Details of Scientific Planning and Inputs in IWMP projects
S. No.
Scientific criteria/ inputs used Whether scientific criteria
was used
(A) Planning
Cluster approach Yes
Whether technical back-stopping for the project has been arranged? If yes, mention
the name of the Institute
Baseline survey Yes
Hydro-geological survey Yes
Contour mapping Yes
Participatory Net Planning (PNP) Yes
Remote sensing data-especially soil/ crop/ run-off cover Yes

District Watershed Development Unit- Porbandar
58
Ridge to Valley treatment
Online IT connectivity between
(1) Project and DRDA cell/ZP Yes
(2) DRDA and SLNA Yes
(3) SLNA and DoLR Yes
Availability of GIS layers
1. Cadastral map Yes
2. Village boundaries Yes
3. Drainage Yes
4. Soil (Soil nutrient status) Yes
5. Land use Yes
6. Ground water status Yes
7. Watershed boundaries Yes
8. Activity Yes
Crop simulation models# Integrated coupled analyzer/ near infrared visible spectroscopy/ medium spectroscopy for high speed soil nutrient analysis Yes
Normalized difference vegetation index (NDVI)# No
Weather Station No
(B) Inputs

District Watershed Development Unit- Porbandar
59
1. Bio-pesticides No 2. Organic manures No 3. Vermicompost Yes 4. Bio-fertilizer Yes 5. Water saving devices Yes 6. Mechanized tools/ implements Yes 7. Bio-fencing Yes 8. Nutrient budgeting No 9. Automatic water level recorders & sediment samplers No Any other (please specify)

District Watershed Development Unit- Porbandar
60
Figer No. 7 Focuas Group Discussion

District Watershed Development Unit- Porbandar
61
District Watershed Development Unit- Porbandar
62
4.2. Institution building
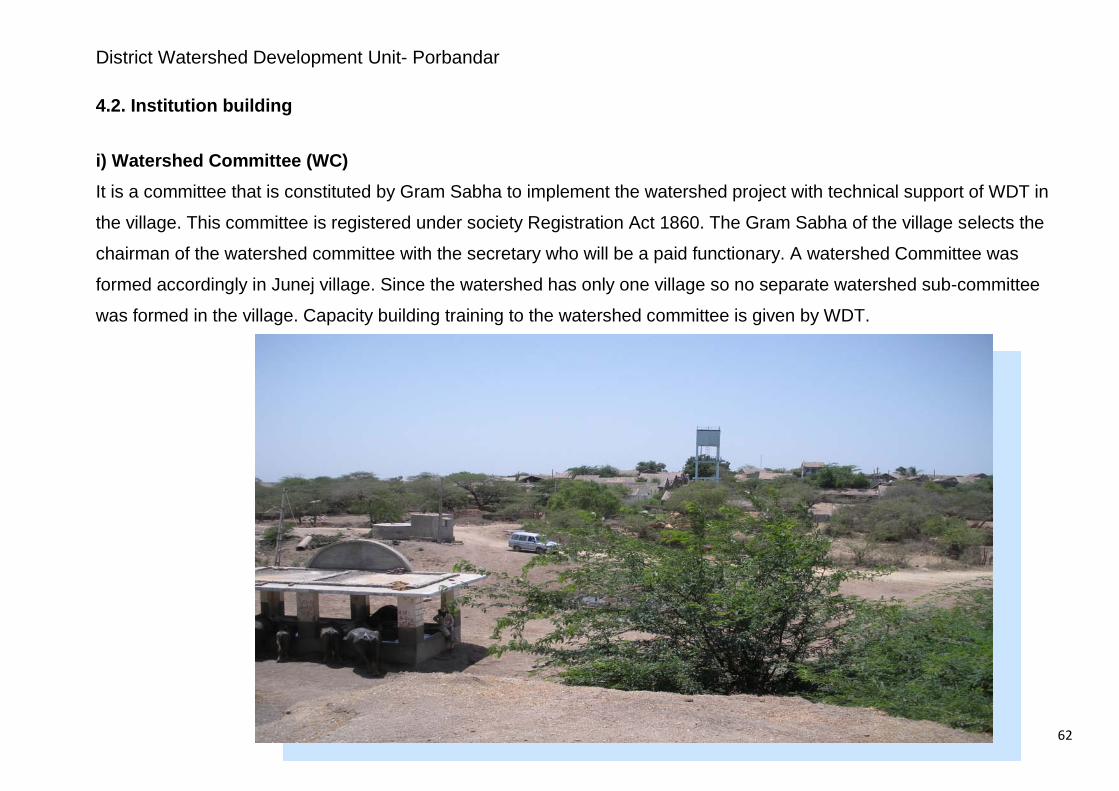
i) Watershed Committee (WC) It is a committee that is constituted by Gram Sabha to implement the watershed project with technical support of WDT in
the village. This committee is registered under society Registration Act 1860. The Gram Sabha of the village selects the
chairman of the watershed committee with the secretary who will be a paid functionary. A watershed Committee was
formed accordingly in Junej village. Since the watershed has only one village so no separate watershed sub-committee
was formed in the village. Capacity building training to the watershed committee is given by WDT.

District Watershed Development Unit- Porbandar
63
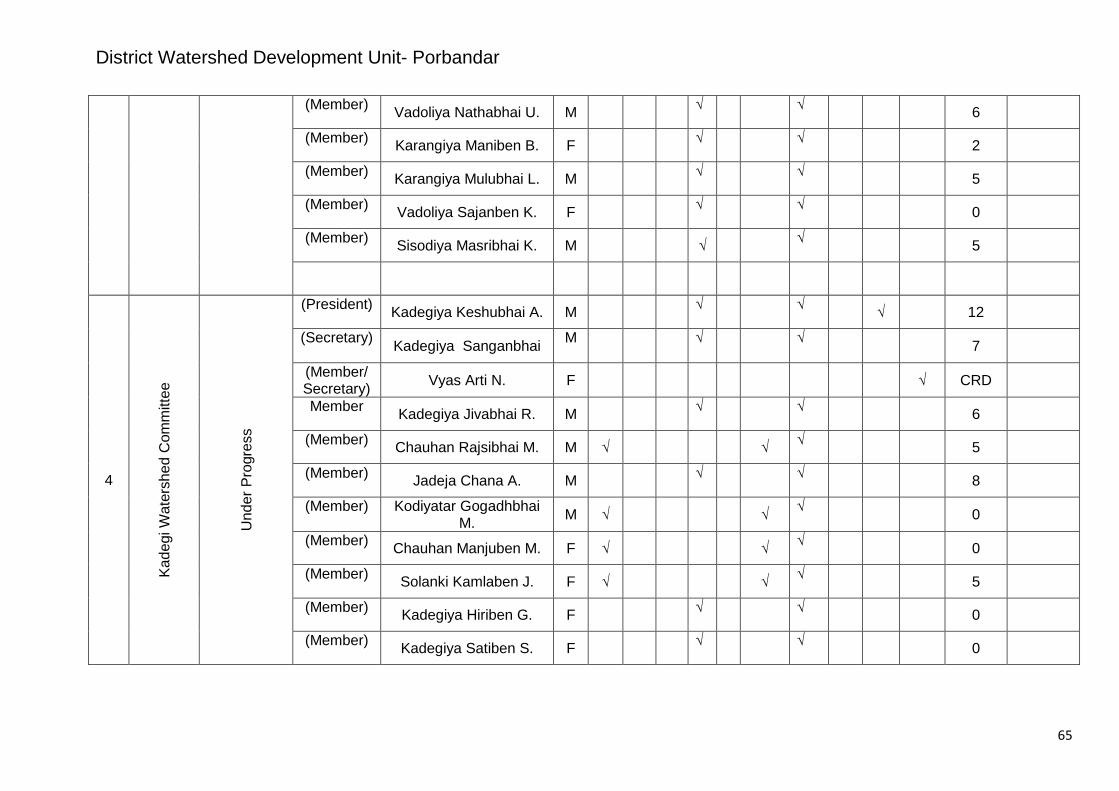
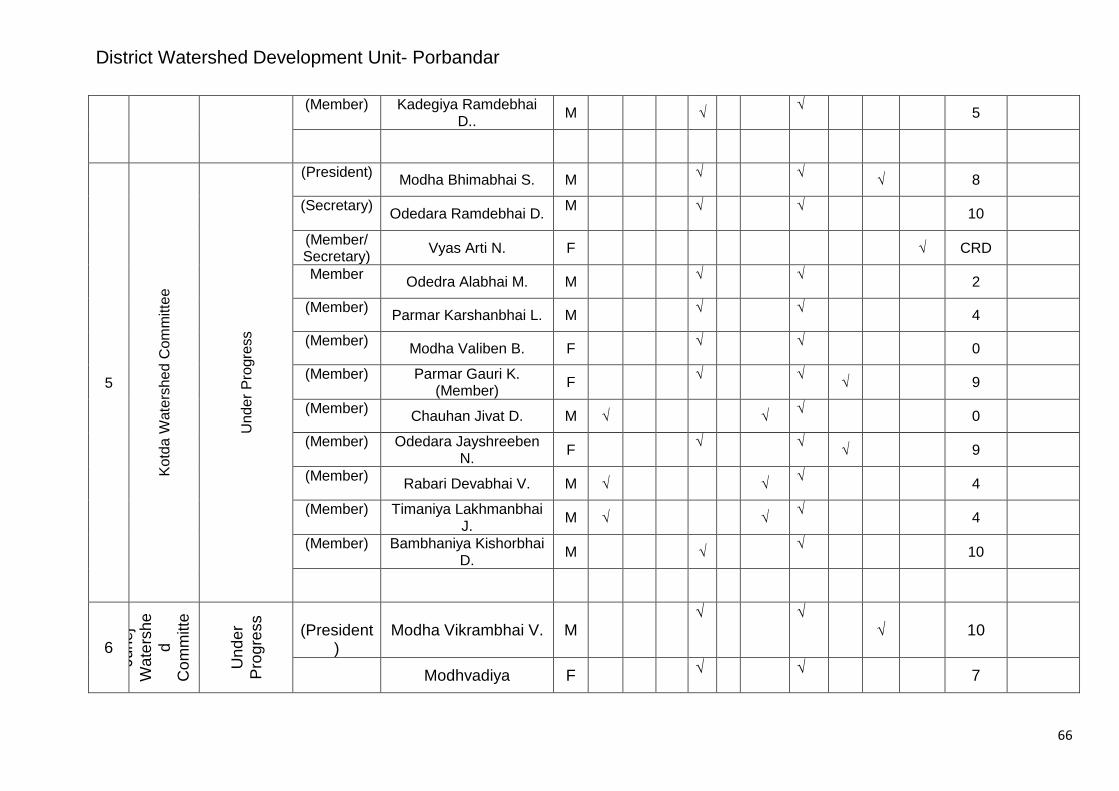
Table No. 31 Committee Details
Sl. No.
Names of WCs
Date of Registration
as a Society (dd/mm/
yyyy)
Designation Name M/
F SC ST SF
MF
LF
Land-less UG
SHG
GP Any othe
r
Educa-tional
qualifi-cation
Function/s
assigned#
1
Bhad
ula
Wat
ersh
ed C
omm
ittee
Und
er P
rogr
ess
President Bhalodiya Kumandas B. M √ √ √ 10 Secretary Bhalodiya Sureshbhai
B. M √ √ 12
Member/ Secretary Vyas Arti N. F √ CRD Member Seradiya Viotthalbhai S. M √ √ 10 (Member Rabara Ranchodbhai J. M √ √ 8 (Member) Kher Hardasbhai P. M √ √ 6 (Member Bhoraniya Hardasbhai
K.) M √ √ 12 (Member) Keshwala Bachubhai
Masri M √ √ 7 (Member) Maru Hardasbhai T. M √ √ √ 10 (Member) Vaghela Mansukhbhai
S.. M √ √ √ 0 (Member) Koradiya Kaushalyaben
K. F √ √ 10 (Member) Kher Valiben C. M √ √ 0
2 ar
Wat
ersh
ed
Com
m U
nder
Pr
ogre
ss (President) Bhogesara Hajabhai K.. M √ √ √ 12
(Secretary) Bhogesara Hirben H. F √ √ 7

District Watershed Development Unit- Porbandar
64
(Member/ Secretary) Vyas Arti N. F √ CRD Member Bhogesara Nagajan U. M √ √ 8
(Member) Bhogesara Motiben A.. F √ √ 5 (Member) Bhogesara Puriben K. F √ √ 3 (Member) Bhogesara Karsanbhai
R. M √ √ 5 (Member) Bhogesara Nagabhai R. M √ √ 5 (Member) Bhogesara Lilabhai A. M √ √ 3 (Member) Chavda Govindbhai S. M √ √ √ 4 (Member) Chavda Labhuben G. F √ √ √ 2 (Member) Jivtiben Keshubhai F √ √ 7
3
Jam
ra W
ater
shed
Com
mitt
ee
Und
er P
rogr
ess
(President) Karangiya Vejiben P. M √ √ √ 5 (Secretary) Karangiya Hardasbhai
N. M √ √ 12
(Member/ Secretary) Vyas Arti N. F √ CRD Member Karangiya Nanduben M. F √ √ 5
(Member) Karangiya Manjuben V.. F √ √ 7 (Member) Vala Pala V. M √ √ 4 (Member) Vadoliya Sarmanbhai B. M √ √ 7
District Watershed Development Unit- Porbandar
65
(Member) Vadoliya Nathabhai U. M √ √ 6 (Member) Karangiya Maniben B. F √ √ 2 (Member) Karangiya Mulubhai L. M √ √ 5 (Member) Vadoliya Sajanben K. F √ √ 0 (Member) Sisodiya Masribhai K. M √ √ 5
4
Kade
gi W
ater
shed
Com
mitt
ee
Und
er P
rogr
ess
(President) Kadegiya Keshubhai A. M √ √ √ 12 (Secretary) Kadegiya Sanganbhai M
√ √ 7 (Member/ Secretary) Vyas Arti N. F √ CRD Member Kadegiya Jivabhai R. M √ √ 6
(Member) Chauhan Rajsibhai M. M √ √ √ 5 (Member) Jadeja Chana A. M √ √ 8 (Member) Kodiyatar Gogadhbhai
M. M √ √ √ 0 (Member) Chauhan Manjuben M. F √ √ √ 0 (Member) Solanki Kamlaben J. F √ √ √ 5 (Member) Kadegiya Hiriben G. F √ √ 0 (Member) Kadegiya Satiben S. F √ √ 0
District Watershed Development Unit- Porbandar
66
(Member) Kadegiya Ramdebhai D.. M √ √ 5
5
Kotd
a W
ater
shed
Com
mitt
ee
Und
er P
rogr
ess
(President) Modha Bhimabhai S. M √ √ √ 8 (Secretary) Odedara Ramdebhai D. M
√ √ 10 (Member/ Secretary) Vyas Arti N. F √ CRD Member Odedra Alabhai M. M √ √ 2
(Member) Parmar Karshanbhai L. M √ √ 4 (Member) Modha Valiben B. F √ √ 0 (Member) Parmar Gauri K.
(Member) F √ √ √ 9 (Member) Chauhan Jivat D. M √ √ √ 0 (Member) Odedara Jayshreeben
N. F √ √ √ 9 (Member) Rabari Devabhai V. M √ √ √ 4 (Member) Timaniya Lakhmanbhai
J. M √ √ √ 4 (Member) Bambhaniya Kishorbhai
D. M √ √ 10
6
June
j W
ater
she
d C
omm
itte
Und
er
Pro
gres
s (President
) Modha Vikrambhai V. M
√
√ √ 10
Modhvadiya F √ √ 7

District Watershed Development Unit- Porbandar
67
(Secretary)
Leenaben J.
(Member/ Secretary) Vyas Arti N. F √ CRD
Member Modha Motiben A. F √ √ 7
(Member) Vadher Nathiben K. F √ √ 2
(Member) Gosai Manglaben M. F √ √ 7
(Member)
Modhvadiya Shantiben P. F √ √ 6
(Member) Modha Dudabhai A.. M √ √ 9
(Member) Parmar Nebhabhai H. M √ √ 1
(Member) Modha Lakhabhai R. M √ √ 10
(Member) Pandya Dhirajlal M. M √ √ 10
(Member) Vadher Dilipbhai A. M √ √ 8
District Watershed Development Unit- Porbandar
68
ii )Self Help Group Self Help Groups are motivated, small homogenous groups organized together through credit and thrift activities. Self help
group initiative especially for women/men help uplift their livelihood. Generally self help groups include landless and poor
women.
Before formation of the SHGs, during PRA activities, Focussed Group Discussions (FGDs) were held with the women,
which came up with the following observations:
a) Lack of proper credit facilities due to low intervention of formal financial credit institution.
b) Excessive exploitation of weaker section by money lenders
c) Lack of attitude for saving among poor people
d) Lack of knowledge on credit and thrift activity and banking.
With a detailed discussion with some of the local working in the area like Sakhi Mandal, it was planned to have some
capacity building training regarding SHG activities. It was also proposed to have some livelihood activities which will
promote women empowerment.
District Watershed Development Unit- Porbandar
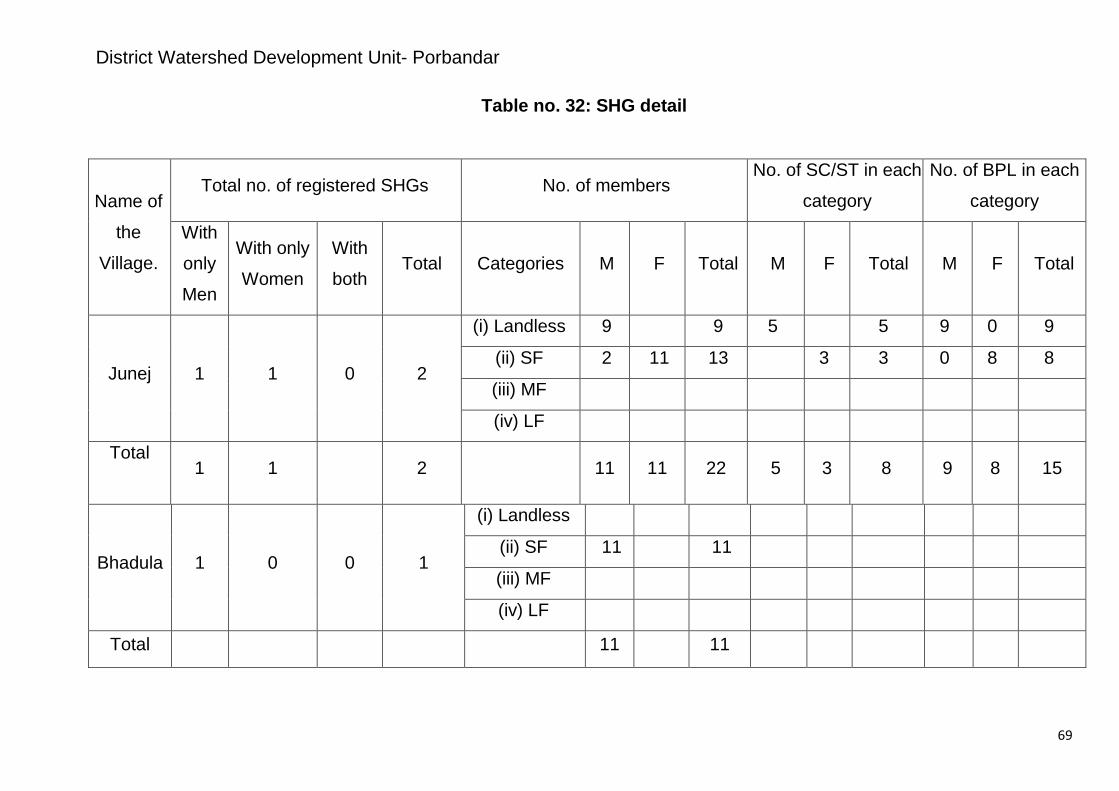
69
Table no. 32: SHG detail
Name of
the
Village.
Total no. of registered SHGs No. of members No. of SC/ST in each
category
No. of BPL in each
category
With
only
Men
With only
Women
With
both Total Categories M F Total M F Total M F Total
Junej 1 1 0 2
(i) Landless 9 9 5 5 9 0 9
(ii) SF 2 11 13 3 3 0 8 8
(iii) MF
(iv) LF
Total
1 1 2 11 11 22 5 3 8 9 8 15
Bhadula 1 0 0 1
(i) Landless
(ii) SF 11 11
(iii) MF
(iv) LF
Total 11 11

District Watershed Development Unit- Porbandar
70
Bhogsar 2 2 0 4
(i) Landless 18 8 26 11 11
(ii) SF 4 14 18
(iii) MF
(iv) LF
Total 2 2 0 4 22 22 44 11 11
Jamra 1 1 0 2
(i) Landless 5 6 11
(ii) SF 6 5 11
(iii) MF
(iv) LF
Total 11 11 22
Kadegi 2 2 1 5
(i) Landless 11 11 22 1 1 2
(ii) SF 22 11 33 17 3 20
(iii) MF
(iv) LF
Total 2 2 1 5 33 22 55 18 4 22

District Watershed Development Unit- Porbandar
71
Kotda 3 2 0 5
(i) Landless 22 24 35 11 24 35 11 0 11
(ii) SF 11 0 11
(iii) MF
(iv) LF
Total 3 2 0 5 33 24 57 11 24 35 11 0 11
District Watershed Development Unit- Porbandar
72
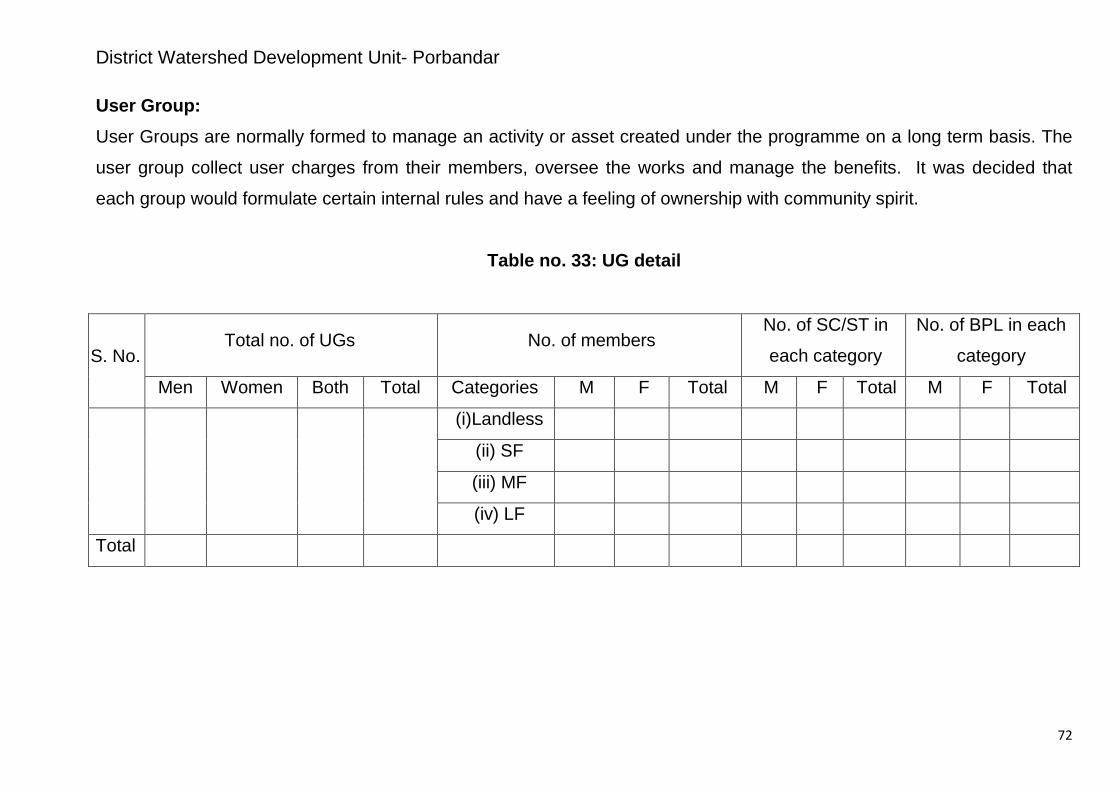
User Group: User Groups are normally formed to manage an activity or asset created under the programme on a long term basis. The
user group collect user charges from their members, oversee the works and manage the benefits. It was decided that
each group would formulate certain internal rules and have a feeling of ownership with community spirit.
Table no. 33: UG detail
S. No. Total no. of UGs No. of members
No. of SC/ST in
each category
No. of BPL in each
category
Men Women Both Total Categories M F Total M F Total M F Total
(i)Landless
(ii) SF
(iii) MF
(iv) LF
Total

District Watershed Development Unit- Porbandar
73
Table no.34: Entry point activities (EPA) (All financial figures in lakh Rs.)
S.
No.
Names of
Villages
Amount
earmarked for
EPA
Entry Point Activities planned Estimated cost Expected
outcome
1 Junej 2.38
Storage Room in Smasan,with new smashan
2.30
Roof Water Harvesting Structer (2, in School & Agnwadi) 0.60
2 Bhadula 4.49
New construction of havada
0.90
Repairing of Community well 0.52 Roof Water Harvesting Structer (2, in
School & Agnwadi, 0.60
Community roof water harvesting 0.60
R.O. filter 0.20

District Watershed Development Unit- Porbandar
74
3 BHOGSAR 2.17
Wire Fancing With Gate in GP, Agnwadi 0.37
R.O. filter in school 0.20
Roof Water Harvesting Structure in
School & Agnwadi
0.60
Recharging of Pond 1.09
4 Jamra 7.01
wire fencing with Gate in Samsan with
Gardening 0.60
Repairing Community Hall with Roof
Water Harvesting Structer 0.82
Roof Water Harvesting Structer in
School & Agnwadi 0.60
Snanghat 1.51
Hume Pipe Culvert 1.68
R.O. Plant 0.20
Havada With Slab 0.86
5 Kadegi 4.08 wire fancing with gate in Samsan with 1.45

District Watershed Development Unit- Porbandar
75
Toilet Block
Roof Water Harvesting Structer in
School & Agnwadi 0.60
R.O. filter (1) 0.20
Hume Pipe Culvert 0.71
Pond Recharging line 0.52
6 Kotda
4.10
Repairing of pump house 0.60
Repairing of community open well 0.40
Stand Post ( water tap–7 nozzle) 0.20
R.O. filter (1) 0.20
New Havada With Slab 0.86
Wire Fancing With Gate & Gardening at
aanganwadi,pump room 0.87
Community Pond Wire Fencing and Bio
Fencing 1.00
Total 24.23 - 24.78
District Watershed Development Unit- Porbandar
76
District Watershed Development Unit- Porbandar
77
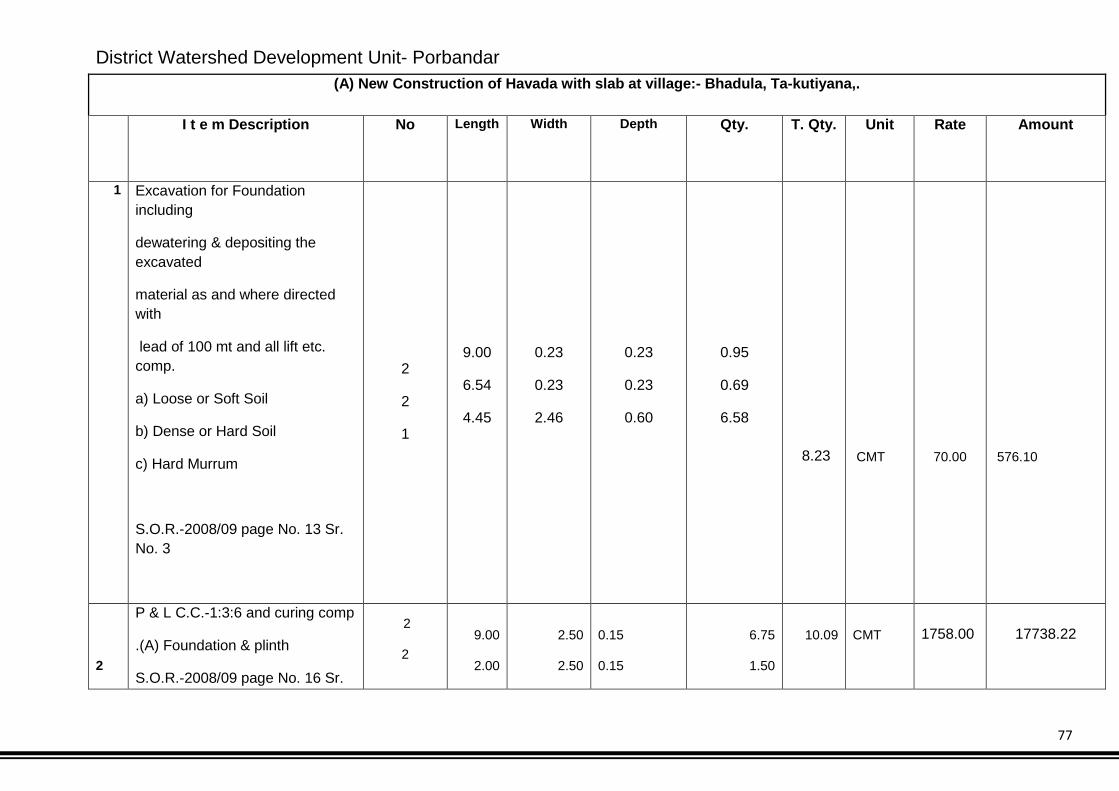
(A) New Construction of Havada with slab at village:- Bhadula, Ta-kutiyana,.
I t e m Description No Length Width Depth Qty. T. Qty. Unit Rate Amount
1 Excavation for Foundation including
dewatering & depositing the excavated
material as and where directed with
lead of 100 mt and all lift etc. comp.
a) Loose or Soft Soil
b) Dense or Hard Soil
c) Hard Murrum
S.O.R.-2008/09 page No. 13 Sr. No. 3
2
2
1
9.00
6.54
4.45
0.23
0.23
2.46
0.23
0.23
0.60
0.95
0.69
6.58
8.23
CMT
70.00
576.10
2
P & L C.C.-1:3:6 and curing comp
.(A) Foundation & plinth
S.O.R.-2008/09 page No. 16 Sr.
2
2 9.00
2.00
2.50
2.50
0.15
0.15
6.75
1.50
10.09
CMT
1758.00
17738.22

District Watershed Development Unit- Porbandar
78
No.3 1
1
4.00
4.00
2.00
2.00
0.15
0.08
1.20
0.64
3
U.C.R. masonry with hard stone of approved quality in foundation & plinth in C.M. 1:6 incl.
levelling up etc. comp. (i) C.M. 1:6
S.O.R.-2008/09 page No. 28 Sr. No. 1
1 4.46 2.46 0.45 4.94 4.94 CMT 1473.00 7276.62
4
Filling available excavated earth in trenches plinth, sides of foundation etc. comp.
S.O.R.-2008/09 page No. 14 Sr. No. 6
2
2
8.54
2.00
2.27
2.27
0.15
0.15
5.82
1.36
7.18
CMT
29.90
214.68

District Watershed Development Unit- Porbandar
79
5
White stone bela masonary block in course
in super structure in C.M. 1:6 etc. comp.
S.O.R.-2008/09 page No. 29 Sr. No. 11
0.23
0.15
4.00
1.54
1.54
9.00
6.54
4.46
2.00
0.38
0.23
0.23
0.23
0.23
0.23
0.23
0.23
0.23
2.74
2.74
1.00
1.00
0.76
0.45
0.45
0.45
0.45
0.96
0.38
1.84
0.71
0.27
1.86
1.35
0.92
0.41
8.71 CMT 2530.00 22036.30
6
P & L C.C. 1:2:4 & curing comp. for chejja,
lintel, beam, Slab etc
S.O.R.-2008/09 page No. 17 Sr. No. 11[B]
2
2
1
2
2
4.46
2.00
4.46
4.91
2.91
0.23
0.23
2.46
0.45
0.45
0.23
0.23
0.13
0.13
0.13
0.47
0.21
1.43
0.57
0.34
3.02
CMT
2524.00
7622.48
District Watershed Development Unit- Porbandar
80
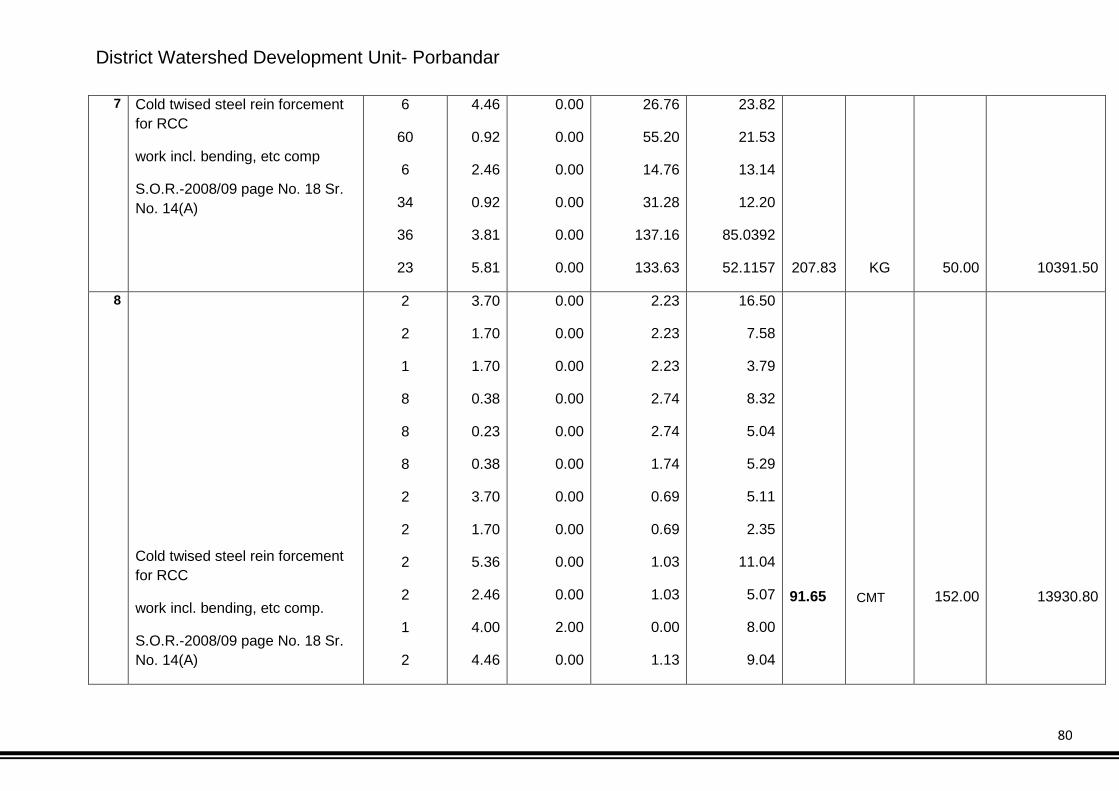
7
Cold twised steel rein forcement for RCC
work incl. bending, etc comp
S.O.R.-2008/09 page No. 18 Sr. No. 14(A)
6
60
6
34
36
23
4.46
0.92
2.46
0.92
3.81
5.81
0.00
0.00
0.00
0.00
0.00
0.00
26.76
55.20
14.76
31.28
137.16
133.63
23.82
21.53
13.14
12.20
85.0392
52.1157 207.83 KG 50.00 10391.50
8
Cold twised steel rein forcement for RCC
work incl. bending, etc comp.
S.O.R.-2008/09 page No. 18 Sr. No. 14(A)
2
2
1
8
8
8
2
2
2
2
1
2
3.70
1.70
1.70
0.38
0.23
0.38
3.70
1.70
5.36
2.46
4.00
4.46
0.00
0.00
0.00
0.00
0.00
0.00
0.00
0.00
0.00
0.00
2.00
0.00
2.23
2.23
2.23
2.74
2.74
1.74
0.69
0.69
1.03
1.03
0.00
1.13
16.50
7.58
3.79
8.32
5.04
5.29
5.11
2.35
11.04
5.07
8.00
9.04
91.65
CMT
152.00
13930.80

District Watershed Development Unit- Porbandar
81
2 2.00 0.00 1.13 4.52
9
P & L C.C. 1:2:4 laid in one layer finished
with a floating coat of a neat cement
(B) 50 mm thick
S.O.R.-2008/09 page No. 49 Sr. No. 15(B)
1
1
3.54
4.00
1.54
2.00
0.00
0.00
5.45
8.00 13.45 SMT 167.00 2246.15
10 White Washing with lime two coat to give
an even shade etc comp.
S.O.R.-2008/09 page No. 58 Sr. No. 1
8
8
8
2
2
2
2
1
2
2
0.38
0.23
0.38
3.70
1.70
5.36
2.46
4.00
4.46
2.00
0.00
0.00
0.00
0.00
0.00
0.00
0.00
2.00
0.00
0.00
2.74
2.74
1.74
0.69
0.69
1.03
1.03
0.00
1.13
1.13
8.32
5.04
5.29
5.11
2.35
11.04
5.07
8.00
9.04
4.52 63.78 SMT 3.60 229.61
District Watershed Development Unit- Porbandar
82
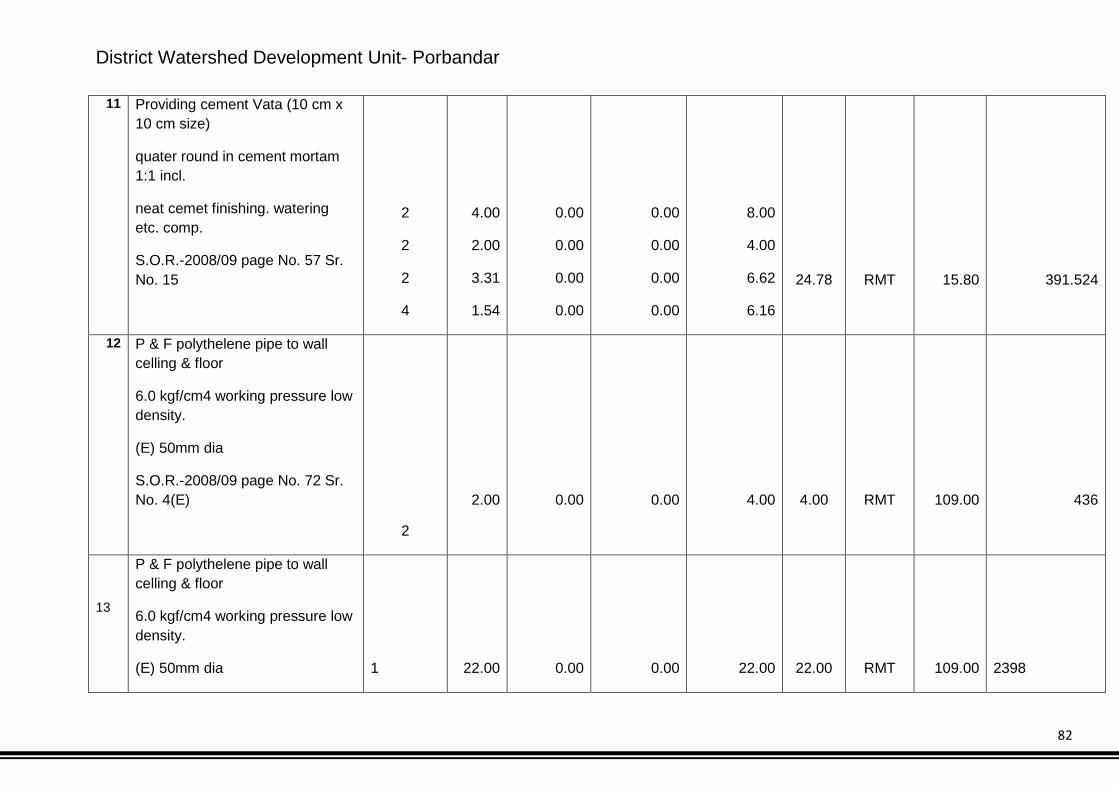
11 Providing cement Vata (10 cm x 10 cm size)
quater round in cement mortam 1:1 incl.
neat cemet finishing. watering etc. comp.
S.O.R.-2008/09 page No. 57 Sr. No. 15
2
2
2
4
4.00
2.00
3.31
1.54
0.00
0.00
0.00
0.00
0.00
0.00
0.00
0.00
8.00
4.00
6.62
6.16
24.78
RMT
15.80
391.524
12 P & F polythelene pipe to wall celling & floor
6.0 kgf/cm4 working pressure low density.
(E) 50mm dia
S.O.R.-2008/09 page No. 72 Sr. No. 4(E)
2
2.00
0.00
0.00
4.00
4.00
RMT
109.00
436
13
P & F polythelene pipe to wall celling & floor
6.0 kgf/cm4 working pressure low density.
(E) 50mm dia 1 22.00 0.00 0.00 22.00 22.00 RMT 109.00 2398

District Watershed Development Unit- Porbandar
83
S.O.R.-2008/09 page No. 72 Sr. No. 4(E)
Total Net Rs. :: >> 85487.98
Say Net Rs. :: >> 85490.00

District Watershed Development Unit- Porbandar
84
District Watershed Development Unit- Porbandar
85
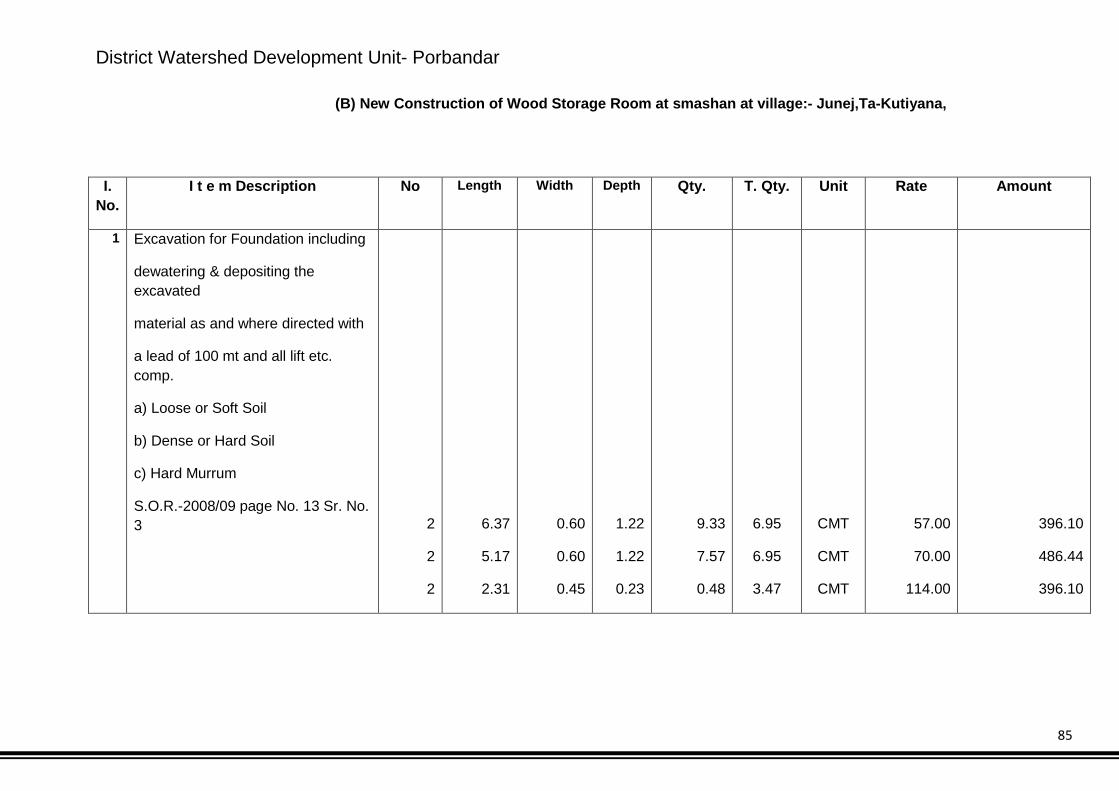
(B) New Construction of Wood Storage Room at smashan at village:- Junej,Ta-Kutiyana,
I. No.
I t e m Description No Length Width Depth Qty. T. Qty. Unit Rate Amount
1 Excavation for Foundation including
dewatering & depositing the excavated
material as and where directed with
a lead of 100 mt and all lift etc. comp.
a) Loose or Soft Soil
b) Dense or Hard Soil
c) Hard Murrum
S.O.R.-2008/09 page No. 13 Sr. No. 3
2
2
2
6.37
5.17
2.31
0.60
0.60
0.45
1.22
1.22
0.23
9.33
7.57
0.48
6.95
6.95
3.47
CMT
CMT
CMT
57.00
70.00
114.00
396.10
486.44
396.10

District Watershed Development Unit- Porbandar
86
2 S.O.R.-2008/09 page No. 16 Sr. No. 3
P & L C.C.-1:3:6 and curing comp.
(A) Foundation & plinth
2
2
2
1
6.37
5.17
2.31
5.54
0.60
0.60
0.46
5.54
0.15
0.15
0.15
0.08
1.15
0.93
0.32
2.30 4.70
CMT
1758.00
8258.82
3 U.C.R. masonry with hard stone of approved
quality in foundation & plinth in C.M. 1:6 incl.
levelling up etc. comp. (i) C.M. 1:6
S.O.R.-2008/09 page No. 28 Sr. No. 1
2
2
6.37
5.17
0.45
0.45
1.52
1.52
8.71
7.07 15.79 CMT 1473.00 23253.84
4
P & L C.C. 1:3:6 & curing comp. incl. cost
of form work in (A) walls caps/coping
S.O.R.-2008/09 page No. 16 Sr. No. 6
2
2
6.37
5.17
0.45
0.45
0.15
0.15
0.86
0.70 1.56 CMT 2256.00 3514.62

District Watershed Development Unit- Porbandar
87
5 Filling available excavated earth in trenches
plinth, sides of foundation etc. comp.
S.O.R.-2008/09 page No. 14 Sr. No. 6 1 5.54 5.54 0.30 9.21 9.21 CMT 29.90 275.30
6 White stone bela masonary block in course
in super structure in C.M. 1:6 etc. comp.
S.O.R.-2008/09 page No. 29 Sr. No. 11
4
4
4
2
2
2
2
0.46
0.23
0.46
6.00
5.54
2.31
2.31
0.23
0.23
0.23
0.23
0.23
0.45
0.23
3.20
3.20
3.20
0.60
0.60
0.15
0.15
1.35
0.68
1.35
1.66
1.53
0.31
0.16 7.04 CMT 2530.00 17815.96
7 P & L C.C. 1:2:4 & curing comp. for chejja
,
lintel, beam, Slab etc.
S.O.R.-2008/09 page No. 17 Sr. No. 11[B]
2
2
1
4
6.37
5.17
6.00
6.46
0.23
0.23
6.00
0.45
0.45
0.45
0.14
0.14
1.32
1.07
5.04
1.63 9.06 CMT 2524.00 22859.11

District Watershed Development Unit- Porbandar
88
8 Cold twised steel rein forcement for RCC
work incl. bending, etc comp.
S.O.R.-2008/09 page No. 18 Sr. No. 14(A)
4
160
42
42
168
16
6.00
0.38
6
6
0.45
6.46
0.00
0.00
0.00
0.00
0.00
0.00
24.00
60.80
252.00
252.00
75.60
103.36
14.88
23.71
156.24
156.24
46.872
40.3104 438.25 KG 50.00 21912.72
9 Providing 15 mm thick cement plaster for
interior plastering finished even & smooth
in c.m.-1:3
S.O.R.-2008/09 page No. 55 Sr. No. 2(i)
8
4
1
8
4
3.20
3.20
5.54
2.31
5.54
0.23
0.45
5.54
0.23
0.30
0.00
0.00
0.00
0.00
0.00
5.89
5.76
30.69
4.25
6.65 53.24 SMT 85.00 4525.23

District Watershed Development Unit- Porbandar
89
10 20 mm thick sandfaced cement plaster on
walls consisting of 12mm thick backing coat
of c.m. 1:3 & 8mm thick finishing coat of
c.m. 1:1
S.O.R.-2008/09 page No. 56 Sr. No. 9(i)
4
4
8
8
4
4
4
2
2
6.37
6.00
0.45
0.23
0.45
1.00
6.00
6.00
5.54
0.45
0.15
3.20
3.20
3.20
6.46
0.30
1.45
1.45
0.00
0.00
0.00
0.00
0.00
0.00
0.00
0.00
0.00
11.47
3.60
11.52
5.89
5.76
25.84
7.20
17.40
16.07 104.74 SMT 152.00 15920.48
11 P & L C.C. 1:2:4 laid in one layer finished
with a floating coat of a neat cement
(B) 50 mm thick
S.O.R.-2008/09 page No. 49 Sr. No. 15(B)
1 5.54 5.54 0.00 30.69 30.69 SMT 167.00 5125.50
12
Providing cement Vata (10 cm x 10 cm size)
quater round in cement mortam 1:1 4 5.54 0.00 0.00 22.16
22.16
RMT
15.80
350.128

District Watershed Development Unit- Porbandar
90
incl
neat cemet finishing. watering etc. comp.
S.O.R.-2008/09 page No. 57 Sr. No. 15
13 P & F polythelene pipe to wall celling & floor
6.0 kgf/cm4 working pressure low density.
E) 50mm dia
S.O.R.-2008/09 page No. 72 Sr. No. 4(E)
2 2.00 0.00 0.00 4.00 4.00 RMT 109.00 436
Total Net Rs. :: >>
125526.34
Say Net Rs. :: >>
125525/-
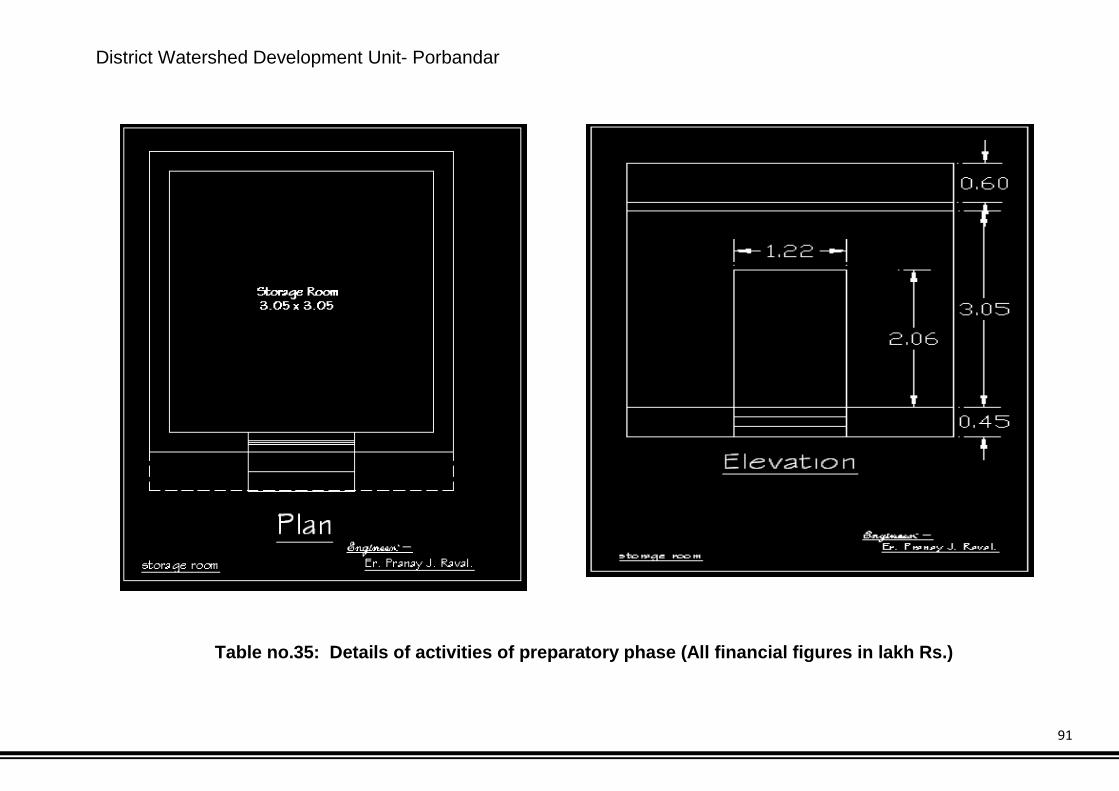
District Watershed Development Unit- Porbandar
91
Table no.35: Details of activities of preparatory phase (All financial figures in lakh Rs.)
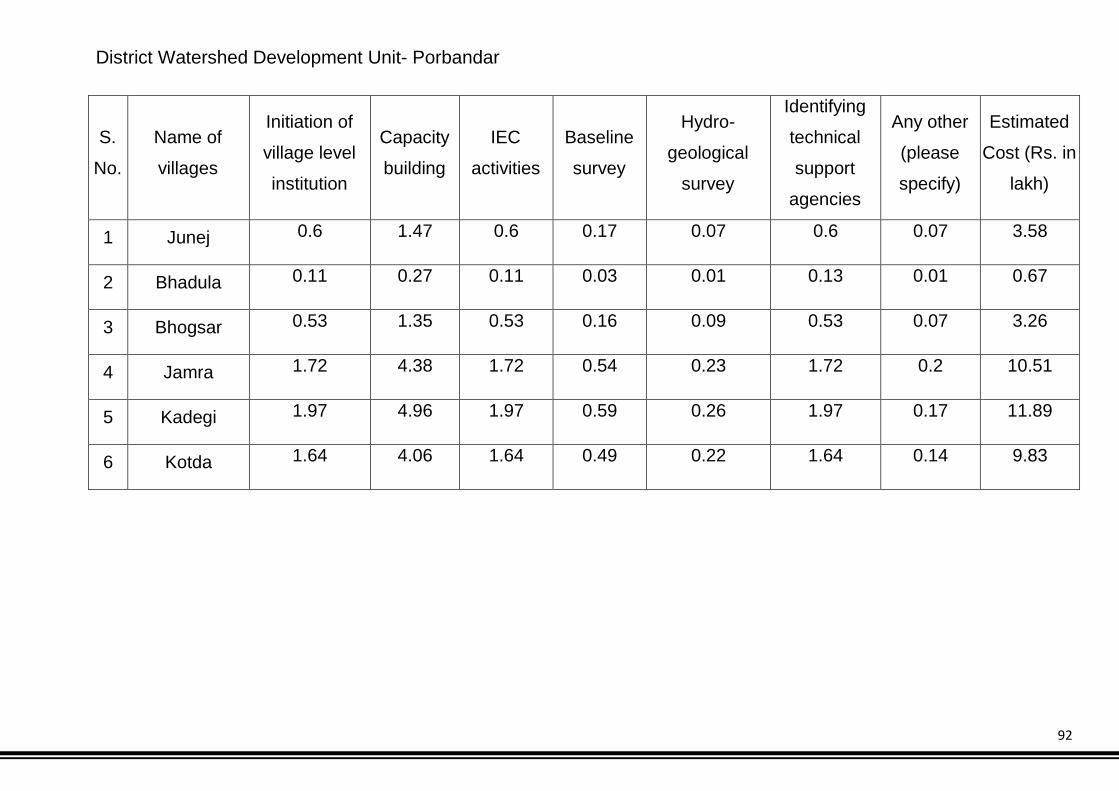
District Watershed Development Unit- Porbandar
92
S.
No.
Name of
villages
Initiation of
village level
institution
Capacity
building
IEC
activities
Baseline
survey
Hydro-
geological
survey
Identifying
technical
support
agencies
Any other
(please
specify)
Estimated
Cost (Rs. in
lakh)
1 Junej 0.6 1.47 0.6 0.17 0.07 0.6 0.07 3.58
2 Bhadula 0.11 0.27 0.11 0.03 0.01 0.13 0.01 0.67
3 Bhogsar 0.53 1.35 0.53 0.16 0.09 0.53 0.07 3.26
4 Jamra 1.72 4.38 1.72 0.54 0.23 1.72 0.2 10.51
5 Kadegi 1.97 4.96 1.97 0.59 0.26 1.97 0.17 11.89
6 Kotda 1.64 4.06 1.64 0.49 0.22 1.64 0.14 9.83

District Watershed Development Unit- Porbandar
93
Table no.36: Activities related to Surface water resources in the project areas (all financial figures in lakh Rs.)
Sl.
No.
Village
name Type of structures
Proposed target
Augmentation/ repair of
existing structures Construction of new structures Total target
No.
Area to
be
irrigated
(ha)
Storage
capacity
cmt
Estimated
cost No.
Area to
be
irrigated
(ha)
Storage
capacity
cmt
Estimated
cost
Area to
be
irrigated
(ha)
Storage
capacity
cmt
Estimated
cost
Junej
(i) New pond - - - - 1 75 14175 8.93 75 14175 8.93
(ii) Recharging of
Pond 2 54 10170 6.41 1 10 1800 1.13 64 11970 7.54
(iii) Causeway - - - - 4 33 - 3.94 33 - 3.94
(iv) New Pond 1 38 7075 5.38 38 7075 5.38
Total 2 54 10170 6.41 7 156 23050 19.38 210 33220 25.79

District Watershed Development Unit- Porbandar
94
BHADULA
(i) Deepening of
Pond 1 61 11520 7.26 1 75 14175 8.93 136 25695 16.19
(ii) Check Dam - - - - 2 86 456000 10.32 86 456000 10.32
(iii) H.P. Culvert 1 13 - 1.50 13 - 1.68
Total 1 61 11520 7.26 4 174 470175 20.75 235 481695 28.19
Bhogsar
(i) Deepening of
Pond 1 158 30000 18.90 - - - - 158 30000 18.90
(ii) Earthen bund 1 34 6400 4.03 44 8140 4.03
Total 1 158 30000 18.90 1 34 6400 4.03 202 38140 22.93

District Watershed Development Unit- Porbandar
95
JAMARA
(i) New Pond 1 61 11520 7.26 3 183 34560 21.78 244 46080 29.04
(ii) Check Dam - - - - 2 43.02 228000 10.32 43.02 228000 10.32
(iii) earthen bund 1 12.99 2475 1.56 12.99 2475 1.56
Total 1 61 11520 7.26 6 239.01 265035 33.66 300.01 276555 40.92
KADEGI
(i) New Pond 3 129.34 24338 15.52 1 236.25 45000 28.35 365.59 474338 43.87
(ii) Earthen bund 1 4.33 825 0.52 - - - - 4.33 825 0.52
(iii) Cause Way - - - - 1 5.90 - 0.71 5.90 - 0.71
(iv)Check Dam - - - - 1 43.02 228000 5.16 43.02 228000 5.16
Total 4 133.67 25163 16.04 3 312.17 273000 34.22 418.84 703163 50.26
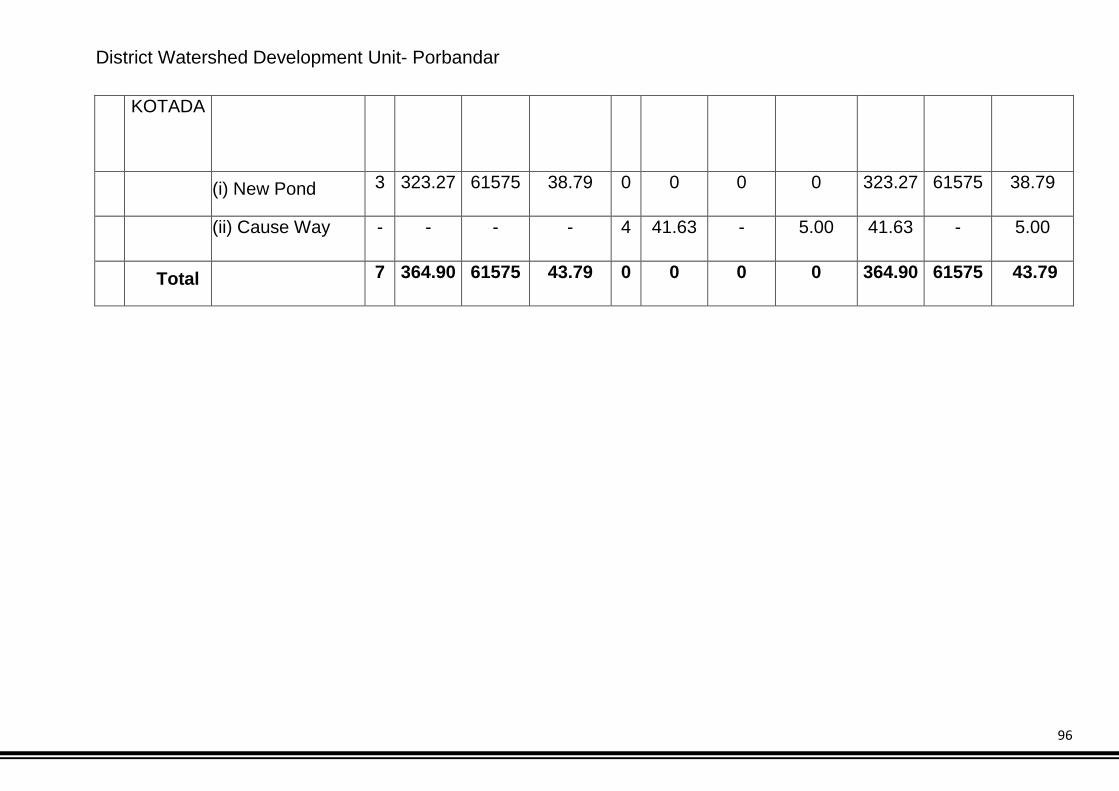
District Watershed Development Unit- Porbandar
96
KOTADA
(i) New Pond 3 323.27 61575 38.79 0 0 0 0 323.27 61575 38.79
(ii) Cause Way - - - - 4 41.63 - 5.00 41.63 - 5.00
Total 7 364.90 61575 43.79 0 0 0 0 364.90 61575 43.79

District Watershed Development Unit- Porbandar
97
EXCAVATION OF NEW POND, AT –JAMRA, TA- KUTIYANA,.
I. No.
I t e m Description No Length Width Depth Qty. T. Qty. Unit Rate Amount
1 Excavation for foundation to all soil
incliding dewatering and disposing
excavated stuff materials as and
where directed within a lead of
100.00mts. and lift up to 0.00 mts
to 1.50 mts
(Loose or Soft Soil)
S.O.R.-2008/09 page No. 13 Sr. No. 1( A )
1 180.00 32.00 2.00
1
1
1
4608
4608
2304
CMT
CMT
CMT
47.00
60.00
101.00
216576
276480
232704
Excavation in Loose or Soft Soil 40% of Total 4608
Excavation in Dense or Hard Soil 40% of Total
4608
Excavation in Hard -Murrum 20% of Total 2304
Total Net Rs. 725760

District Watershed Development Unit- Porbandar
98
EXCAVATION OF PAAT VARU POND, AT –KOTDA, TA- KUTIYANA,.
I. No. I t e m Description No Length Width Depth Qty. T. Qty. Unit Rate Amount
1 Excavation for foundation to all soil
incliding dewatering and disposing
excavated stuff materials as and
where directed within a lead of
100.00mts. and lift up to 0.00 mts.
to 1.50 mts
(Loose or Soft Soil)
S.O.R.-2008/09 page No. 13 Sr. No. 1( A )
1 125.00 160.00 1.50
1
1
1
12000
12000
6000
CMT
CMT
CMT
47.00
60.00
101.00
564000
720000
606000
Excavation in Loose or Soft Soil 40% of Total
12000
Excavation in Dense or Hard Soil 40% of Total 12000
Excavation in Hard -Murrum 20% of Total 6000
Total Net Rs.
1890000
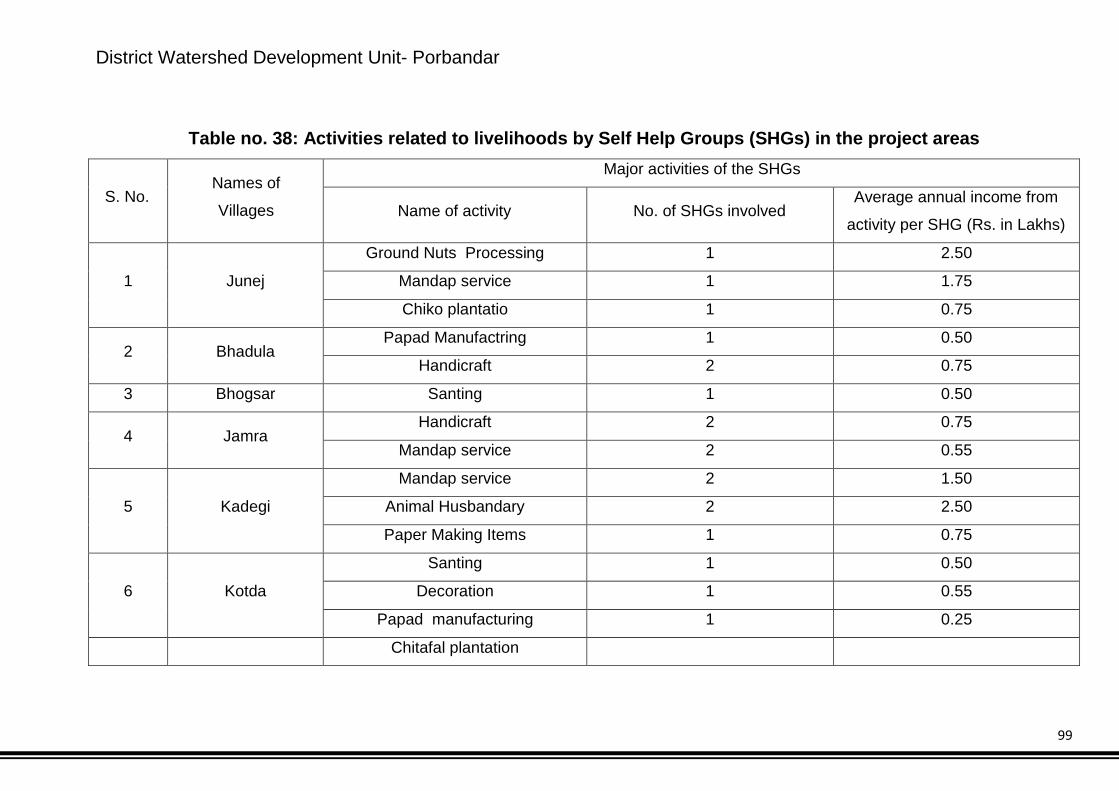
District Watershed Development Unit- Porbandar
99
Table no. 38: Activities related to livelihoods by Self Help Groups (SHGs) in the project areas
S. No. Names of
Villages
Major activities of the SHGs
Name of activity No. of SHGs involved Average annual income from
activity per SHG (Rs. in Lakhs)
1 Junej
Ground Nuts Processing 1 2.50
Mandap service 1 1.75
Chiko plantatio 1 0.75
2 Bhadula Papad Manufactring 1 0.50
Handicraft 2 0.75
3 Bhogsar Santing 1 0.50
4 Jamra Handicraft 2 0.75
Mandap service 2 0.55
5 Kadegi
Mandap service 2 1.50
Animal Husbandary 2 2.50
Paper Making Items 1 0.75
6 Kotda
Santing 1 0.50
Decoration 1 0.55
Papad manufacturing 1 0.25
Chitafal plantation
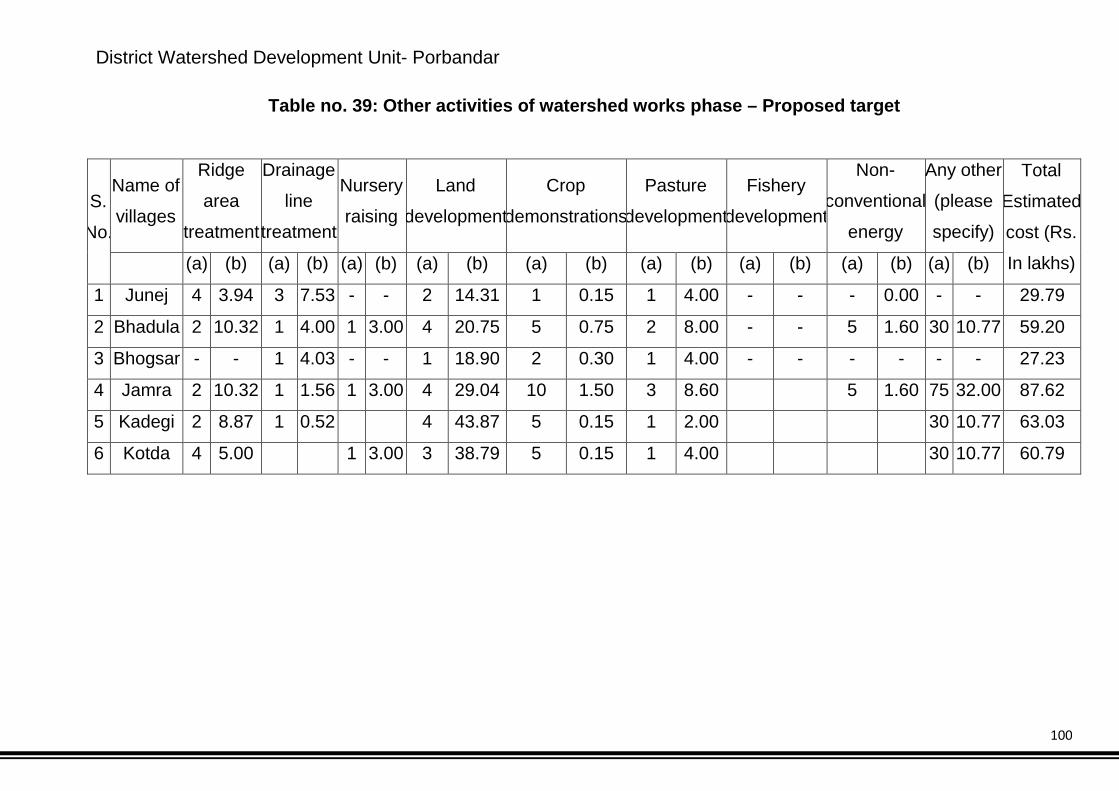
District Watershed Development Unit- Porbandar
100
Table no. 39: Other activities of watershed works phase – Proposed target
S.
No.
Name of
villages
Ridge
area
treatment
Drainage
line
treatment
Nursery
raising
Land
development
Crop
demonstrations
Pasture
development
Fishery
development
Non-
conventional
energy
Any other
(please
specify)
Total
Estimated
cost (Rs.
In lakhs) (a) (b) (a) (b) (a) (b) (a) (b) (a) (b) (a) (b) (a) (b) (a) (b) (a) (b)
1 Junej 4 3.94 3 7.53 - - 2 14.31 1 0.15 1 4.00 - - - 0.00 - - 29.79
2 Bhadula 2 10.32 1 4.00 1 3.00 4 20.75 5 0.75 2 8.00 - - 5 1.60 30 10.77 59.20
3 Bhogsar - - 1 4.03 - - 1 18.90 2 0.30 1 4.00 - - - - - - 27.23
4 Jamra 2 10.32 1 1.56 1 3.00 4 29.04 10 1.50 3 8.60 5 1.60 75 32.00 87.62
5 Kadegi 2 8.87 1 0.52 4 43.87 5 0.15 1 2.00 30 10.77 63.03
6 Kotda 4 5.00 1 3.00 3 38.79 5 0.15 1 4.00 30 10.77 60.79
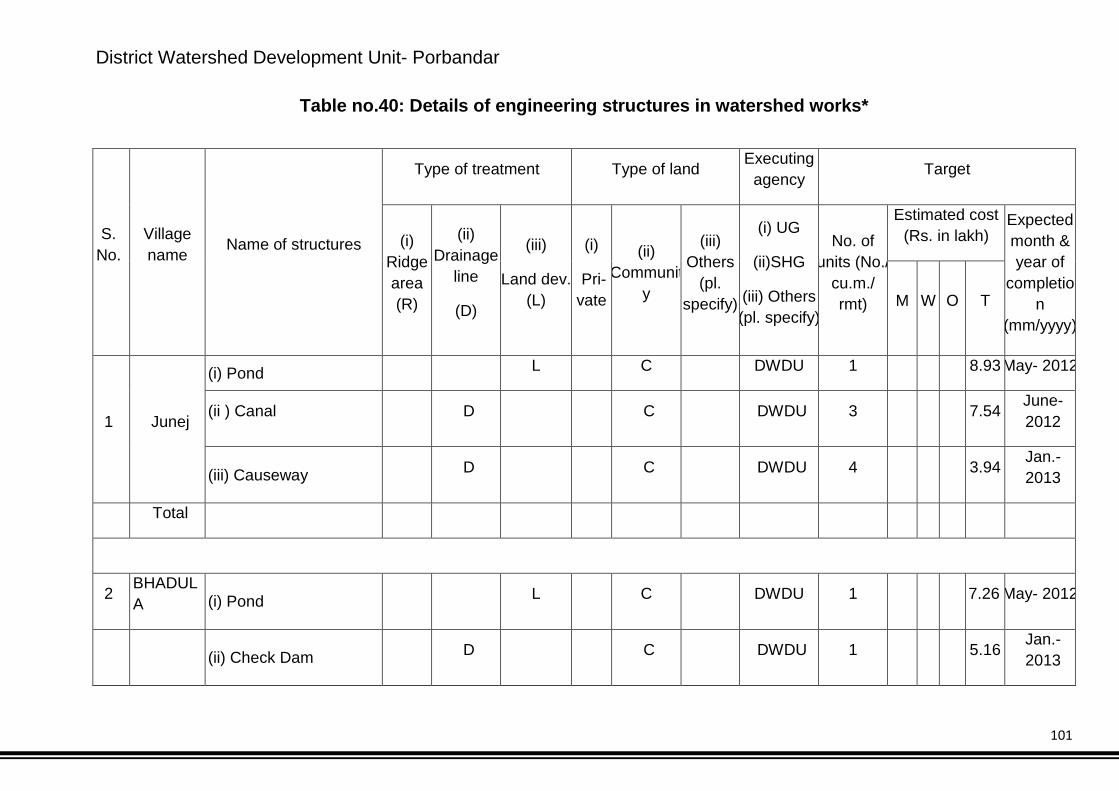
District Watershed Development Unit- Porbandar
101
Table no.40: Details of engineering structures in watershed works*
S. No.
Village name
Name of structures
Type of treatment Type of land Executing agency Target
(i) Ridge area (R)
(ii) Drainage
line
(D)
(iii)
Land dev. (L)
(i)
Pri-vate
(ii) Communit
y
(iii) Others
(pl. specify)
(i) UG
(ii)SHG
(iii) Others (pl. specify)
No. of units (No./
cu.m./ rmt)
Estimated cost (Rs. in lakh)
Expected month & year of
completion
(mm/yyyy) M W O T
1 Junej
(i) Pond L C DWDU 1 8.93 May- 2012
(ii ) Canal D C DWDU 3 7.54 June-2012
(iii) Causeway D C DWDU 4 3.94 Jan.-2013
Total
2 BHADULA (i) Pond L C DWDU 1 7.26 May- 2012
(ii) Check Dam D C DWDU 1 5.16 Jan.-2013

District Watershed Development Unit- Porbandar
102
(iii) Snanghat L C DWDU 1 1.50
Total
3 Bhogsar (i) Pond L C DWDU 1 18.90 May- 2012
(ii) Canal D C DWDU 2 5.12 Jan.-2013
Any others (pl. specify)
Total
4 jamara (i) Pond L C DWDU 1 7.26 May- 2012
(ii) Cause way D C DWDU 1 1.68 Jan.-2013
(iii) Snanghat L C DWDU 1 1.50
Total
5 kadegi (i) Pond L C DWDU 4 May- 2012
(ii) Canal
D C DWDU 1 May-

District Watershed Development Unit- Porbandar
103
2012
(iii) Causeway D C DWDU 1 Jan.-2013
(iv) Check Dam L C DWDU 1 Jan.-2013
Any others (pl. specify)
Total
6 kotada (i) Pond L C DWDU 3 38.79 May- 2012
(iii) Causeway D C DWDU 4 5.00 Jan.-2013
Any others (pl. specify)
Total
-

District Watershed Development Unit- Porbandar
104
Table no.41: Details of activities connected with vegetative cover in watershed works
S. No.
Name of village
Name of structure/ work
Type of treatment Type of land Executing agency Target
(i) Ridge area (R)
(ii) Drainage
line
(D)
(iii) Land dev. (L)
(i) Private
(ii) Community
(iii) Others
(pl. specify)
(i) UG
(ii)SHG
(iii) Others (pl.
specify)
Area (ha)
No. of plants
Estimated cost
(Rs. in lakh)
Expected month & year of
completion (mm/ yyyy)
Bhadula Afforestation L C SHG 10 16000 4,04320
Sitaphal Plantatio L C UGS 2 500 1,25,000
Horticulture L P SHG 5 2000 1,50,000
Bhogsar Afforestation L C DWDU 5 312 90,000
Pasture Development L C SHG 1
Ha. 26000
Fruit tree plantation L P Prirvte 1.5
Ha. 60,000
Jamra Afforestation L C DWDU 5 312 90,000
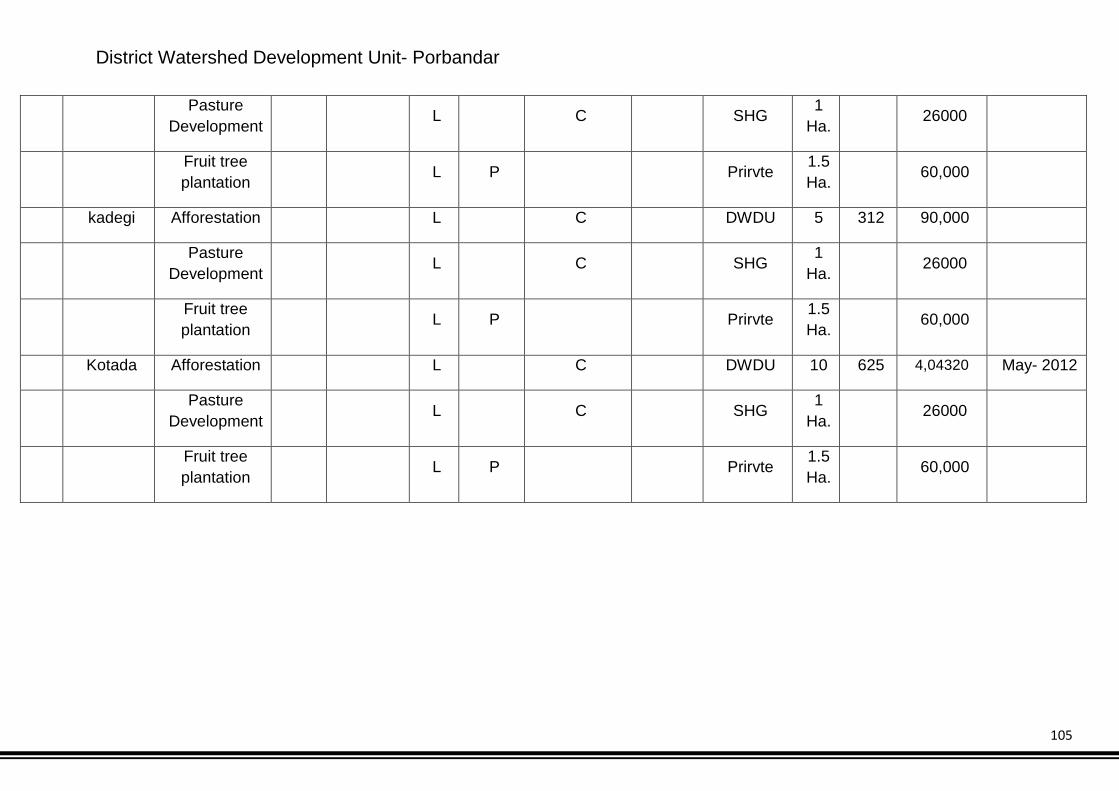
District Watershed Development Unit- Porbandar
105
Pasture Development L C SHG 1
Ha. 26000
Fruit tree plantation L P Prirvte 1.5
Ha. 60,000
kadegi Afforestation L C DWDU 5 312 90,000
Pasture Development L C SHG 1
Ha. 26000
Fruit tree plantation L P Prirvte 1.5
Ha. 60,000
Kotada Afforestation L C DWDU 10 625 4,04320 May- 2012
Pasture Development L C SHG 1
Ha. 26000
Fruit tree plantation L P Prirvte 1.5
Ha. 60,000

District Watershed Development Unit- Porbandar
106
Table no.42: Details of allied / other activities
S. No. Name of village Name of activity
Type of land Executing agency Target
(i) Private (ii) Community (iii) Others
(pl. specify)
(i) UG (ii)SHG
(iii) Others (pl. specify)
Estimated cost
(Rs. in lakh)
Expected month & year of completion
(mm/yyyy)
1 Juenj Production System & Micro Enterprise
Crop demonstration Plot P Individual 0.50
Veterinary Kit (50) P Individual 0.45
Floriculture Demo. C SHG Individual 0.25
Haybird Seeds Districbution P SHG Individual Individual Individual
0.80
Kitchen Gardening 57nos. X900 P 0.51
Tailoring Machine P Individual 0.35 Dairy development C SHG 1.35 Livelly Hood Activity Nursery Rising C SHG 0.40 Vermi Compost net house unit C SHG 0.50
Animal Husbandary (Bafflow Unit) SHG 5.40
Ground Nuts Processing SHG 2.40
Chiko plantation C UG 0.75
Total 13.71

District Watershed Development Unit- Porbandar
107
2 Bhadula Production System & Micro Enterprise
Crop demonstration Plot P Individual 1.50
Floriculture Demo. C SHG Individual 0.50 Kitchen Gardening 89 nos. X900 P Individual 0.80 Tailoring Machine P Individual 1.00 Mandap Services P SHG 1.50 Canting service C SHG 1.00 Dairy development C SHG 1.50
Leafplate & Cup Making Machine SHG 2.80
SHG Revolving Fund SHG 0.10
Veterinary Kits ( 110) Individual 1.00
Livelly Hood Activity
Nursery Rising C SHG 0.90
Vermi Compost net house unit C SHG 0.90
Animal Husbandary (Bafflow Unit) SHG 5.40
Ground Nuts Processing SHG 2.40
Sitaphal plantatio C UG 1.25 Papad Making C SHG 0.50
Roof Water Harvesting Structure C SHG 1.80
Chaff cutter 50 nos. X 2000 UG 1.00
Total 25.85

District Watershed Development Unit- Porbandar
108
3 Bhogsar Production System & Micro Enterprise
Crop demonstration Plot P Individual 0.55
Veterinary Kit (50) 0.45
Floriculture Demo. C SHG Individual 0.50 Haybird Seeds Districbution P 0.80 Kitchen Gardening 57nos. X900 P Individual 0.51 Tailoring Machine P Individual 0.35 Dairy development C SHG 1.35 Canting Material C SHG 0.93 Livelly Hood Activity
Nursery Rising C SHG 0.40
Vermi Compost net house unit C SHG 0.50
Animal Husbandary (Bafflow Unit) SHG 5.40
Chiko plantatio C UG 0.77
Total 12.51
4 Jamra Production System & Micro Enterprise
Crop demonstration Plot P Individual 1.68
Veterinary Kit (90) 0.82
Floriculture Demo. C SHG Individual 1.00 Haybird Seeds Districbution P 1.10
Kitchen Gardening 125 nos. X900 P Individual 1.13
Tailoring Machine P Individual 1.50

District Watershed Development Unit- Porbandar
109
Decoration P SHG 1.50 Santing C SHG 1.00 Dairy development C SHG 1.60
Leafplate & Cup Making Machine SHG 3.25
Lift Irrigation Equipment SHG 0.75
Farm Bunding P Individual 1.00
De-worming
P Individual 1.19
Livelly Hood Activity
Nursery Rising C SHG 1.00
Vermi Compost net house unit C SHG 2.00
Animal Husbandary (Bafflow Unit) SHG 10.80
Chiko plantatio C UG 0.90 Papad Making C SHG 0.50
Roof Water Harvesting
Structure C SHG 1.21
Chaff cutter 51 nos. X 2000 UG 1.02
Floor Mil P Individual 1.10
Snake Preparation P SHG 0.80
Individual Bio – Gas P Individual 4.00
Total 40.31

District Watershed Development Unit- Porbandar
110
5 Kadegi Production System & Micro Enterprise
Crop demonstration Plot P Individual 1.05
Veterianary Kit (50) P Individual 0.45
Floriculture Demo. C SHG Individual 0.50 Kitchen Gardening 89 nos. X900 P Individual 0.80 Tailoring Machine P Individual 1.00 Mandap Services P SHG 1.00 Santing C SHG 0.50 Dairy development C SHG 1.30
Leafplate & Cup Making Machine SHG 2.80
Livelly Hood Activity
Nursery Rising C SHG 0.90
Vermi Compost net house unit C SHG 0.90
Animal Husbandary (Bafflow Unit) SHG 5.40
Ground Nuts Processing SHG 2.40
Lamon Plantion (2 Hect.) C UG 2.70 Papad Making C SHG 0.25 SHG Revolving Fund C SHG 0.50
Chaff cutter 50 nos. X 2000 UG 1.00
Total 23.45
6 Kotda
Production System & Micro Enterprise
Crop demonstration Plot P Individual 1.50

District Watershed Development Unit- Porbandar
111
Floriculture Demo. C SHG Individual 0.50 Haybird Seeds Districbution P 0.80 Kitchen Gardening 89 nos. X900 P Individual 0.80 Tailoring Machine P Individual 1.00 Decoration P SHG 1.00 Canting Matrial C SHG 0.50 Dairy development C SHG 1.35 Leafplate & Cup Making Machine SHG 2.80
Veterinary Kit (50) C 0.45 Livelly Hood Activity Nursery Rising C SHG 0.90
Vermi Compost net house unit C SHG 2.81
Animal Husbandary (Bafflow Unit) SHG 3.40
Animal Camp / AI/ Exposure (9) Individual 3.70
Sitaphal plantation C UG 1.25 Papad Making C SHG 0.25
Chaff cutter 51 nos. X 2000 UG 1.02
Total 23.58

District Watershed Development Unit- Porbandar
112
Table no.43: Details of activities in the CPRs in the project areas
S. No. Name(s) of the villages
CPR particulars Activity proposed Target Target area under the activity
(ha) Estimated expenditure
(Rs.) Expected no. of
beneficiaries
1 Junej
West Land Pasture
Development 1 Ha. 0.26 SHG
Pond 78 Ha. 8.93 Total Villegers
2 Bhadula West Land Afforatration 10 Ha. 4.04 SHG/UG
Sitaphal Plantation 2 Ha. 1.25 SHG Pond 78 8.93 Total Villegers
3 Bhogsar
West Land Afforatration 5 Ha. 0.90 SHG Pasture
Development 1 Ha. 0.26 SHG
Pond 157.50 18.90 Total Villergers
4 Jamra
West Land Afforatration 5 Ha. 0.90 SHG Pasture
Development 1 Ha. 0.26 SHG\UG
Pond 60.50 7.26 Total Villergers
5 Kadegi
West Land Afforatration 5 Ha. 0.90 SHG Pasture
Development 1 Ha. 0.26 SHG\UG
Pond 236.25 Ha. 28.35 Total Villergers
6 Kotda
West Land Afforatration 10 Ha. 4.04 SHG\UG Pasture
Development 1 Ha. 0.26 SHG\UG
Pond 323.25 Ha. 38.79 Total Villgers

District Watershed Development Unit- Porbandar
113
Table no. 44: Capacity Building Institution:
S. No.
Name of the Training Institute
Full Address with contact no.,
website & e-mail
Type of Institute#
Area(s) of speciali-zation$
Accredita-tion details
Trainings
Reference Year No. of trainings assigned
No. of trainees to be trained
1 KVK PORBNDAR Research Institution
Agriculture, Animal
Husbandry, Horticulture
GOI 2011-2014 4 600
2 Junagadh Agriculture University
Junagadh University
Agriculture, Animal
Husbandry, Horticulture
GOI 2011-14 2 130
3 BISAG Gandhinagar Space Application
Remote Sensing &
GIS GOG 2010-2015 3 6
Table no. 45: Capacity Building plan:
S. No. Name of Project Project Stakeholders Total no. of
persons No. of persons to be
trained No. of training programmes Estimated cost
1 Kadegi
PIA 6 6 2 0.48 WDTs 5 5 2 0.38 UGs 746 55 8 12.17
SHGs 297 297 5 10.52 WCs 78 78 5 1.40 GPs 72 72 2 1.44
Community 132 132 5 3.92 Total 30.31
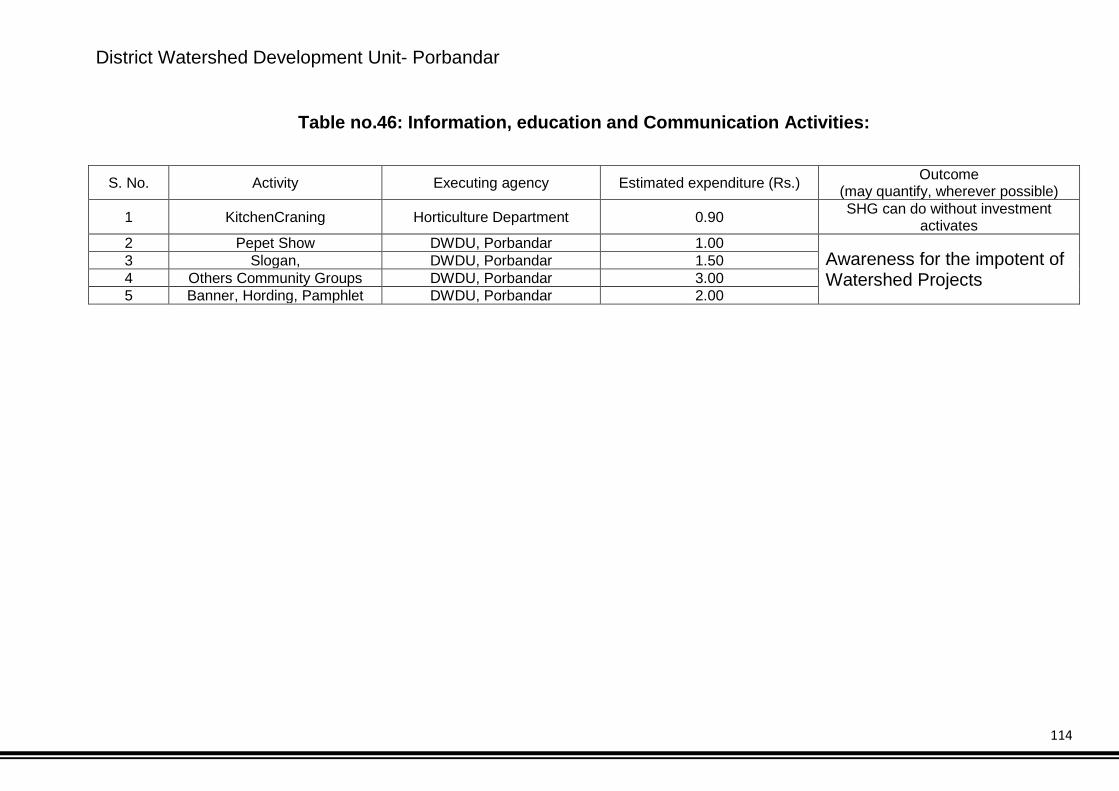
District Watershed Development Unit- Porbandar
114
Table no.46: Information, education and Communication Activities:
S. No. Activity Executing agency Estimated expenditure (Rs.) Outcome (may quantify, wherever possible)
1 KitchenCraning Horticulture Department 0.90 SHG can do without investment activates
2 Pepet Show DWDU, Porbandar 1.00 Awareness for the impotent of Watershed Projects
3 Slogan, DWDU, Porbandar 1.50 4 Others Community Groups DWDU, Porbandar 3.00 5 Banner, Hording, Pamphlet DWDU, Porbandar 2.00

District Watershed Development Unit- Porbandar
115

District Watershed Development Unit- Porbandar
116
Table no. 47: Village Wise- Activity wise Budget
Sl
no Village
Activity
EPA Institution
and CB DPR
Watershed
development
Work
Livelihood
for asset
less
Production
system and
Microenterprises
Consolidation
1 Junej 2.38 2.98 0.59 29.79 5.96. 7.74 2.97
2 Bhadula 4.49 5.61 1.12 56.20 11.23 14.61 5.62
3 Bhogsar 2.18 2.72 0.54 27.21 5.44 7.07 2.72
4 Jamra 7.01 8.76 1.75 87.62 17.52 22.78 8.76
5 Kadegi 4.08 5.10 1.02 50.99 10.20 13.24 5.10
6 Kotda 4.10 5.12 1.02 51.26 10.25 13.33 5.13

District Watershed Development Unit- Porbandar
117
Table no. 48: Budget at a Glance
No Village Project area (Ha)
Total Fund In Lakhs
Administrative costs
Monitoring
Evaluation
Entry Point
activity
Institution and
C apacity Building
Detailed Project Report
Watershed Development Works
Livelihood
activities for asset
less
Production
systems and
micro-enterpris
es
C onsolidation
phase
Total
10% 1% 1% 4% 5% 1% 50% 10% 13% 5% 100%1 J unej 496.6 59.59 5.96 0.60 0.60 2.38 2.98 0.60 29.80 5.96 7.75 2.98 59.592 Bhadula 936.6 11.24 1.12 0.11 0.11 0.45 0.56 0.11 5.62 1.12 1.46 0.56 11.243 Bhogsar 453.4 54.41 5.44 0.54 0.54 2.18 2.72 0.54 27.20 5.44 7.07 2.72 54.414 J amra 1460.4 175.25 17.52 1.75 1.75 7.01 8.76 1.75 87.62 17.52 22.78 8.76 175.255 Kadegi 1651.8 198.22 19.82 1.98 1.98 7.93 9.91 1.98 99.11 19.82 25.77 9.91 198.226 Kotda 1365.6 163.87 16.39 1.64 1.64 6.55 8.19 1.64 81.94 16.39 21.30 8.19 163.87

District Watershed Development Unit- Porbandar
118
Table no.49: Details of Convergence of IWMP with other Schemes
S. No.
Names of Departments with
Schemes converging with
IWMP
Fund made available to IWMP
due to convergence (Rs.
in lakh)
Was this fund included in Rs.12,000/
15,000 per ha.
Name of activity/task/structure undertaken with converged funds Reference no. of
activity/ task/ structure in DPR
Level at which decision for
convergence was taken Yes No
(a) Structures (b) livelihoods
(c ) Any other (pl. specify)
1 MGNREGAS 18.00 NO Structure 3 District 2 SGSY 7.50 No SHG Activites 3 District 3 DIC 1.25 No. Livelihoods 2 District 4 WASMO 12.00 Yes Structure 250 State 5 Forest Department 6.10 No Structure 600 Rmt. District

District Watershed Development Unit- Porbandar
119
District Watershed Development Unit- Porbandar
120
6.1 Expected Outcomes 6.1.1 Employment Employment has always been a problem in the village. The principal occupations of the people are dry land agriculture,
animal husbandry and casual labour work. However, rain fall being very limited and erratic, agriculture suffers, i.e. at best
they can take only a single crop, which keeps them partially engaged for about 4 months. Lack of fodder makes animal
husbandry very difficult too. So, animal husbandry does not keep them engaged full time. Thus the people mainly depend
upon casual labour, either in the village itself or outside it.
The project plans for creation of both wage employment and self employment opportunities. Wage employment would be
created by engaging people in watershed physical works like construction of earthen bunds, farm bunds, village pond,
plantation, etc. Self employment would be created by providing the people with cash support in the form of direct livelihood
activities like agriculture, animal husbandry and enterprise development.

District Watershed Development Unit- Porbandar
121
Table no. 51: Employment in Project area:
S. NO.
Names of
Villages
Wage employment Self employment No. of mandays No. of beneficiaries No. of beneficiaries
SC ST Others Women Total SC ST Others Women Total SC ST Others Women Total 1 Junej 5130 - 19980 3420 28530 57 - 222 38 317 5 - 30 12 47
2 Bhadula 6120 - 27180 2250 35550 68 - 302 25 395 8 - 26 15 59 3 Bhogsar 3600 - 19440 1620 24660 40 - 216 18 274 8 - 20 13 41 4 Jamra 5130 - 53190 2250 60570 57 - 591 25 673 10 - 74 17 101 5 Kadegi 8730 - 99720 4950 113400 97 - 1108 55 1260 7 - 166 15 188 6 Kotda 15750 - 140310 7200 163260 175 - 1559 80 1814 25 - 179 67 271

District Watershed Development Unit- Porbandar
122
6.1.2.Migration
Low rainfall results in very little fodder availability in the locality. The relatively well off farmers bring fodder from Kadegi
(approximately 100kms away) collectively; but the resource poor cannot afford it. On account of agriculture and animal
husbandry providing only part time employment for some part of the year, the people migrate for a better half of the year
for wage labour.
Employment opportunities in the local area as mentioned above will ensure lessening seasonal migration from the area.
Table no. 52: Details of seasonal migration from Project area
Sl. No. Names of villages
No. of persons migrating No. of days per year of migration
Pre-project Expected post project Pre-project Expected post project
1 Junej 58 11 90 20
2 Bhadula 140 28 90 35
3 Bhogsar 65 13 90 22
4 Jamra 250 50 90 40
5 Kadegi 245 49 90 38
6 Kotda 550 95 90 55
6.1.3 Ground water table

District Watershed Development Unit- Porbandar
123
Rainfall has been average but every year water logging & salinity problem has been increasing all the time. The ground water table thus
has depleted over the years. Presently it stands at 25 m. Proper water harvesting structures and percolation tanks would go a long way in
increasing water table depth from 25-30 m in the pre-project level to 10-15 m in the post project period. & water quality will be good as
well as pre – project time
Table no. 53: Details of average ground water table depth in the project areas (in meters)
S. No. Names of Villages Sources Pre-Project level Expected Increase/decrease (Post- Project)
1 Junej Depend upon Monsoon
25-30 mt (water Quality not good)
10-15 mt
2 Bhadula Depend upon
Monsoon
3 Bhogsar Depend upon
Monsoon
4 Jamra Depend upon
Monsoon
5 Kadegi Depend upon
Monsoon
6 Kotda Depend upon
Monsoon
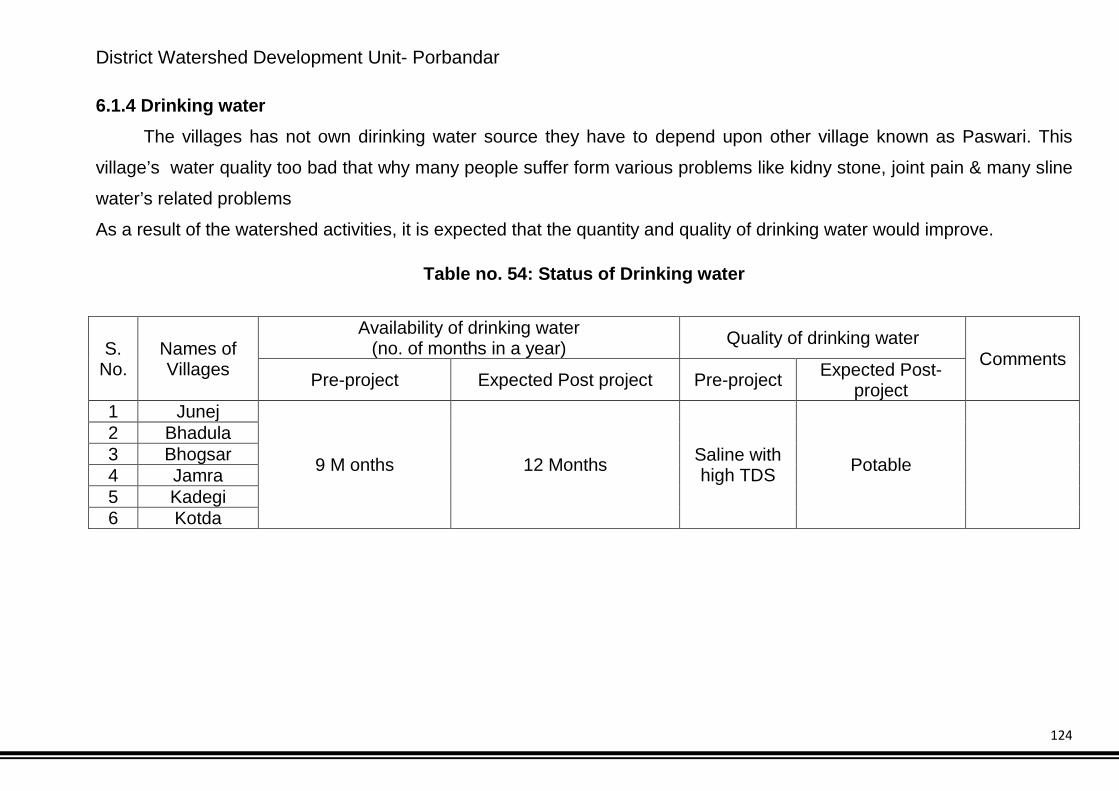
District Watershed Development Unit- Porbandar
124
6.1.4 Drinking water The villages has not own dirinking water source they have to depend upon other village known as Paswari. This
village’s water quality too bad that why many people suffer form various problems like kidny stone, joint pain & many sline
water’s related problems
As a result of the watershed activities, it is expected that the quantity and quality of drinking water would improve.
Table no. 54: Status of Drinking water
S. No.
Names of Villages
Availability of drinking water (no. of months in a year) Quality of drinking water
Comments Pre-project Expected Post project Pre-project Expected Post-
project 1 Junej
9 M onths 12 Months Saline with high TDS Potable
2 Bhadula 3 Bhogsar 4 Jamra 5 Kadegi 6 Kotda

District Watershed Development Unit- Porbandar
125
6.1.5 Crops
Agriculture primarily depends upon water; but this is what is lacking in Kadegi Project. The surface water is scanty
due to average or high rainfall and ground water is saline, which is unfit for crop production.
All this can change with the integrated land and water management during the watershed project. The planned
earthen bunds would prevent the saline water from the Sea of Arb sagar to mix with the sweet rain water and also help
percolate sweet water underground, and preserve some moisture in the soil. This will help in additional area coming under
cultivation and increasing productivity too. The farmers can take more than one season of crops. Different varieties of
crops can be taken.
Table no. 55: Details of Kharif crop area and yield in the project areas
Name of Project Name of crops
Pre-project Expected Post-project
Area (ha) Average Yield (Qtl) per ha. Area
(ha) Average Yield per ha
(qtl)
Kadegi
Kharif Ground Nut 2691.93 235.2505 270.5380
Rabi Juwar 1961.85 122.5193 142.1224 Chana 1079.51 124.9196 146.1560
Zaid - -
Project total 5733.29 482.6894 558.8164

District Watershed Development Unit- Porbandar
126
Table no. 56: Area under horticulture
S. No. Name of Village Existing area under horticulture (ha) Area under horticulture proposed to be covered through IWMP
1 Junej 0 3 2 Bhadula 0 2 3 Bhogsar 0 5 4 Jamra 0 5 5 Kadegi 0 3 6 Kotda 0 8
6.1.6 Vegetative cover There is negligible area under tree cover. The villages has no forest area . It is planned that 30 ha land to be covered
under new plantation.
Table no. 57: Forest/vegetative cover S. No. Name of Village Existing area under tree cover (ha) Area under tree cover proposed
1 Junej 0 5/28
2 Bhadula 0 5/25
3 Bhogsar 0 5/32
4 Jamra 0 5/29
5 Kadegi 0 5/35
6 Kotda 0 5/40

District Watershed Development Unit- Porbandar
127
6.1.7 Livestock
The village has quite a good of livestock population. These include cows, bullocks, buffaloes, goats, sheep and camels.
The interventions like provision of good quality cows and buffaloes, the establishment of a fodder bank and other such
related activities would spur up the dairy development in the village. It is expected that the post project period would see a
substantial increase in livestock population and yield from them.
Table no. 58: Details of livestock in the project areas (for fluids please mention in litres, for solids please mention in kgs. and income in Rs.)
S.
No.
Name of
Village Type of Animal
Pre-Project Expected Post-project Remarks
No. Yield Income No. Yield Income
1 Kadegi
Milch-animals 3524 18135 3074775 4125 25987 4085369
Draught Purpose
animals 1006 614955 1154 623455
Animals for other
purpose 1835 409970 2090 469360

District Watershed Development Unit- Porbandar
128
Table no. 59: Backward-Forward linkages
S. No. Project Type of Marketing Facility Pre-project (no.) During the project (no.) Post-project (no.)
Backward linkages Seed certification Seed supply system 1 1 Fertilizer supply system Pesticide supply system Credit institutions Bank -1 Bank - 2 Water supply Depend upon other villages Own System Extension services KVK KVK Nurseries Not available 6 Nurseries Tools/machinery suppliers Price Support system Labour Any other (please specify) Forward linkages Harvesting/threshing machinery Storage (including cold storage) Road network Transport facilities Markets / Mandis Agro and other Industries Milk and other collection centres Milk Collection Centre -1 1 Labour Any other (please specify) Vermi compost—6 6

District Watershed Development Unit- Porbandar
129
Logical Framework Analysis Components Activities Outputs Effect Impact
Village Institution Formation
Formation of Watershed Committee, User Group
One Watershed Committee each village
Number of User group depending on the coverage of particular intervention
Project can be implemented and managed in a democratic and participatory way ensuring equity.
Unity and prosperity in the village management
People’s Participation and positive perception towards the programme
Strengthening Village Institutions
Organize training and awareness programme for Village institutions
Capacity building workshops and exposure visits User Group and Watershed Committee
awareness camps to be organized.
trainings and exposure visits UGs and WCs to be held
Quality of management of common resources improved.
Quality of distribution of benefits between people improved.
Increased awareness amongst women about
Unity and prosperity in the village management.
People’s Participation and positive perception towards the programme
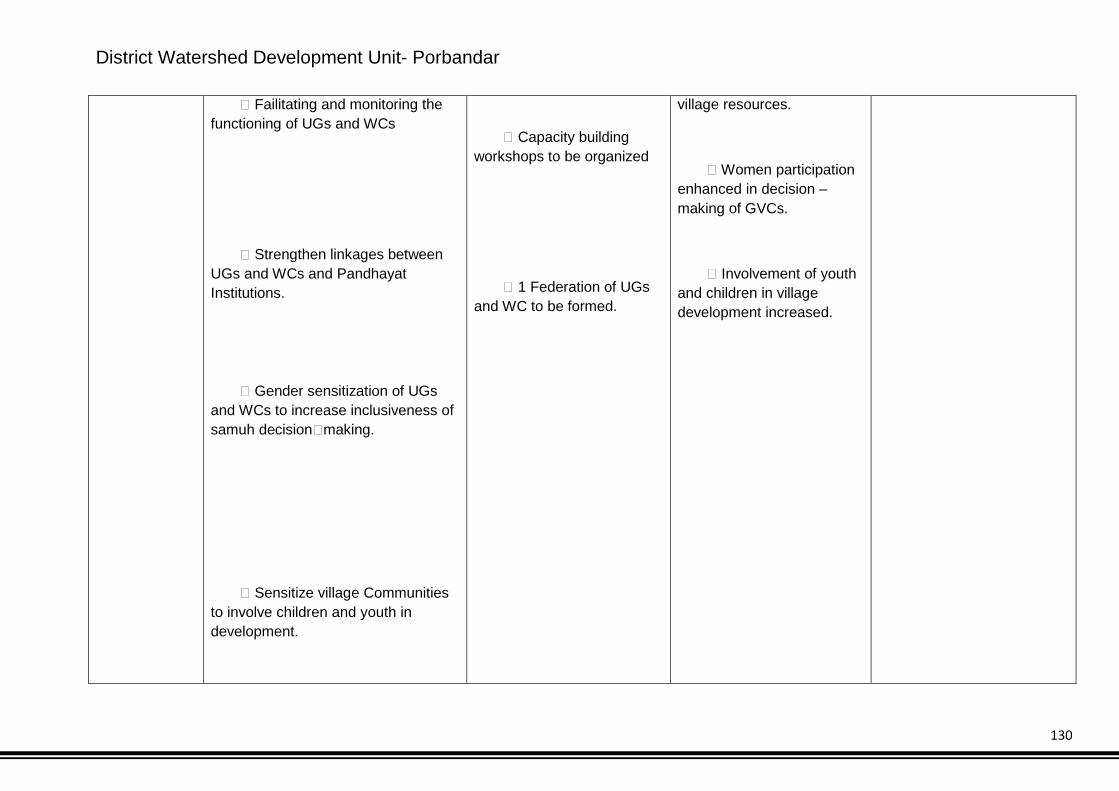
District Watershed Development Unit- Porbandar
130
Failitating and monitoring the functioning of UGs and WCs
Strengthen linkages between UGs and WCs and Pandhayat Institutions.
Gender sensitization of UGs and WCs to increase inclusiveness of samuh decisionmaking.
Sensitize village Communities to involve children and youth in development.
Capacity building workshops to be organized
1 Federation of UGs and WC to be formed.
village resources.
Women participation enhanced in decision – making of GVCs.
Involvement of youth and children in village development increased.

District Watershed Development Unit- Porbandar
131
Fund Management
Improve management and utilization of UGs and WCs.
Prepare communities to explore other sources of income for UGs and WCs.
UGs and WCs operating bank account and managing resources on their own
Purpose, frequency and volume of use of the fund enhanced.
Volume of funds generated for UGs and WCs from other sources of income increased.
Impart trainings, conduct meetings and organize exposure visits for communities, village volunteers and staff to effectively plan, execute and monitor activies
Identification and promotion of nontimber forest produce based income generatation activities
Income generation intervention promoted
Rainfed Area Development
Treatment of land through improved soil and moisture conservation practices on watershed basis
Land to be brought under improved soil moisture conservation practices
Improved productivity of treated land
Increase in proportion of households having more security of food

District Watershed Development Unit- Porbandar
132
Promotion of good agricultural practices horticulture, improved crop and vegetable
Promotion of organic farming practices
Good agricultural practices to be promoted
Organic farming to be promoted
Fodder banks to be established
Agriculture based livelihood income generation activities to be promoted
Increased availability of water in wells
Increase in annual agriculture production
Farmers adopt organic farming practices
Fodder security of farmers enhanced.
Increase in contribution of agricultural income to the household income.

District Watershed Development Unit- Porbandar
133
Formation of Fodder banks to increase fodder security and promote dairy development among communities
Identification and promotion of agriproduce based income generation activities like grading, processing and packaging.
Promotion of better Irrigation practices like drip irrigation
Impart training, conduct meetings and organize exposure visits of communities, village volunteers and staff to effectively plan, execute and monitor activities.
Water harvesting structures to be constructed
Drip Irrigation facilities to be distributed among farmers
Approx 12000 person days of employment to be generated
Trainings, exposure visits and meetings to be organized for communities, village volunteers and staff
Increase availability of water for 9 to 12 month
Increased availability of water for livestock
Availability of irrigation water established
Farmers take two crops in a year.
Increase in agricultural productivity of land
Availability of drinking

District Watershed Development Unit- Porbandar
134
water enhanced
Women’s Sociopolitical and economic empowerment
Formation & Strengthening of women’s SHG Groups
Capacity building of womenfolk
Capacity building of SHG leaders and accountants
Linking SHGs with external financial
Women’s SHG Groups to be formed
Federation of Women’s SHGs to be formed
Training to be conducted for preparation of woollen products from sheep and goats
Enhanced capacities of leaders of women’s groups in taking initiatives to solve problems at different levels.
Improved access to credit for livelihood purposes.
Increased household income.
Position of women in household, community, society (Politically, socially and economically) as perceived by women and community at large
Performance enhancement of SHGs in terms of participation, decisionmaking leadership and fund management
Equality & Equity in gender relations at home (decision making, expenditure, children’ education, health)

District Watershed Development Unit- Porbandar
135

District Watershed Development Unit- Porbandar
136
7 Quality and Sustainability Issues
7.1 Plans for Monitoring and Evaluation
A Web-based GIS System is being developed for monitoring and evaluating the project in its planning & implementation
phases. The system would be available on a public domain and can be accessed by all the stakeholders of the project.
The system shows the entire state of Gujarat and all of those areas selected over the next 18 years. Filtering allows the
user to zoom onto one particular project. Details related to soil type, Land-use classification, inhabitation etc., can be
obtained village-wise. Furthermore, survey-number wise details related to ownership, irrigation source, yield etc., can also
be accessed by the users of the system. This system is being used for pooling up the details obtained from the DPR. In
other words, the DPR is made available online in the form of a database which will help the stakeholders know areas of
importance viz., already treated areas/historical works in the area, proposed areas for treatment etc., for further treatment
and planning. The system would also show the satellite imageries of various years from the project inception stage to the
project closing stages. This allows the user to evaluate the effectiveness of the treatment and thereby plan corrective
measures for the project area. The system would serve as an aiding tool to the planners and evaluators for judging the
efficacy of the project.
District Watershed Development Unit- Porbandar
137
Yet another component of the Web-based GIS system is the Mobile based Monitoring & Evaluation System, which will help
the ground staff alias WDTs (Watershed Development Team) to transmit information from the ground level to the central
server. Also, any higher-up official in charge of the project can obtain information regarding the project area on their mobile
phone by means of an SMS. The system works in the following manner. The WDT equipped with a GPS instrument marks
the latitude-longitude information of various treatment areas during the DPR. The probable sites are then transferred onto
the central server. During the works phase, any progress in the treatment areas is reported to the server by means of an
SMS by the WDT. Similarly, any nodal officer or higher-up official can view the progress in a project by means of
summarized reports generated over frequent periods of time.
7.2 Plans for Project management:
The Project management of any watershed programme is very important. It mainly depends upon the community
organisation and the village level institutes. In Kansabad project, watershed committee, various user groups and SHGs
have been formulated for post project operation and maintenance of assets created during project period. Major emphasis
will be on equity and sustainable benefit of the project even after implementation stage. A proper link-up will be built during
project period with various institutes and capacity building organisation. They will act as a major kingpin during post
implementation for scaling up the successful experience during project.

District Watershed Development Unit- Porbandar
138
7.3 Watershed Development Fund:
The major source of financial assistance after post implementation period is watershed Development Fund. The
contribution of it will comes mainly fund the following:
7.4 User Charges:
Various user groups will be formed in village. These user groups will collect user charges according to the designated rules
formed during the formation of user group. These funds will be transferred to the WDF funds as per these formulated rules.
The secretary of watershed committee (WC) shall maintain the records of the following.
District Watershed Development Unit- Porbandar
139

District Watershed Development Unit- Porbandar
140
Micro Watershed Map of Porbandar District

District Watershed Development Unit- Porbandar
141
Priority Map Of Porbandar District

District Watershed Development Unit- Porbandar
142
Baseline Map Of IWMP-1 Cluster Project Porbandar District
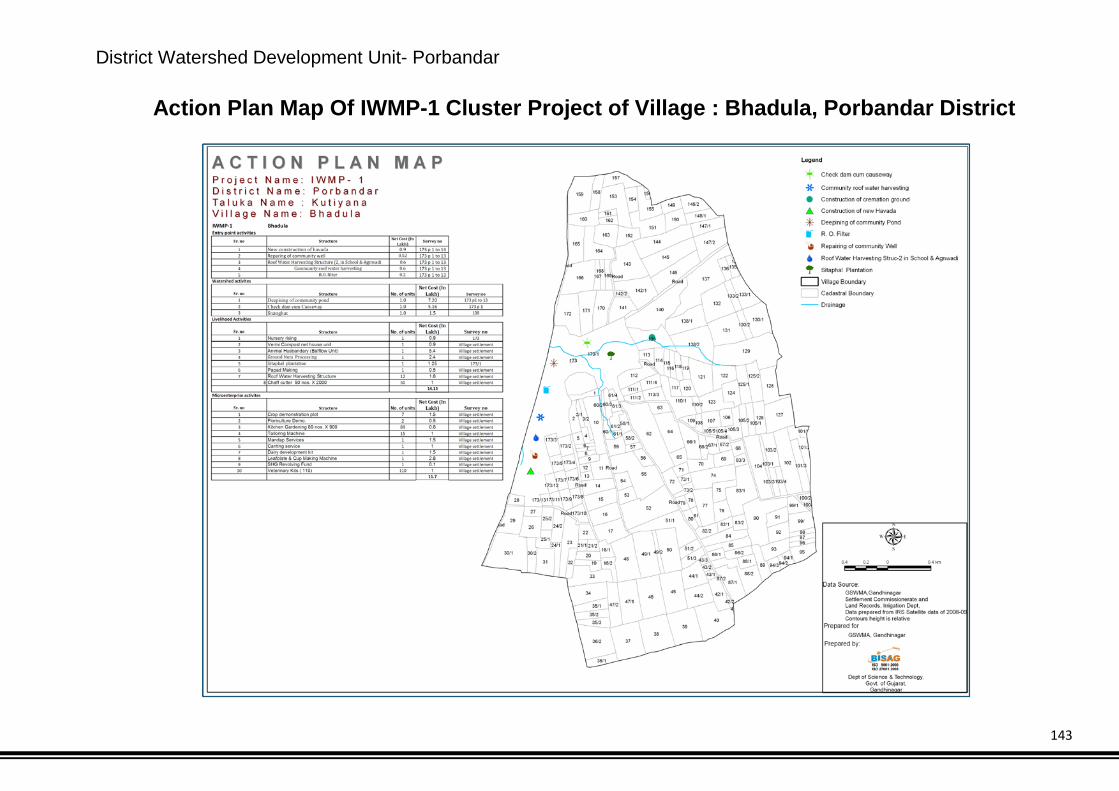
District Watershed Development Unit- Porbandar
143
Action Plan Map Of IWMP-1 Cluster Project of Village : Bhadula, Porbandar District

District Watershed Development Unit- Porbandar
144
Action Plan Map Of IWMP-1 Cluster Project of Village : Bhogsar, Porbandar District

District Watershed Development Unit- Porbandar
145
Action Plan Map Of IWMP-1 Cluster Project of Village : Jamra, Porbandar District

District Watershed Development Unit- Porbandar
146
Action Plan Map Of IWMP-1 Cluster Project of Village : Junej, Porbandar District

District Watershed Development Unit- Porbandar
147
Action Plan Map Of IWMP-1 Cluster Project of Village : Kadegi, Porbandar District

District Watershed Development Unit- Porbandar
148
Action Plan Map Of IWMP-1 Cluster Project of Village : Kotda, Porbandar District
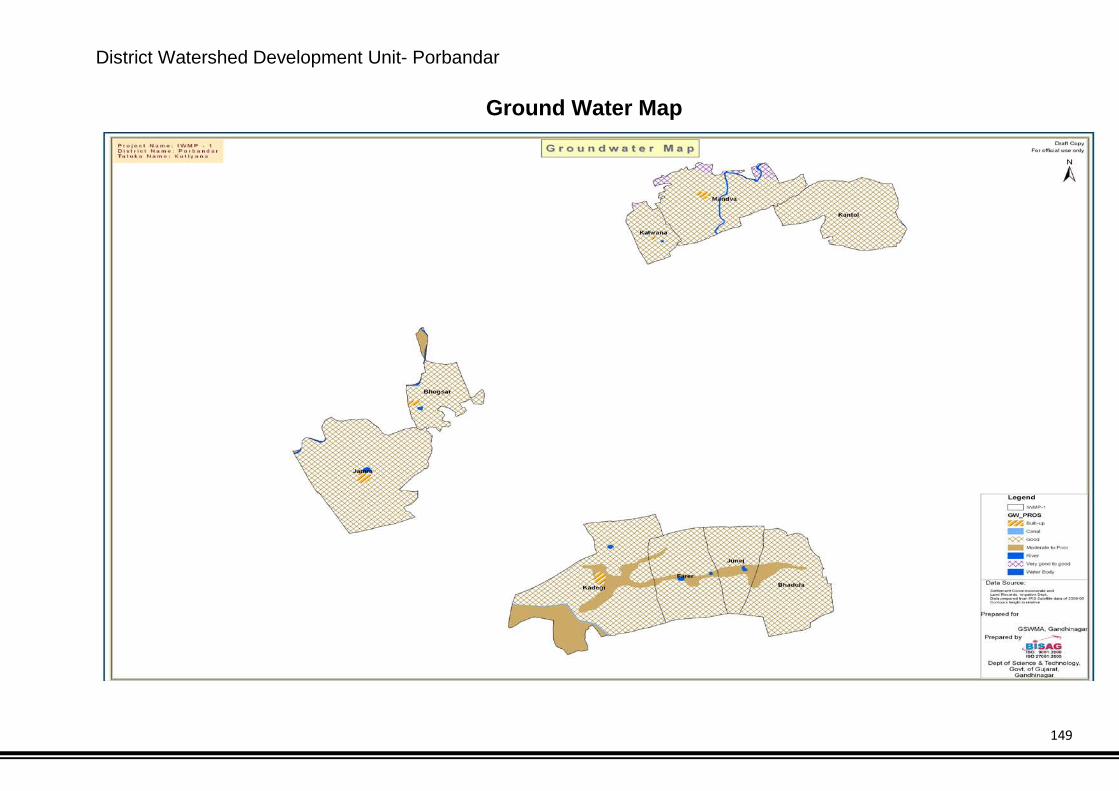
District Watershed Development Unit- Porbandar
149
Ground Water Map

District Watershed Development Unit- Porbandar
150
Landuse Map

District Watershed Development Unit- Porbandar
151
River Waterbody Map

District Watershed Development Unit- Porbandar
152
Slop Map

District Watershed Development Unit- Porbandar
153
Soil Map


