Page 1
SSSeeepppttteeemmmbbbeeerrr 222000111444
AAA MMMooonnnttthhhlllyyy SSStttaaatttiiissstttiiicccaaalll BBBuuulllllleeetttiiinnn
SSSuuurrrgggeee RRReeessseeeaaarrrccchhh SSSuuuppppppooorrrttt wwwwwwwww...eeecccooofffiiinnn---sssuuurrrgggeee...cccooo...iiinnn
Page 2
E-UpDates September 2014 Surge Research Support
2
Contents Page
1. Important Rates to Remember ………… 3
2. Indian Economy — Growth Indicators ………… 4
3. Indian Economy — Price Indicators ………… 6
4. Indian Economy — Banking Indicators ………… 7
5. Indian Economy — Exchange Rates ………… 9
6. Indian Economy — Interest Rates ………… 11
7. Indian Economy — Stock Markets ………… 14
8. Indian Economy — Capital Flows ………… 17
9. Indian Economy — Commodity Markets ………… 20
10. Global Economy — Economic Indicators ………… 22
11. Global Economy — Stock Indices ………… 23
12. Global Economy — Commodity Indices ………… 24
Special Feature—Highlights of the
Union Budget 2014-15 25
www.ecofin-surge.co.in
Table of Contents
Page 3
E-UpDates September 2014 Surge Research Support
3
2014-15* 5.70% Jun-14 3.40%
2013-14* 4.70% Jun-13 -1.80%*Q1 (April-June) Base : 2004-05=100.
As on 28-Aug-14 30-Aug-13 As on 28-Aug-14 30-Aug-13
Repo rate 8.00% 7.25% CRR 4.00% 4.00%
Reverse repo 7.00% 6.25% Base Rate 10.00-10.25% 9.70-10.25%
MSF rate 9.00% 10.25% CMR 6.00-8.85% 7.25-10.40%
Inflation CPI-C CFPI-C WPI
Jul-14 7.96% 9.36% 5.19% Aug-14 100.1
Jul-13 9.64% 11.22% 5.85% Aug-13 108.1
US$ per barrel
August
52.4 28-Aug-14 60.47
50.6 30-Aug-13 66.57
RBI Reference rate
For global rates visit: http://www.ecofin-surge.co.in/publications.html
For explanations visit: http://www.ecofin-surge.co.in/terminology.html
HSBC Markit Services PMI
GDP IIP
Oil Price (World Average)
$/Rupee RatePurchasing Managers Index
HSBC Markit Mnfg. PMI
Page 4
E-UpDates September 2014 Surge Research Support
4
GDP Growth Rates Q1 Q2 Q3 Q4 FY
2014-15 5.7
2013-14 4.7 5.2 4.6 4.6 4.7 (PE)
1 Agriculture, Forestry & Fishing
1,92,115 3.8 2,14,165 6.3
2 Mining & Quarrying
26,016 2.1 29,790 -0.4
3 Manufacturing 2,13,470 3.5 2,28,835 -1.4
4 Electricity, Gas & Water Supply29,763 10.2 27,560 7.2
5 Construction1,07,779 4.8 1,14,652 0.7
6 Trade, Hotels, Transport &
Communication3,64,809 2.8 4,14,683 3.9
7 Financing, Insurance, Real Estate &
Business Services 3,18,614 10.4 3,06,489 12.4
8 Community, Social & Personal
Services 1,85,922 9.1 2,02,205 3.3
9 GDP at factor cost
(1 to 8)
10 Government final consumption
expenditure1,87,377 12.4 1,77,432 10.3
11 Private final consumption
expenditure9,34,995 61.7 9,78,452 57.0
12 Gross fixed capital formation4,95,725 32.7 5,35,622 31.2
13 Changes in stocks 26,718 1.8 28,907 1.7
14 Valuables 14,993 1.0 34,421 2.0
15 Exports3,92,044 25.9 4,25,446 24.8
16 Less Imports 4,90,435 32.4 4,90,925 28.6
17 Discrepancies -45,391 -3.0 27,263 1.6
18 GDP at market price
(10 to 17) (9+19) 15,16,025 100.0 17,16,618 100.0
15,38,380 4.6 14,38,488 5.7
Growth Indicators
GDP
[at Constant(2004-05) prices]
2013-14
(Q4)
Rs.Crore YoY Growth/
Share in GDP
(%)
Rs.Crore 2014-15
(Q1)
YoY Growth/
Share in GDP
(%)
Page 5
E-UpDates September 2014 Surge Research Support
5
18 GDP at market price61,95,842 5.0 58,99,847 4.7
19 Net Indirect Taxes
(Less Subsidies)
454051
(229993)
8.7
(-7.1)
417736
(247444)
8.4
(13.5)
9 GDP at factor cost (18-19)57,41,791 4.7 54,82,111 4.5
20 Net factor income from abroad -67,934 -65,452
21 Gross National Income at factor
cost 56,73,857 4.7 54,16,659 4.1
(9 + 20)
22 Net national product/National
Income at factor cost (Less
Depreciation) 49,20,183 4.0 47,28,776 3.4
23 Population (in million)1233 1217
24 Per capita income (Rs.) (22/23) 39904 2.7 38856 2.1
Estimates are based on the New series of IIP. PE : Provisional Estimates; RE : Revised Estimates.
Index of Industrial Production Jun-14 Jun-13 Jun-14 FY2014-15* FY2013-14*
General Index 170.5 164.9 3.4 3.9 -1.0
1. Mining 121.5 116.5 4.3 3.2 -4.6
2. Manufacturing 178.2 175.0 1.8 3.1 -1.1
3. Electricity 181.6 157.0 15.7 11.3 3.5
*April-June.
GDP
[at Constant(2004-05) prices]
YoY Growth
(%)
2012-13
(1st RE )
Rs.CroreRs.Crore
Change (YoY, %)Index 2004-05 =100
YoY Growth
(%)
2013-14
(PE )
125.3
124.5
123.6
183.1
181.9
180.3
155.2
164.7 181.2
172.0 172.0 172.3
100
110
120
130
140
150
160
170
180
190
200
2012-13 2013-14 2014-15
IIP-Annual Averages (Base : 2004-05=100)Mining & Quarrying (141.75)
Manufacturing (755.27)
Electricity (103.16)
General Index (1000.0)
Page 6
E-UpDates September 2014 Surge Research Support
6
Wholesale Price Index
(Base: 2004-05=100)
(Inflation %)
All
Commodities
Primary
ArticlesFood Articles
Non-food
Articles
Crude
PetroleumManufactured
Products
May – 2014 181.7 (6.01) 246.8 244.3 218.8 352.2 154.6
June – 2014 182.6 (5.43) 249.9 249.7 216.4 348.8 154.9
July – 2014 184.6 (5.19) 256.6 258.6 218.1 348.8 155.4
Build up of inflation in the financial year so far is 2.38% compared to a build up of 3.17% in the corresponding period of the previous year.
Consumer Price Index
(Inflation %)
All India
General Index
(All Groups
combined)
Base
2010=100
Rural Areas
(All Groups)
Base
2010=100
Urban Areas
(All Groups)
Base
2010=100
Industrial
Workers Base
2001=100
Rural
Labourers
Base 1986-
87=100
Agricultural
Labourers
Base 1986-
87=100
May – 2014 139.9 (8.28) (F) 141.3 (8.86) (F) 138.1 (7.55) (F) 244 (7.02) 780 (8.33) 777 (8.07)
June – 2014 141.2 (7.31) (F) 142.5 (7.72) (F) 139.4 (6.82) (F) 246 (6.49) 787 (7.81) 785 (7.68)
July – 2014 143.7 (7.96) (P) 145.1 (8.45) (P) 141.1 (7.42) (P) 252 (7.23) 801 (8.10) 799 (7.97)
Price Indicators
F: Final; P: Provisional.
18
0.2
18
1.7
18
2.6
18
4.6
17
1.5
171
.6
17
2.7
17
5.4
177
.5
17
9.7
18
0.3
18
1.5
17
9.2
17
8.9
17
8.9
17
9.8
16
3.1
16
3.9
16
4.2
16
4.8
16
6.6
16
8.4
16
8.7
16
8.8
16
8.6
16
9.2
17
0.2
17
0.6
120
130
140
150
160
170
180
190
Apr May Jun Jul Aug Sep Oct Nov Dec Jan Feb Mar
WPI (Base 2004-05=100) New Series
2014-15 2013-14 2012-13
CPI Inflation – July 2014 Rural Urban Combined
Cereals & Pdcts. 8.15 5.59 7.45
Pulses & Pdcts. 5.90 5.59 5.85
Oils etc 2.53 -3.16 0.70
Egg, Meat & Fish 8.12 6.91 7.68
Milk & Pdcts. 10.54 12.49 11.26
Vegetables 19.65 11.38 16.88
Food & Beverages 9.65 8.27 9.16
Fuel & Light 5.18 3.24 4.47
Clothing etc 9.53 7.21 8.73
Page 7
E-UpDates September 2014 Surge Research Support
7
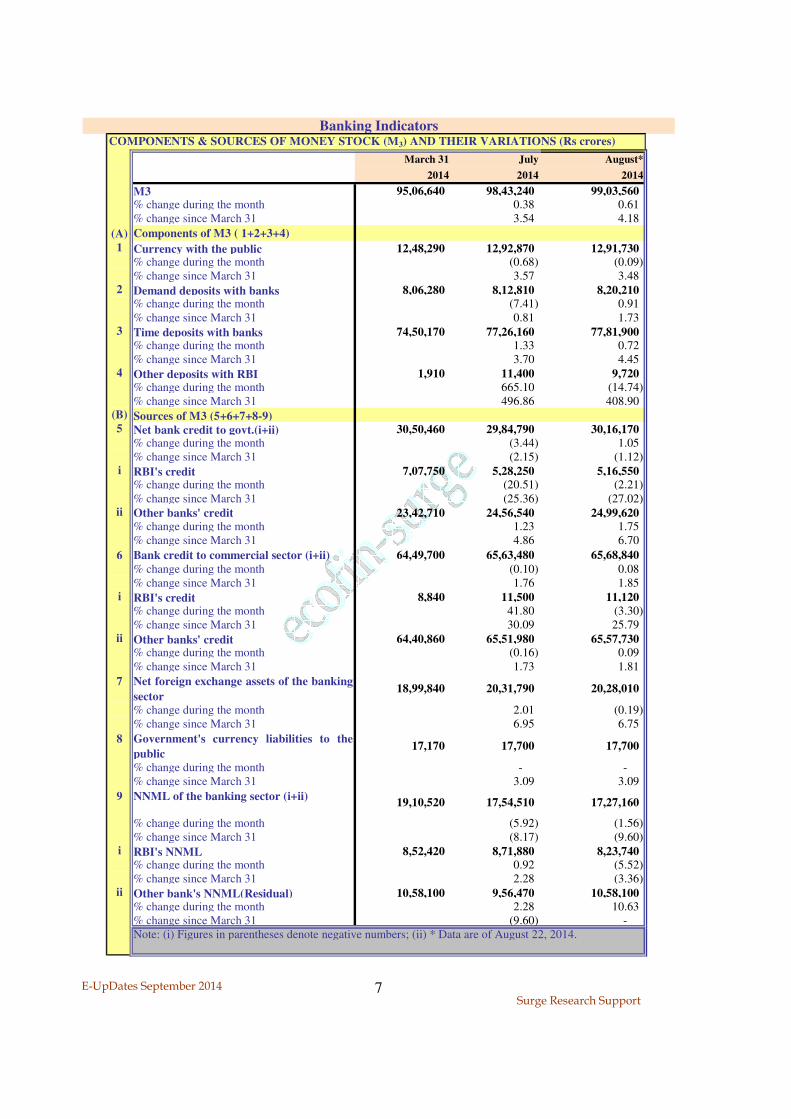
COMPONENTS & SOURCES OF MONEY STOCK (M3) AND THEIR VARIATIONS (Rs crores)
March 31 July August*
2014 2014 2014
M3 95,06,640 98,43,240 99,03,560 % change during the month 0.38 0.61 % change since March 31 3.54 4.18
(A) Components of M3 ( 1+2+3+4)1 Currency with the public 12,48,290 12,92,870 12,91,730
% change during the month (0.68) (0.09) % change since March 31 3.57 3.48
2 Demand deposits with banks 8,06,280 8,12,810 8,20,210 % change during the month (7.41) 0.91 % change since March 31 0.81 1.73
3 Time deposits with banks 74,50,170 77,26,160 77,81,900 % change during the month 1.33 0.72 % change since March 31 3.70 4.45
4 Other deposits with RBI 1,910 11,400 9,720 % change during the month 665.10 (14.74) % change since March 31 496.86 408.90
(B) Sources of M3 (5+6+7+8-9)5 Net bank credit to govt.(i+ii) 30,50,460 29,84,790 30,16,170
% change during the month (3.44) 1.05 % change since March 31 (2.15) (1.12)
i RBI's credit 7,07,750 5,28,250 5,16,550 % change during the month (20.51) (2.21) % change since March 31 (25.36) (27.02)
ii Other banks' credit 23,42,710 24,56,540 24,99,620 % change during the month 1.23 1.75 % change since March 31 4.86 6.70
6 Bank credit to commercial sector (i+ii) 64,49,700 65,63,480 65,68,840 % change during the month (0.10) 0.08 % change since March 31 1.76 1.85
i RBI's credit 8,840 11,500 11,120 % change during the month 41.80 (3.30) % change since March 31 30.09 25.79
ii Other banks' credit 64,40,860 65,51,980 65,57,730 % change during the month (0.16) 0.09 % change since March 31 1.73 1.81
7 Net foreign exchange assets of the banking
sector18,99,840 20,31,790 20,28,010
% change during the month 2.01 (0.19) % change since March 31 6.95 6.75
8 Government's currency liabilities to the
public17,170 17,700 17,700
% change during the month - - % change since March 31 3.09 3.09
9 NNML of the banking sector (i+ii)19,10,520 17,54,510 17,27,160
% change during the month (5.92) (1.56) % change since March 31 (8.17) (9.60)
i RBI's NNML 8,52,420 8,71,880 8,23,740 % change during the month 0.92 (5.52) % change since March 31 2.28 (3.36)
ii Other bank's NNML(Residual) 10,58,100 9,56,470 10,58,100 % change during the month 2.28 10.63 % change since March 31 (9.60) - Note: (i) Figures in parentheses denote negative numbers; (ii) * Data are of August 22, 2014.
Banking Indicators
Page 8
E-UpDates September 2014 Surge Research Support
8
COMPONENTS & SOURCES OF RESERVE MONEY AND THEIR VARIATIONS (Rs crore)
March 31 June August
2014 2014 2014
Reserve Money : 17,32,510 17,21,540 17,29,530
% change during the month 0.10 0.46
% change since March 31 (0.63) (0.17)
(A) Components of Reserve Money (1+2+3)1 Currency in circulation 13,00,900 13,48,480 13,38,360
% change during the month (0.78) (0.75)
% change since March 31 3.66 2.88
2 Banker's deposits with RBI 4,29,700 3,58,310 3,81,090 % change during the month (0.26) 6.36
% change since March 31 (16.61) (11.31)
3 "Other" deposits with RBI 1,910 14,750 10,090 % change during the month 889.93 (31.59)
% change since March 31 672.25 428.27
(B) Sources of Reserve Money (4+5+6+7-8)4 Net RBI credit to Government 7,07,750 5,28,250 5,35,620
% change during the month (20.51) 1.40
% change since March 31 (25.36) (24.32)
5 RBI credit to Banks & Commercial Sector
57,490 1,37,100 94,890
% change during the month 339.56 (30.79)
% change since March 31 138.48 65.05
5.1 RBI credit to banks(including NABARD) 48,650 1,25,600 82,980 % change during the month 444.19 (33.93)
% change since March 31 158.17 70.57
5.2 RBI credit to Commercial Sector 8,840 11,500 11,910 % change during the month 41.80 3.57
% change since March 31 30.09 34.73
6 Net Foreign Exchange Assets of RBI 18,02,530 19,10,360 19,08,030 % change during the month 2.14 (0.12)
% change since March 31 5.98 5.85
7 Govt's Currency Liabilities to the Public 17,170 17,700 17,700 % change during the month - -
% change since March 31 3.09 3.09
8 Net Non-monetary Liabilities of RBI 8,52,420 8,71,880 8,26,700
% change during the month 0.92 (5.18)
% change since March 31 2.28 (3.02)
Note: (i) Figures in parentheses denote negative numbers.
Page 9
E-UpDates September 2014 Surge Research Support
9
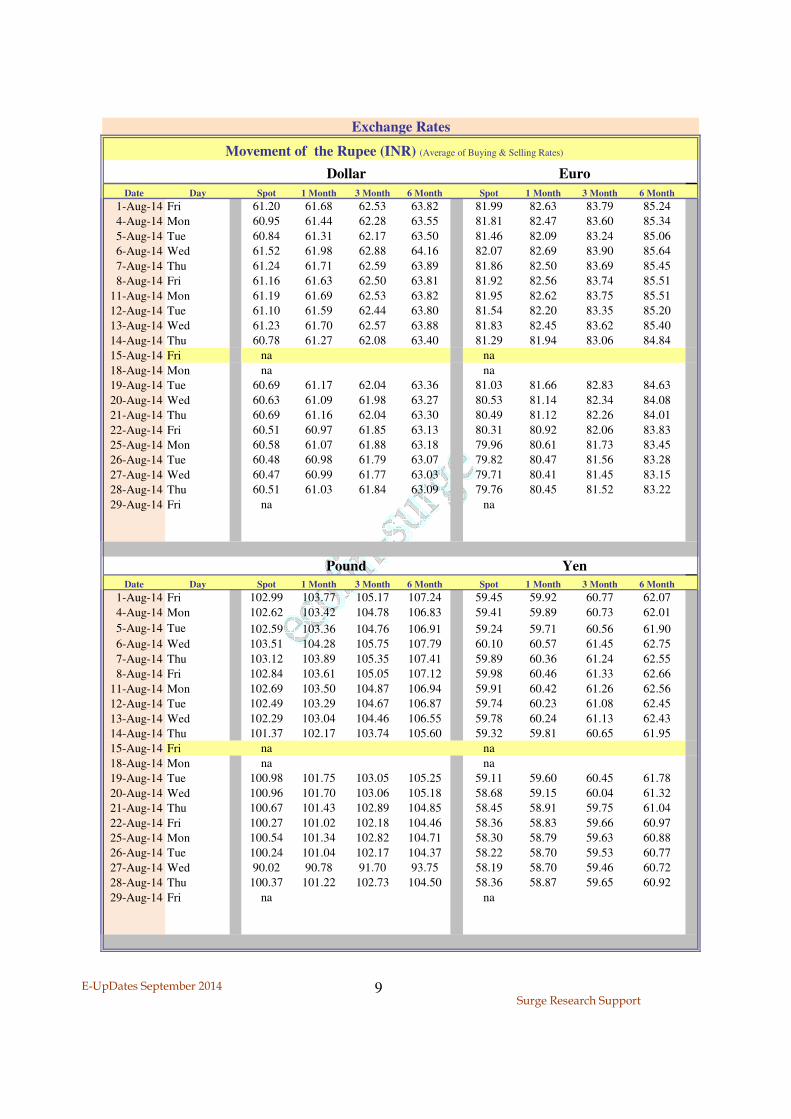
Date Day Spot 1 Month 3 Month 6 Month Spot 1 Month 3 Month 6 Month
1-Aug-14 Fri 61.20 61.68 62.53 63.82 81.99 82.63 83.79 85.24
4-Aug-14 Mon 60.95 61.44 62.28 63.55 81.81 82.47 83.60 85.34
5-Aug-14 Tue 60.84 61.31 62.17 63.50 81.46 82.09 83.24 85.06
6-Aug-14 Wed 61.52 61.98 62.88 64.16 82.07 82.69 83.90 85.64
7-Aug-14 Thu 61.24 61.71 62.59 63.89 81.86 82.50 83.69 85.45
8-Aug-14 Fri 61.16 61.63 62.50 63.81 81.92 82.56 83.74 85.51
11-Aug-14 Mon 61.19 61.69 62.53 63.82 81.95 82.62 83.75 85.51
12-Aug-14 Tue 61.10 61.59 62.44 63.80 81.54 82.20 83.35 85.20
13-Aug-14 Wed 61.23 61.70 62.57 63.88 81.83 82.45 83.62 85.40
14-Aug-14 Thu 60.78 61.27 62.08 63.40 81.29 81.94 83.06 84.84
15-Aug-14 Fri na na
18-Aug-14 Mon na na
19-Aug-14 Tue 60.69 61.17 62.04 63.36 81.03 81.66 82.83 84.63
20-Aug-14 Wed 60.63 61.09 61.98 63.27 80.53 81.14 82.34 84.08
21-Aug-14 Thu 60.69 61.16 62.04 63.30 80.49 81.12 82.26 84.01
22-Aug-14 Fri 60.51 60.97 61.85 63.13 80.31 80.92 82.06 83.83
25-Aug-14 Mon 60.58 61.07 61.88 63.18 79.96 80.61 81.73 83.45
26-Aug-14 Tue 60.48 60.98 61.79 63.07 79.82 80.47 81.56 83.28
27-Aug-14 Wed 60.47 60.99 61.77 63.03 79.71 80.41 81.45 83.15
28-Aug-14 Thu 60.51 61.03 61.84 63.09 79.76 80.45 81.52 83.22
29-Aug-14 Fri na na
Date Day Spot 1 Month 3 Month 6 Month Spot 1 Month 3 Month 6 Month
1-Aug-14 Fri 102.99 103.77 105.17 107.24 59.45 59.92 60.77 62.07
4-Aug-14 Mon 102.62 103.42 104.78 106.83 59.41 59.89 60.73 62.01
5-Aug-14 Tue 102.59 103.36 104.76 106.91 59.24 59.71 60.56 61.90
6-Aug-14 Wed 103.51 104.28 105.75 107.79 60.10 60.57 61.45 62.75
7-Aug-14 Thu 103.12 103.89 105.35 107.41 59.89 60.36 61.24 62.55
8-Aug-14 Fri 102.84 103.61 105.05 107.12 59.98 60.46 61.33 62.66
11-Aug-14 Mon 102.69 103.50 104.87 106.94 59.91 60.42 61.26 62.56
12-Aug-14 Tue 102.49 103.29 104.67 106.87 59.74 60.23 61.08 62.45
13-Aug-14 Wed 102.29 103.04 104.46 106.55 59.78 60.24 61.13 62.43
14-Aug-14 Thu 101.37 102.17 103.74 105.60 59.32 59.81 60.65 61.95
15-Aug-14 Fri na na
18-Aug-14 Mon na na
19-Aug-14 Tue 100.98 101.75 103.05 105.25 59.11 59.60 60.45 61.78
20-Aug-14 Wed 100.96 101.70 103.06 105.18 58.68 59.15 60.04 61.32
21-Aug-14 Thu 100.67 101.43 102.89 104.85 58.45 58.91 59.75 61.04
22-Aug-14 Fri 100.27 101.02 102.18 104.46 58.36 58.83 59.66 60.97
25-Aug-14 Mon 100.54 101.34 102.82 104.71 58.30 58.79 59.63 60.88
26-Aug-14 Tue 100.24 101.04 102.17 104.37 58.22 58.70 59.53 60.77
27-Aug-14 Wed 90.02 90.78 91.70 93.75 58.19 58.70 59.46 60.72
28-Aug-14 Thu 100.37 101.22 102.73 104.50 58.36 58.87 59.65 60.92
29-Aug-14 Fri na na
Exchange Rates
Movement of the Rupee (INR) (Average of Buying & Selling Rates)
Pound Yen
Dollar Euro
Page 10
E-UpDates September 2014 Surge Research Support
10
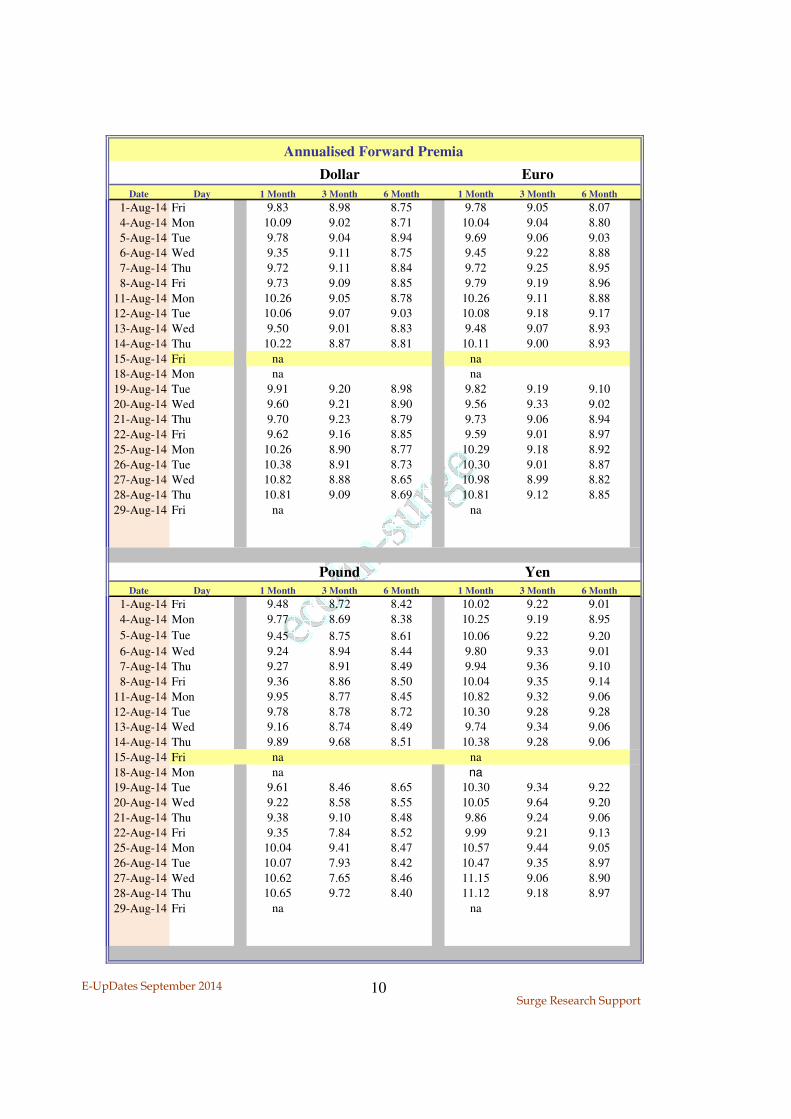
Date Day 1 Month 3 Month 6 Month 1 Month 3 Month 6 Month
1-Aug-14 Fri 9.83 8.98 8.75 9.78 9.05 8.07
4-Aug-14 Mon 10.09 9.02 8.71 10.04 9.04 8.80
5-Aug-14 Tue 9.78 9.04 8.94 9.69 9.06 9.03
6-Aug-14 Wed 9.35 9.11 8.75 9.45 9.22 8.88
7-Aug-14 Thu 9.72 9.11 8.84 9.72 9.25 8.95
8-Aug-14 Fri 9.73 9.09 8.85 9.79 9.19 8.96
11-Aug-14 Mon 10.26 9.05 8.78 10.26 9.11 8.88
12-Aug-14 Tue 10.06 9.07 9.03 10.08 9.18 9.17
13-Aug-14 Wed 9.50 9.01 8.83 9.48 9.07 8.93
14-Aug-14 Thu 10.22 8.87 8.81 10.11 9.00 8.93
15-Aug-14 Fri na na
18-Aug-14 Mon na na
19-Aug-14 Tue 9.91 9.20 8.98 9.82 9.19 9.10
20-Aug-14 Wed 9.60 9.21 8.90 9.56 9.33 9.02
21-Aug-14 Thu 9.70 9.23 8.79 9.73 9.06 8.94
22-Aug-14 Fri 9.62 9.16 8.85 9.59 9.01 8.97
25-Aug-14 Mon 10.26 8.90 8.77 10.29 9.18 8.92
26-Aug-14 Tue 10.38 8.91 8.73 10.30 9.01 8.87
27-Aug-14 Wed 10.82 8.88 8.65 10.98 8.99 8.82
28-Aug-14 Thu 10.81 9.09 8.69 10.81 9.12 8.85
29-Aug-14 Fri na na
Date Day 1 Month 3 Month 6 Month 1 Month 3 Month 6 Month
1-Aug-14 Fri 9.48 8.72 8.42 10.02 9.22 9.01
4-Aug-14 Mon 9.77 8.69 8.38 10.25 9.19 8.95
5-Aug-14 Tue 9.45 8.75 8.61 10.06 9.22 9.20
6-Aug-14 Wed 9.24 8.94 8.44 9.80 9.33 9.01
7-Aug-14 Thu 9.27 8.91 8.49 9.94 9.36 9.10
8-Aug-14 Fri 9.36 8.86 8.50 10.04 9.35 9.14
11-Aug-14 Mon 9.95 8.77 8.45 10.82 9.32 9.06
12-Aug-14 Tue 9.78 8.78 8.72 10.30 9.28 9.28
13-Aug-14 Wed 9.16 8.74 8.49 9.74 9.34 9.06
14-Aug-14 Thu 9.89 9.68 8.51 10.38 9.28 9.06
15-Aug-14 Fri na na
18-Aug-14 Mon na na
19-Aug-14 Tue 9.61 8.46 8.65 10.30 9.34 9.22
20-Aug-14 Wed 9.22 8.58 8.55 10.05 9.64 9.20
21-Aug-14 Thu 9.38 9.10 8.48 9.86 9.24 9.06
22-Aug-14 Fri 9.35 7.84 8.52 9.99 9.21 9.13
25-Aug-14 Mon 10.04 9.41 8.47 10.57 9.44 9.05
26-Aug-14 Tue 10.07 7.93 8.42 10.47 9.35 8.97
27-Aug-14 Wed 10.62 7.65 8.46 11.15 9.06 8.90
28-Aug-14 Thu 10.65 9.72 8.40 11.12 9.18 8.97
29-Aug-14 Fri na na
Dollar Euro
Annualised Forward Premia
Pound Yen
Page 11
E-UpDates September 2014 Surge Research Support
11
RBI
LAF
Net Injection(+)/
Absorption(-) of Liquidity
(Rs. billion)*
Repo Rates
(Repo/Reverse
Repo)
Over-
night
Rates
(%)
Call
Money** CBLO** Mibor USD Libor
01-Aug-14 58.1 8.00/7.00% 7.08 7.93 8.00 0.090
02-Aug-14 5.91 4.00
04-Aug-14 -248.3 7.75 7.48 8.15 0.091
05-Aug-14 -69.8 7.67 7.49 7.86 0.090
06-Aug-14 172.0 8.33 8.13 8.15 0.090
07-Aug-14 188.5 7.99 8.18 8.34 0.090
08-Aug-14 858.0 7.68 8.19 8.35 0.090
09-Aug-14 6.52 8.39
11-Aug-14 323.2 8.58 8.43 8.81 0.090
12-Aug-14 264.0 8.34 8.36 8.43 0.090
13-Aug-14 239.6 7.77 8.09 8.22 0.090
14-Aug-14 134.4 6.54 7.33 7.60 0.091
16-Aug-14 7.23 9.00
19-Aug-14 100.0 7.96 7.95 8.32 0.091
20-Aug-14 105.6 7.86 8.05 8.25 0.092
21-Aug-14 20.9 7.72 7.74 8.20 0.091
22-Aug-14 719.8 7.47 7.85 8.09 0.092
25-Aug-14 142.3 8.15 8.01 8.15 0.092
26-Aug-14 35.2 7.86 7.88 8.18 0.092
27-Aug-14 -17.2 7.71 7.93 8.02 0.092
28-Aug-14 61.9 8.00/7.00% 8.00 8.20
*Includes liquidity provided under MSF at 9.00% and Term repos; **Weighted average rates.
Money Market Rates & Liquidity
Interest Rates
0.088
0.090
0.092
0.094
5.80
6.20
6.60
7.00
7.40
7.80
8.20
8.60
9.00
1-A
ug-1
4
3-A
ug-1
4
5-A
ug-1
4
7-A
ug-1
4
9-A
ug-1
4
11-A
ug-1
4
13-A
ug-1
4
15-A
ug-1
4
17-A
ug-1
4
19-A
ug-1
4
21-A
ug-1
4
23-A
ug-1
4
25-A
ug-1
4
27-A
ug-1
4
Call Money Mibor USD Libor
Page 12
E-UpDates September 2014 Surge Research Support
12
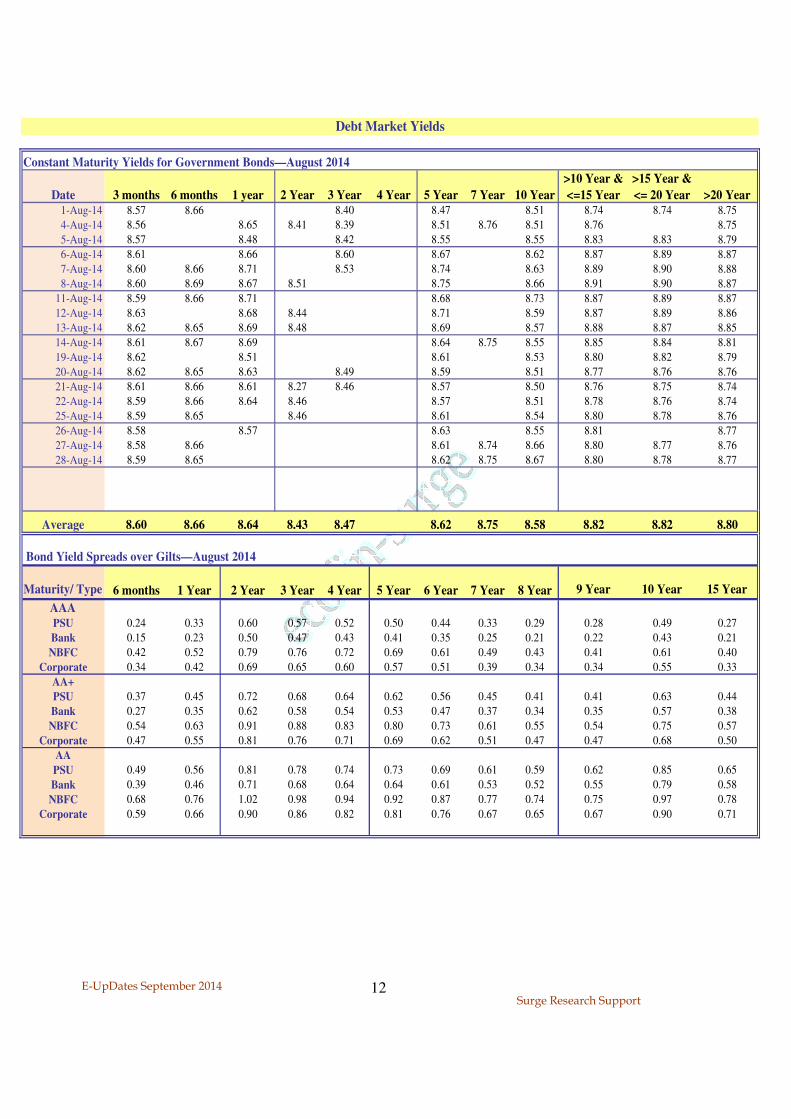
Date 3 months 6 months 1 year 2 Year 3 Year 4 Year 5 Year 7 Year 10 Year
>10 Year &
<=15 Year
>15 Year &
<= 20 Year >20 Year1-Aug-14 8.57 8.66 8.40 8.47 8.51 8.74 8.74 8.75
4-Aug-14 8.56 8.65 8.41 8.39 8.51 8.76 8.51 8.76 8.75
5-Aug-14 8.57 8.48 8.42 8.55 8.55 8.83 8.83 8.79
6-Aug-14 8.61 8.66 8.60 8.67 8.62 8.87 8.89 8.87
7-Aug-14 8.60 8.66 8.71 8.53 8.74 8.63 8.89 8.90 8.88
8-Aug-14 8.60 8.69 8.67 8.51 8.75 8.66 8.91 8.90 8.87
11-Aug-14 8.59 8.66 8.71 8.68 8.73 8.87 8.89 8.87
12-Aug-14 8.63 8.68 8.44 8.71 8.59 8.87 8.89 8.86
13-Aug-14 8.62 8.65 8.69 8.48 8.69 8.57 8.88 8.87 8.85
14-Aug-14 8.61 8.67 8.69 8.64 8.75 8.55 8.85 8.84 8.81
19-Aug-14 8.62 8.51 8.61 8.53 8.80 8.82 8.79
20-Aug-14 8.62 8.65 8.63 8.49 8.59 8.51 8.77 8.76 8.76
21-Aug-14 8.61 8.66 8.61 8.27 8.46 8.57 8.50 8.76 8.75 8.74
22-Aug-14 8.59 8.66 8.64 8.46 8.57 8.51 8.78 8.76 8.74
25-Aug-14 8.59 8.65 8.46 8.61 8.54 8.80 8.78 8.76
26-Aug-14 8.58 8.57 8.63 8.55 8.81 8.77
27-Aug-14 8.58 8.66 8.61 8.74 8.66 8.80 8.77 8.76
28-Aug-14 8.59 8.65 8.62 8.75 8.67 8.80 8.78 8.77
Average 8.60 8.66 8.64 8.43 8.47 8.62 8.75 8.58 8.82 8.82 8.80
Maturity/ Type 6 months 1 Year 2 Year 3 Year 4 Year 5 Year 6 Year 7 Year 8 Year 9 Year 10 Year 15 Year
AAAPSU 0.24 0.33 0.60 0.57 0.52 0.50 0.44 0.33 0.29 0.28 0.49 0.27
Bank 0.15 0.23 0.50 0.47 0.43 0.41 0.35 0.25 0.21 0.22 0.43 0.21
NBFC 0.42 0.52 0.79 0.76 0.72 0.69 0.61 0.49 0.43 0.41 0.61 0.40
Corporate 0.34 0.42 0.69 0.65 0.60 0.57 0.51 0.39 0.34 0.34 0.55 0.33
AA+
PSU 0.37 0.45 0.72 0.68 0.64 0.62 0.56 0.45 0.41 0.41 0.63 0.44
Bank 0.27 0.35 0.62 0.58 0.54 0.53 0.47 0.37 0.34 0.35 0.57 0.38
NBFC 0.54 0.63 0.91 0.88 0.83 0.80 0.73 0.61 0.55 0.54 0.75 0.57
Corporate 0.47 0.55 0.81 0.76 0.71 0.69 0.62 0.51 0.47 0.47 0.68 0.50
AA
PSU 0.49 0.56 0.81 0.78 0.74 0.73 0.69 0.61 0.59 0.62 0.85 0.65
Bank 0.39 0.46 0.71 0.68 0.64 0.64 0.61 0.53 0.52 0.55 0.79 0.58
NBFC 0.68 0.76 1.02 0.98 0.94 0.92 0.87 0.77 0.74 0.75 0.97 0.78
Corporate 0.59 0.66 0.90 0.86 0.82 0.81 0.76 0.67 0.65 0.67 0.90 0.71
Bond Yield Spreads over Gilts—August 2014
Constant Maturity Yields for Government Bonds—August 2014
Debt Market Yields
Page 13
E-UpDates September 2014 Surge Research Support
13
Debt Market Yields9.4
9.2
9.0
9.3
9.3
9.1 9.2
9.2
9.5
9.1
8.2
9.2 9.3
9.4
9.4
9.1 9.2
9.1
8.9
9.4
8.9
8.8
9.0
9.2 9.3
9.5
9.2
9.2 9.3
8.9
9.3
9.3 9
.4
9.3
9.4
7.5
8.0
8.5
9.0
9.5
10.0
June 2
01
2
Octo
ber
20
12
Marc
h 2
01
3
May 2
01
3
July
20
13
July
20
13
Decem
ber …
Ap
ril
20
14
Octo
ber
20
14
August
20
15
july
20
16
August
20
16
Marc
h 2
01
7
July
20
17
August
20
17
July
20
18
June 2
01
9
July
20
19
Wei
gh
ted
Av
erag
e Y
TM
s
Maturity Year
Yields of Benchmark Corporate Bonds (AAA) -August 2014
8.6
9
8.6
9
8.4
3 8.5
6
8.6
2 8.7
6
8.6
3
8.7
2
8.8
0
8.8
3
8.7
5
8.5
6
8.8
3
8.8
7
8.8
6
8.8
4
8.7
3 8.8
2
8.8
2
8.8
0
8.8
0
8.00
8.20
8.40
8.60
8.80
9.00
9.20
9.40
9.60
Jun
e 2
01
5
Jun
e 2
01
5
Au
gu
st 2
01
6
Apri
l 2
01
8
Jun
e 2
01
9
May 2
02
0
Jun
e 2
02
0
Decem
ber
20
20
May 2
02
2
May 2
02
3
No
vem
ber
20
23
July
20
24
Sep
tem
ber
20
25
July
20
26
Feb
ruary
20
27
Sep
tem
ber
20
27
Jun
e 2
02
8
Sep
tem
ber
20
30
Au
gu
st 2
03
2
Decem
ber
20
42
Decem
ber
20
43
Weig
hte
d A
vera
ge Y
TM
s
Maturity Year
Yields of Gsecs Traded in August 2014
Page 14
E-UpDates September 2014 Surge Research Support
14
BSE Equity Market S&P BSE Sensex (30 Scrips) (1978-79=100)
Month/Year
No of co.s
listed*
No. of co.s
traded
Turnover
(Rs.cr)
Average
Daily
Turnover
(Rs.cr)
Market
Capitalisation
(Rs.cr)*
Month
High
Month
Low
Month-
Closing P/E P/B Div Yield
May-14 5379 3086 92122 4387 8407834 25375.63 22277.04 24217.34 17.94 2.79 1.42
Jun-14 5406 3135 84141 4007 9020000 25725.12 24270.2 25413.78 18.58 2.83 1.39
Jul-14 5433 3022 75119 3415 9010270 26300.17 24892 25894.97 18.52 2.88 1.37
NSE Capital Market Segment CNX Nifty (50 Scrips)(Nov.3, 1993=100)
Month/Year
No of co.s
listed*
No. of co.s
traded
Turnover
(Rs.cr)
Average
Daily
Turnover
(Rs.cr)
Market
Capitalisation
(Rs.cr)*
Month
High
Month
Low
Month-
Closing P/E P/B Div Yield
May-14 1692 1588 436022 20763 8251346 7563.50 6638.55 7229.95 19.62 3.37 1.36
Jun-14 1695 1588 421688 20080 8854702 7700.05 7239.50 7611.35 20.57 3.50 1.29
Jul-14 1696 1594 391428 17792 8831139 7840.95 7422.15 7721.30 20.66 3.50 1.28
*End of the Month.
BSE Derivatives (F&O) Trades
No. of
contracts
Turnover (Rs.
cr.)
No. of
contracts
Turnover
(Rs. cr.)
No. of
contracts
Notional
Turnover
(Rs. cr.)
No. of
contracts
Notional
Turnover
(Rs. cr.)
No. of
contracts
Turnover
(Rs. cr.)
May-14 88483 3157.00 74143 2367.00 8138810 291398.00 31673 1095.00 8333109 298017.00 14191.29
Jun-14 144469 5469.00 4594 154.00 51901113 1957326.00 60829 2337.00 52111005 1965285.00 93585.00
Jul-14 137732 5315.00 6899 242.00 57544114 2245766.00 81222 3067.00 57769967 2254389.00 102472.23
NSE Derivatives (F&O) Segment
No. of
contracts
Turnover (Rs.
cr.)
No. of
contracts
Turnover
(Rs. cr.)
No. of
contracts
Notional
Turnover
(Rs. cr.)
No. of
contracts
Notional
Turnover
(Rs. cr.)
No. of
contracts
Turnover
(Rs. cr.)
May-14 10603369 382840.19 22571501 808882.21 71491525 2603963.62 7570282 276019.55 112240141 4072451.86 193926.28
Jun-14 8961322 339617.49 21479352 834723.02 76549167 2897812.18 7466499 295985.91 114456691 4368186.88 208008.90
Jul-14 9553629 366246.67 20623544 804572.36 88120449 3396549.87 7494464 296531.16 125792830 4863975.35 221089.79
Total Average
Daily
Turnover
(Rs. cr.)Month / Year
Index Futures Stock Futures Index Options Stock Options
Stock Markets
Average
Daily
Turnover
(Rs. cr.)Month / Year
Index Futures Stock Futures Index Options Stock Options Total
Equity Market Turnover
Derivatives Turnover
Page 15
E-UpDates September 2014 Surge Research Support
15
BSE: S&P BSE Sensex (30 Scrips) (1978-79=100)
Open High Low Close Price/Earnings Price/Bookvalue Dividend Yield
01-Aug-14 25753.92 25862.68 25459.13 25480.84 17.80 2.81 1.39
04-Aug-14 25631.68 25754.42 25531.38 25723.16 18.11 2.87 1.37
05-Aug-14 25817.84 25928.32 25562.36 25908.01 18.37 2.90 1.29
06-Aug-14 25892.55 25901.68 25621.85 25665.27 18.06 2.85 1.32
07-Aug-14 25668.71 25778.05 25526.05 25589.01 18.00 2.84 1.32
08-Aug-14 25406.87 25406.87 25232.82 25329.14 17.88 2.82 1.33
11-Aug-14 25476.87 25553.44 25437.05 25519.24 18.03 2.84 1.32
12-Aug-14 25703.78 25904.98 25645.79 25880.77 18.31 2.88 1.30
13-Aug-14 25861.47 25972.62 25791.79 25918.95 17.93 2.87 1.30
14-Aug-14 25948.30 26135.00 25945.35 26103.23 18.15 2.91 1.29
18-Aug-14 26123.69 26413.11 26075.28 26390.96 18.25 2.93 1.28
19-Aug-14 26482.56 26530.67 26387.84 26420.67 18.28 2.94 1.28
20-Aug-14 26496.29 26504.52 26277.61 26314.29 18.22 2.93 1.28
21-Aug-14 26322.66 26464.80 26262.52 26360.11 18.21 2.93 1.29
22-Aug-14 26419.53 26508.27 26383.16 26419.55 18.31 2.94 1.28
25-Aug-14 26490.31 26630.74 26401.64 26437.02 18.27 2.94 1.28
26-Aug-14 26349.87 26481.97 26314.89 26442.81 18.27 2.94 1.28
27-Aug-14 26553.24 26599.12 26492.50 26560.15 18.39 2.95 1.27
28-Aug-14 26620.18 26674.38 26573.69 26638.11 18.41 2.96 1.27
NSE: CNX Nifty (50 Scrips) (Nov.3, 1993=100)
Open High Low Close Price/Earnings Price/Bookvalue Dividend Yield
01-Aug-14 7662.50 7716.70 7593.90 7602.60 20.05 3.42 1.32
04-Aug-14 7639.55 7694.80 7622.05 7683.65 20.26 3.46 1.31
05-Aug-14 7706.65 7752.45 7638.05 7746.55 20.43 3.48 1.30
06-Aug-14 7726.15 7740.95 7658.95 7672.05 20.20 3.40 1.32
07-Aug-14 7651.15 7708.95 7630.40 7649.25 20.14 3.35 1.32
08-Aug-14 7588.70 7592.45 7540.10 7568.55 19.93 3.29 1.34
11-Aug-14 7619.85 7635.55 7598.60 7625.95 20.00 3.32 1.33
12-Aug-14 7688.80 7735.75 7654.80 7727.05 20.26 3.36 1.31
13-Aug-14 7717.30 7757.10 7695.70 7739.55 20.31 3.37 1.31
14-Aug-14 7756.15 7796.70 7739.10 7791.70 20.45 3.39 1.30
18-Aug-14 7785.25 7880.50 7779.20 7874.25 20.57 3.43 1.29
19-Aug-14 7901.00 7918.55 7881.15 7897.50 20.63 3.44 1.28
20-Aug-14 7915.80 7922.70 7864.05 7875.30 20.58 3.43 1.29
21-Aug-14 7875.35 7919.65 7855.95 7891.10 20.63 3.43 1.29
22-Aug-14 7904.55 7929.05 7900.05 7913.20 20.69 3.44 1.28
25-Aug-14 7931.75 7968.25 7897.95 7906.30 20.67 3.44 1.28
26-Aug-14 7874.50 7915.45 7862.45 7904.75 20.67 3.44 1.28
27-Aug-14 7933.90 7946.85 7916.55 7936.05 20.75 3.45 1.28
28-Aug-14 7942.25 7967.80 7939.20 7954.35 20.80 3.46 1.27
Index Movements
Page 16
E-UpDates September 2014 Surge Research Support
16
7500
7550
7600
7650
7700
7750
7800
7850
7900
7950
8000
25200
25400
25600
25800
26000
26200
26400
26600
268000
1-A
ug-1
4
04-A
ug-1
4
05-A
ug-1
4
06-A
ug-1
4
07-A
ug-1
4
08-A
ug-1
4
11-A
ug-1
4
12-A
ug-1
4
13-A
ug-1
4
14-A
ug-1
4
18-A
ug-1
4
19-A
ug-1
4
20-A
ug-1
4
21-A
ug-1
4
22-A
ug-1
4
25-A
ug-1
4
26-A
ug-1
4
27-A
ug-1
4
28-A
ug-1
4
Sensex High Low Nifty High Low
FUTIDX-NIFTY Futures
(Expiry 28 Aug-14)
Open High Low Close No. of Contracts Turnover ('00,000) Change in OI
01-Aug-14 7686.1 7744.9 7611.3 7622.6 346552.0 1330123 -744100
04-Aug-14 7661.2 7725.9 7646.3 7718.2 211809.0 813633 275850
05-Aug-14 7734.2 7788.6 7655.2 7772.9 347497.0 1341843 374150
06-Aug-14 7747.7 7759.0 7676.7 7691.5 256771.0 991937 606300
07-Aug-14 7679.8 7750.0 7650.0 7669.7 302990.0 1165319 -637850
08-Aug-14 7604.5 7618.9 7560.6 7591.7 260196.0 987280 -889300
11-Aug-14 7651.0 7651.0 7611.0 7641.4 142670.0 544458 312100
12-Aug-14 7699.7 7755.9 7663.5 7748.3 247522.0 953624 343200
13-Aug-14 7728.1 7776.7 7706.4 7746.4 263570.0 1019927 1275850
14-Aug-14 7762.0 7811.8 7748.0 7803.7 197553.0 769345 259250
18-Aug-14 7790.2 7886.9 7772.6 7877.7 184306.0 722932 641100
19-Aug-14 7897.0 7923.7 7888.5 7909.7 170617.0 674451 193850
20-Aug-14 7909.0 7915.5 7881.2 7890.7 137473.0 542690 -158850
21-Aug-14 7886.9 7937.1 7867.6 7903.2 191635.0 757162 -385750
22-Aug-14 7912.2 7939.8 7906.3 7927.6 143939.0 570174 -317450
25-Aug-14 7926.0 7979.0 7906.3 7915.5 209930.0 833941 -1533550
26-Aug-14 7895.0 7918.0 7871.6 7906.5 215564.0 851184 -2321650
27-Aug-14 7930.0 7948.1 7911.2 7931.6 222784.0 883819 -1657100
28-Aug-14 7952.0 7967.2 7935.3 7952.8 241078.0 958923 -2872150
Page 17
E-UpDates September 2014 Surge Research Support
17
Equity
Gross Purchases
(Rs Crores)
Gross Sales
(Rs Crores)
Net Investment
(Rs Crores)
01-Aug-14 1483.6 681.7 801.9
04-Aug-14 785.7 557.7 228.0
05-Aug-14 941.9 433.3 508.6
06-Aug-14 740.0 611.7 128.3
07-Aug-14 795.2 520.3 274.9
08-Aug-14 760.7 694.0 66.6
11-Aug-14 683.1 434.5 248.6
12-Aug-14 744.5 643.2 101.2
13-Aug-14 891.1 828.1 63.1
14-Aug-14 677.3 376.7 300.5
18-Aug-14 645.1 351.5 293.6
19-Aug-14 921.1 620.5 300.6
20-Aug-14 682.4 261.4 421.0
21-Aug-14 1298.9 808.1 490.8
22-Aug-14 939.6 653.4 286.2
25-Aug-14 876.5 437.8 438.7
26-Aug-14 857.1 662.9 194.2
27-Aug-14 1180.6 481.1 699.6
28-Aug-14 1972.1 861.0 1111.0
Total for August 17876.5 10918.9 6957.4
Debt
Gross Purchases
(Rs Crores)
Gross Sales
(Rs Crores)
Net Investment
(Rs Crores)
01-Aug-14 9702.8 3898.2 5804.6
04-Aug-14 7163.2 2978.8 4184.4
05-Aug-14 5601.6 2989.2 2612.4
06-Aug-14 7923.9 6212.3 1711.5
07-Aug-14 9189.4 5402.1 3787.3
08-Aug-14 9352.4 4068.1 5284.3
11-Aug-14 4910.7 3988.9 921.8
12-Aug-14 4853.8 4079.3 774.4
13-Aug-14 8712.4 5290.7 3421.8
14-Aug-14 5998.1 3029.9 2968.3
18-Aug-14 8.6 6.2 2.5
19-Aug-14 8633.8 4217.5 4416.3
20-Aug-14 4191.1 2179.9 2011.2
21-Aug-14 8159.3 3155.8 5003.5
22-Aug-14 13596.4 3362.3 10234.1
25-Aug-14 10704.4 5753.0 4951.5
26-Aug-14 6600.4 3743.9 2856.5
27-Aug-14 10812.3 5652.2 5160.1
28-Aug-14 13673.1 7884.7 5788.4
Total for August 149787.7 77893.0 71894.9
Mutual Funds Investment Trends
Capital Flows
Page 18
E-UpDates September 2014 Surge Research Support
18
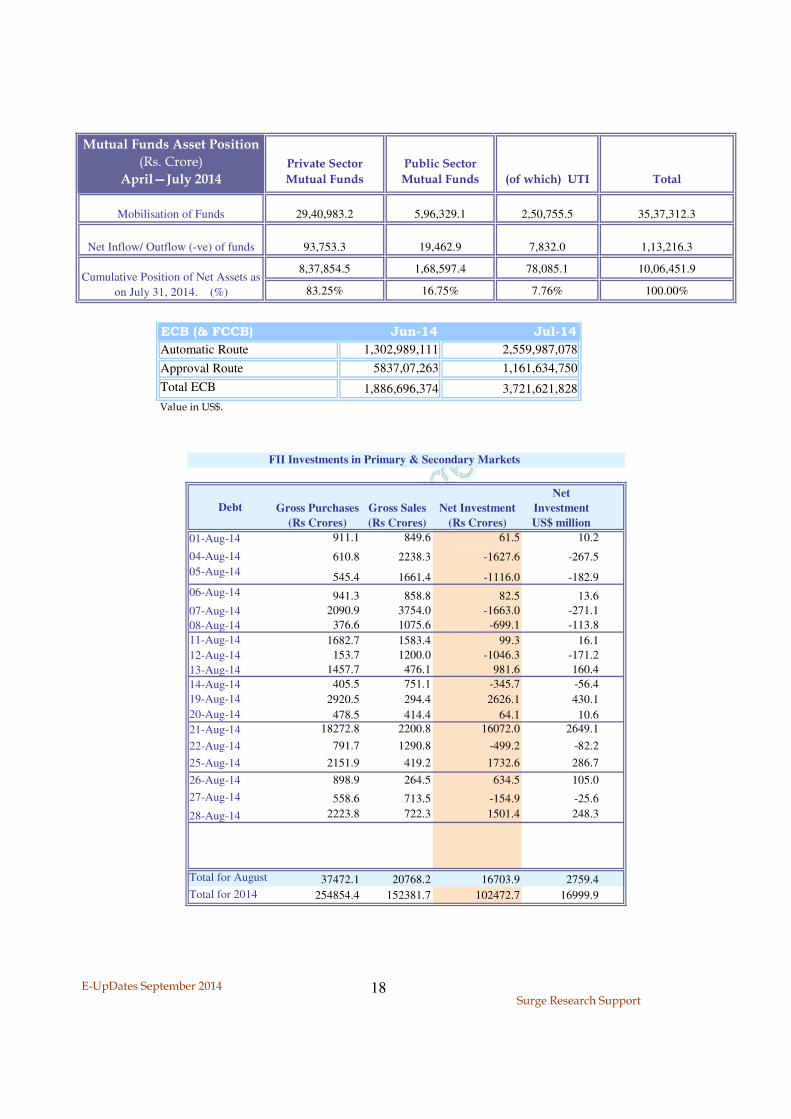
Mutual Funds Asset Position
(Rs. Crore)
April—July 2014 Private Sector
Mutual Funds
Public Sector
Mutual Funds (of which) UTI Total
8,37,854.5 1,68,597.4 78,085.1 10,06,451.9
83.25% 16.75% 7.76% 100.00%
2,50,755.5
Cumulative Position of Net Assets as
on July 31, 2014. (%)
35,37,312.3
Net Inflow/ Outflow (-ve) of funds 93,753.3 19,462.9 7,832.0 1,13,216.3
Mobilisation of Funds 29,40,983.2 5,96,329.1
ECB (& FCCB) Jun-14 Jul-14
Automatic Route 1,302,989,111 2,559,987,078
Approval Route 5837,07,263 1,161,634,750
Total ECB 1,886,696,374 3,721,621,828
Value in US$.
01-Aug-14 911.1 849.6 61.5 10.2
04-Aug-14 610.8 2238.3 -1627.6 -267.5
05-Aug-14545.4 1661.4 -1116.0 -182.9
06-Aug-14 941.3 858.8 82.5 13.6
07-Aug-14 2090.9 3754.0 -1663.0 -271.1
08-Aug-14 376.6 1075.6 -699.1 -113.8
11-Aug-14 1682.7 1583.4 99.3 16.1
12-Aug-14 153.7 1200.0 -1046.3 -171.2
13-Aug-14 1457.7 476.1 981.6 160.4
14-Aug-14 405.5 751.1 -345.7 -56.4
19-Aug-14 2920.5 294.4 2626.1 430.1
20-Aug-14 478.5 414.4 64.1 10.6
21-Aug-14 18272.8 2200.8 16072.0 2649.1
22-Aug-14 791.7 1290.8 -499.2 -82.2
25-Aug-14 2151.9 419.2 1732.6 286.7
26-Aug-14 898.9 264.5 634.5 105.0
27-Aug-14 558.6 713.5 -154.9 -25.6
28-Aug-14 2223.8 722.3 1501.4 248.3
Total for August 37472.1 20768.2 16703.9 2759.4
Total for 2014 254854.4 152381.7 102472.7 16999.9
Debt Gross Purchases
(Rs Crores)
Gross Sales
(Rs Crores)
Net
Investment
US$ million
Net Investment
(Rs Crores)
FII Investments in Primary & Secondary Markets
Page 19
E-UpDates September 2014 Surge Research Support
19
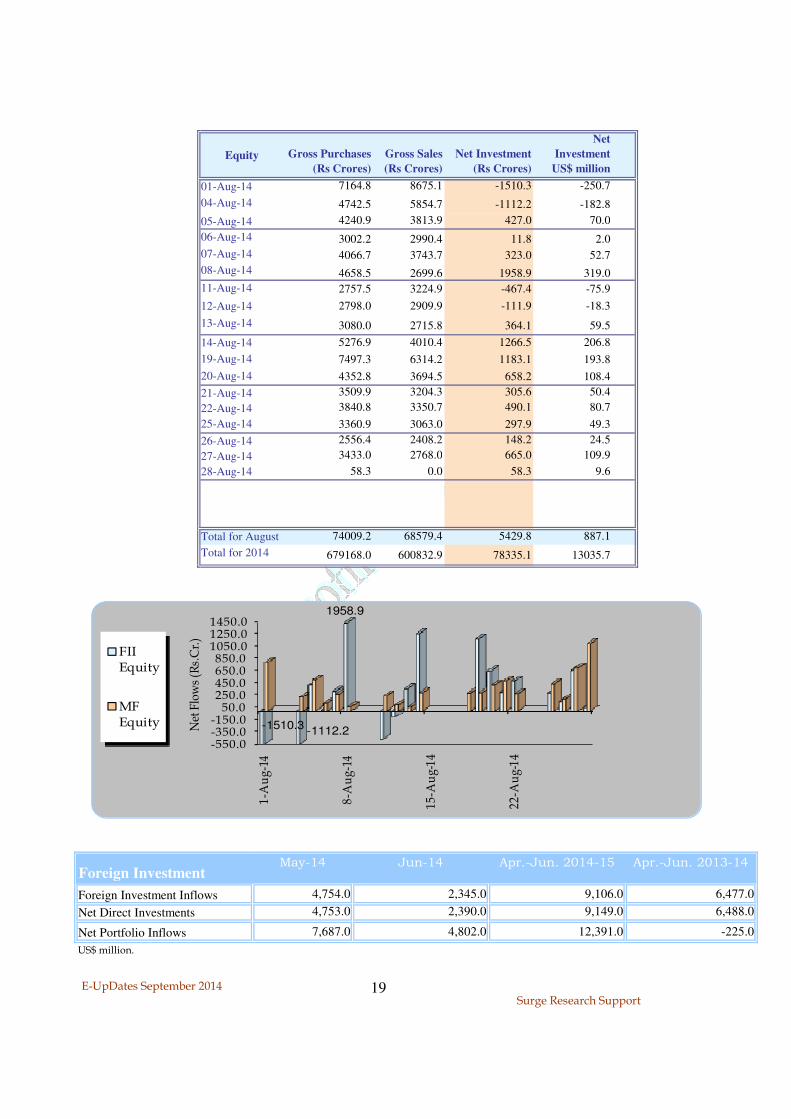
01-Aug-14 7164.8 8675.1 -1510.3 -250.7
04-Aug-14 4742.5 5854.7 -1112.2 -182.8
05-Aug-14 4240.9 3813.9 427.0 70.0
06-Aug-14 3002.2 2990.4 11.8 2.0
07-Aug-14 4066.7 3743.7 323.0 52.7
08-Aug-14 4658.5 2699.6 1958.9 319.0
11-Aug-14 2757.5 3224.9 -467.4 -75.9
12-Aug-14 2798.0 2909.9 -111.9 -18.3
13-Aug-14 3080.0 2715.8 364.1 59.5
14-Aug-14 5276.9 4010.4 1266.5 206.8
19-Aug-14 7497.3 6314.2 1183.1 193.8
20-Aug-14 4352.8 3694.5 658.2 108.4
21-Aug-14 3509.9 3204.3 305.6 50.4
22-Aug-14 3840.8 3350.7 490.1 80.7
25-Aug-14 3360.9 3063.0 297.9 49.3
26-Aug-14 2556.4 2408.2 148.2 24.5
27-Aug-14 3433.0 2768.0 665.0 109.9
28-Aug-14 58.3 0.0 58.3 9.6
Total for August 74009.2 68579.4 5429.8 887.1
Total for 2014 679168.0 600832.9 78335.1 13035.7
Equity
Net
Investment
US$ million
Gross Purchases
(Rs Crores)
Gross Sales
(Rs Crores)
Net Investment
(Rs Crores)
-550.0-350.0-150.050.0
250.0450.0650.0850.01050.01250.01450.0
1-Aug-14
8-Aug-14
15-A
ug-14
22-A
ug-14
-1510.3-1112.2
1958.9
Net Flows (R
s.Cr.)
FII Equity
MF Equity
Foreign Investment May-14 Jun-14 Apr.-Jun. 2014-15 Apr.-Jun. 2013-14
Foreign Investment Inflows 4,754.0 2,345.0 9,106.0 6,477.0
Net Direct Investments 4,753.0 2,390.0 9,149.0 6,488.0
Net Portfolio Inflows 7,687.0 4,802.0 12,391.0 -225.0
US$ million.
Page 20
E-UpDates September 2014 Surge Research Support
20
During MCX NCDEX All Exchanges YoY % Growth
1st - 15th Aug ’14 1,95,205.86 34,420.08 2,33,247.43 -33.90
16th - 31st Jul ’14 2,33,834.32 43,832.24 2,81,701.63 -40.74
1st - 15th Jul ’14 2,09,332.99 56,079.65 2,70,214.58 -33.84
Value of Trade on Commodity Exchanges (in Rs.Crore)
Commodity Futures & Spot Markets
Date Futures Spot Futures Spot Futures Spot Futures Spot Futures Spot
01-Aug-14 3051.0 3086.7 1575.0 1579.0 669.2 682.1 5961.0 5914.0 28222.0 27886.0
04-Aug-14 3049.0 3082.8 1600.0 1577.0 669.4 678.5 5997.0 5956.0 28100.0 27993.0
05-Aug-14 3066.0 3084.4 1598.0 1586.0 660.0 675.7 5938.0 5998.0 28114.0 27914.0
06-Aug-14 3080.0 3089.5 1595.0 1590.0 661.2 672.0 5954.0 5927.0 28633.0 28114.0
07-Aug-14 3079.0 3076.7 1601.0 1587.8 659.8 672.0 5983.0 5945.0 28770.0 28375.0
08-Aug-14 3100.0 3086.3 1606.0 1588.9 659.2 672.0 5970.0 5978.0 28604.0 28576.0
11-Aug-14 3100.0 3085.8 1603.0 1585.0 655.0 668.7 5996.0 6011.0 28633.0 28373.0
12-Aug-14 3102.0 3077.8 1599.0 1585.0 657.0 666.5 5966.0 5994.0 28730.0 28469.0
13-Aug-14 3100.0 3080.0 1598.0 1580.0 657.6 666.8 5935.0 5958.0 28688.0 28413.0
14-Aug-14 3097.0 3070.7 1597.0 1585.0 647.8 661.9 5796.0 5977.0 28614.0 28324.0
18-Aug-14 3088.0 1580.0 1578.9 634.6 648.0 5737.0 5944.0 28295.0 28117.0
19-Aug-14 3079.0 3084.5 1580.0 1577.5 631.6 646.6 5675.0 5887.0 28252.0 28104.0
20-Aug-14 3054.0 3091.3 1585.0 1578.0 626.2 640.5 5699.0 5737.0 28212.0 27996.0
21-Aug-14 3038.0 3076.7 1583.0 1577.5 625.4 633.3 5745.0 5670.0 27747.0 27795.0
22-Aug-14 3059.0 3075.0 1580.0 1580.0 616.1 623.7 5679.0 5710.0 27813.0 27691.0
25-Aug-14 3049.0 3076.0 1577.0 1578.0 621.5 624.1 5683.0 5660.0 27771.0 27625.0
26-Aug-14 3044.0 3075.0 1574.0 1575.0 619.1 624.3 5698.0 5641.0 27895.0 27831.0
27-Aug-14 3044.0 3077.5 1555.0 1575.2 618.1 626.4 5675.0 5678.0 27780.0 27742.0
28-Aug-14 3036.0 3068.0 1554.0 1570.0 620.0 624.4 5761.0 5677.0 28075.0 27923.0
29-Aug-14 3034.0 1554.0 610.7 5831.0 5718.0 27996.0
(1 Bbl.) (10 Grams)
Wheat* Refined Soya Oil* Energy: Crude Oil**Sugar* Bullion: Gold**
*National Commodity & Derivatives Exchange Ltd. **Multi Commodity Exchange of India. Futures: September contract; Gold: October contract.
Commodity Futures & Spot Prices
(100 Kgs) (100 Kgs) (10 Kgs)
Page 21
E-UpDates September 2014 Surge Research Support
21
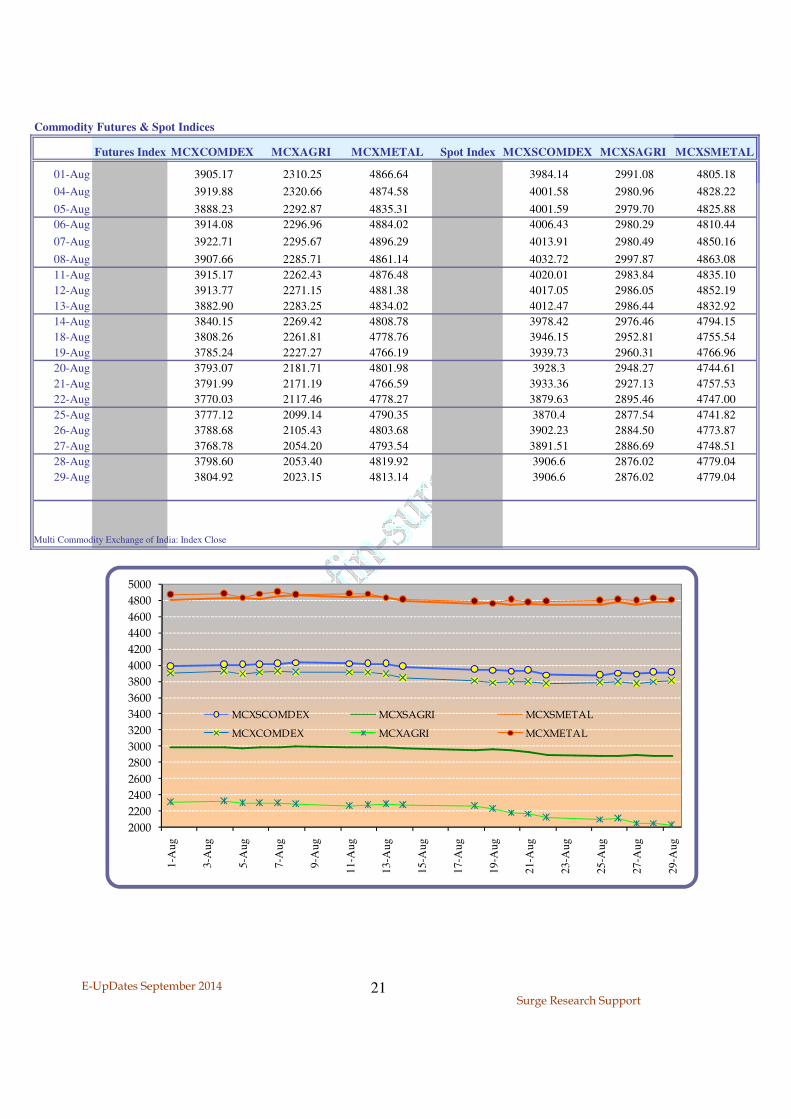
Futures Index MCXCOMDEX MCXAGRI MCXMETAL Spot Index MCXSCOMDEX MCXSAGRI MCXSMETAL
01-Aug 3905.17 2310.25 4866.64 3984.14 2991.08 4805.18
04-Aug 3919.88 2320.66 4874.58 4001.58 2980.96 4828.22
05-Aug 3888.23 2292.87 4835.31 4001.59 2979.70 4825.88
06-Aug 3914.08 2296.96 4884.02 4006.43 2980.29 4810.44
07-Aug 3922.71 2295.67 4896.29 4013.91 2980.49 4850.16
08-Aug 3907.66 2285.71 4861.14 4032.72 2997.87 4863.08
11-Aug 3915.17 2262.43 4876.48 4020.01 2983.84 4835.10
12-Aug 3913.77 2271.15 4881.38 4017.05 2986.05 4852.19
13-Aug 3882.90 2283.25 4834.02 4012.47 2986.44 4832.92
14-Aug 3840.15 2269.42 4808.78 3978.42 2976.46 4794.15
18-Aug 3808.26 2261.81 4778.76 3946.15 2952.81 4755.54
19-Aug 3785.24 2227.27 4766.19 3939.73 2960.31 4766.96
20-Aug 3793.07 2181.71 4801.98 3928.3 2948.27 4744.61
21-Aug 3791.99 2171.19 4766.59 3933.36 2927.13 4757.53
22-Aug 3770.03 2117.46 4778.27 3879.63 2895.46 4747.00
25-Aug 3777.12 2099.14 4790.35 3870.4 2877.54 4741.82
26-Aug 3788.68 2105.43 4803.68 3902.23 2884.50 4773.87
27-Aug 3768.78 2054.20 4793.54 3891.51 2886.69 4748.51
28-Aug 3798.60 2053.40 4819.92 3906.6 2876.02 4779.04
29-Aug 3804.92 2023.15 4813.14 3906.6 2876.02 4779.04
Multi Commodity Exchange of India: Index Close
Commodity Futures & Spot Indices
2000
2200
2400
2600
2800
3000
3200
3400
3600
3800
4000
4200
4400
4600
4800
5000
1-A
ug
3-A
ug
5-A
ug
7-A
ug
9-A
ug
11
-Au
g
13
-Au
g
15
-Au
g
17
-Au
g
19
-Au
g
21
-Au
g
23
-Au
g
25
-Au
g
27
-Au
g
29
-Au
g
MCXSCOMDEX MCXSAGRI MCXSMETAL
MCXCOMDEX MCXAGRI MCXMETAL
Page 22
E-UpDates September 2014 Surge Research Support
22
Stock
Market
Country Risk
Indicator/GDP CPI PPI
Exchange
Rate
FX
Reserves
Country(per US$)
Q2 July
USA 2.5 Jul 5.0 2.0 2.9 0.23 2.41 Jun -718.6 8.2 AA+/Stable
Canada 2.5 Jun 5.7 2.1 2.9 1.21 2.09 1.09 Jun 0.0 75.4 12.2 AAA/Stable
UK 3.2 Jun 1.2 1.6 -0.1 0.55 2.42 0.61 Jun -179.3 110.7 1.2 AAA/Stable
Euro area 0.7 Jun 0.0 0.4 -1.1 0.15 0.95 0.76 Jun 225.9 -1.8
Germany 1.3 Jun -0.4 0.9 -0.8 0.15 0.95 0.76 Jun 270.3 -3.9 AAA/Stable
France 0.1 Jun -0.4 0.5 -0.6 0.15 1.34 0.76 Jun -82.9 -1.9 AA/Stable
Italy -0.2 Jun 0.4 0.9 -1.9 0.15 2.46 0.76 May 49.1 4.7 BBB/-ve
Spain 1.2 Jun 2.9 -0.3 -0.4 0.15 2.28 0.76 Jun -29.9 4.6 BBB/Stable
Russia 0.8 Jul 1.6 7.4 9.87 9.52 36.80 Jun 193.3 468.8 -14.1 BBB-/-ve
Japan -0.1 Jul -0.9 3.4 4.3 0.13 0.54 105.00 Jun -113.0 1276.0 -3.3 AA-/ -ve
China 7.5 Jul 9.0 2.3 -0.9 4.66 4.00 6.14 Jul 283.3 4010.8 1.7 AA-/Stable
Hong Kong 1.8 Q1 2.1 4.1 0.36 1.95 7.75 Jul -67.8 326.0 8.7 AAA/Stable
Malaysia 6.4 Jun 6.9 3.2 3.78 3.95 3.18 Jun 28.0 131.8 2.8 A-/Stable
Singapore 2.4 Jul 3.3 1.2 0.32 2.36 1.25 Jul 39.0 273.7 6.6 AAA/Stable
South Korea 3.5 Jul 3.4 1.6 2.34 3.10 1020.00 Aug 43.0 368.0 5.5 A+/Stable
Taiwan 3.7 Jul 6.1 1.8 0.94 1.64 29.90 Jul 10.1 423.6 5.5 AA-/Stable
Thailand 0.3 Jul -5.2 2.2 1.87 3.33 32.10 Jul -3.6 169.4 25.0 BBB+/Stable
Brazil -0.9 Jul -3.5 6.5 10.80 11.20 2.23 Aug 6.4 376.8 26.8 BBB-/Stable
Chile 1.9 Jul -2.6 4.5 0.74 4.28 588.00 Jul 6.0 40.4 -2.8 AA-/ Stable
Mexico 1.6 Jun 2.0 4.1 3.30 7.75 13.10 Jul 1.0 190.3 7.8 BBB+/Stable
South Africa 1.0 Jun 0.7 6.3 6.13 7.73 10.70 Jul -8.4 49.9 9.7 BBB-/Stable
India 5.7 Jun 3.4 8.0 8.60 8.52 60.50 Jul -122.9 320.6 31.1 BBB-/-ve
Note: Trade balance for last 12 months. FX Reserves at end of period.
*% change of the major index in US$ terms between 31st December 2013 and September 3, 2014. **Foreign Currency Ratings by S&P.
For more Countrywise Indicators and Updates visit: http://www.ecofin-surge.co.in/publications.html
Global Economic Indicators
03-Sep
(% change on year ago)
Economic & Financial Market Indicators for Major Global Economies
External Sector
(%)
Growth Inflation
Share
Price
Growth*
Interest Rates
Short-
term
Rate
Long-
term
Rate
IIP
Sovereign
Rating**
Trade Balance($ bn.)
July
5.2
3.9
3.23.0
3.63.93.6
4.9
3.93.6
3.5 3.4
12.8
6.2
2.8 3.0
4.35.3
0.0
2.0
4.0
6.0
8.0
10.0
12.0
14.0
0.0
1.0
2.0
3.0
4.0
5.0
6.0
2010 2011 2012 2013 2014 2015
Trade
World Output, Inflation & Trade (% change, IMF, WEO Database & Updates)
GDP Inflation Trade
Page 23
E-UpDates September 2014 Surge Research Support
23
S&P BSE
Dollex-30
(India) DJI (US)
S&P
500(US)
FTSE
100(UK)
NIKKEI
225 (Japan)
HSI
(HongKong)
STI
(Singapore)
IPC
(Mexico)
BOVESPA
(Brazil)
01-Aug-14 3,421.89 16,493.37 1,925.15 6,679.20 15,523.11 24,532.43 3,344.42 43,986.11 55,903.00
04-Aug-14 3,458.96 16,569.28 1,938.99 6,677.50 15,474.50 24,600.08 3,318.40 44,594.66 56,616.00
05-Aug-14 3,501.88 16,429.47 1,920.21 6,682.50 15,320.31 24,648.26 3,327.67 44,481.68 56,202.00
06-Aug-14 3,437.24 16,443.34 1,920.24 6,636.20 15,159.79 24,584.13 3,320.23 44,425.77 56,487.00
07-Aug-14 3,424.65 16,368.27 1,909.57 6,597.40 15,232.37 24,387.56 3,314.22 44,116.15 56,188.00
08-Aug-14 3,389.32 16,553.93 1,931.59 6,567.40 14,778.37 24,331.41 3,288.89 44,105.95 55,573.00
11-Aug-14 3,420.33 16,569.98 1,936.92 6,632.80 15,130.52 24,646.02 3,306.45 44,679.16 56,613.00
12-Aug-14 3,474.60 16,560.54 1,933.75 6,632.40 15,161.31 24,689.41 3,303.39 44,734.04 56,442.00
13-Aug-14 3,473.05 16,651.80 1,946.72 6,656.70 15,213.63 24,890.34 3,301.41 44,723.96 55,581.00
14-Aug-14 3,516.11 16,713.58 1,955.18 6,685.30 15,314.57 24,801.36 3,294.83 44,793.02 55,780.00
15-Aug-14 16,662.91 1,955.06 6,689.10 15,318.34 24,954.94 3,314.77 44,629.33 56,964.00
18-Aug-14 3,564.81 16,838.74 1,971.74 6,741.30 15,322.60 24,955.46 3,312.78 44,854.81 57,561.00
19-Aug-14 3,571.32 16,919.59 1,981.60 6,779.30 15,449.79 25,122.95 3,316.43 44,962.88 58,449.00
20-Aug-14 3,561.05 16,979.13 1,986.51 6,755.50 15,454.45 25,159.76 3,323.65 45,248.05 58,878.00
21-Aug-14 3,565.04 17,039.49 1,992.37 6,777.70 15,586.20 24,994.10 3,324.09 45,410.36 58,992.00
22-Aug-14 3,585.78 17,001.22 1,988.40 6,775.30 15,539.19 25,112.23 3,325.50 45,374.99 58,407.00
25-Aug-14 3,588.15 17,076.87 1,997.92 15,613.25 25,166.91 3,330.28 45,504.34 59,735.00
26-Aug-14 3,588.94 17,106.70 2,000.02 6,822.80 15,521.22 25,074.50 3,323.02 45,464.75 59,821.00
27-Aug-14 3,607.55 17,122.01 2,000.12 6,830.70 15,534.82 24,918.75 3,341.46 45,601.00 60,951.00
28-Aug-14 3,616.79 17,079.57 1,996.74 6,805.80 15,459.86 24,741.00 3,330.22 45,501.28 60,291.00
29-Aug-14 17,098.45 2,003.37 6,819.80 15,424.59 24,742.06 3,327.09 45,628.09 61,288.00
Closing Values
International Stock Index Movements vs S&P BSE Sensex (August-2014, with 1st Aug=100)
Selected Indian & International Stock Indices
Global Stock Indices
DJI (US) S&P 500 (US) FTSE 100(UK) NIKKEI 225 (Japan)
HSI (HongKong) IPC (Mexico) BOVESPA (Brazil)STI (Singapore)
Page 24
E-UpDates September 2014 Surge Research Support
24
Units Descriptor Jun-13 Jul-13 Aug-13 Jun-14 Jul-14 Aug-14
Index Number Fuel and Non-Fuel 179.16 183.55 185.67 185.15 181.10 175.36
Index Number Non-Fuel 169.43 168.65 166.69 164.54 164.63 161.69
Index Number Food 185.37 183.58 175.00 175.88 172.05 165.99
Index Number Agricultural Raw Materials 141.04 136.59 133.99 140.39 139.08 137.73
Index Number Industrial Inputs 157.66 157.53 161.18 152.85 156.33 155.40
Index Number Metals 169.66 172.66 180.81 161.85 168.79 168.17
Index Number Energy 184.85 192.26 196.77 197.20 190.73 183.36
Index Number Crude Oil 187.68 197.73 203.14 203.83 197.94 188.34
US Dollars per Barrel Crude Oil, Brent 103.11 107.72 110.96 111.87 106.98 101.92
" Crude Oil Dubai Fateh 100.33 103.36 106.66 108.01 105.71 101.85
" Crude Oil WTI 95.79 104.55 106.55 105.24 102.99 96.38
USD per Million Metric British Thermal Unit Natural Gas, H H, Louisiana 3.83 3.62 3.43 4.57 4.04 3.88
US Dollars per Metric Ton Coal, Australian Thermal 88.67 82.78 82.46 76.59 73.66 73.86
US Dollars per Metric Ton Aluminum 1814.54 1769.61 1816.24 1838.95 1948.30 2030.49
" Copper 7000.24 6906.64 7186.25 6821.14 7113.38 7001.84
" Zinc 1839.01 1837.62 1896.39 2128.10 2310.62 2326.99
US Cents per Metric Ton Iron Ore 114.82 127.19 137.06 92.74 96.05 92.61
US cents per Pound Rubber 127.47 116.26 116.53 94.65 91.57 83.91
US cents per Pound Cotton 93.08 92.62 92.71 90.90 83.84 74.00
US Dollars per Metric Ton Palm oil 763.04 729.86 722.84 758.47 752.89 677.86
US Dollars per Metric Ton Sunflower Oil 1470.57 1375.48 1152.39 1112.06 1061.82 992.55
US Dollars per Metric Ton Soybean Oil 1058.59 1000.84 944.27 871.57 813.86 745.84
US Dollars per Metric Ton Soybeans 560.16 548.35 498.05 528.00 463.23 432.99
US cents per Pound Sugar, European 25.74 25.26 25.76 28.11 28.39 27.77
" Sugar, Free Market 16.96 17.10 17.24 18.13 17.18 15.89
" Sugar, U.S. 19.61 20.46 21.36 25.95 25.58 25.64
US cents per Kg. Tea 258.71 256.16 248.04 223.70 232.39 235.78
US cents per Pound Coffee, Arabicas 138.86 138.44 135.63 198.91 198.59 214.50
US Dollars per Metric Ton Rice, Bangkok 546.25 538.26 503.82 414.67 428.00 440.38
US Dollars per Metric Ton Wheat, Mexico 313.52 304.68 305.49 306.53 280.36 263.41
*Base 2005=100
Primary Commodity Indices*/ Prices
Global Commodity Prices
0 50 100 150 200 250
2011
2012
2013
2014
2015
Observed & Projected Price Movements, IMF WEO Database Fuel and Non-Fuel Price Indices
Industrial Inputs Price Index includes
Agricultural Raw Materials and Metals
Agricultural Raw Materials Index includes
Timber, Cotton, Wool, Rubber, and Hides Price
Cereals Price Index Wheat, Corn, Rice & Barley
Crude Oil Index(Petroleum), Brent, West
Texas Intermediate, and the Dubai Fateh
Metals Price Index, Copper, Aluminum, Iron Ore, Tin, Nickel, Zinc, Lead, and Uranium Price Indices
Page 25
E-UpDates September 2014 Surge Research Support
25
Following are the some highlights of the Union Budget 2014-15:
* Maintains fiscal deficit target of 4.1 percent of GDP for 2014/15
* Sustained growth of 7-8 percent in the next 3-4 years
Taxation
* Government expects Rs 9.77 lakh crore revenue crore from taxes
*Plan expenditure pegged at Rs 5.75 lakh crore and non-plan at Rs 12.19 lakh crore.
* Fiscal deficit target retained at 4.1 pc of GDP for current fiscal and 3.6 pc in FY 16
* Disinvestment target fixed at Rs 58,425 crore
* Gross borrowings pegged at Rs 6 lakh crore
* Tax-to-GDP ratio must be raised
* Contours of GST to be finalised this fiscal; Govt to look into DTC proposal.
* Will not change rules on retrospective taxation
* Proposes changes in transfer pricing mechanism
* Extends 5 percent withholding tax on corporate bonds until June 30 2017
*Tax slab on personal income remains unchanged
* Income tax exemption limit raised by Rs 50,000 to Rs 2.5 lakh and for senior citizens to Rs 3 lakh
* Exemption limit for investment in financial instruments under 80C raised to Rs 1.5 lakh from Rs 1 lakh.
* Investment limit in PPF raised to Rs 1.5 lakh from Rs 1 lakh
* Long term capital gain tax for mutual funds doubled to 20 per cent; lock-in period increased to three years
* Net effect of direct tax proposals is revenue loss of Rs 22,200 crore
* Tax proposals on indirect tax front would yield Rs. 7,525 crore
Outlays
* Capital outlay for defence raised by 50 billion rupees over interim budget
* Earmarks Rs 500 crore for 24x7 uninterrupted power in all homes
* Rs 2,037 crore set aside for Integrated Ganga Conservation Mission
* Rs 2250 crore for the development and modernization of the border infrastructure
* A project on the river Ganga called 'Jal Marg Vikas' for inland waterways between Allahabad and Haldia; Rs
4,200 crore set aside for the purpose
* Rs 7,060 crore for setting up 100 Smart Cities
* Set aside Rs 11,200 crore for PSU banks capitalization
* Proposes Rs 5000 crore for warehousing capacity; 100 billion rupees of private capital for start-up companies;
and 378 billion rupees of investment in national and state highways
*Rs. 1000 crore provided for assured irrigation.
* Rs 4000 crore for affordable housing proposed through national housing bank and extends tax incentives for
housing loans
* Proposes Rs 8000 crore for rural housing scheme
Subsidies
* Plans to make food and petroleum subsidies more targeted
Page 26
E-UpDates September 2014 Surge Research Support
26
* Rural job-guarantee scheme, which provides 100 days of paid employment a year, will become more focused on
asset creation
Agriculture
* Will focus on achieving 4 growth per year in agriculture
* Proposes a long-term rural credit fund with an initial corpus of Rs 5000 crore
* Rs 100 crore for development of organic farming
Investment
* Raises limit on foreign direct investment in defence sector from 26 per cent to 49 per cent; raises FDI limit in
insurance sector to 49 percent
* Will provide the necessary tax changes to introduce real estate investment trusts and infrastructure investment
trusts
Page 27
E-UpDates September 2014 Surge Research Support
27
E-UpDates Subscription (Renewal) form
One year subscription: Rs. 3000.00 Back issue: Rs. 250.00 (per issue)
SUBSCRIBER INFORMATION
(Please complete the form clearly to receive information and offerings from Ecofin-Surge)
Subscription for……………………………. Subscription Number……………..………… (New subscription or Renewal or Back issue) (for renewal) Issues from……………………………………………….. to ………………………………………………. (please specify for Back issues)
Name ……………………………………………………………………………………… Organization ……………………………………………………………………………… Address1…………………………………………………………………………………... Address2…………………………………………………………………………………... City…………………………………………….. State …………………………………… Pin……………………..Phone………………….…… Email…………………………….
PAYMENT INFORMATION
Cheque (in favour of SURGE RESEARCH SUPPORT) Cheque Number …………………. Bank ………..…………………….. Date………………………….. Amount…………… OR Bank Transfer (made payable to SURGE RESEARCH SUPPORT) Bank Name: Axis Bank Branch: Rashbehari Avenue, Kolkata A/C Number: 911020021891851 IFS Code: UTIB0000253 Date………………………….. Amount…………… Please complete this page and mail (/email) it to: Sakuntala Sarkar For: Surge Research Support 772, R.N. Tagore Road Kolkata 700 077 West Bengal, INDIA Email: [email protected]
Page 28
E-UpDates September 2014 Surge Research Support
28
Prepared by the
Please explore at
www.ecofin-surge.co.in
To subscribe visit
www.ecofin-surge.co.in/kiosk.html
or email
[email protected]
Rs. 3000.00 (12 Issues)