23
August 2021 Housing Affordability and Food Sufficiency NATIONAL ASSOCIATION OF REALTORS ®

August 2021
Housing Affordability and Food SufficiencyNATIONAL ASSOCIATION OF REALTORS®
2
NATIONAL ASSOCIATION OF REALTORS® RESEARCH GROUP
Lawrence Yun, PhDChief Economist & Senior Vice President
Jessica Lautz, Doctor of Real EstateVice President, Demographics and Business Insights
Gay CororatonSenior Economist and Director of Housing and Commercial Research
Meredith DunnResearch Manager
The Research Group acknowledges the Food Recovery Network for the inspiration for this report and leadership combating hunger.
©2021 National Association of REALTORS® All Rights Reserved. May not be reprinted in whole or in part without permission of the National Association of REALTORS®. For reprint information, contact [email protected].
August 2021
Cover photo: Brandon Mowinkel

Table of Contents
Introduction 4
Housing Affordability and Food Sufficiency 5
Food Sufficiency Indicators During the COVID-19 Pandemic 7
Food Sufficiency Indicators Among Homeowners and Renters 9
Households Struggling to Pay Rent or Mortgage and Food Sufficiency at the State Level
12
Home Prices and Rent Growth Outpace Wage Growth 19
What Are REALTORS® and NAR Doing to Combat the Issue 21
3
Housing insecurity is not a novel issue. However it is an issue that has been highlighted and exacerbated in the last year during the COVID-19 pandemic. The uneven and unequal economic recovery has been well-documented between different types of workers: those who could work from home and did, while those who could not faced reduced wages. Both types of workers had additional pressure from added caregiving responsibilities.
Outside of the pandemic, food deserts and Fair Housing are also often connected. Racial and ethnic minority families were told in which neighborhoods they can and can not buy property, if they had the funds to buy a home. Even today, these historically minority and low income neighborhoods are often lacking in grocery stores where there is high quality food and fresh produce. 1 Big supermarket chains are often found outside city centers and in wealthier suburbs which allows for the persistence of inadequate access to food sources in poorer neighborhoods.2
A recent paper on the topic found that housing and food insecurity have a direct relationship. Families who are experiencing food insecurity had 62% higher odds of also facing housing instability, and families who have housing instability had 40% increased odds of also facing food insecurity. 3 Not only does where an owned property or rental unit is located mean the difference in access to food, the ability of families to meet their budgets also plays a critical role.
In this paper, using publicly available data, a strong connection is made between housing affordability and food insecurity. Today, housing affordability is receiving a lot of attention, but the housing affordability crisis is an issue that has widespread budgetary implications for families.
While there are patterns that emerge in the data of where these families are more likely to be located, the authors note that food insecurity is a widespread issue and occurs in every state, and in nearly all communities.
Introduction
1 Deener, Andrew. The Origins of the Food Desert: Urban Inequalityas Infrastructural Exclusion. Social Forces 95(3) 1285–1309, March 2017. 2 Eisenhaurer, Elizabeth. In poor health: Supermarket redlining and urban nutrition. GeoJournal 53: 125–133, 2001.3 Lee, Che Young; Zhao, Xue; Reesor-Oyer, Layton; Cepni, Aliye. Bidirectional Relationship Between Food Insecurity and Housing Instability. Journal of the Academy of Nutrition and Dietetics. 121: 84-91, 2021.
4
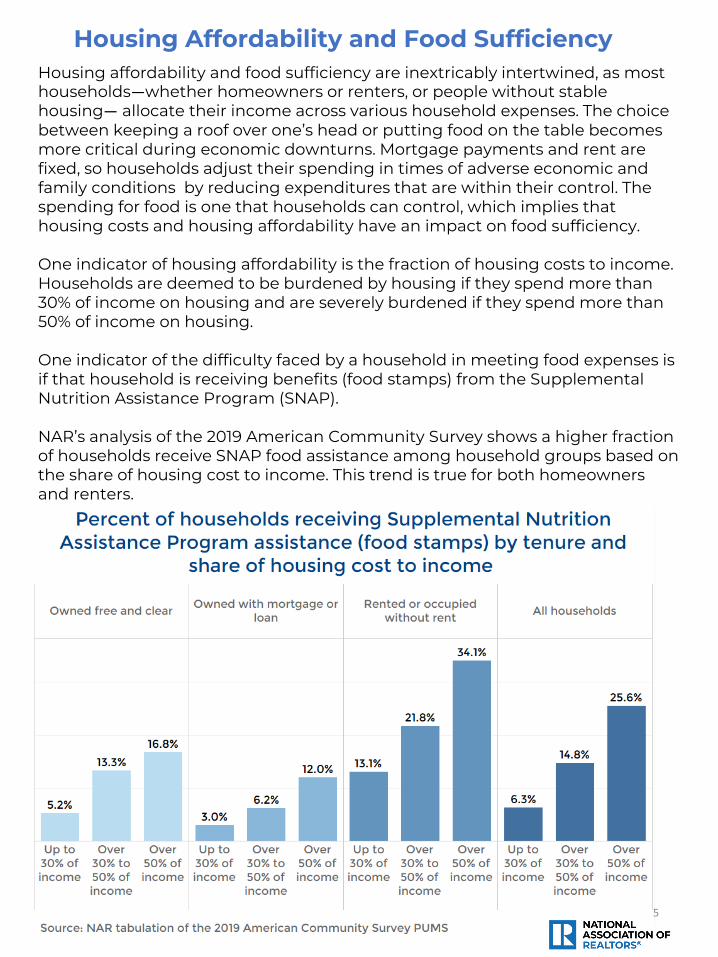
Housing affordability and food sufficiency are inextricably intertwined, as most households―whether homeowners or renters, or people without stable housing― allocate their income across various household expenses. The choice between keeping a roof over one’s head or putting food on the table becomes more critical during economic downturns. Mortgage payments and rent are fixed, so households adjust their spending in times of adverse economic and family conditions by reducing expenditures that are within their control. The spending for food is one that households can control, which implies that housing costs and housing affordability have an impact on food sufficiency.
One indicator of housing affordability is the fraction of housing costs to income. Households are deemed to be burdened by housing if they spend more than 30% of income on housing and are severely burdened if they spend more than 50% of income on housing.
One indicator of the difficulty faced by a household in meeting food expenses is if that household is receiving benefits (food stamps) from the Supplemental Nutrition Assistance Program (SNAP).
NAR’s analysis of the 2019 American Community Survey shows a higher fraction of households receive SNAP food assistance among household groups based on the share of housing cost to income. This trend is true for both homeowners and renters.
Housing Affordability and Food Sufficiency
5

In 2019, there were 13.2 million households that received food stamps, or 10.7% of households. Among households whose housing costs were no more than 30% of income, 6.3% received a food stamps. The fraction of households receiving food stamps rises to 14.8% among households who spent over 30% to 50% of income on housing costs, and the fraction of households rises further to 25.6% among households who spent over 50% of income on housing costs.
Among homeowners who have a mortgage or a loan, 6% of households (494,841) received a food stamp if they were spending over 30% to 50% of household income on housing costs. The share of households receiving food stamp rises to 12% (597,915) among households spending over 50% of income on housing.
Renters are more vulnerable to having inadequate food to eat, and a higher fraction of renters receive food stamps. Among renter households that spent over 30% to 50% of their incomes on rent, 21.8% (2.2 million) received food stamps. The share of households receiving food stamps rises to 34.1% (3.3 million) among households where rent accounts for more than 50% of income.
Whether households own or rent, the cost of housing has a critical impact on their ability to have enough food on the table. Households that are burdened by housing costs need assistance in the way of income supplements or having access to free groceries or meals to help defray food expenses. This is particularly important, during the loss of employment due to economic or family conditions (e.g., health, divorce, death, added caregiving responsibilities).
6

Food Sufficiency Indicators During the COVID-19 Pandemic
The COVID-19 pandemic that resulted in a loss of jobs and reduced wages has increased the difficulty for millions of households to keep their homes and apartments and to put enough food on the table.
As of the week of June 23—July 5, 2021, 35.1 million households reported that it was difficult for them to pay their usual households expenses (food, rent, car payment, medical expenses, student loans, utility costs, etc.), that is, 7% of homeowning and renter households, according to NAR’s analysis of the U.S Census Bureau Household Pulse Survey. By tenure, 23.3 million homeowners (households) reported they had difficulty paying the usual expenses, or 38% of homeowners. While renter households who had difficulty making ends meet comprised the smaller number of 11.8 million, the intensity was higher among renter households at 66%.
There were 10.4 million households who reported it was “very difficult” to pay the usual household expenses, or 7% of owner and renter households, broken down into 4.3 million homeowners and 6.1 million renter households. About 1 in 5 renter households could not make ends meet.
7

Millions of struggling homeowners or renters have to make the difficult choice between paying rent or buying food. As of July 5, there were 6.6 million households who were not current on their mortgage payment or rent, of which there were 2.7 million homeowners and 3.9 million renter households. To date, these households have taken advantage of the forbearance extended by lenders and the moratorium on evictions. However, with the eviction moratorium and forbearance period set to expire on July 31, 2021 (as of this report), these homeowners and renters will need to begin paying mortgage or rent as well as missed previous payments.
Consequently, in the months to come, homeowner households will be faced with the dire trade-off between making timely mortgage payments to keep their home or cutting back on food expenditures.
As of July 5, there were 8.1 million households who did not have enough food to eat “sometimes” or “often,” or about one in 10 households. Of this, 3.1 million were homeowners and 5 million were renters. Nearly one in five renters did not have enough food to eat sometimes or often.
Households with children under 18 face a higher problem of food insufficiency because they can’t afford to buy enough food. There are 4 million households with children under 18 who don’t have enough food because they “can’t afford to have enough food.”
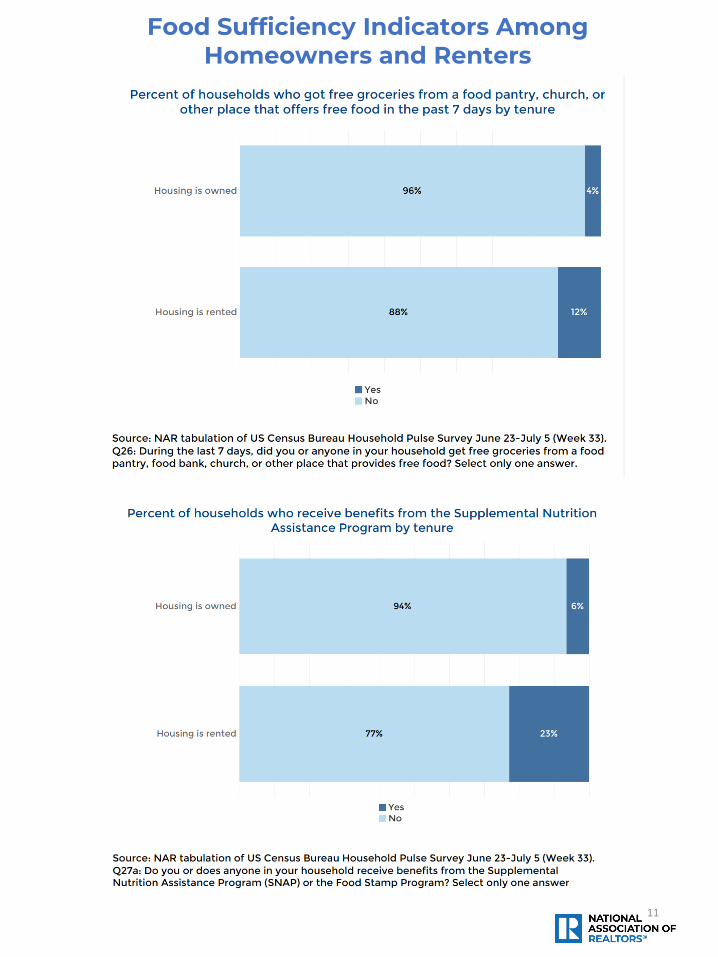
There were 5.9 million households who received free groceries from food pantries, churches, or other places that offered free food, or 7% of households. Both homeowner and renter households got free groceries, with 12% of renters receiving free groceries.
An important program that supplements the food budget of needy households is the SNAP. As of July 5, 10 million households received SNAP benefits, or 11% of households. There were 6 million renter households who received SNAP, nearly one in five renter households. Nearly 4 million homeowner households received SNAP benefits, or nearly one in twenty households.4
https://www.foodrecoverynetwork.org/https://unsplash.com/@jmuniz
https://unsplash.com/@franki
4 The Household Pulse Survey tabulations exclude respondents who did not answer the question (code -99), which gives a lower estimate of the number of households who received SNAP compared to the 2019 American Community Survey where 13.2 million households receive food stamps. However, both the Household Pulse Survey and the American Community Survey yield about the same share of households receiving food stamps, which is 11%.
8

Food Sufficiency Indicators Among Homeowners and Renters
9

Food Sufficiency Indicators Among Homeowners and Renters
10
Food Sufficiency Indicators Among Homeowners and Renters
11

In many states, households are struggling to pay the rent or mortgage and to put food on the table. As shown in the scatterplot, there is a positive correlation between the fraction of households who are not caught up on rent or mortgage and the fraction of households who don’t have enough to eat. This means that households in several states are struggling to both keep the roof over their head and to put food on the table.
The states where households are struggling in trying to pay their rent/mortgage and having enough food are in the upper right part of the scatterplot: Louisiana, South Carolina, and Georgia.
The states with the highest fraction of households who don’t have enough food are mostly located in the southern part of the United States: Louisiana (19%), South Carolina (15%), Arkansas (14%), New Mexico (14%), Oklahoma (14%), Alabama (13%), Kentucky (13%), Georgia (12%), Tennessee (12%), and Ohio (12%).
https://www.foodrecoverynetwork.org/https://unsplash.com/@jmuniz
https://unsplash.com/@franki
Households Struggling to Pay Rent or Mortgage and Food Sufficiency at the State Level
12

Struggling households are making use of SNAP and free groceries to supplement their income or put food on the table. The scatterplot below shows the positive association between the share of households who are not caught up on rent or mortgage and the fraction of households who obtain SNAP benefits to supplement their food budget. The states with the highest share of households who were struggling to pay mortgage or rent and that obtained SNAP benefits to supplement their food budgets were Louisiana and West Virginia. States like Mississippi and Maryland also have a high share of struggling renters or homeowners but the fraction of households receiving SNAP is relatively modest compared to Louisiana.
In the case of New York, one reason could be that households are able to have access to a lot of free groceries, as seen on the next chart.
https://www.foodrecoverynetwork.org/https://unsplash.com/@jmuniz
https://unsplash.com/@franki
13
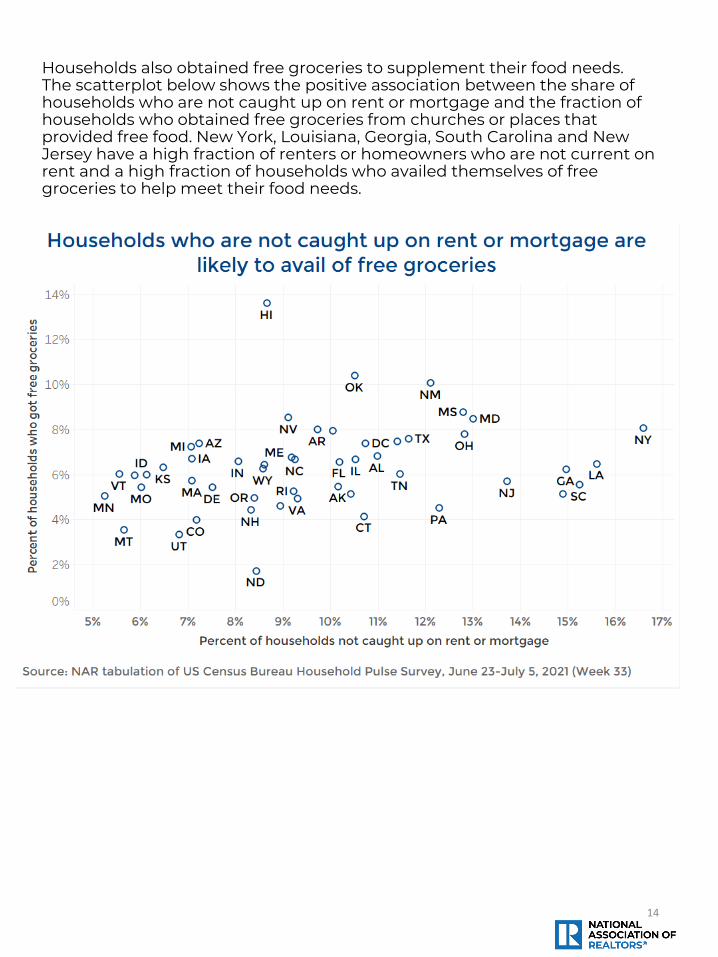
Households also obtained free groceries to supplement their food needs. The scatterplot below shows the positive association between the share of households who are not caught up on rent or mortgage and the fraction of households who obtained free groceries from churches or places that provided free food. New York, Louisiana, Georgia, South Carolina and New Jersey have a high fraction of renters or homeowners who are not current on rent and a high fraction of households who availed themselves of free groceries to help meet their food needs.
https://www.foodrecoverynetwork.org/https://unsplash.com/@jmuniz
https://unsplash.com/@franki
14

15

16

17

18

In many states, rents are rising faster than wages, making it more challenging for renters to pay rent and put food on the table. In 45 states and in the District of Columbia, house prices rose faster on a year-over-year basis (as of first quarter of 2021) compared to the growth in the average weekly wages as of June 2021.
Rising home prices not only impact the ability of buyers to enter homeownership, but it also often means higher taxes which further erodes a household’s budget. This can put families at the edge of affordability, and more at risk for food insecurity.
https://www.foodrecoverynetwork.org/https://unsplash.com/@jmuniz
https://unsplash.com/@franki
Home Prices and Rent Growth Outpace Wage Growth
19

In 42 states and in the District of Columbia, rents for 2-bedroom apartments rose faster on a year-over-year basis as of June 2021 compared to the growth in the average weekly wages over the same period. Indications are rents are continuing to rise and this pressure will put added stress on families to find an affordable rental unit and have enough funds to meet other household needs.
https://www.foodrecoverynetwork.org/https://unsplash.com/@jmuniz
https://unsplash.com/@franki
20

The issue of food insecurity is an important issue and one that is intertwined with stable housing. The welfare of the community is a topic with which REALTORS® are very familiar. NAR members volunteer at three times the rate of the typical American—the 2020 CARE: Community Aid and Real Estate report found 67% of REALTORS® volunteer in their community, while 23% of Americans volunteer according to the American Community Survey. During COVID-19, food security was a top concern for members. Among those who donated, 36% gave to food banks, 20% gave to food delivery for elderly/housebound individuals, 16% gave to food delivery for frontline workers, and 16% gave to school meals for children. Among those who volunteered, 20% gave their time to provide food delivery for elderly/housebound, 11% at food banks, and 6% volunteered providing food delivery for frontline workers, and 16% volunteered providing school meals for children.
What Are REALTORS® and NAR Doing to Combat the Issue
Source: 2020 CARE: Community Aid and Real Estate
21

In June of 2021, the National Association of REALTORS® also partnered with the Food Recovery Network, a national nonprofit fighting food waste and hunger. The partnership ensures events are Food Recovery Verified to recover food from events and connect it with those in need. For more on NAR’s partnership with the Food Recovery Network, read more https://www.nar.realtor/nar-food-recovery-network-frn-partnership-faq
What Are REALTORS® and NAR Doing to Combat the Issue
22

The National Association of REALTORS® is America’s largest trade association, representing more than 1.4 million members, including NAR’s institutes, societies and councils, involved in all aspects of the real estate industry. NAR membership includes brokers, salespeople, property managers, appraisers, counselors and others engaged in both residential and commercial real estate. The term REALTOR® is a registered collective membership mark that identifies a real estate professional who is a member of the National Association of REALTORS® and subscribes to its strict Code of Ethics. Working for America's property owners, the National Association provides a facility for professional development, research and exchange of information among its members and to the public and government for the purpose of preserving the free enterprise system and the right to own real property.
NATIONAL ASSOCIATION OF REALTORS® RESEARCH GROUP
The Mission of the NATIONAL ASSOCIATION OF REALTORS® Research Group is to produce timely, data driven market analysis and authoritative business intelligence to serve members, and inform consumers, policymakers and the media in a professional and accessible manner.
To find out about other products from NAR’s Research Group, visit www.nar.realtor/research-and-statistics.
NATIONAL ASSOCIATION OF REALTORS® RESEARCH GROUP500 New Jersey Avenue, NWWashington, DC 20001202.383.1000
23


